chapter - oxybutynin - information and...
TRANSCRIPT
CCCHHHAAAPPPTTTEEERRR ---333
OOOXXXYYYBBBUUUTTTYYYNNNIIINNN

Chapter 3 Oxybutynin Page 49
3.1. DRUG PROFILE
OXYBUTYNIN
Oxybutynin is an anticholinergic and antispasmodic agent used to relieve
bladder and urinary difficulties, consist of difficult to control urination and
frequent urination, by decreasing muscle spasms of the bladder and urinary tract [38]. It is also used in treatment of excessive sweating condition known as
hyperhidrosis [39-41].
Figure 3.A Structure of Oxybutynin
Oxybutynin chloride is administered as a racemate of R- and S-
enantiomers. It competitively antagonizes the muscarinic acetylcholine receptors
including the subtypes M1, M2, and M3. It has a direct effect which is spasmolytic
in nature on the smooth muscles of urinary bladder by acting as local anesthetic
and calcium antagonist, but at doses far higher than those used therapeutically.
Oxybutynin contains one stereocenter. Among the recemate of two
enantiomers R and S enantiomers, R enantiomer is considered to have more
potent anticholinergic effect when compared to S enantiomer, which does not
have anticholinergic activity at the dose levels used regularly[42,43]. Dry mouth,
difficulty breathing, swelling of face, lips, tongue, or throat difficulty, dizziness,
urination, blurred vision, constipation, and drowsiness are the common adverse
effects associated with Oxybutynin [44]

Chapter 3 Oxybutynin Page 50
Physicochemical Properties: Oxybutynin chloride is a white crystalline solid,
readily soluble in water and acids, but relatively insoluble in alkalis. The list of
brand names of Oxybutynin are listed in the Table 3.1
Table 3.1: List of Brand Names of Oxybutynin
S. No. Brand Name FormulationAvailable
Strength (mg) Manufacturer
1 OXYSPAS Tablet 2.5 & 5.0 Cipla
2 TROPAN Tablet 2.5 & 5.0 Sunpharma
3 DITROPAN XL Tablet 5.0,10.0 & 15 NDC
3.2 LITERATURE SURVEY
Many analytical methods are published for the determination of Oxybutynin in
pure drug, pharmaceutical dosage forms and in biological samples by using analytical
methods such as Spectrophotometry, High Pressure Liquid Chromatography and Mass
Spectrometry either in single or in combined forms.
Q. Wen et al [45] have developed a method for HPLC-MS determination of
Oxybutynin in plasma and tissue of rats. Blood, bladder and liver samples were
collected and assayed by LC-MS. A ZORBAX extend-C18 column was used to
separate Oxybutynin in plasma and tissue with a mobile phase of a mixture of
Acetonitrile: 0.1% - pH 5.4 acetic acid buffer (50: 50) at a flow rate of 0.5 mL min–1..
It is suitable for pharmacokinetic studies of Oxybutynin gel.
Alaa El-Gindy et al [46] have developed a method for HPLC determination of
Oxybutynin hydrochloride and their degradation products. The proposed method was
based on HPLC separation of Oxybutynin from its degradation product using a VP-
ODS C18 column with a mobile phase consisting of Acetonitrile: 0.01 M Potassium
Dihydrogen Phosphate: Diethylamine (60:40:0.2). Quantitation was achieved with
UV detection at 220 nm based on peak area.
Renato Massoud et al [47] have been developed a method for extraction and
determination of Oxybutynin in human bladder samples by RP-HPLC.
Chromatographic separation was performed with a mobile phase of Acetonitrile:
Chapter 3 Oxybutynin Page 51
Water: 1 M Ammonium Acetate (85:13:2, v/v/v) and double (electrochemical and
UV) detection was applied. The retention time of Oxybutynin eluting peak was
around 18 min. The method was applied to compare the Oxybutynin levels into
bladder wall tissue samples after passive diffusion by electromotive drug
administration (EMDA).
K. Srikanth et al [48] have described a method for spectrophotometric
determination of Oxybutynin chloride using UV-Visible Spectrophotometer by
forming ion-association complex with acidic dyes TPOOO or ARS showing
absorption maximum at 480 nm and 430 nm respectively.
3.2.1 MOTIVATION FOR THE METHOD DEVELOPMENT
The primary purpose of this research project was to develop and to validate a
simple HPLC method for determination of Oxybutynin in the APIs, finished product
and its applicability in the estimation of drug in human plasma. Oxybutynin is an
anticholinergic and antispasmodic agent used to relieve bladder and urinary
difficulties as smooth muscle relaxant. Clearly, it is highly important to accurately
measure its concentration alone or in combination with other compounds. A high
speed method was sought to measure the concentration of this compound within a
short span of time. This is beneficial in any pharmaceutical analysis/clinical
environment where the concentration of Oxybutynin is needed to understand any
patient issues along with the pharmaceutical industry to design the multiple steps that
may be needed to prepare the APIs for production. The high speed method will
eliminate/reduce any waste or costs that are required with the preparation of the APIs.
There are no analytical methods that have been reported for the determination
of Oxybutynin in API and one method was reported in formulations at the time of
commencement of research work. Q. Wen et al have developed a HPLC-MS method
for the estimation of Oxybutynin in plasma and tissue of rats and they have used
ZORBAX extend-C18 column to separate Oxybutynin from plasma and tissue, the
column is comparatively expensive with the column that have been used in the current
method, moreover this method is limited only for the analysis of animal samples. Alaa
El-Gindy et al have developed a method meant for only pKa studies using rarely
available buffer solutions and columns. Renato Massoud et al have developed a

Chapter 3 Oxybutynin Page 52
method using electromotive drug administration in rats and this method is limited
only for analysis of samples from tissue of a rat and electromotive drug administration
device is developed in their own laboratory. These methods report mainly on the
determination of Oxybutynin in plasma/ blood samples and in human bladder
samples. Such methods may not be suitable for regular/routine analysis for
Oxybutynin in pharmaceutical industry because of diversity and complexity in sample
matrix. K Srikanth et al have developed spectrophotometric method for the estimation
of Oxybutynin and spectrophotometric methods are inferior to the HPLC methods and
have limited usage in pharmaceutical industry. The spectrophotometric method is
reported for the estimation of Oxybutynin in tablet dosage form by using the acidic
dyes which may cause chemical interference with metal ions and causes precipitation
may effect the quantification of the drug. Analytical methods based on UV-Visible
Spectrophotometry have major disadvantage that they are time consuming,
cumbersome and laborious. At the same time such methods require more quantity of
active pharmaceutical ingredients, i.e., they are not much sensitive at microgram
level. Also they are not suitable for regular/routine analysis in pharmaceutical
industry where sample size is more.
The determination of Oxybutynin in APIs sample is yet to be found. In
addition, stability-indicating methods are not found for Oxybutynin formulations in
fixed dosage forms. Complete validation parameters were not found in any of the
methods completed in the past.
Hence, by considering all these factors, attempts were made hoping to fill this
gap and succeeded in developing analytical method using HPLC with UV detection.
3.3. EXPERIMENTAL
3.3.1. Instrumentation
Shimadzu VP series HPLC instrument on an Inertsil C18 column (250 mm x
4.6 mm, 5μm) are used to develop the quantitative estimation of Oxybutynin. The
instrument is equipped with a LC 20AT pump and variable wavelength programmable
UV-Visible detector SPD-10AVP. A 20μL Hamilton syringe, Elico SL159 UV-

Chapter 3 Oxybutynin Page 53
Visible spectrophotometer, Loba ultrasonic bath sonicator and Denwar weighing
balance are used.
3.3.2. Chemicals and Solvents
The reference sample of Oxybutynin (API) obtained from Sun Pharma,
Ahmedabad. The formulation procured from the local market. HPLC grade of
Acetonitrile, Methanol and Water purchased from Merck Specialities Private Limited,
Mumbai, India. Orthophosphoric acid AR grade is purchased from Qualigens.
3.3.3. The Buffer Solution
10mL of Orthophosphoric acid was diluted to 1000 mL with Water to obtain
1% ortho phosphoric acid solution.
3.3.4. The Mobile Phase
A mixture of Methanol: Acetonitrile: 1% Orthophosphoric acid in the ratio of
15:45:40%, v/v/v was prepared and used as mobile phase. The resultant solution was
filtered through 0.45μm filter.
3.3.5. Standard Solution of the Drug
100 ppm standard solution was prepared for analysis in mobile phase, further
required concentrations were obtained from 100 ppm solution by proper dilution
using mobile phase.
3.3.6. Sample Solution
The tablets of Oxybutynin (OXYSPAS – 5mg) were crushed to give fine
powder. 8ppm solution in mobile phase was prepared from the finely crushed tablet
powder and then filtered through Ultrapore membrane sample filter paper.
3.3.7 Calculations in Validation Studies
Percentage recovery and area ratio were calculated using the following equation:
% Recovery = ([Peak Area] sample / [Peak Area] standard) × 100

Chapter 3 Oxybutynin Page 54
For a set of “n” replicate measurements, percentage relative standard deviation
was calculated as follow: % RSD=SD/Average × 100
The detector sensitivity was determined by calculating the signal to noise ratio using
the following equation: Sensitivity = S/N = Signal/ Noise
Signal = Amount of detector response to the peak from the middle of
the noise to the summit of the peak.
Noise = Amount of noise resulting from the detector that is taken from
a portion of the baseline without any distortions.
3.4 METHOD DEVELOPMENT
The goal of this research was to develop a reversed-phase HPLC method that
can be used to determine the active pharmaceutical ingredient in Oxybutynin APIs
with an adequate resolution and in a minimum analysis time. The intention was to
separate the degradants (if any) and process impurities (if present) from the active
ingredient. To begin method development, important structural information such as
chemical structure, molecular weight, UV spectrum and sample solubility were
reviewed.
Method development [12] consists of selecting the appropriate wave length,
stationary and mobile phases. The following studies were conducted for this purpose.
Systematic studies on various conditions or factors have been done for developing a
method by studying each parameter and keeping all other parameters in constant.
3.4.1. Wavelength Detection
The proper wavelength was needed to determine maximum detector response.
The first step was to run a UV-VIS spectrum (from 190-400 nm) using an HPLC
system equipped with the Photo Diode Array Detector, from the spectrum it is clear
that Oxybutynin absorbs maximum light between 200 nm to 210 nm. The longer
wavelength of 205 nm was selected since it produces less noise, which minimizes
problems that may exhibit around the active ingredient when attempting to quantify
Oxybutynin.
Chapter 3 Oxybutynin Page 55
The UV absorption spectrum of diluted solution of the Oxybutynin in
Methanol (at 8ppm) was recorded on a UV spectrophotometer. The spectrum of
Oxybutynin showed absorption maximum at 205 nm, which is selected as detection
wave length.
3.4.2 Selection of Stationary Phase
An aged HPLC column should be used to develop the initial HPLC conditions.
Usually it is more difficult to achieve the required resolution with an aged column
(e.g., column with about 200 injections). This will reflect the worst case scenario
likely to be encountered in actual method uses, and help the long-term method
robustness. In general, all methods developed by HPLC columns were for the same
vendor. The preferred brand of HPLC column should be selected primarily based on
the long term stability and lot-to-lot reproducibility.
Preliminary development trials have performed on Inertsil and Chromosil C18
(250 X 4.6mm, 5µm) columns. Peak tailing factor was found to be low on Inertsil
column compared to the Chromosil column and also less retention time was observed
in Inertsil column without any interferences in formulation samples. Based on which
Inertsil C18 (250 mm x 4.6 mm, 5μm), column was selected as stationary phase.
3.4.3 Selection of the Mobile Phase
The solubility of Oxybutynin was studied in order to determine the proper
ratio of solvents to use as mobile phase to the drug substance for analysis. Referring
to chemical structure, the compound is a base due to the presence of tertiary amine
group and is able to accept proton(s), therefore polarity of the dissolved solvent will
affect the solubility. Different ratios of Methanol and Acetonitrile were tested with 2
minutes vortexing. 50 mg of Oxybutynin reference standard was dissolved in water
and tested, Oxybutynin appears to dissolve completely resulting in a clear solution.
On the other hand, when 100% Acetonitrile was used, the compound dissolved
instantly. Furthermore, when a ratio of 1:1 Water: Acetonitrile was used, the
compound did not dissolve with low viscosity in resultant solution.
In order to get sharp peak and base line separation of the components, carried
out a number of experiments by varying the composition of solvents in mobile phase

Chapter 3 Oxybutynin Page 56
and its flow rate. To have an ideal separation of the drug under isocratic conditions,
mixtures of solvents like Methanol, Water and Acetonitrile with or without different
buffers in different combinations were tested as mobile phase. The pH of the mobile
phase will greatly affect its retention time as it interacts with the stationary phase. To
start off, the pH of the mobile phase, which consisted of Orthophosphoric acid, was
adjusted to 2.5. The reason for starting with low pH is to protonate all free silanol
groups in the stationary phase and reduce their chromatographic activities. In
practical, this should avoid any secondary interactions and also reduce tailing. Also, a
mobile phase at pH of 6.5 is a good starting point for most pharmaceutical
applications because it suppresses the ionization of most acidic analytes resulting in
their higher retention.
A mixture of Methanol: Acetonitrile: 1% Ortho phosphoric acid in the ratio of
15:45:40%, v/v/v with pH-6.5 of the mobile phase was proved to be the most suitable
of all combinations, with better a defined and well resolved peak, free from tailing
and also producing zero noise in blank chromatogram.
3.4.4. Flow Rate
Flow rate of the mobile phase was varied from 0.5 – 1.5 mL/min for optimum
separation. A minimum flow rate as well as minimum run time gives the maximum
saving on the usage of solvents. It was found from the experiments that 1.0 mL/min
flow rate was ideal for the successful elution of the analyte.
3.4.5. Optimized Chromatographic Conditions
Chromatographic conditions as optimized above are shown in Table 3.2.
These optimized conditions were followed for the determination of Oxybutynin in
APIs samples, tablet formulations and plasma samples. The chromatograms of
standard, blank, tablet sample, plasma blank and plasma samples are shown in Graph
3.A, 3.B, 3.C, 3.D and 3.E respectively.
Chapter 3 Oxybutynin Page 57
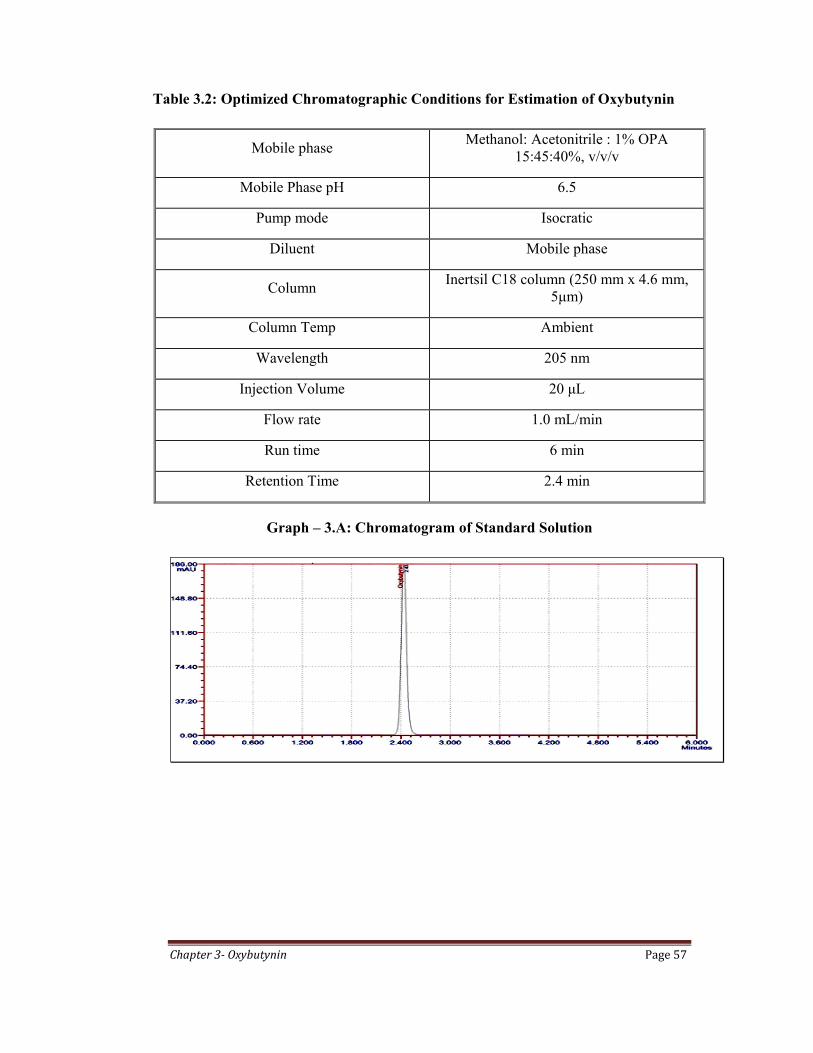
Table 3.2: Optimized Chromatographic Conditions for Estimation of Oxybutynin
Mobile phase Methanol: Acetonitrile : 1% OPA
15:45:40%, v/v/v
Mobile Phase pH 6.5
Pump mode Isocratic
Diluent Mobile phase
Column Inertsil C18 column (250 mm x 4.6 mm,
5μm)
Column Temp Ambient
Wavelength 205 nm
Injection Volume 20 μL
Flow rate 1.0 mL/min
Run time 6 min
Retention Time 2.4 min
Graph – 3.A: Chromatogram of Standard Solution

Chapter 3 Oxybutynin Page 58
Graph - 3.B: Chromatogram of Blank Solution
Graph - 3.C: Chromatogram of Sample Solution
Graph - 3.D: Chromatogram of Plasma Sample Blank

Chapter 3 Oxybutynin Page 59
Graph 3.E: Chromatogram of Plasma Sample Solution HPLC Report
3.5 VALIDATION OF THE PROPOSED METHOD
After the method was developed, various validation studies were conducted in
a systematic way to determine reliability of the developed method. In other words,
the developed method is suitable for its intended use. Validation parameters studied,
as required by the Food and Drug Administration (FDA) and International Conference
on Harmonization (ICH). The proposed method was validated [17-32] as per ICH
guidelines. The parameters studied for validation were specificity, linearity, precision,
accuracy, robustness, system suitability, limit of detection, limit of quantification and
solution stability.
3.5.1. Specificity
Specificity of the developed method was tested to determine its ability to
measure accurately concentration of Oxybutynin in the presence of potential
degradation products.
Acceptance Criteria:
1. No interferences of the peak of interest in the control or the degraded sample
from the potential degradation products. In other words, the minimum resolution
between Oxybutynin HCl peak and the nearest eluting peak should be NLT 1.5.
2. Peak purity of Oxybutynin active ingredient should be NLT 0.990.
Chapter 3 Oxybutynin Page 60
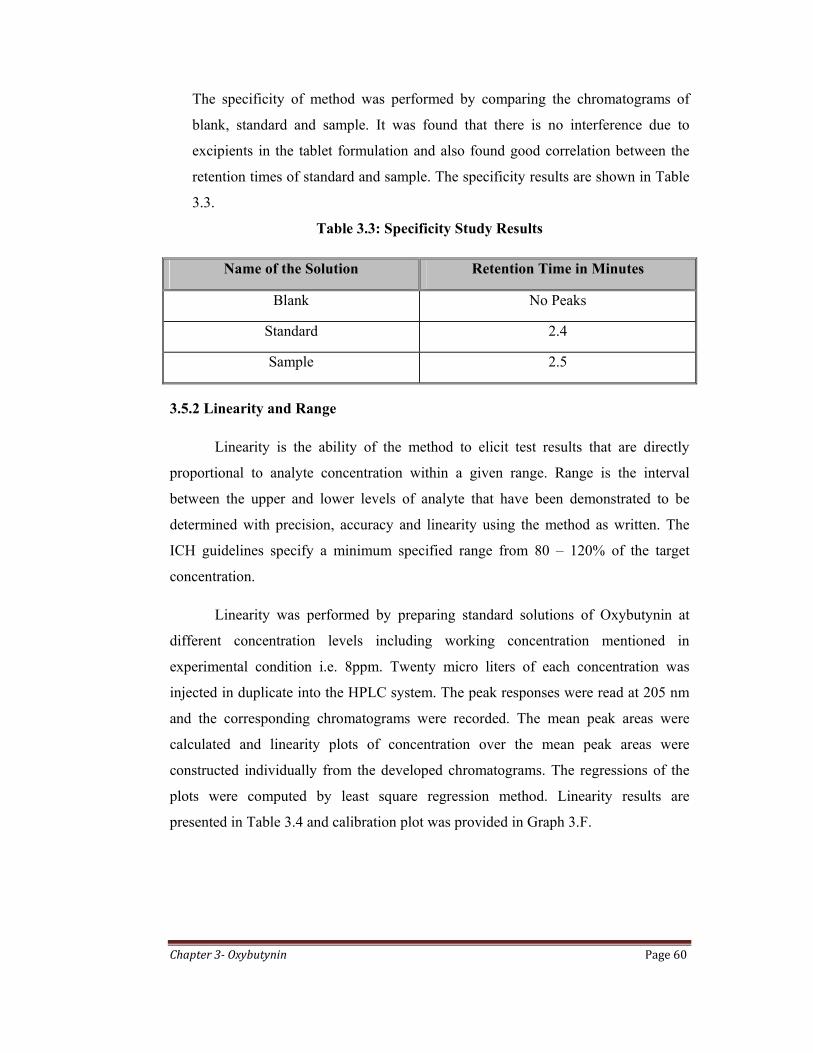
The specificity of method was performed by comparing the chromatograms of
blank, standard and sample. It was found that there is no interference due to
excipients in the tablet formulation and also found good correlation between the
retention times of standard and sample. The specificity results are shown in Table
3.3.
Table 3.3: Specificity Study Results
Name of the Solution Retention Time in Minutes
Blank No Peaks
Standard 2.4
Sample 2.5
3.5.2 Linearity and Range
Linearity is the ability of the method to elicit test results that are directly
proportional to analyte concentration within a given range. Range is the interval
between the upper and lower levels of analyte that have been demonstrated to be
determined with precision, accuracy and linearity using the method as written. The
ICH guidelines specify a minimum specified range from 80 – 120% of the target
concentration.
Linearity was performed by preparing standard solutions of Oxybutynin at
different concentration levels including working concentration mentioned in
experimental condition i.e. 8ppm. Twenty micro liters of each concentration was
injected in duplicate into the HPLC system. The peak responses were read at 205 nm
and the corresponding chromatograms were recorded. The mean peak areas were
calculated and linearity plots of concentration over the mean peak areas were
constructed individually from the developed chromatograms. The regressions of the
plots were computed by least square regression method. Linearity results are
presented in Table 3.4 and calibration plot was provided in Graph 3.F.
Chapter 3 Oxybutynin Page 61
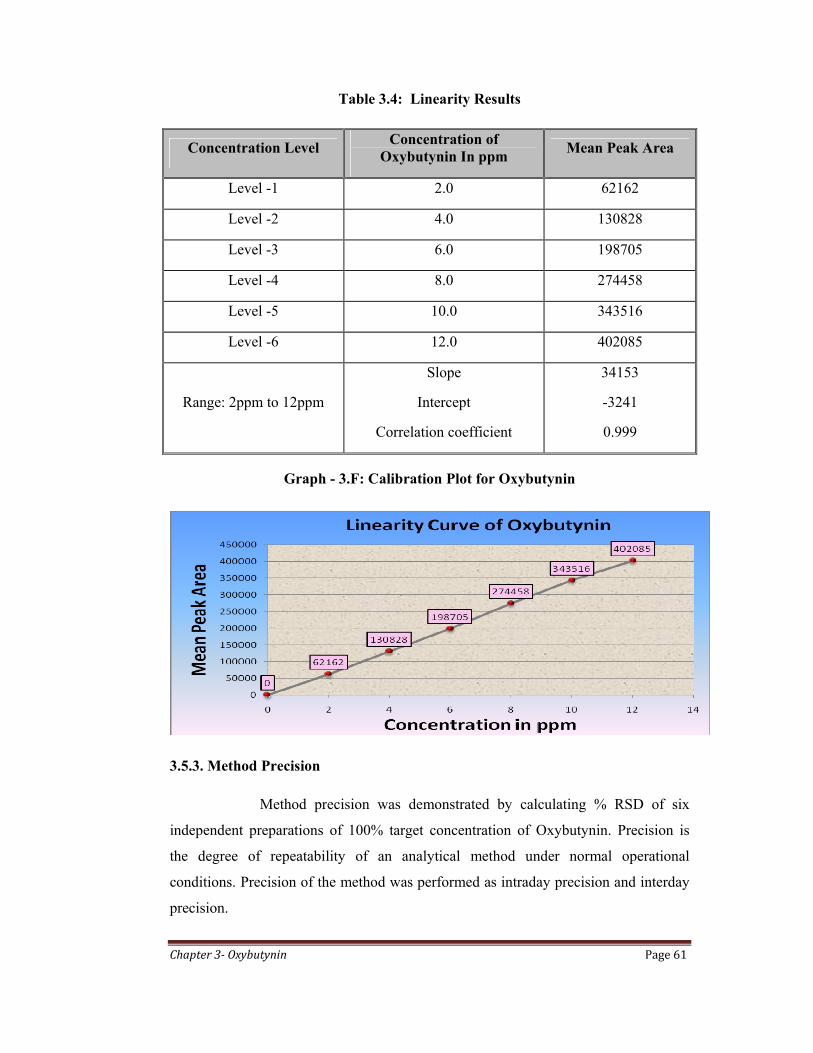
Table 3.4: Linearity Results
Concentration Level Concentration of
Oxybutynin In ppm Mean Peak Area
Level -1 2.0 62162
Level -2 4.0 130828
Level -3 6.0 198705
Level -4 8.0 274458
Level -5 10.0 343516
Level -6 12.0 402085
Range: 2ppm to 12ppm
Slope
Intercept
Correlation coefficient
34153
-3241
0.999
Graph - 3.F: Calibration Plot for Oxybutynin
3.5.3. Method Precision
Method precision was demonstrated by calculating % RSD of six
independent preparations of 100% target concentration of Oxybutynin. Precision is
the degree of repeatability of an analytical method under normal operational
conditions. Precision of the method was performed as intraday precision and interday
precision.

Chapter 3 Oxybutynin Page 62
Acceptance Criteria: The % RSD of NMT 1.5% is recommended for Reference
Standard
3.5.3.1. Intraday Precision: To study the intraday precision, six replicate standard
solutions (8ppm) of Oxybutynin were prepared and injected using the set
chromatographic conditions. The percent relative standard deviation (% RSD) was
calculated and it was found to be 1.8%, which is well within the acceptance criteria of
not more than 2.0%. Results of intraday system precision studies are shown in Table
3.5.
Table 3.5: Intraday Precision Results for Oxybutynin
Sample Concentration.
(ppm) Injection
No. Peak Areas
RSD (Acceptance
criteria ≤ 2.0%)
Oxybutynin 8
1 270260
1.8
2 278671
3 269119
4 272053
5 279117
6 268246
3.5.3.2. Interday Precision: To study the interday precision, six replicates of
standard solutions (8ppm) of Oxybutynin were injected on third day of sample
preparation. The percent relative standard deviation (% RSD) was calculated for peak
responses and it was found to be 1.7%, which is well within the acceptance criteria of
not more than 2.0%. Results of system precision studies are shown in Table 3.6.

Chapter 3 Oxybutynin Page 63
Table 3.6: Interday Precision Results for Oxybutynin
Sample Concentration
(ppm) Injection No. Peak Areas
RSD (Acceptance criteria ≤ 2.0%)
Oxybutynin 8
1 271584
1.7
2 276218
3 281095
4 270764
5 269287
6 269546
3.5.4 Accuracy
The accuracy of the developed method was tested to determine closeness of
the measured value to the true value. Accuracy of the developed method was studied
by evaluating the recovery of Oxybutynin HCl from spike solutions.
The accuracy of the method was determined by standard addition method. A
known amount of standard drug was added to the fixed amount of pre-analyzed tablet
solution. Percent recovery was calculated by comparing the area before and after the
addition of the standard drug. The standard addition method was performed at 50%,
100% and 150% level of 8ppm. The solutions were analyzed in triplicate at each level
as per the proposed method. The percent recovery and % RSD was calculated and
results are presented in Table 3.7. Satisfactory recoveries ranging from 98.3 to 100.5
were obtained by the proposed method. This indicates that the proposed method was
accurate.

Chapter 3 Oxybutynin Page 64
Table 3.7: Accuracy Results
Level Amount of Oxybutynin ( in ppm)
% Recovery %RSD Spiked Recovered
50 %
4 3.94 98.5
1.2 4 3.93 98.3
4 4.02 100.5
100%
8 7.96 99.5
0.6 8 8.01 100.1
8 7.92 99.0
150%
12 11.98 99.8
0.4 12 11.95 99.6
12 11.89 99.1
Mean 99.4 0.7
3.5.5 Robustness
Robustness of the developed method was tested by making slight deliberate
changes to the separation parameters, chromatographic conditions of the method.
This study was conducted to determine ability of the developed method to remain
unaffected by these small deliberate changes.
The robustness study was performed by slight modification in flow rate of the
mobile phase, pH of the buffer and composition of the mobile phase. Oxybutynin at
8ppm concentration was analyzed under these changed experimental conditions.
Three replicate injections were performed with each of the altered chromatographic
condition and the mean peak area was compared against the mean peak area obtained
with the unaltered conditions. It was observed that there were no marked changes in
chromatography and the %assay when compared with unaltered conditions was within
± 2%, demonstrating that the developed method was robust in nature. In other words,
integrity of the chromatogram was maintained and appeared no interferences from
other peaks. The results of robustness study are shown in Table 3.8.
Chapter 3 Oxybutynin Page 65
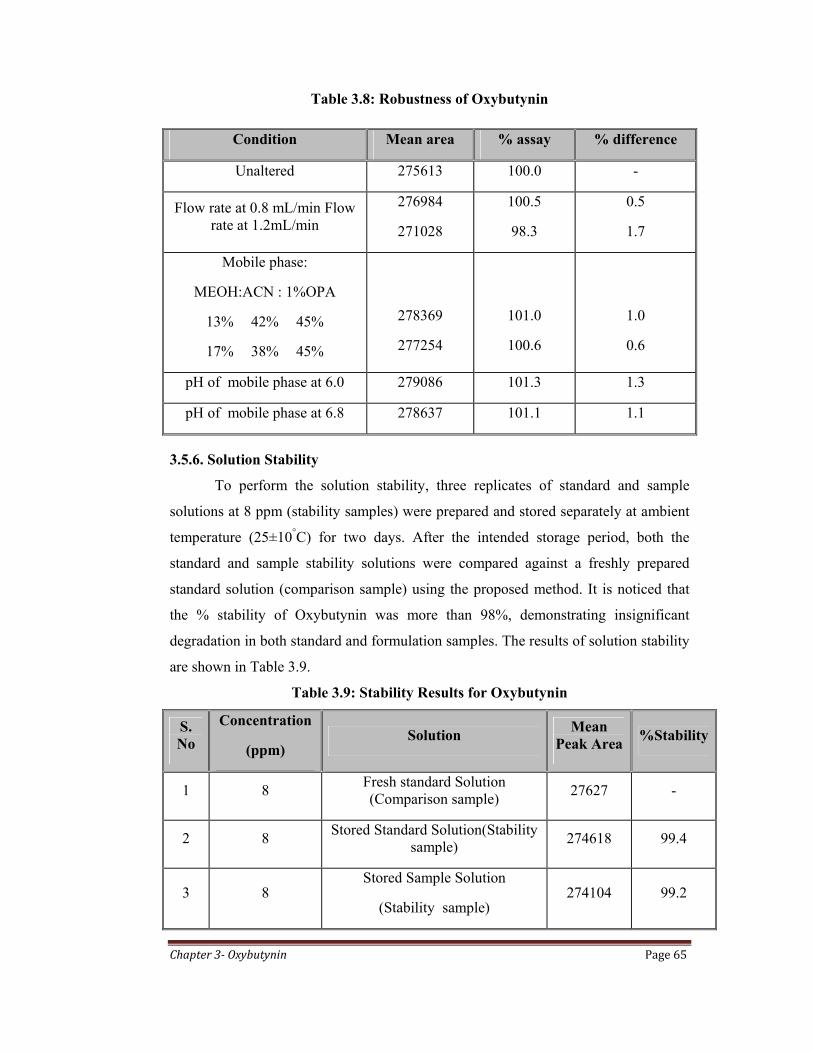
Table 3.8: Robustness of Oxybutynin
Condition Mean area % assay % difference
Unaltered 275613 100.0 -
Flow rate at 0.8 mL/min Flow rate at 1.2mL/min
276984
271028
100.5
98.3
0.5
1.7
Mobile phase:
MEOH:ACN : 1%OPA
13% 42% 45%
17% 38% 45%
278369
277254
101.0
100.6
1.0
0.6
pH of mobile phase at 6.0 279086 101.3 1.3
pH of mobile phase at 6.8 278637 101.1 1.1
3.5.6. Solution Stability
To perform the solution stability, three replicates of standard and sample
solutions at 8 ppm (stability samples) were prepared and stored separately at ambient
temperature (25±10°C) for two days. After the intended storage period, both the
standard and sample stability solutions were compared against a freshly prepared
standard solution (comparison sample) using the proposed method. It is noticed that
the % stability of Oxybutynin was more than 98%, demonstrating insignificant
degradation in both standard and formulation samples. The results of solution stability
are shown in Table 3.9.
Table 3.9: Stability Results for Oxybutynin
S. No
Concentration
(ppm) Solution
Mean Peak Area
%Stability
1 8 Fresh standard Solution (Comparison sample)
27627 -
2 8 Stored Standard Solution(Stability
sample) 274618 99.4
3 8 Stored Sample Solution
(Stability sample) 274104 99.2

Chapter 3 Oxybutynin Page 66
3.5.7. System Suitability Studies
Before performing any validation study, it should be established that the
HPLC system and the developed method are capable of providing data of acceptable
quality. These tests are used to verify that the resolution and repeatability of the
developed method are adequate for the analysis to be performed. System suitability
tests are based on the concepts that the equipment, electronics, analytical operations,
and samples constitute an integral system that can be evaluated as whole parameters
such as plate count, tailing factor, resolution and repeatability (%RSD for retention
times and peak areas) are determined and compared against the specifications set for
the method. Two working standards are prepared for the study of system suitability
System suitability was studied under each validation parameter by injecting
six replicates of the standard solutions at 8ppm concentration. For the method
following limits were considered as acceptance criteria, tailing factor ≤ 2, theoretical
plates > 2000 and %RSD for peak area ≤ 2%. The % drift is also less than 2%. These
results fulfilled the required system suitability acceptance criteria. The results of
system suitability tests are provided in Table 3.10.
Table 3.10: System Suitability Results for Oxybutynin
Parameter Tailing factor Theoretical plates% RSD for peak
response
Specificity study 1.69 4711 1.4
Linearity study 1.16 6813 1.8
Precision study 1.26 7140 1.8
3.5.8. Limit of Detection and Limit of Quantification
To determine the Limit of Detection sample was dissolved by using mobile
phase and injected until peak was disappeared. After 0.1ppm dilution, Peak was not
clearly observed. So it confirms that 0.1ppm is Limit of Detection for Oxybutynin
using the current method and Limit of Quantification is 0.25ppm. For establishing
Limit of Quantification, six replicates of standard at 0.25ppm were prepared and

Chapter 3 Oxybutynin Page 67
quantified with a relative standard deviation of 2.0%. The LOD and LOQ of
Oxybutynin are given in Table 3.11.
Table 3.11: Limit of Detection and Limit of Quantification for Oxybutynin
Parameter Measured volume
Limit of Quantification 0.25ppm
Limit of Detection 0.1ppm
3.5.9 Analysis of Commercial Formulation
For assay of Oxybutynin (OXYSPAS – 5mg), 20 tablets were weighed and
calculated the average tablet weight. Accurately weighed and transferred the
powdered sample equivalent to 10mg of Oxybutynin in to a 10mL volumetric flask.
5mL of mobile phase was added and sonicated to completely dissolve the drug and
final volume was made with the diluent. Mixed well and filtered the solution through
0.45µm filter. Further pipetted out 0.2mL of the above solution into a 25mL
volumetric flask and diluted up to mark with mobile phase to get a final concentration
of 8ppm. An aliquot of this solution was injected into HPLC system. Peak area of
Oxybutynin was measured and compared against the standard response; the proposed
method was able to estimate Oxybutynin with an accuracy of 98.8% in tablet
formulation.
3.5.10 Plasma Sample Analysis
To evaluate the general applicability of the HPLC method, Oxybutynin was
analyzed in different sample matrices. The proposed HPLC procedure was further
tested using spiked human plasma samples. In all cases, no interferences from the
indigenous plasma components were observed. The simplicity of the proposed
extraction procedure and the high extraction efficiency are among the essential
features of the proposed HPLC method, making this method suitable for routine,
efficient and fast extraction of Oxybutynin from complex matrices. The method is
accurate, precise and specific. The described HPLC assay can be easily applied for the
quantification of the degradation products.

Chapter 3 Oxybutynin Page 68
Human fresh frozen plasma containing K2EDTA as anticoagulant was
procured from M/S. Lakshmi sai clinical labs and required concentration of
Oxybutynin spiked samples (in plasma) were prepared using working solutions.
Preparation of Plasma Spiked Samples: Fresh frozen plasma stored at -20°C was
thawed and used for the preparation of Oxybutynin spiked samples. 0.2mL of 400ppm
working solution was pipetted out into a 10mL volumetric flask and further diluted up
to the mark with plasma, to get 8ppm concentration sample. During the preparation of
spiked sample volume of diluent/working solution was kept ≤ 5% of the total plasma
volume, to avoid unnecessary changes in matrix components.
Sample Extraction / Preparation: 0.5mL of plasma spiked sample was taken into a
test tube and added 100µL of 1M NaOH solution and vortexed. Further to the sample,
5mL of Dichloromethane was added and subjected to extraction on a plasma extractor
using 50rpm for 20 min. Later centrifuged the sample for 10min at 3000 rpm,
collected 4mL of the separated organic layer and evaporated to dryness at 50°C. The
residue was reconstituted with 100µL of mobile phase and the sample was injected
into the HPLC system using the proposed chromatographic conditions.
3.6 RESULTS AND DISCUSSIONS
A RP-HPLC method was developed and validated for the determination of
Oxybutynin in APIs and Pharmaceutical dosage forms. The present study is the first
report on assay of Oxybutynin in API. In this method isocratic elution method is
selected for the analysis of Oxybutynin API because it gave better base line separation
and peak width, which is suitable for the routine analysis of Oxybutynin. The
developed method was validated as per ICH guidelines (ICH, 1996) and its updated
international convention (ICH, 2002).
RP-HPLC method was developed for the estimation of Oxybutynin. Literature
survey indicates that, only spectrophotometric method was available, which is based
on ion-association complexes with TPOOO dye, for the estimation of Oxybutynin in
tablet dosage forms. The sensitivity and specificity of spectrophotometric method
currently in use may not be adequate because it is reported that some substances (eg,
some metal ions), which may present in the biological fluid/placebo/ in excipients,
Chapter 3 Oxybutynin Page 69
may cause chemical interference by forming complexes with dye. Therefore, this
method is also criticized because of its low specificity, sensitivity and reproducibility.
Currently developed HPLC method is more sensitive, specific and reproducible in
determination of Oxybutynin. HPLC can be applied without a complex formation and
any other initial process and it is not affected by chemical interference. HPLC method
is always preferred due to its analytical sensitivity when compared to
spectrophotometric method. On the other hand, repeatability of experimental assays is
an important qualification for its safety.
Liquid chromatography method development began with the optimizing
mobile phase composition and column type. The feasibility of several mixtures of
solvent such as Acetonitrile and Methanol using different buffers such as Ammonium
acetate, Ammonium formate, Acetic acid and Formic acid with variable pH range 3–6
was tested for complete chromatographic resolution of Oxybutynin from interfering
tablet matrix. The versatility, suitability and robustness of the method were checked
with several C18 and Cyano (CN) columns.
Different mobile phases were tested to develop precise, accurate and suitable
RP- HPLC method for the estimation of Oxybutynin and the proposed
chromatographic conditions were found to be appropriate for the quantitative
determination. The report obtained by the assay of Oxybutynin standard was
summarized in Fig: 3.A. System suitability tests were carried out with each validation
experiment and the results are summarized in Table 3.10. In all cases, the relative
standard deviation (RSD) for the analytic peak area for two consecutive injections
was < 2.0%.
Chromatograms of blank solution, standard and samples of tablet and plasma
contained no co-eluting peaks of analyte at the respective retention time.
Representative chromatograms of blank plasma, blank fortified with Oxybutynin are
shown in Graph 3.D and Graph 3.F respectively. The retention times of the analyte
shows less variability with a % RSD well within the acceptable limit of ±2%. This
results indicates the proposed method is highly specific and selective in both tablet
and plasma samples.
Standard curves were constructed using six standard concentrations in the
range of 2 to 12ppm for Oxybutynin. The linearity of peak area responses versus
concentrations was demonstrated by linear least square regression analysis. The linear

Chapter 3 Oxybutynin Page 70
regression equation was y = 34153x – 3241 (r2= 0.999). Linearity values were shown
in Table: 3.4. Precision was evaluated by carrying out six independent sample
preparations of standard at 8ppm. Percentage relative standard deviation (%RSD) was
found to be less than 2% for interday (1.8) and intraday (1.7) variations, which proves
that method is precise. Results were shown in Table 3.5 and 3.6 for interday and
intraday precisions respectively.
The precision was defined as the relative standard deviation (RSD) of the
determined concentrations of the same QCs, whereas accuracy was assessed as the
percentage to the nominal concentration (%). To check the degree of accuracy of the
method, recovery studies were performed in triplicate by standard addition method at
50%, 100% and 150%. Known amounts of Oxybutynin standard were added to pre-
analyzed samples and were subjected to the proposed HPLC method. Results of
recovery studies were shown in Table 3.7. The results showed good recoveries
ranging from 98.3 to 100.5 %. The mean recovery data obtained for each level as well
as for all levels combined was 2.0% of the label claim for the active substance with an
R.S.D. < 2.0%, which satisfied the acceptance criteria set for the study.
The sample was dissolved by using mobile phase and injected until peak was
disappeared and there was no dilution peak was observed clearly after 0.1ppm
dilution peak was not clearly observed. So it confirms that 0.1ppm is the Limit of
Detection and the Limit of Quantification is 0.25ppm.To evaluate the robustness of
the developed RP-HPLC method, small deliberate variations in the optimized method
parameters were done. The effect of change in flow rate, pH and mobile phase ratio
on the area, retention time and tailing factor were studied. The method was found to
be unaffected by small changes like ± 0.4 change in pH, ± 0.2 change in flow rate and
± 2 change in mobile phase composition. It was observed that there were no marked
changes in chromatography and the %assay when compared with unaltered conditions
was within ± 2%, demonstrating the robustness of the method.
The stability studies were evaluated by storing the solutions at ambient
temperature (25±100C) and checked in triplicate after two successive days of storage
and the data were compared with freshly prepared samples. In each case, it could be
noticed that solutions were stable for 48 hrs, as during this time the results did not
decrease below 98%. This denotes that Oxybutynin is stable in standard and sample
solutions for at least 2 days at ambient temperature. The validated method was applied
Chapter 3 Oxybutynin Page 71
for the assay of commercial tablets OXYSPAS containing of 5mg Oxybutynin.
Sample was analyzed for five times after extracting the drug as mentioned in assay
sample preparation of the experimental section. The results were found to be similar
to that of labeled content
Statistical analysis of all these results has been carried out revealing high
accuracy and precision of the method. The RSD for all parameters was found to be
less than two, which indicates the validity of method and assay results obtained by
this method are in fair agreement. The developed method can be used for routine
quantitative estimation of Oxybutynin in multi component pharmaceutical
preparations and in APIs. The proposed method for the assay of Oxybutynin is
simple, rapid. Therefore, it is suitable for the routine analysis of Oxybutynin for
quality control of pharmaceutical dosage forms.
The developed method was applied to analysis of plasma spiked samples of
Oxybutynin, which showed inadequate selectivity in presence of endogenous plasma
components. Extraction of plasma spiked samples was carried out using liquid-liquid
extraction with Dichloromethane and precipitation technique was deliberately
avoided, as the drug was relatively non polar (log P- 4.3) and also as precipitation
method will produce more unclean samples which may also reduce the column life.
Based on the results in plasma samples, it is concluded that the current method was
not selective for biological samples and further work need to be performed on the
chromatographic separation and also on the sample extraction procedures.
The current validated HPLC method for Oxybutynin offers significant
advantages in terms of sensitivity and selectivity, sample preparation, short run time
(6 min) and lower volume of sample requirements (10 µl). From the results of all the
validation parameters and applicability of the assay, it can be concluded that the
present method can be useful for regular and routine analysis of pharmaceutical
dosage forms and also for the systemic pharmacokinetic studies of Oxybutynin with
desired precision and accuracy along with high-throughput.