chapter of the rodos pv4.0 user guide for the aquatic food ... · pdf filechapter of the rodos...
TRANSCRIPT

Version 1.0 Chapter of the RODOS PV4.0 User Guide for the Aquatic Food Chain and Dose Module FDMA
Chapter of the RODOS PV4.0 User Guide for the Aquatic Food Chainand Dose Module FDMA
Florian Gering, Stephan Hübner, Heinz Müller
Management Summary 1
Contents 2
1 Overview 31.1 Input Data 51.2 Output data 6
2 Starting the model 92.1 Before the run 92.2 Starting the Food Chain and Dose Module FDMA 92.3 Archived runs: 14
3 Initialization Windows for FDMA 15
4 Windows for selecting the endpoints of calculation 164.1 Overview 164.2 Description 18
4.2.1 Activities 194.2.1.1 Feedstuff Activities 204.2.1.2 Foodstuff activities 234.2.1.3 Activities - Nuclide selection 27
4.2.2 Ingestion dose 294.2.2.1 Ingestion dose - From feeding water 304.2.2.2 Ingestion dose - From irrigation 314.2.2.3 Ingestion dose - Other foodstuffs 324.2.2.4 Ingestion dose - Age groups 33
4.2.3 Graphical output type 374.2.4 Interface data 39
5 Results and Data Output 405.1 Output to the Graphics system 40
5.1.1 Possible results 405.1.2 Default results 42
5.2 Interface data 435.2.1 FDMA - LCMA interface 435.2.2 FDMA - DCM interface 43
6 Glossary 44
Document History 49
1 Overview
The final version of the User Guide will be part of the overall RODOS UserGuide for version 4.0.
The task of the aquatic food and dose module FDMA in the RODOSsystem is to simulate the transfer of radioactive material in food chainsfollowing contamination of water (used for drinking, animal feeding andirrigation of crops), and for the assessment of doses from aquatic pathways(internal exposure via ingestion of drinking water, agricultural products, andfish) to the population. Individual as well as collective doses can beestimated.
Input to FDMA is essentially the output of the HYDRO module, i.e. thetime-dependent concentration of activity in
• drinking water,
• water used for animal feeding,
• water used for irrigation of crops,
• fish,
• time of the year when deposition occurs.
The endpoints of FDMA are essentially the time dependent activityconcentrations in a variety of feed and foodstuffs, and the resulting radiationexposure for the population via the exposure pathways
• consumption of foodstuffs contaminated by animal feeding water orirrigation,
• consumption of contaminated drinking water and fish,
Besides FDMA there are 3 additional modules in RODOS which handlefood chain and dose assessment for those pathways which require specialmodel approaches:
• the Food Chain and Dose Module for Terrestrial Pathways (FDMT)which considers the consequences of radioactive depositions ontoagricultural crops or inhabited areas,
• the Food Chain and Dose Module for semi-natural (forest) pathways(FDMF), and

• the Food Chain and Dose Module for the transfer of the radionuclideTritium (FDMH)..
A Dose Combination Module (DCM) combines certain results of thesedifferent Food and Dose Modules (Figure: 1.1).
ADMAtmospheric Dispersion Module
TerrestrialFood Chain
Module
AquaticFood Chain
Module
ForestFood Chainand DoseModule
TritiumFood Chainand DoseModule
TerrestrialDose
Module
AquaticDose
Module
Countermeasure Subsystem CSY
Dose Combination Module
FDMHFDMFFDMAFDMT
HydrologicalModule
Figure 1.1: Data flow of the Food and Dose Modules.
The results of FDMA can be displayed to the user via the graphics system.FDMA calculates also data sets which are used by the long-termcountermeasure module LCMA to estimate the effect of long termcountermeasures.

A detailed description of FDMA is given in the Documentation of theAquatic Food Chain and Dose Module FDMA in RODOS PV 4.0(RODOS(WG3)-TN(99)10).

1.1 Input Data
A detailed description of the input data to FDMA can be found in chapter3.2 of the FDMA documentation.
The following input data is transferred to FDMA from the HYDROmodule via shared memory (a detailed list of variables is in the FDMAdocumentation):
• Number of time steps for which have been calculated (max. 50)
• Number of nuclides for which water contaminations have been calculated(max. 15)
• Number of water sources (parts of a river, lakes, water processingplants) for which water contaminations have been calculated (max. 50)
• Date and time when the time arrays start (year, month, day, hour andminute)
• Time grid of the water contamination calculation
• Names of the radionuclides
• Activity concentrations in drinking water (for each water source,radionuclide and time step)
• Activity concentrations in animal feeding water (for each water source,radionuclide and time step)
• Activity concentrations in irrigation water (for each water source,radionuclide and time step)
• Activity concentrations in fish (for each water source, radionuclide andtime step)
• Radioecological regions (for each water source)
The following data needed by FDMA is coming from the RODOSgeographical data base:
• Radioecological regions (for each location)
• Number of inhabitants (for each location)
• Amount of foodstuff production (for each location)
• Soiltype category (for each location)
A lot of model parameters describing the food chain transfer and radiationexposure are kept in a data base. Individual data sets exist for eachradioecological region. Important model parameters are e.g.

• Season, frequency of irrigation, amount of irrigation water per irrigationevent,
• Growing and harvesting times for different agricultural crops,
• Transfer factors (soil-plant, feed-animal),
• Location factors for different exposure pathways (for eachradioecological region),
• Animal feeding diets,
• Food consumption rates.
A detailed description of the model parameter data base can be found inChapter 3.1.3 of the FDMA documentation.
In addition, information on the required endpoints of calculatuon of FDMAis required as input. This is provided by the Operation System OSY(automatic mode) or the Graphical User Interface GUI (interactive mode).
1.2 Output data
The main results of the Food Chain Module in FDMA are time-dependentactivities in feedstuffs and foodstuffs. Feed and foodstuff activities areestimated from activity concentrations in plants, transfer of radionuclides intoanimal products (if necessary), activity enrichment or dilution duringprocessing and preparation, and also considering radioactive decay duringprocessing and storage times.
Different types of feedstuffs can be considered:
− Grass (intensive + extensive cultivation): Grass is considered to beharvested continuously; weathering, translocation into/from root zoneand growth dilution is considered explicitely.
− Hay (intensive + extensive cultivation): Contamination of hay isderived from the contamination of grass averaged over the hayharvest period and multiplied by a factor to consider the loss of waterduring hay preparation. Contamination of stored products is derivedfrom average contamination of two harvest intervals.
− Maize, beet leaves: Weathering is considered explicitely,contamination of stored products is derived from contamination atend of harvesting period.
− Cereals (barley, wheat, rye, oats), potatoes, beets, maize bulbs:translocation is considered explicitely. Contamination of storedproducts is derived from contamination at end of harvesting period.

− Distilling and brewing residues: contamination is derived from thecontamination of the underlying plants and appropriate processingfactors.
− Skim milk, milk substitute, whey: the contamination of animalproducts used as feedstuffs is derived from activity concentrations inthe feedstuffs for the animals, feeding rates, transfer factors fromfodder to animal products and biological transfer rates.
The results can be displayed graphically in two different ways: maps andtime dependency plots. Furthermore, some of the results are transferred tothe Long Term Countermeasure Module LCMA and the Dose CombinationModule DCM.
• Maps of the specific activities in a chosen feed- or foodstuff can beshown for each location for the time step with the maximum value, i.e.within one map the concentrations can be given for different times.Results can be given for single nculides or for groups of radionculides(e.g. iodine isotopes).
• Time dependency plots of specific activities in a chosen feed- orfoodstuff can be shown for each time step of the ingestion time grid (seeGlossary) for the location with the maximum value. Again the results canbe given for single nculides or for groups of radionculides (e.g. iodineisotopes).
The main results of the Dose Module in FDMA are doses arising fromdifferent pathways:
• internal exposure due to ingestion of contaminated foodstuffs,• external exposure from radionuclides in river or lake sediments (not
included in the current version!).
In RODOS two types of individual doses are calculated:
• Potential doses which give an upper limit of individual doses.• Expected doses which give a best estimate of the average exposure of
the population.
In FDMA all doses are potential doses.
The results of the Dose Module can be displayed graphically in threedifferent ways:
• Maps of individual doses can be shown for a single or the sum of theexposure pathways mentioned above and for the time step with the

maximum value for all locations of the RODOS grid. Results can be timeintegrated doses or doses / dose rates for a single time step. The resultscan be given for single nculides or for groups of radionculides (e.g. iodineisotopes), for one of 5 age groups and one of 12 organs (includingeffective dose).
• Time dependency plots of individual doses can be shown for the locationwith the maximum value containing results of all 56 time steps fordifferent nuclides, age groups and organs.
• Maps of collective doses can be shown for a chosen exposure pathway,time step, nuclide, age group and organ.
Furthermore, some of the results are transferred to the Long TermCountermeasure Module LCMA and to the Dose Combination ModuleDCM.
2 Starting the model
2.1 Before the run
To run FDMA, results of a previous run of the HYDRO module is requiredas input data to FDMA
2.2 Starting the Food Chain and Dose Module FDMA
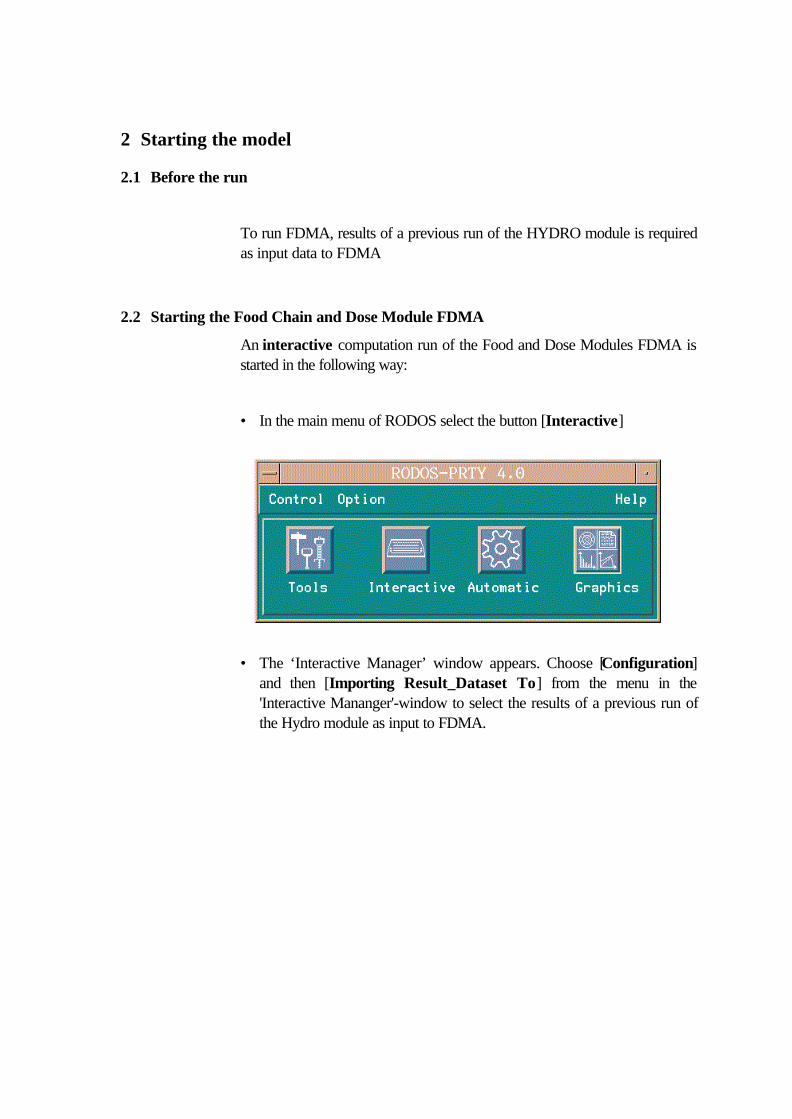
An interactive computation run of the Food and Dose Modules FDMA isstarted in the following way:
• In the main menu of RODOS select the button [Interactive]
• The ‘Interactive Manager’ window appears. Choose [Configuration]and then [Importing Result_Dataset To] from the menu in the'Interactive Mananger'-window to select the results of a previous run ofthe Hydro module as input to FDMA.
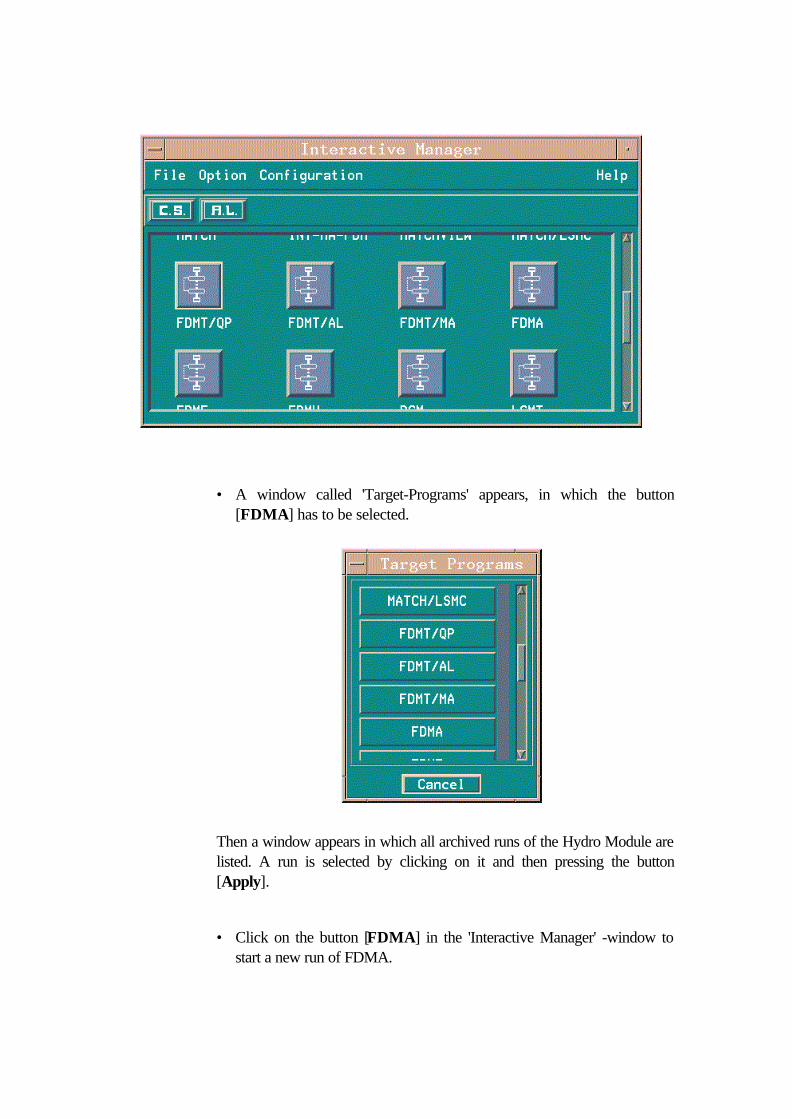
• A window called 'Target-Programs' appears, in which the button[FDMA] has to be selected.
Then a window appears in which all archived runs of the Hydro Module arelisted. A run is selected by clicking on it and then pressing the button[Apply].
• Click on the button [FDMA] in the 'Interactive Manager' -window tostart a new run of FDMA.

• A 'Start Box'-window for the definition of the RunId pops up, a RunIdhas to be entered by the user.
The RunID can be any character string using letters and numbers(maximum 32 characters) and must be different from the RunIDs ofprevious runs which are still in the data base.
• The program run is started by clicking on [Start] in the 'Start Box'-window.
• To enable the graphics output of FDMA, the Graphics System ofRODOS has to be started before FDMA is started by selecting thebutton [Graphics] in the main menu of RODOS!
After the program has been started, a 'Control & Services'-windowappears. This control window is divided into an upper and lower part. Theupper part contains the RunID of the currently selected run as well as fourbuttons to control the runs. The lower part contains four buttons with whichvarious services can be chosen. Both types of buttons are described in detailin the User Guide for the Graphical System. The only button in the lowerpart which is of interest for FDMA is the button:
• [Process Status ] Selecting this service opens a window with the list ofall modules of the selected run and their actual state. The colour codingof the modules indicates whether the module has not yet started (blue),data is loaded from the database (yellow), the module is calculating(green), the results are archived in the database (red) or the module hasfinished it’s work (grey).

Some time after starting the run of FDMA some windows for selection ofendpoints of calculation will show up automatically. These windows can beused to select the desired output which should be calculated by FDMA. Thewindows are described in detail in section 4.
After the first run of FDMA has finished (and has sent its results to thegraphics system) the following window appears:
This window enables the user to choose between terminating FDMA orselecting further endpoints to calculate. These calculations can be performedvery quickly since most of the required data is still kept in memory.
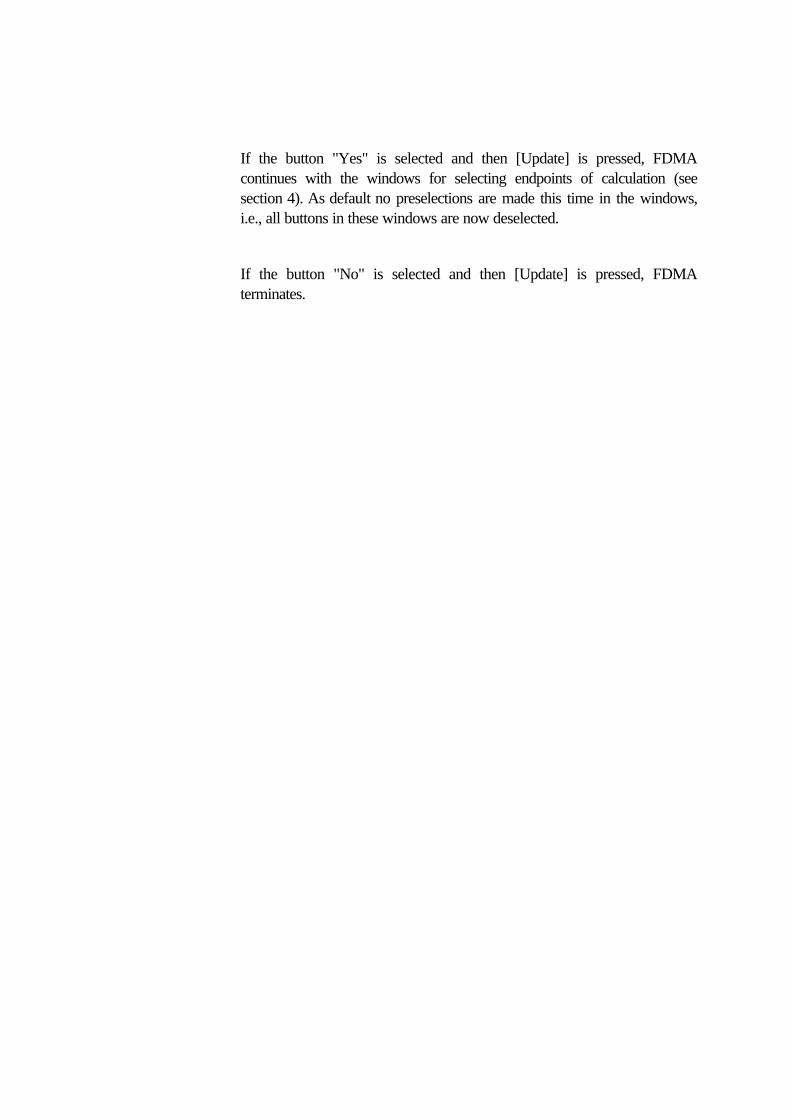
If the button "Yes" is selected and then [Update] is pressed, FDMAcontinues with the windows for selecting endpoints of calculation (seesection 4). As default no preselections are made this time in the windows,i.e., all buttons in these windows are now deselected.
If the button "No" is selected and then [Update] is pressed, FDMAterminates.
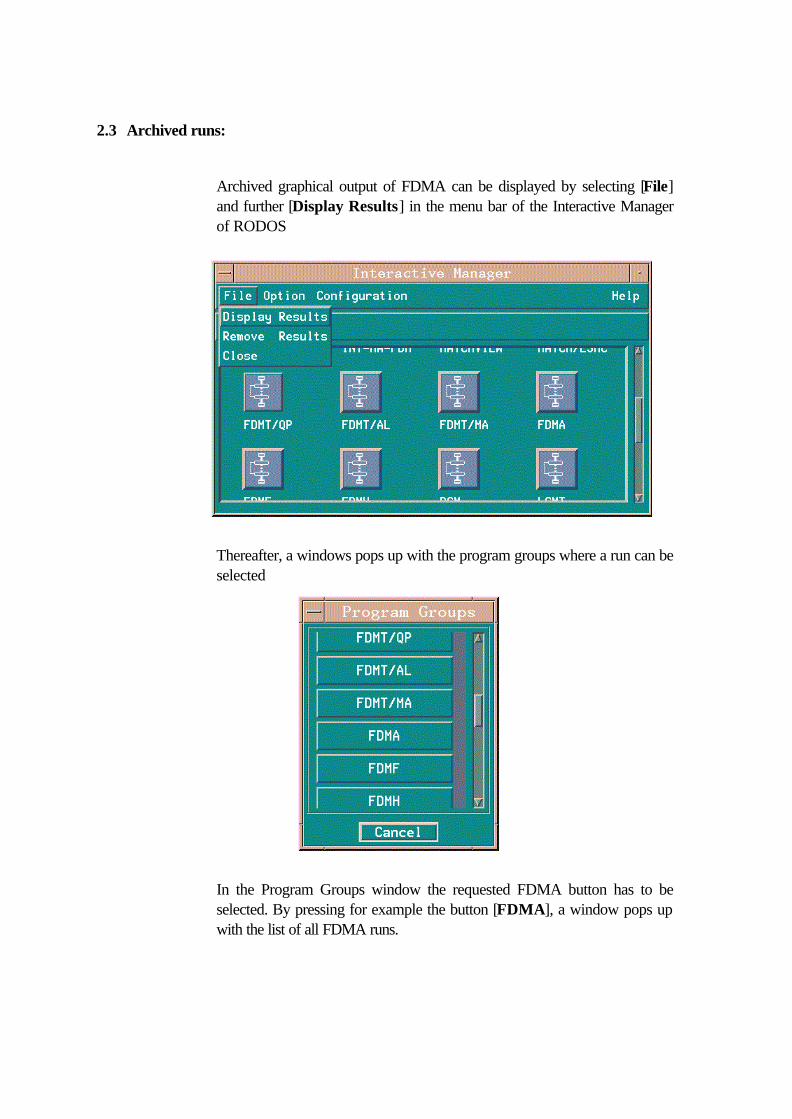
2.3 Archived runs:
Archived graphical output of FDMA can be displayed by selecting [File]and further [Display Results] in the menu bar of the Interactive Managerof RODOS
Thereafter, a windows pops up with the program groups where a run can beselected
In the Program Groups window the requested FDMA button has to beselected. By pressing for example the button [FDMA], a window pops upwith the list of all FDMA runs.
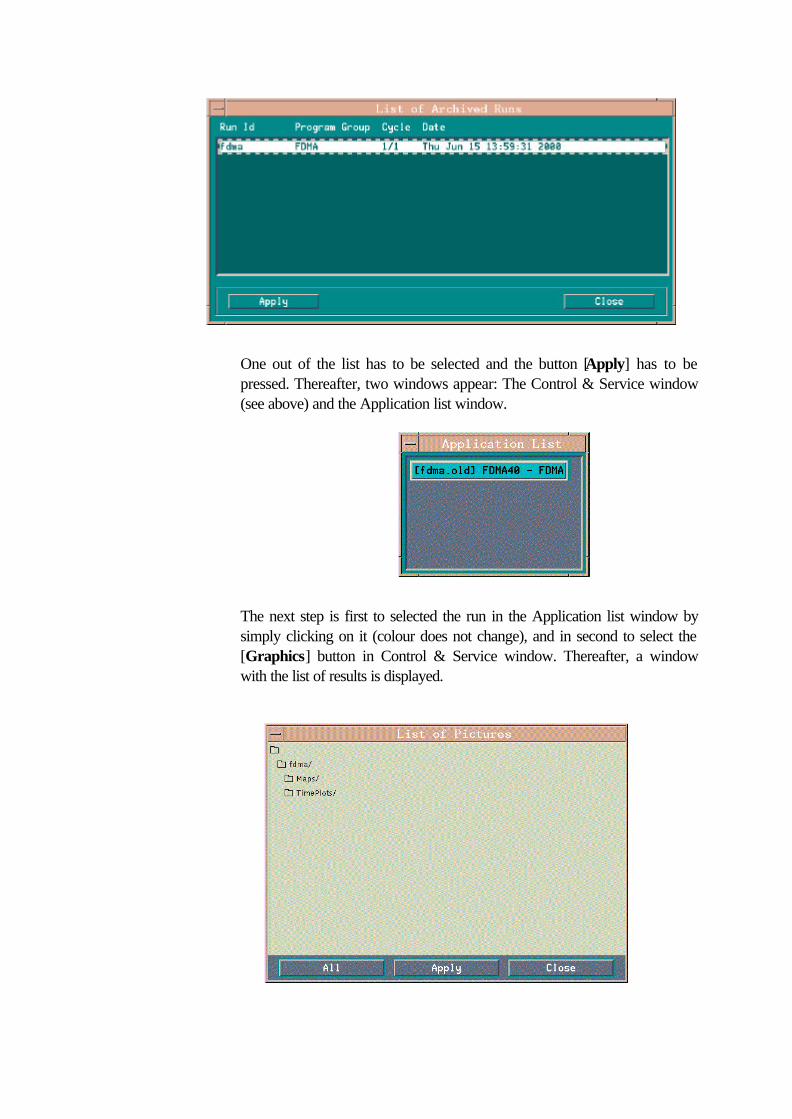
One out of the list has to be selected and the button [Apply] has to bepressed. Thereafter, two windows appear: The Control & Service window(see above) and the Application list window.
The next step is first to selected the run in the Application list window bysimply clicking on it (colour does not change), and in second to select the[Graphics] button in Control & Service window. Thereafter, a windowwith the list of results is displayed.

In this window either individual results can be selected by clicking throughthe context menu up to a result which is marked with a red cross. This canbe selected by pressing the [Apply] button. Or it is also possible to select allresults by pressing first the [All] button and thereafter the [Apply] button.The [Close] button can be selected if no further result is requested.
3 Initialization Windows for FDMA
In version 4.0 of FDMA the selection of the desired endpoints of calculationis done within a loop inside FDMA (see Chapter 4). Therefore, you don’tneed to push the [Initialising] button in the ‘Start Box’ window beforestarting FDMA (as it was in previous versions)!
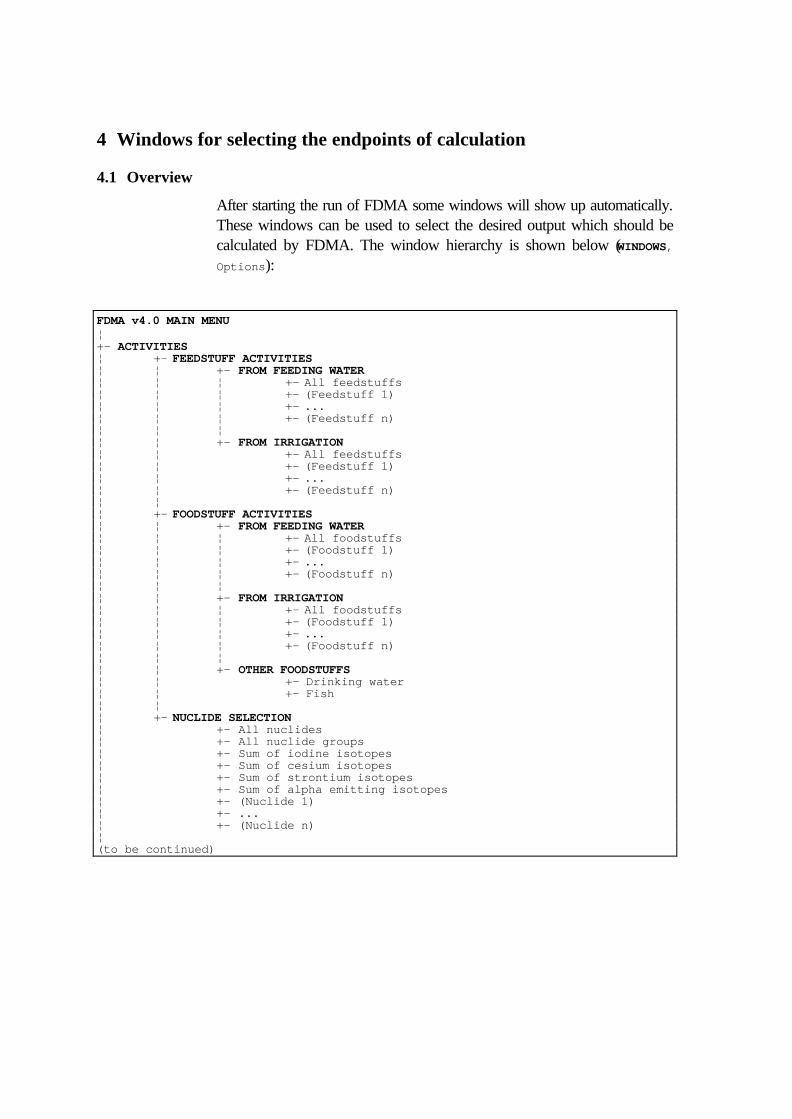
4 Windows for selecting the endpoints of calculation
4.1 Overview
After starting the run of FDMA some windows will show up automatically.These windows can be used to select the desired output which should becalculated by FDMA. The window hierarchy is shown below (WINDOWS,Options):
FDMA v4.0 MAIN MENU¦+- ACTIVITIES¦ +- FEEDSTUFF ACTIVITIES¦ ¦ +- FROM FEEDING WATER¦ ¦ ¦ +- All feedstuffs¦ ¦ ¦ +- (Feedstuff 1)¦ ¦ ¦ +- ...¦ ¦ ¦ +- (Feedstuff n)¦ ¦ ¦¦ ¦ +- FROM IRRIGATION¦ ¦ +- All feedstuffs¦ ¦ +- (Feedstuff 1)¦ ¦ +- ...¦ ¦ +- (Feedstuff n)¦ ¦¦ +- FOODSTUFF ACTIVITIES¦ ¦ +- FROM FEEDING WATER¦ ¦ ¦ +- All foodstuffs¦ ¦ ¦ +- (Foodstuff 1)¦ ¦ ¦ +- ...¦ ¦ ¦ +- (Foodstuff n)¦ ¦ ¦¦ ¦ +- FROM IRRIGATION¦ ¦ ¦ +- All foodstuffs¦ ¦ ¦ +- (Foodstuff 1)¦ ¦ ¦ +- ...¦ ¦ ¦ +- (Foodstuff n)¦ ¦ ¦¦ ¦ +- OTHER FOODSTUFFS¦ ¦ +- Drinking water¦ ¦ +- Fish¦ ¦¦ +- NUCLIDE SELECTION¦ +- All nuclides¦ +- All nuclide groups¦ +- Sum of iodine isotopes¦ +- Sum of cesium isotopes¦ +- Sum of strontium isotopes¦ +- Sum of alpha emitting isotopes¦ +- (Nuclide 1)¦ +- ...¦ +- (Nuclide n)¦(to be continued)

¦+- INGESTION DOSE¦ +- FROM FEEDING WATER¦ ¦ +- All foodstuffs¦ ¦ +- Sum of foodstuffs¦ ¦ +- (Animal product 1)¦ ¦ +- ...¦ ¦ +- (Animal product n)¦ ¦¦ +-FROM IRRIGATION¦ ¦ +- All foodstuffs¦ ¦ +- Sum of foodstuffs¦ ¦ +- Sum of plant products¦ ¦ +- Sum of animal products¦ ¦ +- Sum of vegetables¦ ¦ +- Sum of grain products¦ ¦ +- Sum of milk products¦ ¦ +- Sum of meat products¦ ¦ +- (Foodstuff 1)¦ ¦ +- ...¦ ¦ +- (Foodstuff n)¦ ¦ +-¦ +- OTHER FOODSTUFFS¦ ¦ +- Drinking water¦ ¦ +- Fish¦ +- AGE GROUP¦ ¦ +- 1 year¦ ¦ +- 5 years¦ ¦ +- 10 years¦ ¦ +- 15 years¦ ¦ +- Adults¦ +- ORGAN¦ ¦ +- Lung¦ ¦ +- Red bone marrow¦ ¦ +- Thyroid¦ ¦ +- Uterus¦ ¦ +- Effective dose¦ ¦ +- Skin¦ ¦ +- Bone surface¦ ¦ +- Breast¦ ¦ +- Stomach¦ ¦ +- Colon¦ ¦ +- Liver¦ ¦ +- Pancreas¦ +- NUCLIDE¦ +- Sum of nuclides¦ +- All nuclides¦ +- All nuclide groups¦ +- Sum of iodine isotopes¦ +- Sum of cesium isotopes¦ +- Sum of strontium isotopes¦ +- Sum of alpha emitting isotopes¦ +- (Nuclide 1)¦ +- ...¦ +- (Nuclide n)¦+- GRAPHICAL OUTPUT TYPE¦ +- Maps¦ +- Time Plots¦ +- Collective doses¦+- INTERFACE DATA
+- LCM Interface+- DCM Interface
4.2 Description
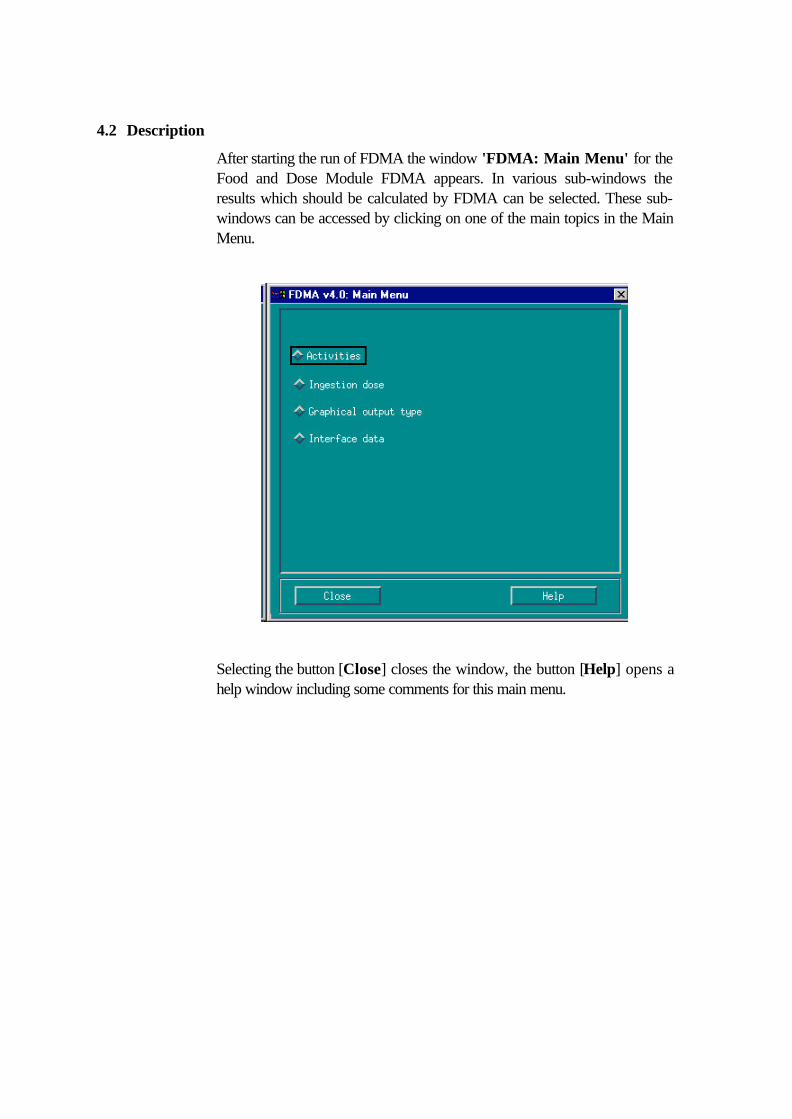
After starting the run of FDMA the window 'FDMA: Main Menu' for theFood and Dose Module FDMA appears. In various sub-windows theresults which should be calculated by FDMA can be selected. These sub-windows can be accessed by clicking on one of the main topics in the MainMenu.
Selecting the button [Close] closes the window, the button [Help] opens ahelp window including some comments for this main menu.
4.2.1 Activities
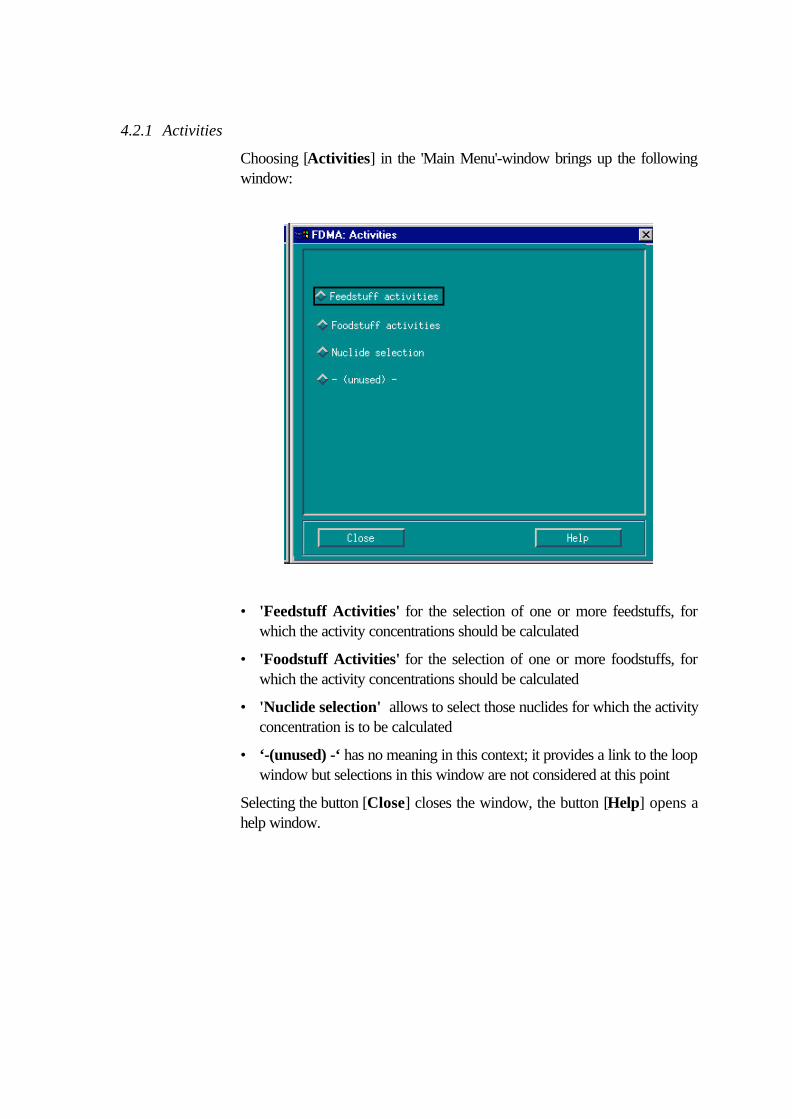
Choosing [Activities] in the 'Main Menu'-window brings up the followingwindow:
• 'Feedstuff Activities' for the selection of one or more feedstuffs, forwhich the activity concentrations should be calculated
• 'Foodstuff Activities' for the selection of one or more foodstuffs, forwhich the activity concentrations should be calculated
• 'Nuclide selection' allows to select those nuclides for which the activityconcentration is to be calculated
• ‘-(unused) -‘ has no meaning in this context; it provides a link to the loopwindow but selections in this window are not considered at this point
Selecting the button [Close] closes the window, the button [Help] opens ahelp window.

4.2.1.1 Feedstuff Activities
If 'Feedstuff Activities' is selected, the following window appears in whichthe source of feedstuff contamination - feeding water or irrigation water -can be chosen:
Selecting the button [Close] closes the window, the button [Help] opens ahelp window.
4.2.1.1.1 Feedstuff activities - From feeding water
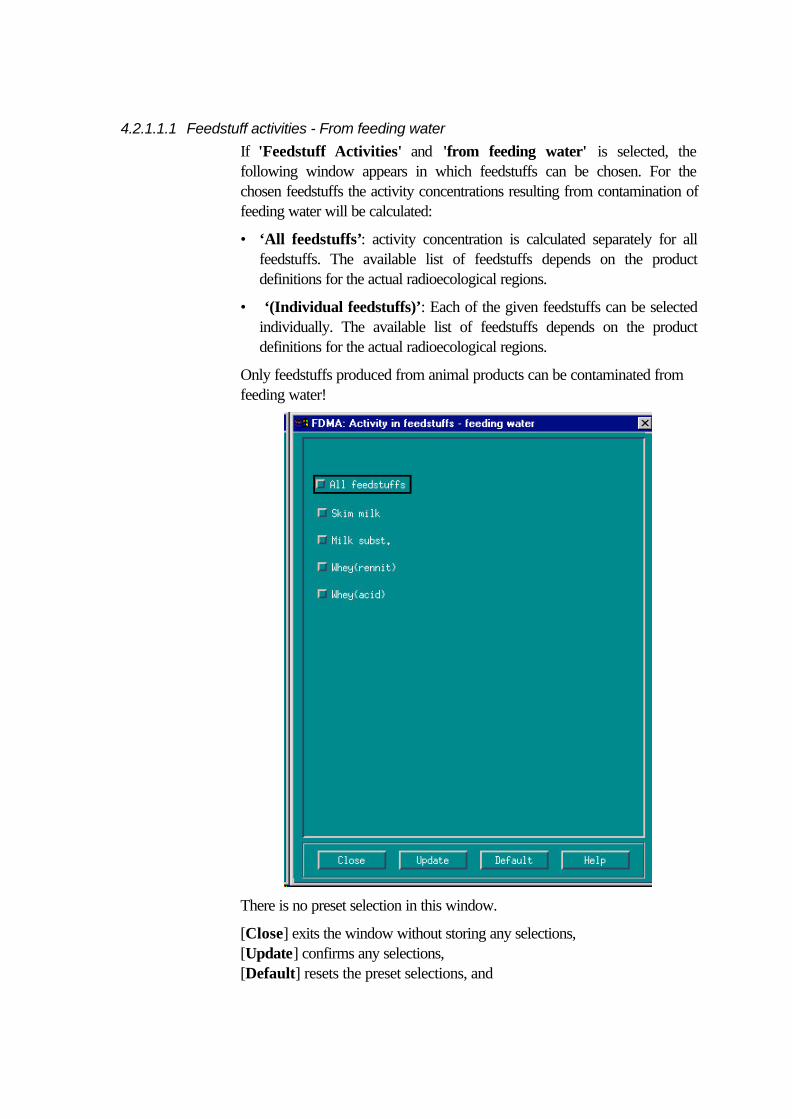
If 'Feedstuff Activities' and 'from feeding water' is selected, thefollowing window appears in which feedstuffs can be chosen. For thechosen feedstuffs the activity concentrations resulting from contamination offeeding water will be calculated:
• ‘All feedstuffs’: activity concentration is calculated separately for allfeedstuffs. The available list of feedstuffs depends on the productdefinitions for the actual radioecological regions.
• ‘(Individual feedstuffs)’: Each of the given feedstuffs can be selectedindividually. The available list of feedstuffs depends on the productdefinitions for the actual radioecological regions.
Only feedstuffs produced from animal products can be contaminated fromfeeding water!
There is no preset selection in this window.
[Close] exits the window without storing any selections,[Update] confirms any selections,[Default] resets the preset selections, and

[Help] brings up a comment window.
4.2.1.1.2 Feedstuff activities - From irrigation
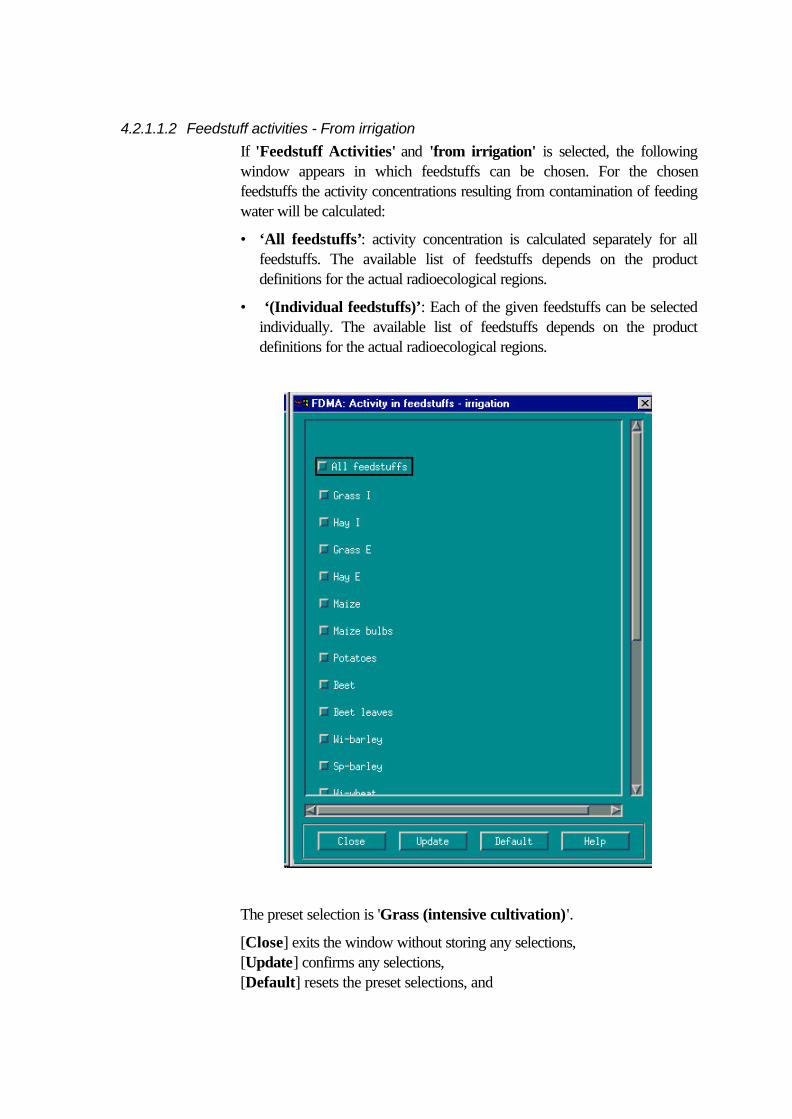
If 'Feedstuff Activities' and 'from irrigation' is selected, the followingwindow appears in which feedstuffs can be chosen. For the chosenfeedstuffs the activity concentrations resulting from contamination of feedingwater will be calculated:
• ‘All feedstuffs’: activity concentration is calculated separately for allfeedstuffs. The available list of feedstuffs depends on the productdefinitions for the actual radioecological regions.
• ‘(Individual feedstuffs)’: Each of the given feedstuffs can be selectedindividually. The available list of feedstuffs depends on the productdefinitions for the actual radioecological regions.
The preset selection is 'Grass (intensive cultivation)'.
[Close] exits the window without storing any selections,[Update] confirms any selections,[Default] resets the preset selections, and

[Help] brings up a comment window.
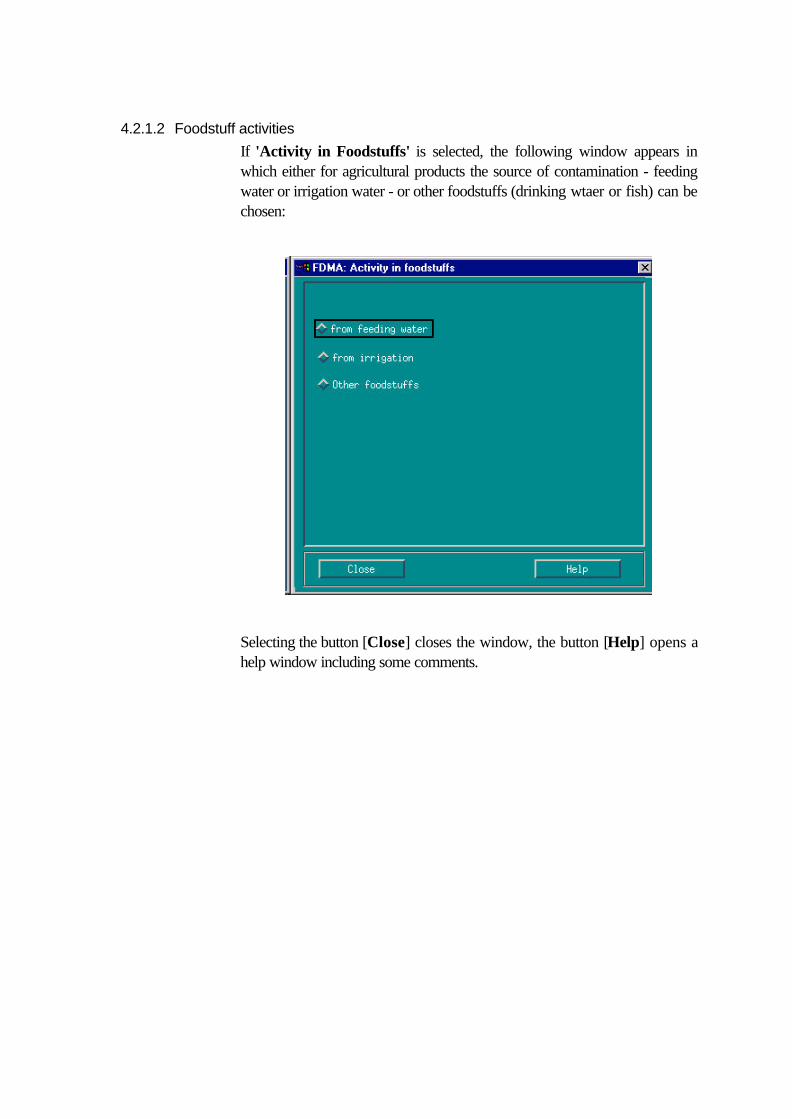
4.2.1.2 Foodstuff activities
If 'Activity in Foodstuffs' is selected, the following window appears inwhich either for agricultural products the source of contamination - feedingwater or irrigation water - or other foodstuffs (drinking wtaer or fish) can bechosen:
Selecting the button [Close] closes the window, the button [Help] opens ahelp window including some comments.
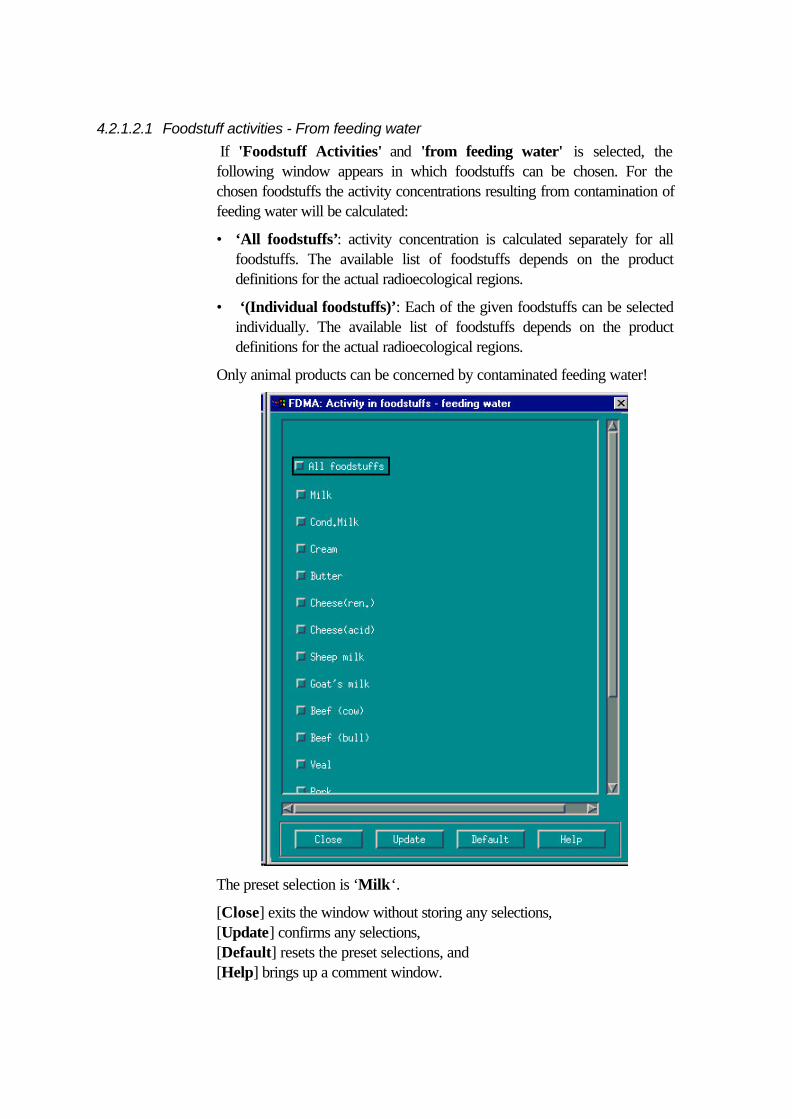
4.2.1.2.1 Foodstuff activities - From feeding water
If 'Foodstuff Activities' and 'from feeding water' is selected, thefollowing window appears in which foodstuffs can be chosen. For thechosen foodstuffs the activity concentrations resulting from contamination offeeding water will be calculated:
• ‘All foodstuffs’: activity concentration is calculated separately for allfoodstuffs. The available list of foodstuffs depends on the productdefinitions for the actual radioecological regions.
• ‘(Individual foodstuffs)’: Each of the given foodstuffs can be selectedindividually. The available list of foodstuffs depends on the productdefinitions for the actual radioecological regions.
Only animal products can be concerned by contaminated feeding water!
The preset selection is ‘Milk‘.
[Close] exits the window without storing any selections,[Update] confirms any selections,[Default] resets the preset selections, and[Help] brings up a comment window.

4.2.1.2.2 Foodstuff activities - From irrigation
If 'Foodstuff Activities' and 'from irrigation' is selected, the followingwindow appears in which foodstuffs can be chosen. For the chosenfoodstuffs the activity concentrations resulting from contamination ofirrigation water will be calculated:
• ‘All foodstuffs’: activity concentration is calculated separately for allfoodstuffs. The available list of foodstuffs depends on the productdefinitions for the actual radioecological regions.
• ‘(Individual foodstuffs)’: Each of the given foodstuffs can be selectedindividually. The available list of foodstuffs depends on the productdefinitions for the actual radioecological regions.
The preset selection are 'Leafy vegs.' and 'Milk'.
[Close] exits the window without storing any selections,[Update] confirms any selections,[Default] resets the preset selections, and

[Help] brings up a comment window.
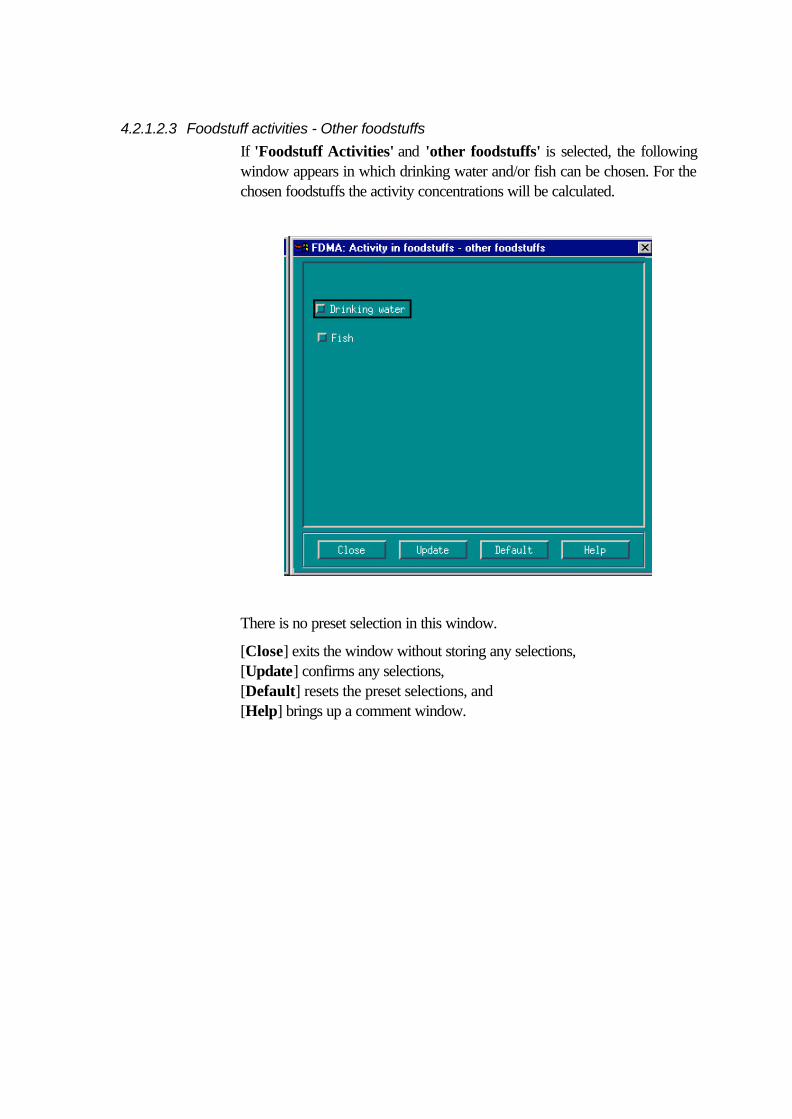
4.2.1.2.3 Foodstuff activities - Other foodstuffs
If 'Foodstuff Activities' and 'other foodstuffs' is selected, the followingwindow appears in which drinking water and/or fish can be chosen. For thechosen foodstuffs the activity concentrations will be calculated.
There is no preset selection in this window.
[Close] exits the window without storing any selections,[Update] confirms any selections,[Default] resets the preset selections, and[Help] brings up a comment window.
4.2.1.3 Activities - Nuclide selection
Choosing 'Nuclide selection' in the 'Activities'-window opens awindow in which those nuclides can be selected for which activityconcentration in feed and foodstuffs are to be calculated. It is possible toselect
• ‘All nuclides’: the activity for each of the nuclides (up to 15) included inthe source term provided by the Atmospheric Dispersion Module ispresented.
• ‘All nuclide groups’: The activities summed up over all nuclides of theindividual nuclide groups is presented for each nuclide group.
• ‘All iodine isotopes’: Results are calculated for the sum of all iodineisotopes included in the source term; these can be at maximum 129I, 131I,132I, 133I, 134I and 135I.
• ‘All cesium isotopes’: Results are calculated for the sum of all cesiumand other long lived (halflife > 10 d) isotopes included in the source term;these can be at maximum 15 radionuclides out of 54Mn, 58Co, 60Co,86Rb, 91Y, 95Zr, 95Nb, 103Ru, 106Ru, 110mAg, 127mTe, 129mTe, 134Cs, 136Cs,137Cs, 138Cs, 140Ba, 141Ce, 144Ce, 143Pr, and 147Nd.
• ‘All strontium isotopes’: Results are calculated for the sum of allstrontium isotopes included in the source term; these can be at maximum89Sr, 90Sr, 91Sr, and 92Sr.
• ‘All alpha emitt. isotopes’: Results are calculated for the sum of allcesium and other long lived (halflife > 10 d) isotopes included in thesource term; these can be at maximum 15 radionuclides out of 54Mn,58Co, 60Co, 86Rb, 91Y, 95Zr, 95Nb, 103Ru, 106Ru, 110mAg, 127mTe, 129mTe,134Cs, 136Cs, 137Cs, 138Cs, 140Ba, 141Ce, 144Ce, 143Pr, and 147Nd..
• ‘(Individual nuclides)’: Each of the nuclides of the source term can beselected individually.
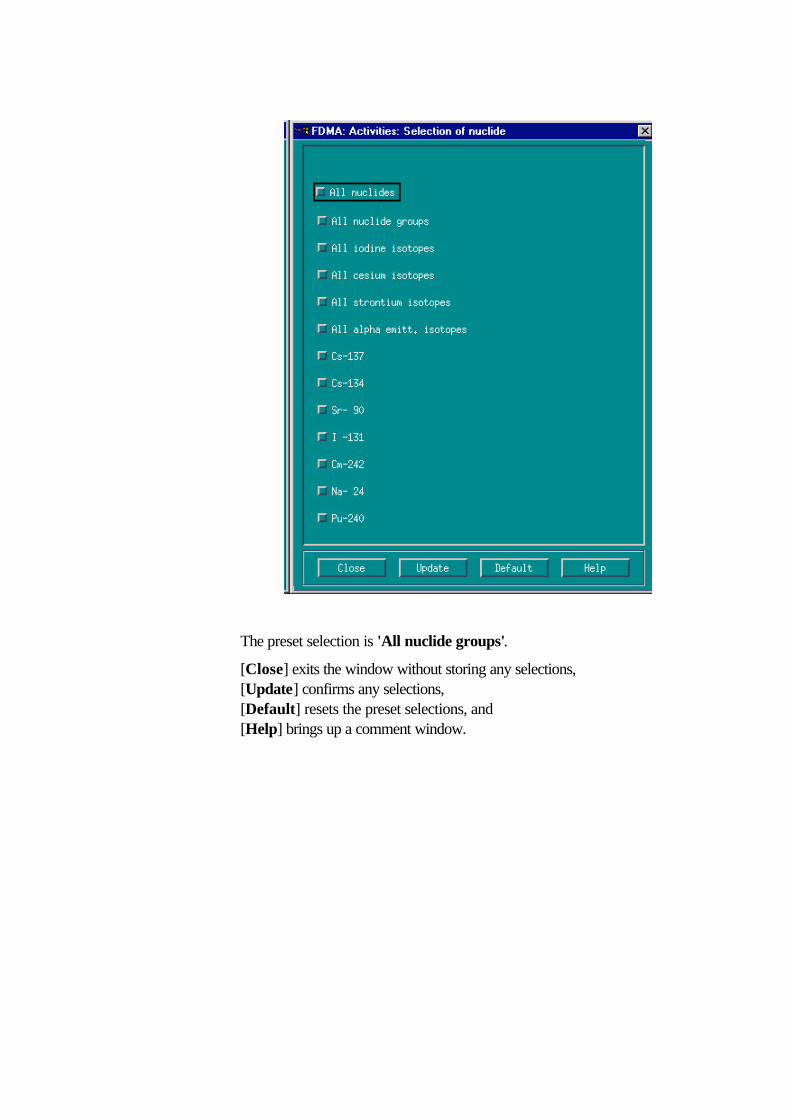
The preset selection is 'All nuclide groups'.
[Close] exits the window without storing any selections,[Update] confirms any selections,[Default] resets the preset selections, and[Help] brings up a comment window.

4.2.2 Ingestion dose
Choosing [Ingestion dose] in the 'Main Menu'-window brings up thefollowing window for the selection of doses, from which one can branch into7 succeding windows:
• 'from feeding water' branches into windows for specification offoodstuffs contaminated by animal feeding water contributing to theingestion dose.
• 'from irrigation' branches into windows for specification of foodstuffscontaminated by irrigation of crops contributing to the ingestion dose.
• 'Other foodstuffs' opens a windows for selecting the ingestion dosefrom drinking water and/or fish.
• 'Age group' allows to select those age groups for which all doses are tobe calculated.
• 'Organ' allows to select those organs for which all doses are to becalculated.
• 'Nuclide' allows to select those nuclides for which all doses are to becalculated.
Selecting the button [Close] closes the window, the button [Help] opens ahelp window including some comments.
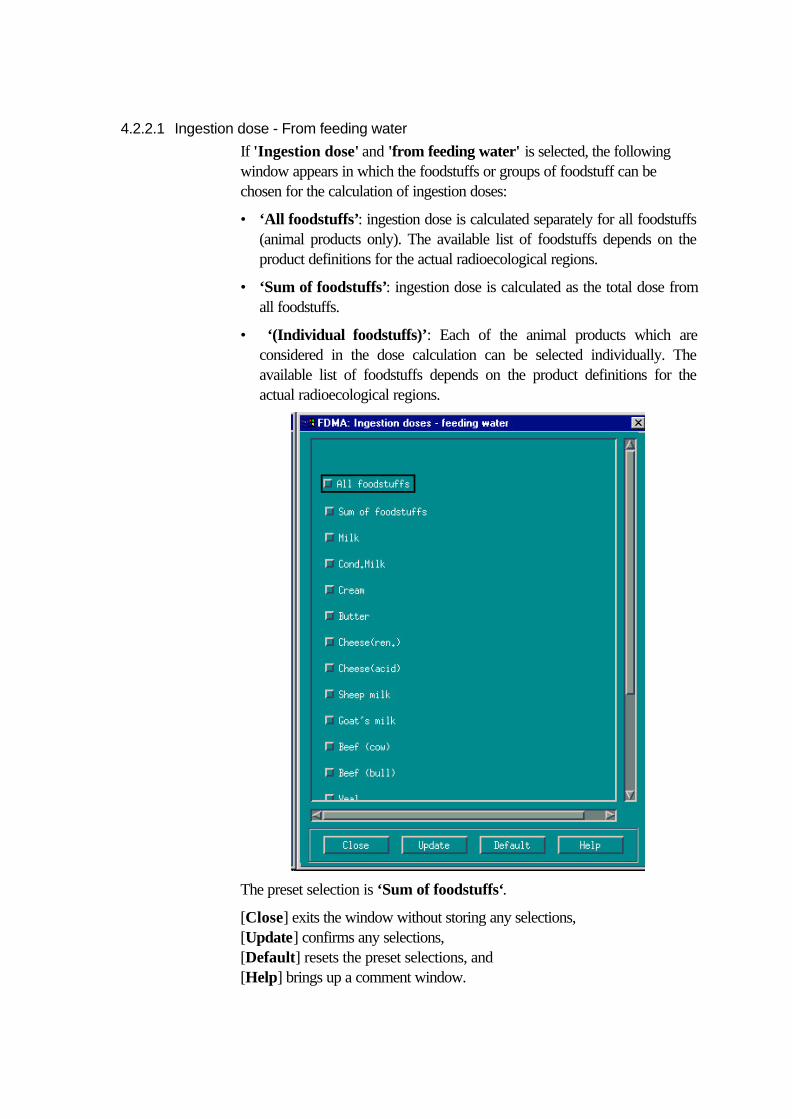
4.2.2.1 Ingestion dose - From feeding water
If 'Ingestion dose' and 'from feeding water' is selected, the followingwindow appears in which the foodstuffs or groups of foodstuff can bechosen for the calculation of ingestion doses:
• ‘All foodstuffs’: ingestion dose is calculated separately for all foodstuffs(animal products only). The available list of foodstuffs depends on theproduct definitions for the actual radioecological regions.
• ‘Sum of foodstuffs’: ingestion dose is calculated as the total dose fromall foodstuffs.
• ‘(Individual foodstuffs)’: Each of the animal products which areconsidered in the dose calculation can be selected individually. Theavailable list of foodstuffs depends on the product definitions for theactual radioecological regions.
The preset selection is ‘Sum of foodstuffs‘.
[Close] exits the window without storing any selections,[Update] confirms any selections,[Default] resets the preset selections, and[Help] brings up a comment window.

4.2.2.2 Ingestion dose - From irrigation
If 'Ingestion dose' and 'from irrigation' is selected, the following windowappears in which the foodstuffs or groups of foodstuff can be chosen for thecalculation of ingestion doses:
• ‘All foodstuffs’: ingestion dose is calculated separately for all foodstuffs.The available list of foodstuffs depends on the product definitions for theactual radioecological regions.
• ‘Sum of foodstuffs’: ingestion dose is calculated as the total dose fromall foodstuffs.
• ‘Sum of (group of foodstuffs)’: ingestion dose is calculated as the totaldose from all foodstuffs included in the respective group of foodstuffs.
• ‘(Individual foodstuffs)’: Each of the foodstuffs which are consideredin the dose calculation can be selected individually. The available list offoodstuffs depends on the product definitions for the actualradioecological regions.
The preset selection is ‘Sum of foodstuffs‘.
[Close] exits the window without storing any selections,[Update] confirms any selections,[Default] resets the preset selections, and[Help] brings up a comment window.
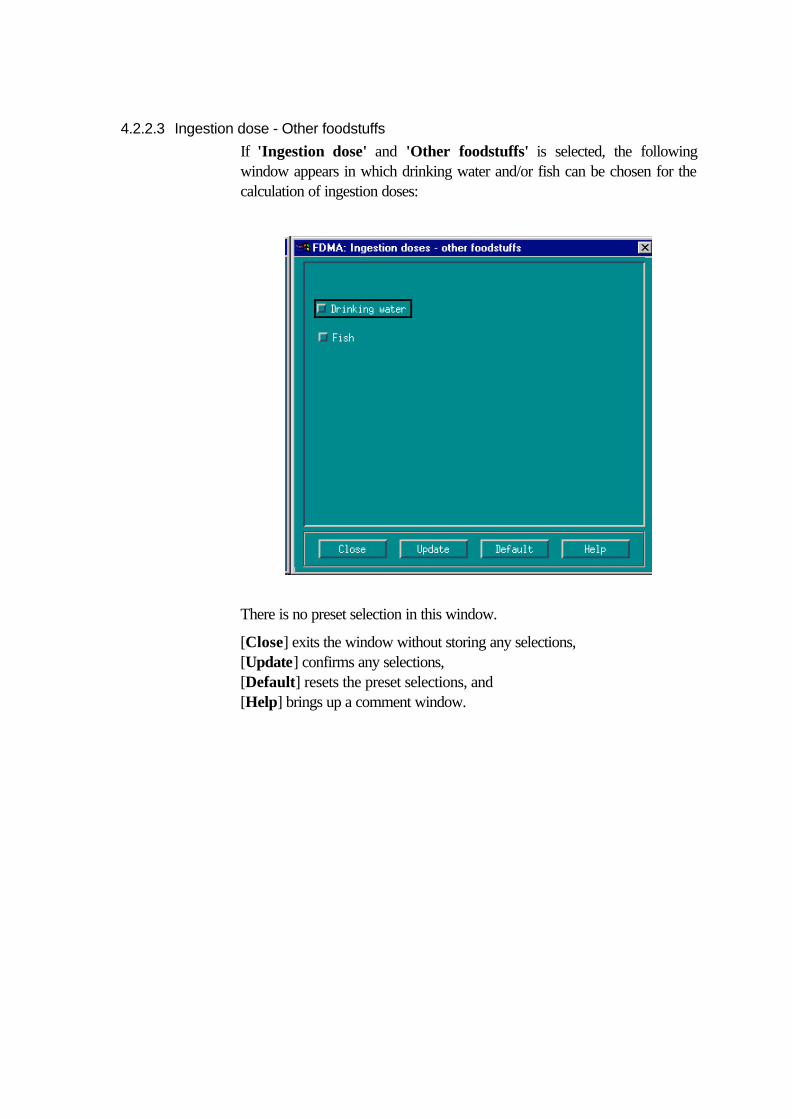
4.2.2.3 Ingestion dose - Other foodstuffs
If 'Ingestion dose' and 'Other foodstuffs' is selected, the followingwindow appears in which drinking water and/or fish can be chosen for thecalculation of ingestion doses:
There is no preset selection in this window.
[Close] exits the window without storing any selections,[Update] confirms any selections,[Default] resets the preset selections, and[Help] brings up a comment window.

4.2.2.4 Ingestion dose - Age groups
Choosing [Age group] in the 'Ingestion Dose'-window brings up thefollowing window for the selection of age groups for all dose calculations.
Up to 5 age groups can be selected:
• infants of 1 year
• children of 5 years
• children of 10 years
• children of 15 years
• adults
This selection mainly determines the dose factors that are used in the dosecalculations. Furthermore, this selection determines the food consumptionrates in the ingestion dose calculation.
The preset selection is the age group 'Adults'.
[Close] exits the window without storing any selections,[Update] confirms any selections,[Default] resets the preset selections, and[Help] brings up a comment window.

4.2.2.4.1 Ingestion dose - Organ
Choosing [Organ] in the 'Ingestion dose'-window brings up the followingwindow for the selection of organs for all dose calculations:
Up to 12 organs can be selected: Lung, red bone marrow, thyroid, uterus,effective dose, skin, bone surface, breast, stomach, colon, liver, andpancreas.
This selection determines the dose factors that are used in the dosecalculations.
The preset selections are 'effective dose' and 'thyroid'.
[Close] exits the window without storing any selections,[Update] confirms any selections,[Default] resets the preset selections, and[Help] brings up a comment window.
4.2.2.4.2 Ingestion dose - Nuclide
Choosing [Nuclide] in the 'Ingestion Dose'-window brings up thefollowing window for the selection of nuclides. It is possible to select
• ‘Sum of all nuclides’: Doses are calculated for the sum of all nuclides(up to 10) for which data was provided by the Hydro Module.
• ‘All nuclides’: Doses for each of the nuclides (up to 10) included in thesource term provided by the Hydro Module are calculated.
• ‘All nuclide groups’: Doses summed up over all nuclides of theindividual nuclide groups are calculated.
• ‘All iodine isotopes’: Doses are calculated for the sum of all iodineisotopes included in the source term; these can be at maximum 129I, 131I,132I, 133I, 134I and 135I.
• ‘All cesium isotopes’: Doses are calculated for the sum of all cesiumand other long lived (halflife > 10 d) isotopes included in the source term;these can be at maximum 15 radionuclides out of 54Mn, 58Co, 60Co,86Rb, 91Y, 95Zr, 95Nb, 103Ru, 106Ru, 110mAg, 127mTe, 129mTe, 134Cs, 136Cs,137Cs, 138Cs, 140Ba, 141Ce, 144Ce, 143Pr, and 147Nd.
• ‘All strontium isotopes’: Doses are calculated for the sum of allstrontium isotopes included in the source term; these can be at maximum89Sr, 90Sr, 91Sr, and 92Sr.
• ‘All alpha emitt. isotopes’: Doses are calculated for the sum of allcesium and other long lived (halflife > 10 d) isotopes included in thesource term; these can be at maximum 15 radionuclides out of 54Mn,58Co, 60Co, 86Rb, 91Y, 95Zr, 95Nb, 103Ru, 106Ru, 110mAg, 127mTe, 129mTe,134Cs, 136Cs, 137Cs, 138Cs, 140Ba, 141Ce, 144Ce, 143Pr, and 147Nd..
• ‘(Individual nuclides)’: Each of the nuclides of the source term can beselected individually.
All the above selections depend on the data provided by the HYDROModule. If data for some of the selected nuclides is not provided, FDMAwill not calculate results for these nuclides.

The preset selection is 'Sum of all nuclides'.
[Close] exits the window without storing any selections,[Update] confirms any selections,[Default] resets the preset selections, and[Help] brings up a comment window.

4.2.3 Graphical output type
Choosing [Graphical output type] in the ‘Main menue’ brings up thefollowing window in which up to three different types of graphical output canbe selected:
• Maps : Results are displayed as a colour-coded map for all locations ofthe RODOS grid. Assigning various colours to ranges of the results isautomatically done by the system, the exact value at each location can beaccessed via the mouse cursor.
• Time plots: Results are shown as a time dependency plot, whichdisplays the results for all according time steps (see Glossary fordefinition of various time resolutions) for the location with the maximumresults (a selection of other locations is not yet possible).
• Collective doses: Collective doses for the chosen exposure pathwaysare displayed as colour-coded maps for all locations for the time stepwith the maximum results. Collective doses from ingestion are estimatedfrom the activity concentrations in processed foodstuffs at each location,the amount of foodstuff production at the according location andingestion dose factors for adults. This means, collective ingestion dosescan only be calculated for those foodstuffs where production data isavailable.

One, two or all of the three types can be selected at the same time. Thepreset selections are 'Maps' and 'Time plots'. This means, if no selectionis made by the user all results can be displayed with these two types ofgraphical output.
[Close] exits the window without storing any selections,[Update] confirms any selections,[Default] resets the preset selections, and[Help] brings up a comment window.
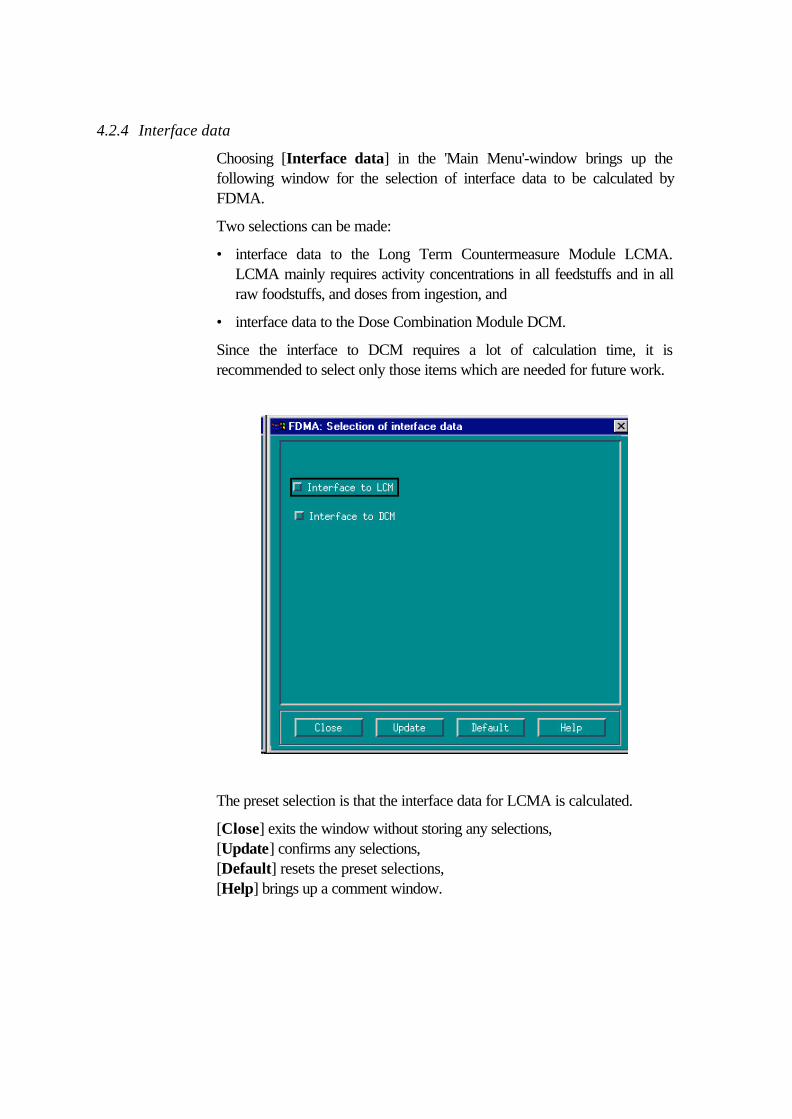
4.2.4 Interface data
Choosing [Interface data] in the 'Main Menu'-window brings up thefollowing window for the selection of interface data to be calculated byFDMA.
Two selections can be made:
• interface data to the Long Term Countermeasure Module LCMA.LCMA mainly requires activity concentrations in all feedstuffs and in allraw foodstuffs, and doses from ingestion, and
• interface data to the Dose Combination Module DCM.
Since the interface to DCM requires a lot of calculation time, it isrecommended to select only those items which are needed for future work.
The preset selection is that the interface data for LCMA is calculated.
[Close] exits the window without storing any selections,[Update] confirms any selections,[Default] resets the preset selections,[Help] brings up a comment window.
5 Results and Data Output
5.1 Output to the Graphics system
5.1.1 Possible results
If selections are made in the Initialization Windows of FDMA, the resultswhich are calculated in FDMA and the graphical output of these results aredefined by all possible combinations of these selections, with some logicalexceptions.
All chosen activities (feedstuff and/or foodstuff activities) and ingestiondoses are displayed for both graphical output types, 'Maps' and 'Timeplots', if these types are chosen. Only doses can be displayed as 'Collectivedoses'.
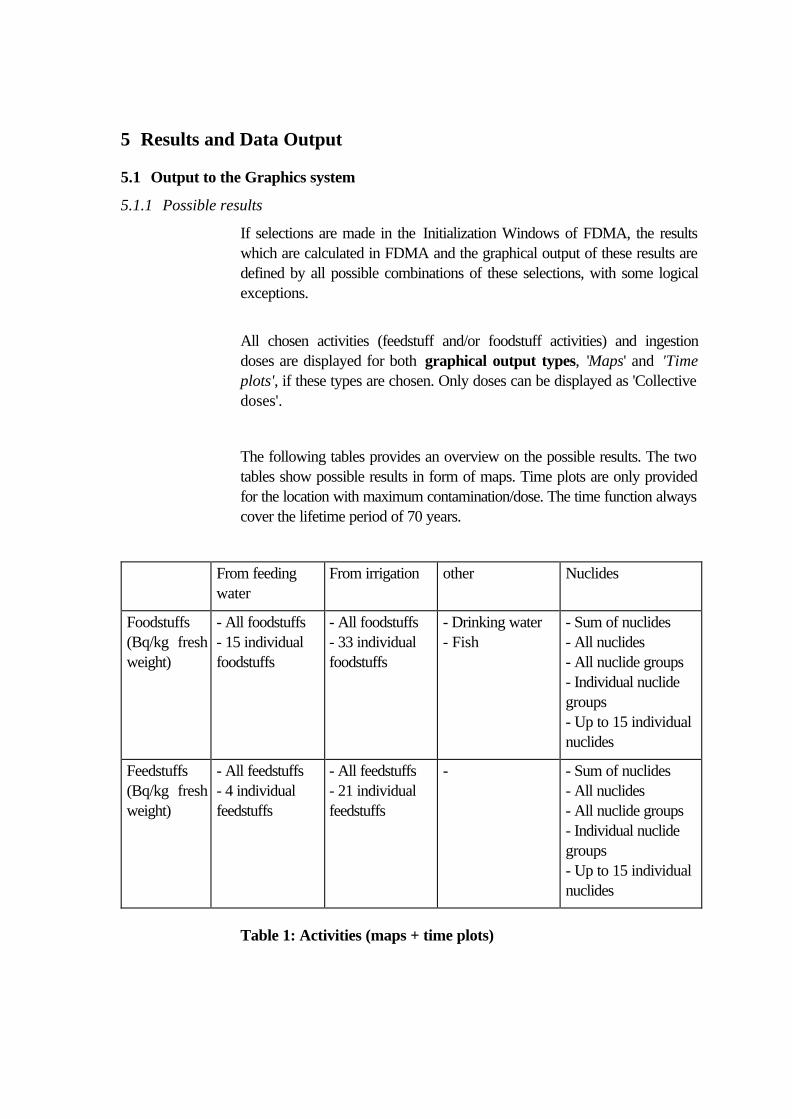
The following tables provides an overview on the possible results. The twotables show possible results in form of maps. Time plots are only providedfor the location with maximum contamination/dose. The time function alwayscover the lifetime period of 70 years.
From feedingwater
From irrigation other Nuclides
Foodstuffs(Bq/kg freshweight)
- All foodstuffs- 15 individualfoodstuffs
- All foodstuffs- 33 individualfoodstuffs
- Drinking water- Fish
- Sum of nuclides- All nuclides- All nuclide groups- Individual nuclidegroups- Up to 15 individualnuclides
Feedstuffs(Bq/kg freshweight)
- All feedstuffs- 4 individualfeedstuffs
- All feedstuffs- 21 individualfeedstuffs
- - Sum of nuclides- All nuclides- All nuclide groups- Individual nuclidegroups- Up to 15 individualnuclides
Table 1: Activities (maps + time plots)

Nuclides Age groups Organs
Ingestion1
(mSv)As foractivities
1a, 5a, 10a,15a, adults
Up to 11 organs +effective dose
1 from: feeding water, irrigation, other foodstuffs, for details see previous table
Table 2: Doses (individual + collective, time plots)
The selection in 'Activities in feedstuffs - feeding water' and in'Activities in feedstuffs - irrigation' determines which feedstuffs will becalculated and listed in the Graphical system under '/ Maps/ Activities in/'and/or '/ Time plots/ Activities in/'.
The selection in 'Activities in foodstuffs - feeding water', 'Activities infoodstuffs - irrigation' and in 'Activities in foodstuffs - otherfoodstuffs' determines which foodstuffs will be calculated and listed under '/Maps/ Activities in/' and/or '/ Time plots/ Activities in/'.
The selection in 'Acitivities: Selection of nuclide' determines for whichnuclides all calculations for acitivities in FDMA are made. For each of theresults in the graphical output (as described above) the list of nuclides isadded, e.g. '/ Maps/ Activities in/ milk/ from irrigation/ Cs-137/' and/or '/Maps/ Activities in/ milk/ from irrigation/ I-131/' etc.
The selection in 'Ingestion dose - feeding water', 'Ingestion dose -irrigation' and in 'Ingestion dose - other foodstuffs' determines whichfoodstuffs will be used to calculate ingestion doses and to list the resultsunder '/ Maps/ Doses from/ ingestion/ milk/ from irrigation/' etc.
The selection in 'Ingestion doses - nuclide selection' determines forwhich nuclides all dose calculations in FDMA are made. For each of theresults in the graphical output (as described above) the list of nuclides isadded, e.g. '/ Maps/ Doses from/ ingestion/ milk/ Cs-137/' and/or '/Maps/ Doses from/ ingestion/ milk/ I-131/' etc.
A selection in 'Selection of interface data' does not result in a graphicaloutput, but is necessary if a run of LCMA or DCM should be based on theresults of the actual run of FDMA!
If no selections are made in the Initialization Windows, FDMA uses thedefault settings of the automatic mode!
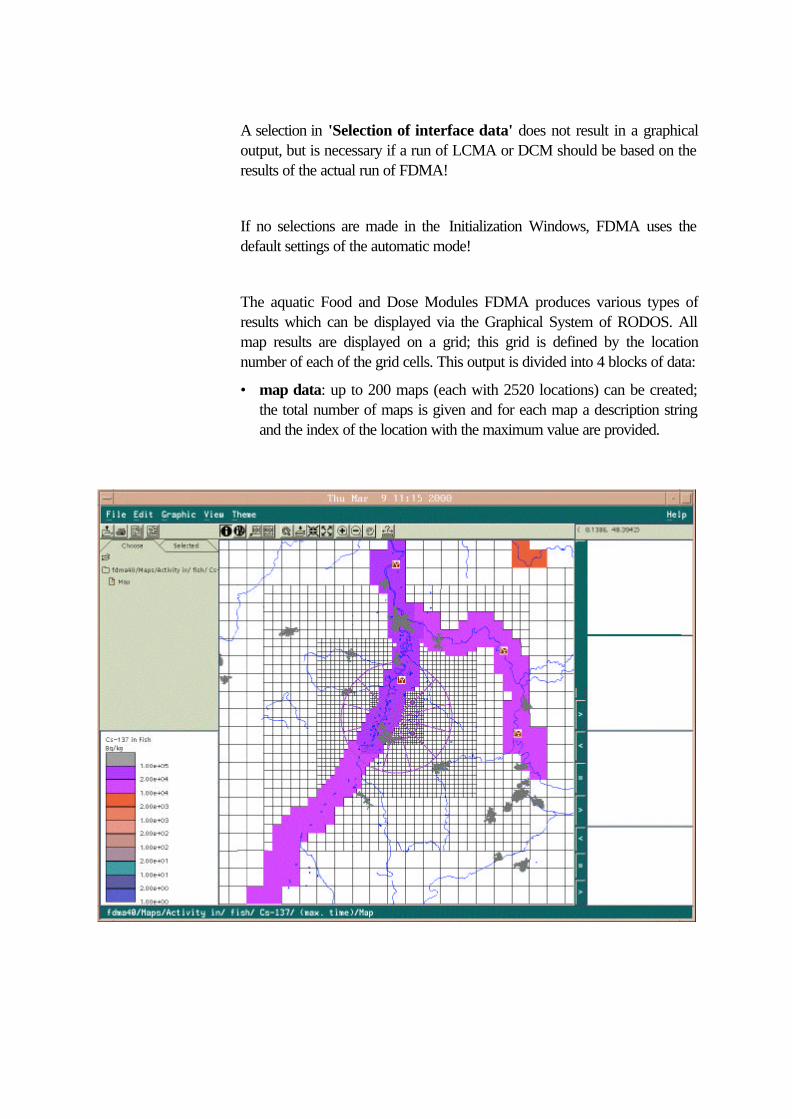
The aquatic Food and Dose Modules FDMA produces various types ofresults which can be displayed via the Graphical System of RODOS. Allmap results are displayed on a grid; this grid is defined by the locationnumber of each of the grid cells. This output is divided into 4 blocks of data:
• map data: up to 200 maps (each with 2520 locations) can be created;the total number of maps is given and for each map a description stringand the index of the location with the maximum value are provided.

• time plot data: up to 200 time dependency plots (each with up to 56time steps) can be created; the total number of plots is given and for eachtime plot a description string, the number, values and unit of the timesteps and the index of the time step with the maximum value areprovided.
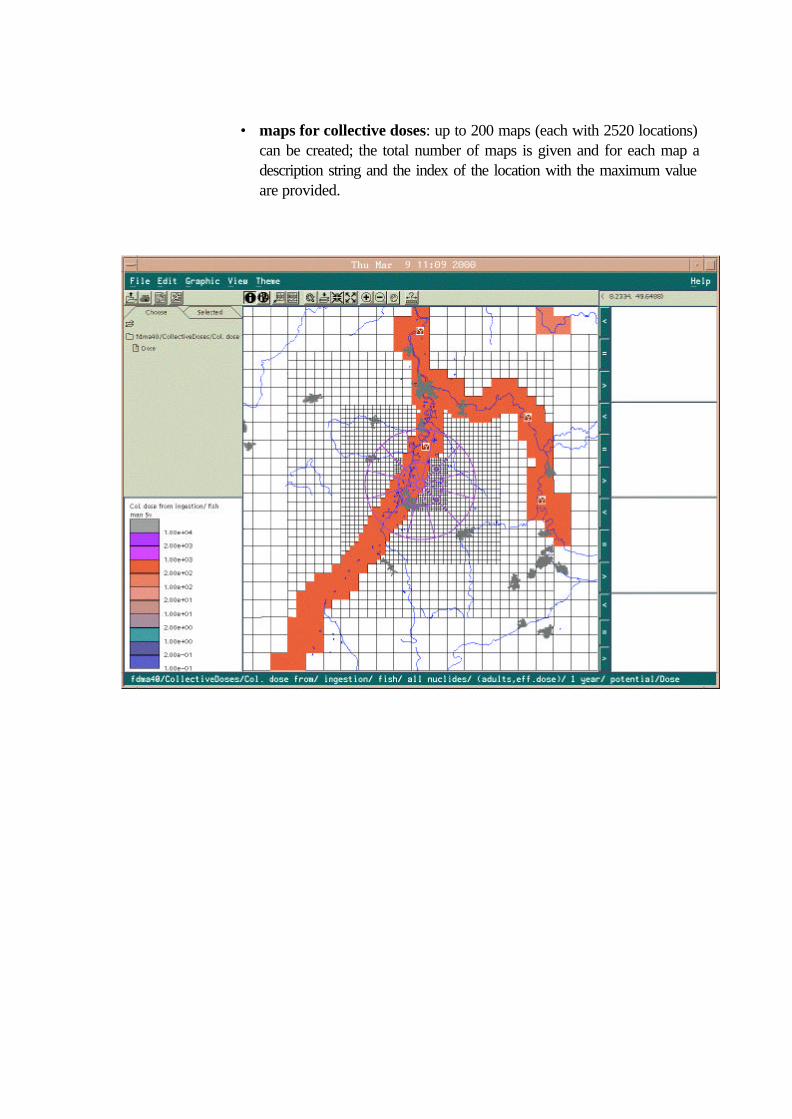
• maps for collective doses: up to 200 maps (each with 2520 locations)can be created; the total number of maps is given and for each map adescription string and the index of the location with the maximum valueare provided.
5.1.2 Default results
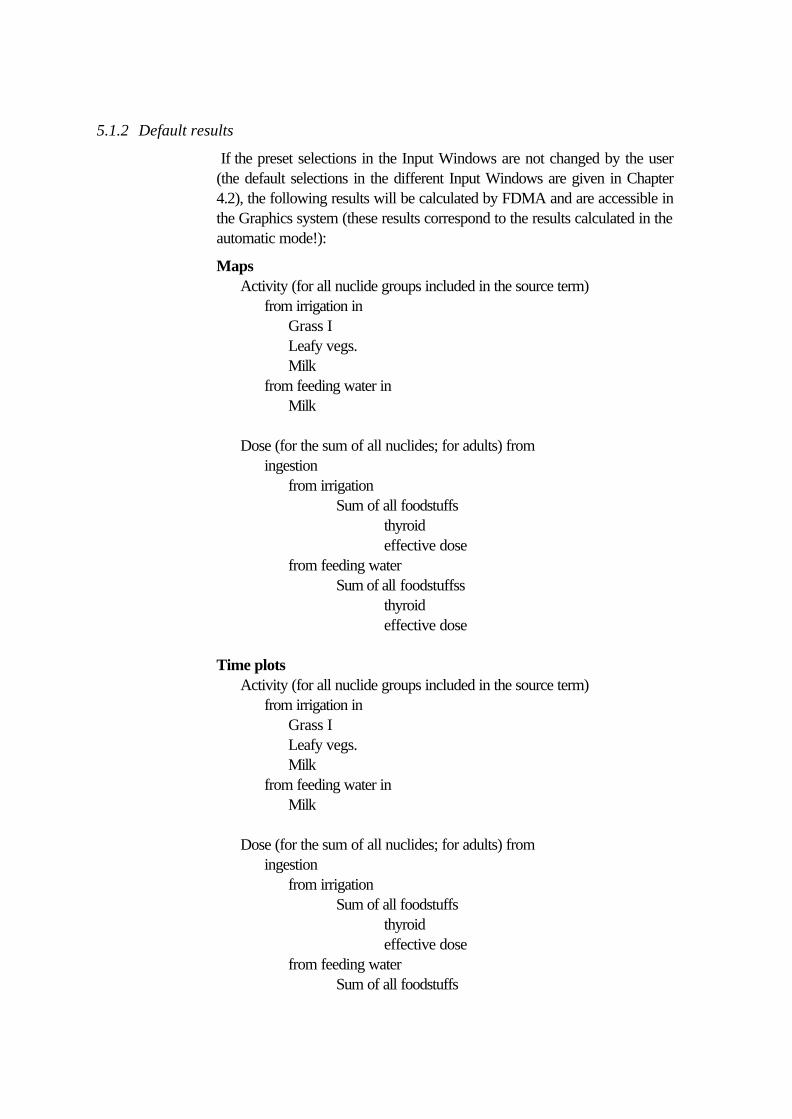
If the preset selections in the Input Windows are not changed by the user(the default selections in the different Input Windows are given in Chapter4.2), the following results will be calculated by FDMA and are accessible inthe Graphics system (these results correspond to the results calculated in theautomatic mode!):
MapsActivity (for all nuclide groups included in the source term)
from irrigation inGrass ILeafy vegs.Milk
from feeding water inMilk
Dose (for the sum of all nuclides; for adults) fromingestion
from irrigationSum of all foodstuffs
thyroideffective dose
from feeding waterSum of all foodstuffss
thyroideffective dose
Time plotsActivity (for all nuclide groups included in the source term)
from irrigation inGrass ILeafy vegs.Milk
from feeding water inMilk
Dose (for the sum of all nuclides; for adults) fromingestion
from irrigationSum of all foodstuffs
thyroideffective dose
from feeding waterSum of all foodstuffs

thyroideffective dose
5.2 Interface data
FDMA produces data needed by other modules of RODOS:
• the Aquatic Long Term Countermeasure Module LCMA
• the Dose Combination Module DCM
These interface data are calculated only if the according selection was madein the "Interface data"-window.
Detailed descriptions of these interfaces are given in the FDMAdocumentation.
5.2.1 FDMA - LCMA interface
For estimation of the effect of countermeasures the following data areproduced for the Long Term Countermeasure Module LCMA:
• Specific activities in processed feedstuffs resulting from contaminatedfeeding and irrigation water, for all water sources.
• Specific activities in foodstuffs, resulting from contaminated feeding andirrigation water, for all water sources.
• Specific activities in drinking water, for all drinking water sources.
• Specific activities in fish for all fish sources.
In addition, several other model and program steering parameters areincluded in the interface. A complete description of the FDMA-LCMAinterface is given in chapter 3.2.2 of the FDMA documentation(RODOS(WG3)-TN(99)-10).
5.2.2 FDMA - DCM interface
For summing up doses estimated by FDMA with doses from other food anddose modules, the following doses (effective dose integrated from time ofdeposition up to 7 different points in time, for 7 different population groups)are produced:
• Ingestion doses resulting from contamination of animal feeding water.
• Ingestion doses resulting from contamination of irrigation water.
• Ingestion doses from drinking water consumption
• Ingestion doses from fish consumption
A complete description of the FDMA-DCM interface is given in chapter3.2.2 of the FDMA documentation (RODOS(WG3)-TN(99)-10).

6 Error Correction Procedures
General error messages
read-error = nn in file filnam
An error occured when reading data from an ASCII file. nn is aFORTRAN error code (see FORTRAN manual). filnam is thename of the file to be read.
not enough data in file filnam
An error occured when reading data from an ASCII file. Therequired data were not found before end-of-file. filnam is thename of the file to be read.
Error in subroutine RADIOHT: cant open file "halflifes"!
The file '...data/fdm/isotopes/halflifes' in which the halflifes of allisotopes are given, could not be opened.
Error in subroutine RADIOHT: nuclide nuclide not available in data baseThe nuclide nuclide could not be found in the file'...data/fdm/isotopes/halflifes'
Error in subroutine CHKDAT: Date dd.mm.yyyy hh:mm isincorrectThe date of the begin of the release (transferred from theRODOS system via shared memory in the form dd.mm.yyyyhh:mm ) is given in a wrong way.
Error in subroutine SCANREG: Too many radioecological regions neededThe radioecological regions needed to consider the givenlocations (grid points) exceed the maximum possible number (atpresent 5). Coarser radioecological regions have to be defined inorder to cover the whole area.
Error in subroutine NUCCONV: nuclide nucnam not available in data base
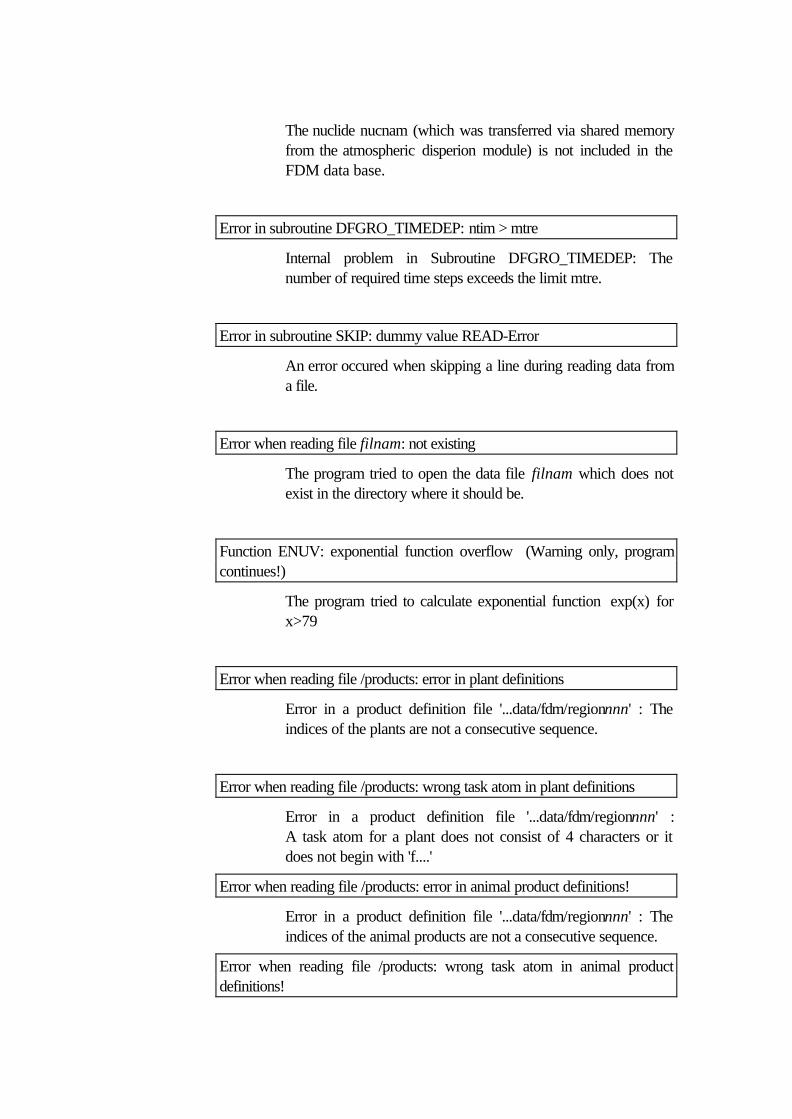
The nuclide nucnam (which was transferred via shared memoryfrom the atmospheric disperion module) is not included in theFDM data base.
Error in subroutine DFGRO_TIMEDEP: ntim > mtre
Internal problem in Subroutine DFGRO_TIMEDEP: Thenumber of required time steps exceeds the limit mtre.
Error in subroutine SKIP: dummy value READ-Error
An error occured when skipping a line during reading data froma file.
Error when reading file filnam: not existing
The program tried to open the data file filnam which does notexist in the directory where it should be.
Function ENUV: exponential function overflow (Warning only, programcontinues!)
The program tried to calculate exponential function exp(x) forx>79
Error when reading file /products: error in plant definitions
Error in a product definition file '...data/fdm/regionnnn' : Theindices of the plants are not a consecutive sequence.
Error when reading file /products: wrong task atom in plant definitions
Error in a product definition file '...data/fdm/regionnnn' :A task atom for a plant does not consist of 4 characters or itdoes not begin with 'f....'
Error when reading file /products: error in animal product definitions!
Error in a product definition file '...data/fdm/regionnnn' : Theindices of the animal products are not a consecutive sequence.
Error when reading file /products: wrong task atom in animal productdefinitions!
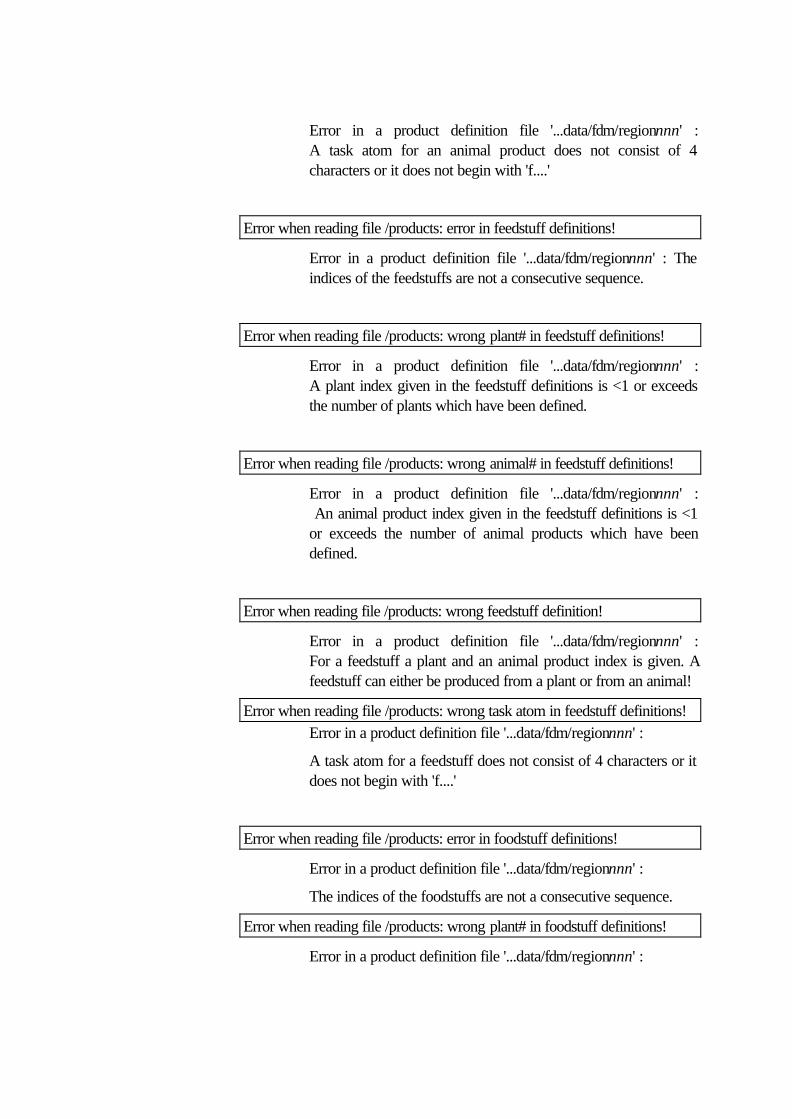
Error in a product definition file '...data/fdm/regionnnn' :A task atom for an animal product does not consist of 4characters or it does not begin with 'f....'
Error when reading file /products: error in feedstuff definitions!
Error in a product definition file '...data/fdm/regionnnn' : Theindices of the feedstuffs are not a consecutive sequence.
Error when reading file /products: wrong plant# in feedstuff definitions!
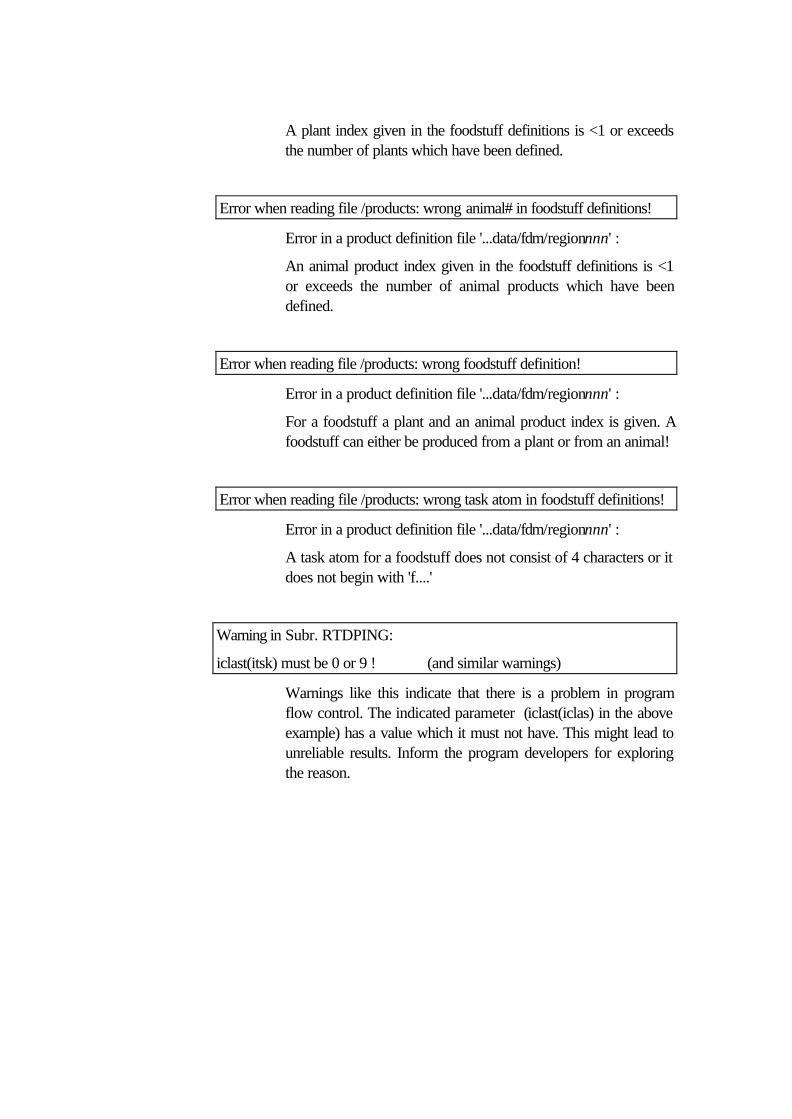
Error in a product definition file '...data/fdm/regionnnn' :A plant index given in the feedstuff definitions is <1 or exceedsthe number of plants which have been defined.
Error when reading file /products: wrong animal# in feedstuff definitions!
Error in a product definition file '...data/fdm/regionnnn' : An animal product index given in the feedstuff definitions is <1or exceeds the number of animal products which have beendefined.
Error when reading file /products: wrong feedstuff definition!
Error in a product definition file '...data/fdm/regionnnn' :For a feedstuff a plant and an animal product index is given. Afeedstuff can either be produced from a plant or from an animal!
Error when reading file /products: wrong task atom in feedstuff definitions!Error in a product definition file '...data/fdm/regionnnn' :
A task atom for a feedstuff does not consist of 4 characters or itdoes not begin with 'f....'
Error when reading file /products: error in foodstuff definitions!
Error in a product definition file '...data/fdm/regionnnn' :
The indices of the foodstuffs are not a consecutive sequence.
Error when reading file /products: wrong plant# in foodstuff definitions!
Error in a product definition file '...data/fdm/regionnnn' :
A plant index given in the foodstuff definitions is <1 or exceedsthe number of plants which have been defined.
Error when reading file /products: wrong animal# in foodstuff definitions!
Error in a product definition file '...data/fdm/regionnnn' :
An animal product index given in the foodstuff definitions is <1or exceeds the number of animal products which have beendefined.
Error when reading file /products: wrong foodstuff definition!
Error in a product definition file '...data/fdm/regionnnn' :
For a foodstuff a plant and an animal product index is given. Afoodstuff can either be produced from a plant or from an animal!
Error when reading file /products: wrong task atom in foodstuff definitions!
Error in a product definition file '...data/fdm/regionnnn' :
A task atom for a foodstuff does not consist of 4 characters or itdoes not begin with 'f....'
Warning in Subr. RTDPING:
iclast(itsk) must be 0 or 9 ! (and similar warnings)
Warnings like this indicate that there is a problem in programflow control. The indicated parameter (iclast(iclas) in the aboveexample) has a value which it must not have. This might lead tounreliable results. Inform the program developers for exploringthe reason.
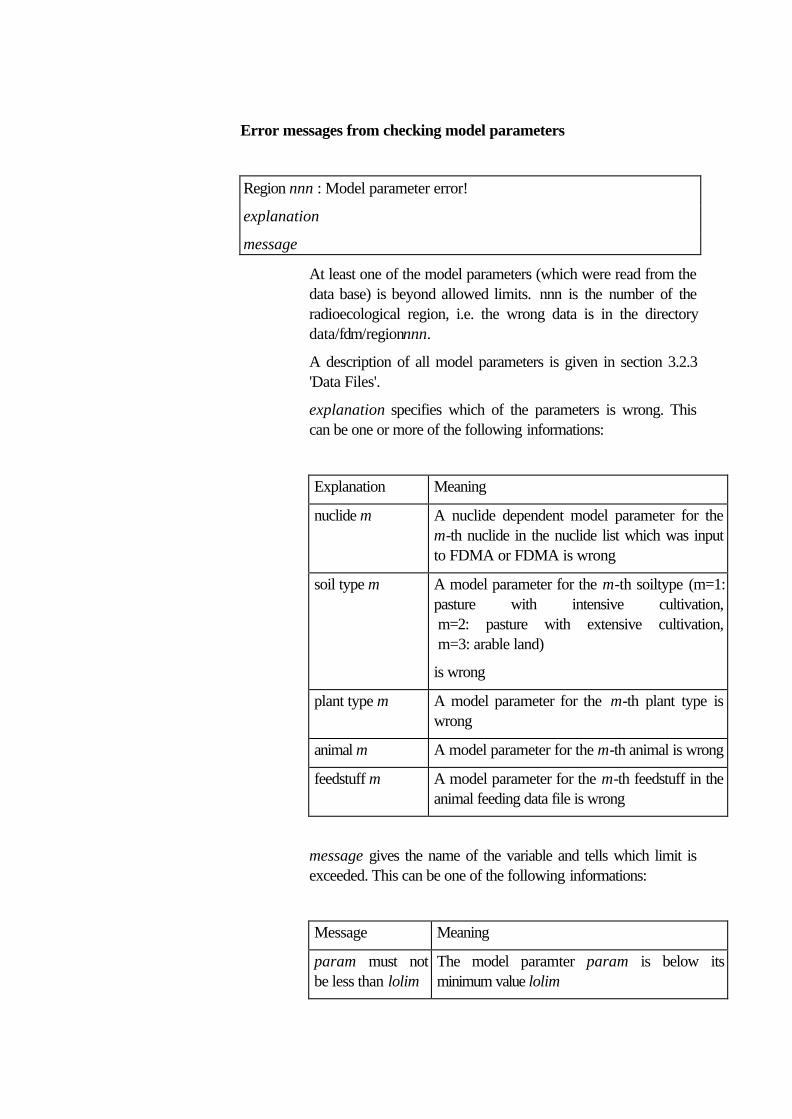
Error messages from checking model parameters
Region nnn : Model parameter error!
explanation
message
At least one of the model parameters (which were read from thedata base) is beyond allowed limits. nnn is the number of theradioecological region, i.e. the wrong data is in the directorydata/fdm/regionnnn.
A description of all model parameters is given in section 3.2.3'Data Files'.
explanation specifies which of the parameters is wrong. Thiscan be one or more of the following informations:
Explanation Meaning
nuclide m A nuclide dependent model parameter for them-th nuclide in the nuclide list which was inputto FDMA or FDMA is wrong
soil type m A model parameter for the m-th soiltype (m=1:pasture with intensive cultivation, m=2: pasture with extensive cultivation, m=3: arable land)
is wrong
plant type m A model parameter for the m-th plant type iswrong
animal m A model parameter for the m-th animal is wrong
feedstuff m A model parameter for the m-th feedstuff in theanimal feeding data file is wrong
message gives the name of the variable and tells which limit isexceeded. This can be one of the following informations:
Message Meaning
param must notbe less than lolim
The model paramter param is below itsminimum value lolim
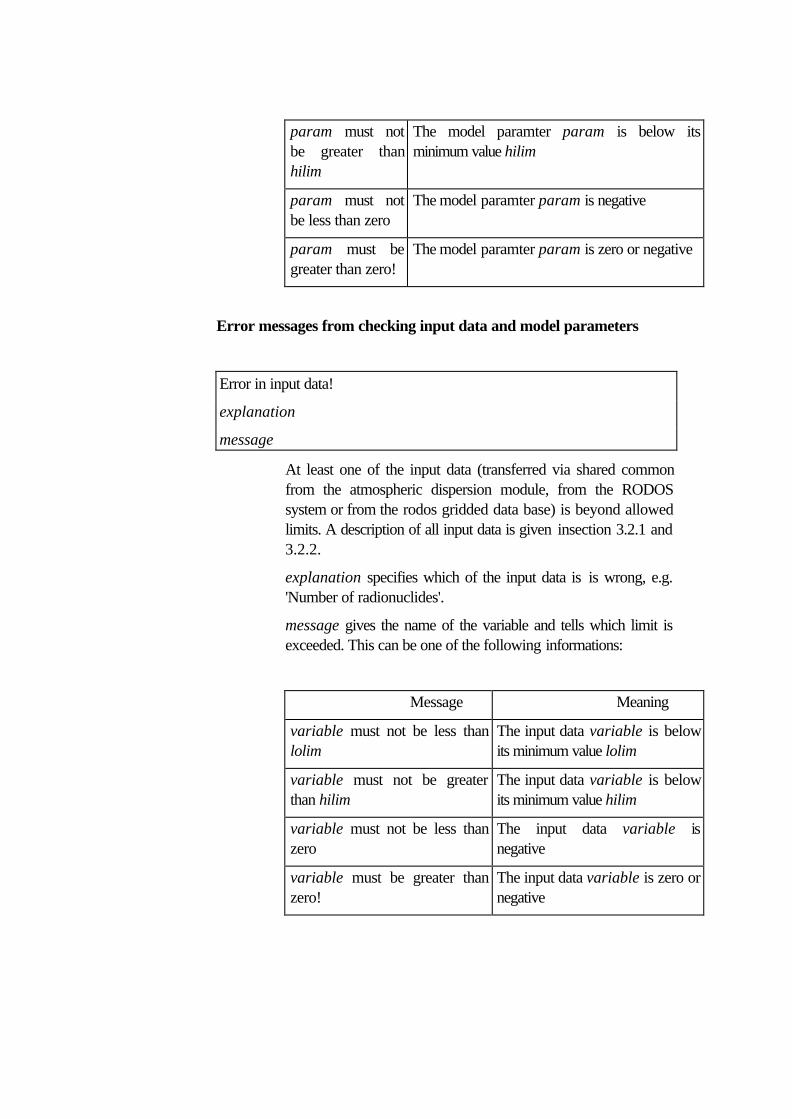
param must notbe greater thanhilim
The model paramter param is below itsminimum value hilim
param must notbe less than zero
The model paramter param is negative
param must begreater than zero!
The model paramter param is zero or negative
Error messages from checking input data and model parameters
Error in input data!
explanation
message
At least one of the input data (transferred via shared commonfrom the atmospheric dispersion module, from the RODOSsystem or from the rodos gridded data base) is beyond allowedlimits. A description of all input data is given insection 3.2.1 and3.2.2.
explanation specifies which of the input data is is wrong, e.g.'Number of radionuclides'.
message gives the name of the variable and tells which limit isexceeded. This can be one of the following informations:
Message Meaning
variable must not be less thanlolim
The input data variable is belowits minimum value lolim
variable must not be greaterthan hilim
The input data variable is belowits minimum value hilim
variable must not be less thanzero
The input data variable isnegative
variable must be greater thanzero!
The input data variable is zero ornegative

Error messages from checking input tasklist
Error: ⇒ Routine: TASKANA
⇒ TASK: errorneous task
⇒ TASK Number: number of erroneous task
⇒ Warning: warning
At least one of the taskatoms with the key characters ‘x’, ‘c’ or‘g’ are erroneous.warning specifies the parameter classes of the erroneous code,and the type of error. This can be done by one or more of thefollowing information:
Warning: input task starts with wrong key parameter: task ignored!
For results: 1st taskatom does not start with ‘c’for interfaces: 1st taskatom does not start with’x’
Warning: data class not identified
‘c’-taskatom is not identified
Warning: graphical output type not identified
‘g’-taskatom is not identified
Error: ⇒ Routine: TASKEX
⇒ TASK: erroneous task
⇒ TASK Number: number of erroneous task
⇒ Warning: warning
warning specifies the type of error in the respective input task.
Warning: unidentified code
At least one of the taskatoms with the key characters ‘i’, ‘t’, ‘e’,‘n, ‘l’, ‘0’, ‘1’, ‘p’, ‘a’, ‘o’, or ‘m’ are erroneous.
Warning: global parameter must not be combined with otherparameter

A global and a special parameter of at least one parameter classis used.

7 Glossary
In this glossary a lot of terms appearing in this paper are defined, furtherexplained, related to other terms or provided with a list of possible values.Terms appearing in the explanation of another term of the glossary arewritten in italics.
Collective dose
The calculation of collective doses for all exposure pathways besidesingestion of contaminated foodstuffs is based on expected time integrateddoses of adults at the locations and the number of people related to thelocations.
The calculation of collective doses from ingestion of contaminatedfoodstuffs is based on the potential specific activities in raw foodstuffs atthe locations, the amount of foodstuffs related to the locations and theeffective dose factors of adults for ingestion.
Since the interpretation of the spatial dimension is different for both types ofcalculations, it is not possible to add up these types of collective doses.
Consumption rate
Amount of foodstuffs consumed per day by humans. The data used areaverage values for the age groups considered. Time dependent values arecreated by linear interpolation of the data for the age groups.
Dose factors
The dose factors used in the calculation of the internal exposure frominhalation and ingestion were calculated using the NRPB internal dosimetryprogram PLEIADES, which is consistent with publications ICRP-68,ICRP-72, and IAEA BSS
Feedstuff
Product consumed by animals. The feedstuffs which may be considered atpresent are given in the list below. At present, the only possible feedstuff inthe aquatic mode is feeding water; all other feedstuffs except feeding watercan be used in the terrestrial mode only:
grass/hay (intensivecultivation)grass/hay(extensive cultivation)
maizemaize bulbspotatoesbeets
beet leaveswinter barleyspring barleywinter wheatspring wheatryeoats
distilling residuesbrewing residuesskim milkwhole milk substitutewhey (rennet)whey (acid)feeding water
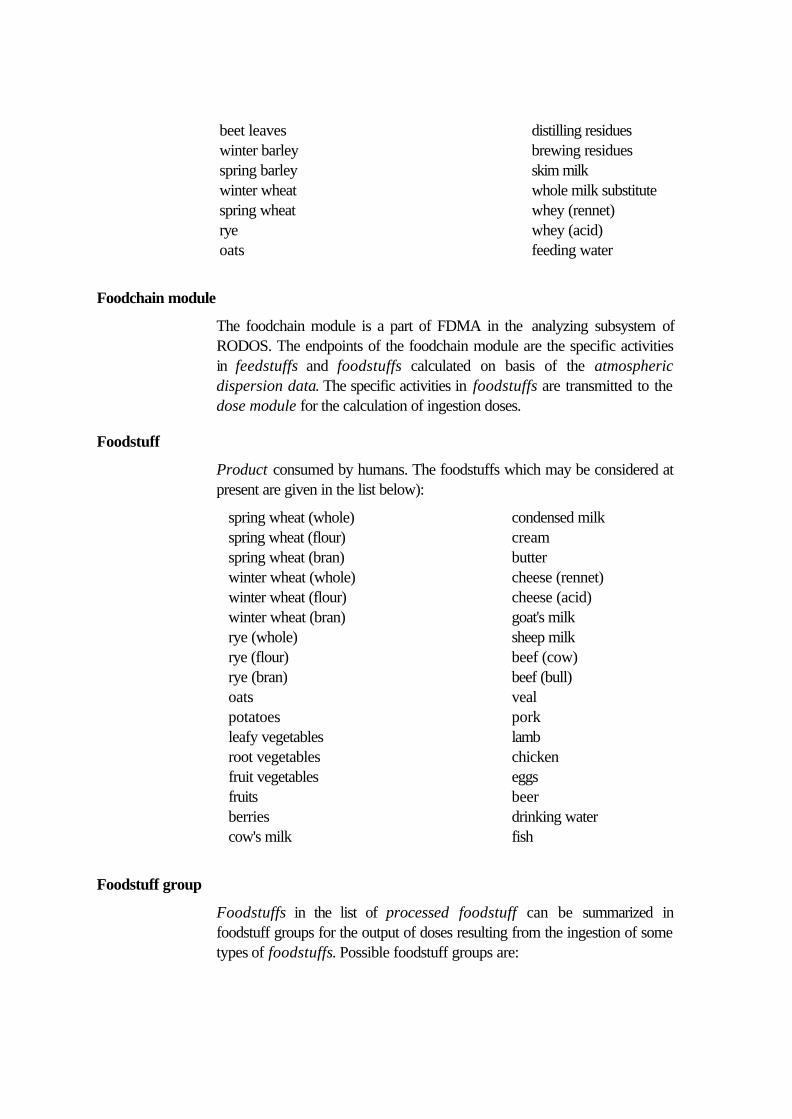
Foodchain module
The foodchain module is a part of FDMA in the analyzing subsystem ofRODOS. The endpoints of the foodchain module are the specific activitiesin feedstuffs and foodstuffs calculated on basis of the atmosphericdispersion data. The specific activities in foodstuffs are transmitted to thedose module for the calculation of ingestion doses.
Foodstuff
Product consumed by humans. The foodstuffs which may be considered atpresent are given in the list below):
spring wheat (whole)spring wheat (flour)spring wheat (bran)winter wheat (whole)winter wheat (flour)winter wheat (bran)rye (whole)rye (flour)rye (bran)oatspotatoesleafy vegetablesroot vegetablesfruit vegetablesfruitsberriescow's milk
condensed milkcreambuttercheese (rennet)cheese (acid)goat's milksheep milkbeef (cow)beef (bull)vealporklambchickeneggsbeerdrinking waterfish
Foodstuff group
Foodstuffs in the list of processed foodstuff can be summarized infoodstuff groups for the output of doses resulting from the ingestion of sometypes of foodstuffs. Possible foodstuff groups are:

plant productsanimal productsvegetablesgrain and grain productsmilk and milk productsmeat
Location
A spatial unit for which hydro data are given in the input interface. Thedata arrays are designed for analysis of 2520 locations according to thedimension of the dynamic grid of RODOS. However, the spatial distributionof locations as well as their interpretation is not subject of the foodchainmodule or the dose module. Of course, all the input interface data relatedto locations must be related to the same spatial units.
In addition to a normal selection of locations, the location with the highestdeposition or the highest dose may be chosen.
Long term ...
'Long term' is related to an analysis of specific activities, doses or dose ratesduring a time interval between the beginning of a deposition event up to100 years after deposition with a time resolution not better than one day. Along term analysis is made for the exposure pathway ingestion ofcontaminated foodstuffs including the evaluation of specific activities infeedstuffs and foodstuffs.
Nuclide
In the foodchain transport module and in the ingestion dose calculation, upto 10 nuclides may be considered. The following nuclides may be includedin the calculation:
Ag 110mAm 241Ba 140Ce 141, Ce 143, Ce 144Cm 242, Cm 244Co 57, Co 58, Co 60Cr 51Cs 134, Cs 136, Cs 137, Cs 138Fe 59I 129, I 131, I 132, I 133, I 134, I 135Kr 85m, Kr 87, Kr 88La 140

Mn 54Mo 99Na 24Nb 95Nd 147Np 239Pr 143Pu 238, Pu 239, Pu 240, Pu 241Rb 86, Rb 88Rh 105Ru 103, Ru 105, Ru 106Sb 127, Sb 129Sr 89, Sr 90, Sr 91, Sr 92Tc 99mTe 127m, Te 127,Te 129m, Te 129, Te 131, Te 131m, Te 132Te 133m Te 133, Te 134Xe 133, Xe 135, Xe 138Y 90, Y 91Zn 65Zr 95, Zr 97
Nuclide group
According to the limits of specific activities in the EC-regulations, nuclidesare divided into the groups iodine isotopes, strontium isotopes, alphaemitters and other long lived radionuclides with a half life of more than 10days. In the last group, the cesium isotopes Cs-134 and Cs-137 aresupposed to be of greatest importance, therefore, this group is denoted'cesium isotopes' in this paper.
Processed product
Feedstuff or foodstuff taking into account a minimum storage time and anenrichment or dilution of activity due to processing. A minimum value,presently set to 6 hours, is applied in the calculation of activities inprocessed products.
Product
Generic term for feedstuffs and foodstuffs. Both types of products aresubdivided into raw products and processed products.
Raw product
Feedstuff or foodstuff without consideration of a minimum storage timeand an enrichment or dilution of activity due to processing.
Region
Area for which the model parameters (e.g. growing times of crops, feedinghabits, human consumption habits) are assumed to be constant. Theparameters defined for a region are applied for all locations which arelocated within this radioecological region.
Results
Endpoints of the automatic mode and the interactive mode of the systemto be presented to the user in order to describe the radiological situation.Results are subdivided into maps of specific activities and individual doses,time dependency plots, maps of collective doses and frequencydistributions.
Time resolution
The result vectors showing the time dependency of a dose or a specificactivity are given with 'high' time resolution. This comprises 56 time stepswith variable time resolution:
each day of week 1 and 2,end of week 3, 4, 5, 6, 7, 8, (7 days a week)end of each month from 3 to 24, (30 days a month)end of year 3, 4, 5, 10, 20, 30, 40, 50, 60, 70, 80, 90 and 100.
Units
Specific activities in feedstuffs and foodstuffs are given in [Bq/kg], timeintegrated specific activities in [Bqd/kg], time integrated doses in [mSv],dose rates in [mSv/h] and collective doses in [manSv].

Document HistoryDocument Title: Chapter of the RODOS PV4.0 User Guide for the Aquatic Food
Chain and Dose Module FDMAVersion and status: Version 1.0Authors/Editors: Florian Gering, Stephan Hübner, Heinz MüllerAddress: GSF - Institut für Strahlenschutz, Ingolstädter Landstr. 1,
D-85764 NeuherbergEmail: [email protected] by: W. RaskobCirculation:File Name: FdmaUGui.docDate of print: March 19, 2002