chapter iv research findings and discussions a. 1.digilib.iain-palangkaraya.ac.id/315/5/chapter iv...
TRANSCRIPT
58
CHAPTER IV
RESEARCH FINDINGS AND DISCUSSIONS
In this chapter, the writer presented the data which had been collected from
the research in the field of study. The data were the result of pretest of
experimental and control group, the result of posttest of experimental and control
group, result of data analysis, and discussion.
A. Data Presentation
1. The Result of Pre Test Scores of the Experimental and Control Group
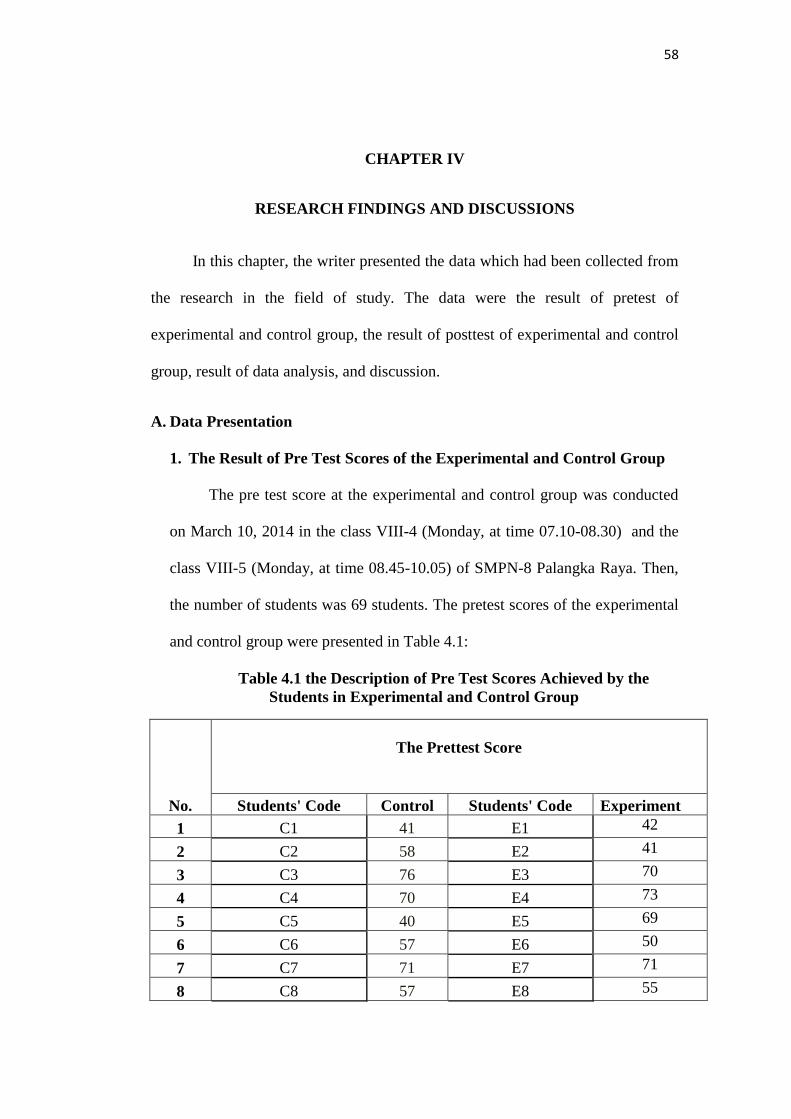
The pre test score at the experimental and control group was conducted
on March 10, 2014 in the class VIII-4 (Monday, at time 07.10-08.30) and the
class VIII-5 (Monday, at time 08.45-10.05) of SMPN-8 Palangka Raya. Then,
the number of students was 69 students. The pretest scores of the experimental
and control group were presented in Table 4.1:
Table 4.1 the Description of Pre Test Scores Achieved by the
Students in Experimental and Control Group
No.
The Prettest Score
Students' Code Control Students' Code Experiment
1 C1 41 E1 42
2 C2 58 E2 41
3 C3 76 E3 70
4 C4 70 E4 73
5 C5 40 E5 69
6 C6 57 E6 50
7 C7 71 E7 71
8 C8 57 E8 55
59
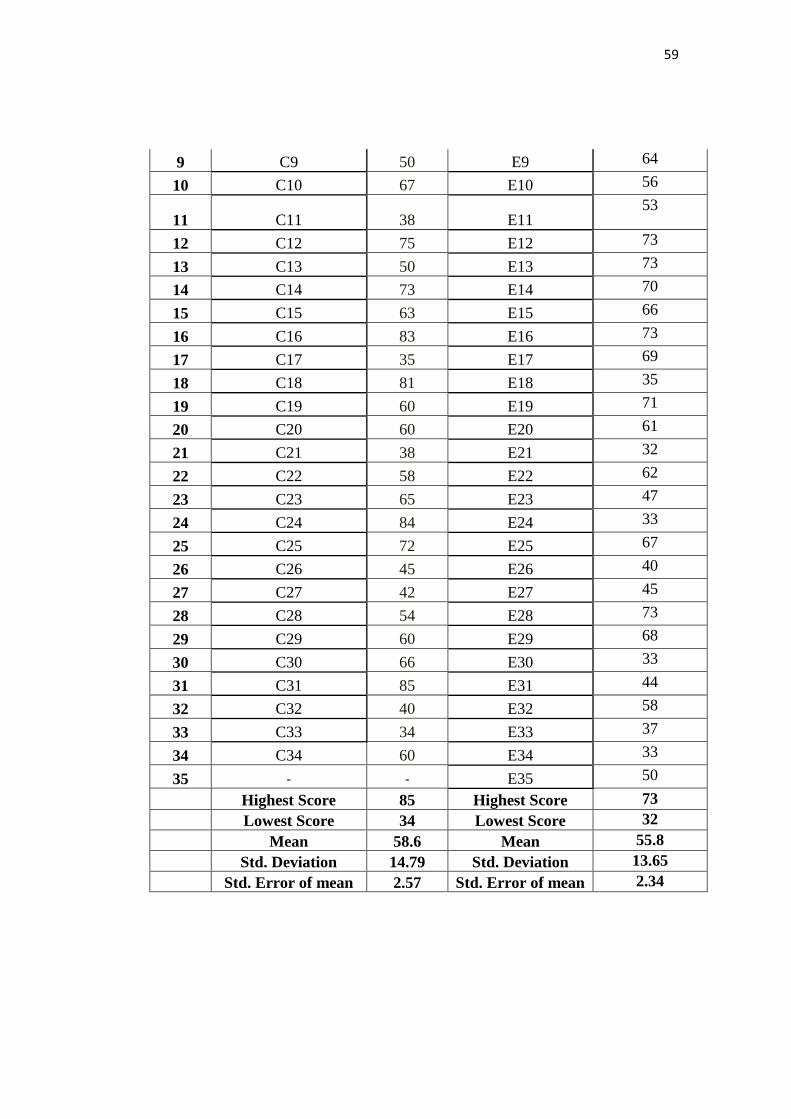
9 C9 50 E9 64
10 C10 67 E10 56
11 C11 38 E11 53
12 C12 75 E12 73
13 C13 50 E13 73
14 C14 73 E14 70
15 C15 63 E15 66
16 C16 83 E16 73
17 C17 35 E17 69
18 C18 81 E18 35
19 C19 60 E19 71
20 C20 60 E20 61
21 C21 38 E21 32
22 C22 58 E22 62
23 C23 65 E23 47
24 C24 84 E24 33
25 C25 72 E25 67
26 C26 45 E26 40
27 C27 42 E27 45
28 C28 54 E28 73
29 C29 60 E29 68
30 C30 66 E30 33
31 C31 85 E31 44
32 C32 40 E32 58
33 C33 34 E33 37
34 C34 60 E34 33
35 - - E35 50
Highest Score 85 Highest Score 73
Lowest Score 34 Lowest Score 32
Mean 58.6 Mean 55.8
Std. Deviation 14.79 Std. Deviation 13.65
Std. Error of mean 2.57 Std. Error of mean 2.34
60
Based on the data above, the writer calculated using manual calculation,
it could be seen that the students’ highest score at experimental group was 73
and the lowest score was 32. And also, it can be seen that the mean was 55.8,
the standard deviation was 13.65 and the standard error was 2.34 (see
appendix 7).
In addition, the result of pretest score in control group showed that the
highest score 85 and the lowest score was 34. The mean was 58.6, the standard
deviation was 14.79 and the standard error was 2.57 (see appendix 7).
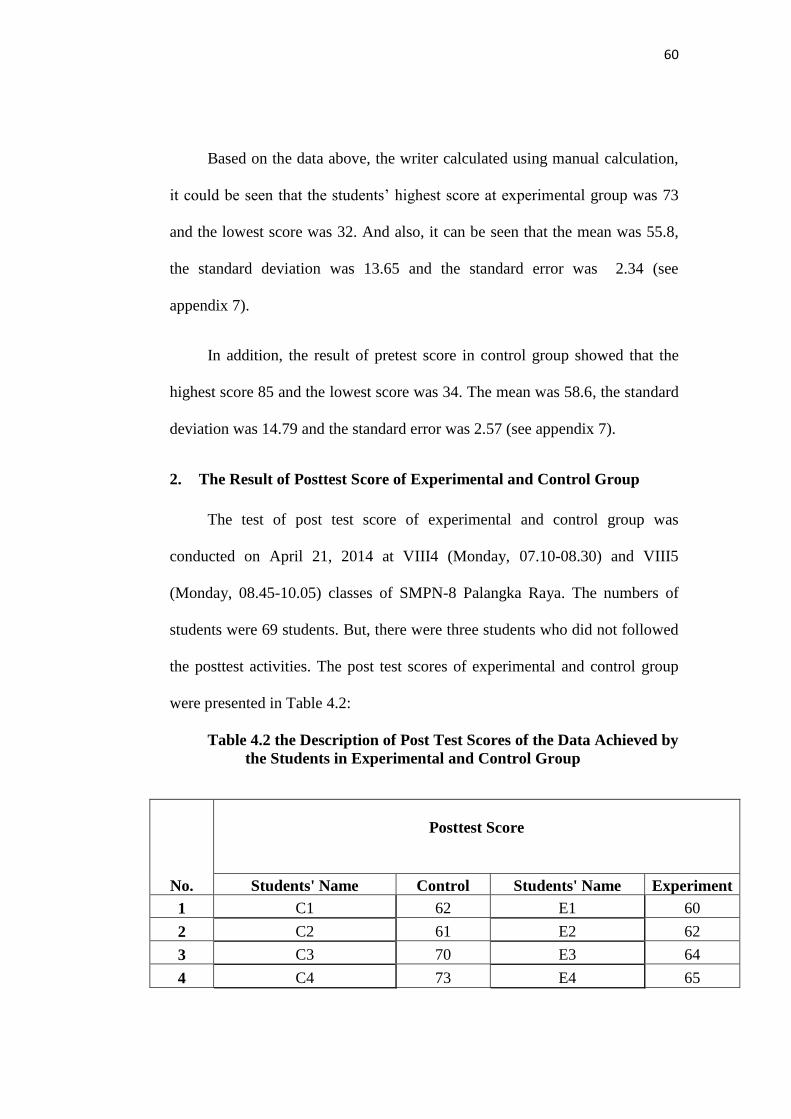
2. The Result of Posttest Score of Experimental and Control Group
The test of post test score of experimental and control group was
conducted on April 21, 2014 at VIII4 (Monday, 07.10-08.30) and VIII5
(Monday, 08.45-10.05) classes of SMPN-8 Palangka Raya. The numbers of
students were 69 students. But, there were three students who did not followed
the posttest activities. The post test scores of experimental and control group
were presented in Table 4.2:
Table 4.2 the Description of Post Test Scores of the Data Achieved by
the Students in Experimental and Control Group
No.
Posttest Score
Students' Name Control Students' Name Experiment
1 C1 62 E1 60
2 C2 61 E2 62
3 C3 70 E3 64
4 C4 73 E4 65
61
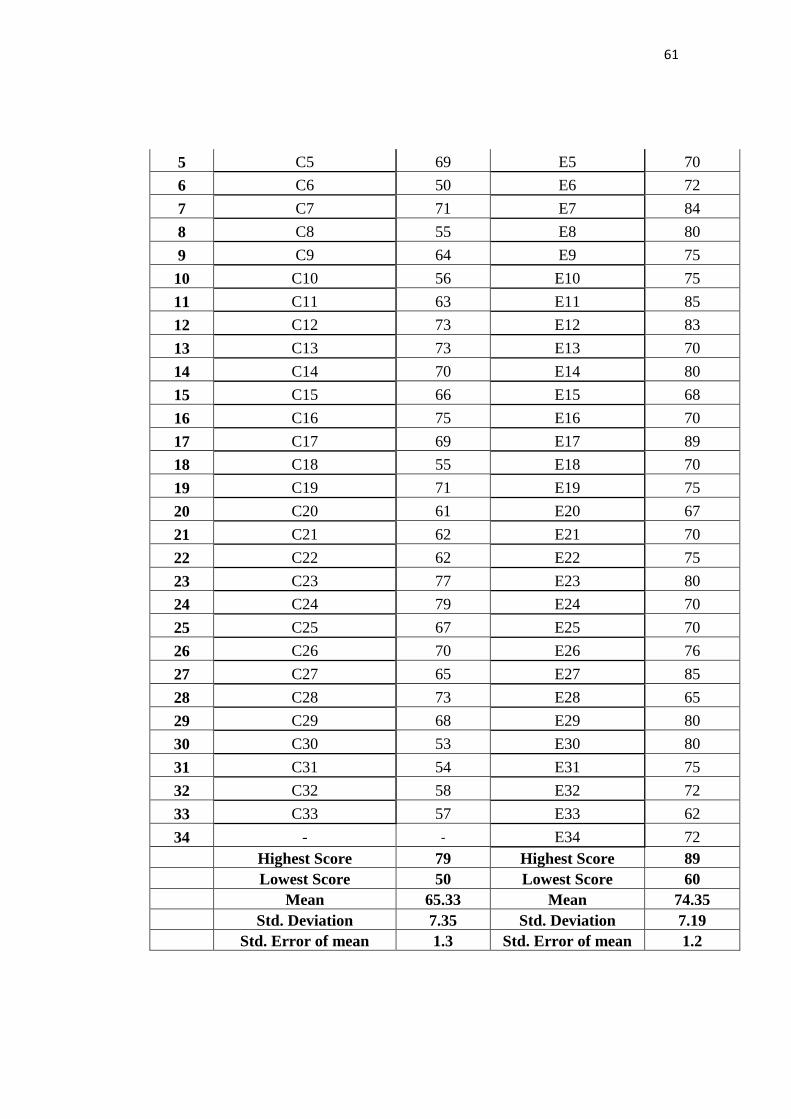
5 C5 69 E5 70
6 C6 50 E6 72
7 C7 71 E7 84
8 C8 55 E8 80
9 C9 64 E9 75
10 C10 56 E10 75
11 C11 63 E11 85
12 C12 73 E12 83
13 C13 73 E13 70
14 C14 70 E14 80
15 C15 66 E15 68
16 C16 75 E16 70
17 C17 69 E17 89
18 C18 55 E18 70
19 C19 71 E19 75
20 C20 61 E20 67
21 C21 62 E21 70
22 C22 62 E22 75
23 C23 77 E23 80
24 C24 79 E24 70
25 C25 67 E25 70
26 C26 70 E26 76
27 C27 65 E27 85
28 C28 73 E28 65
29 C29 68 E29 80
30 C30 53 E30 80
31 C31 54 E31 75
32 C32 58 E32 72
33 C33 57 E33 62
34 - - E34 72
Highest Score 79 Highest Score 89
Lowest Score 50 Lowest Score 60
Mean 65.33 Mean 74.35
Std. Deviation 7.35 Std. Deviation 7.19
Std. Error of mean 1.3 Std. Error of mean 1.2
62
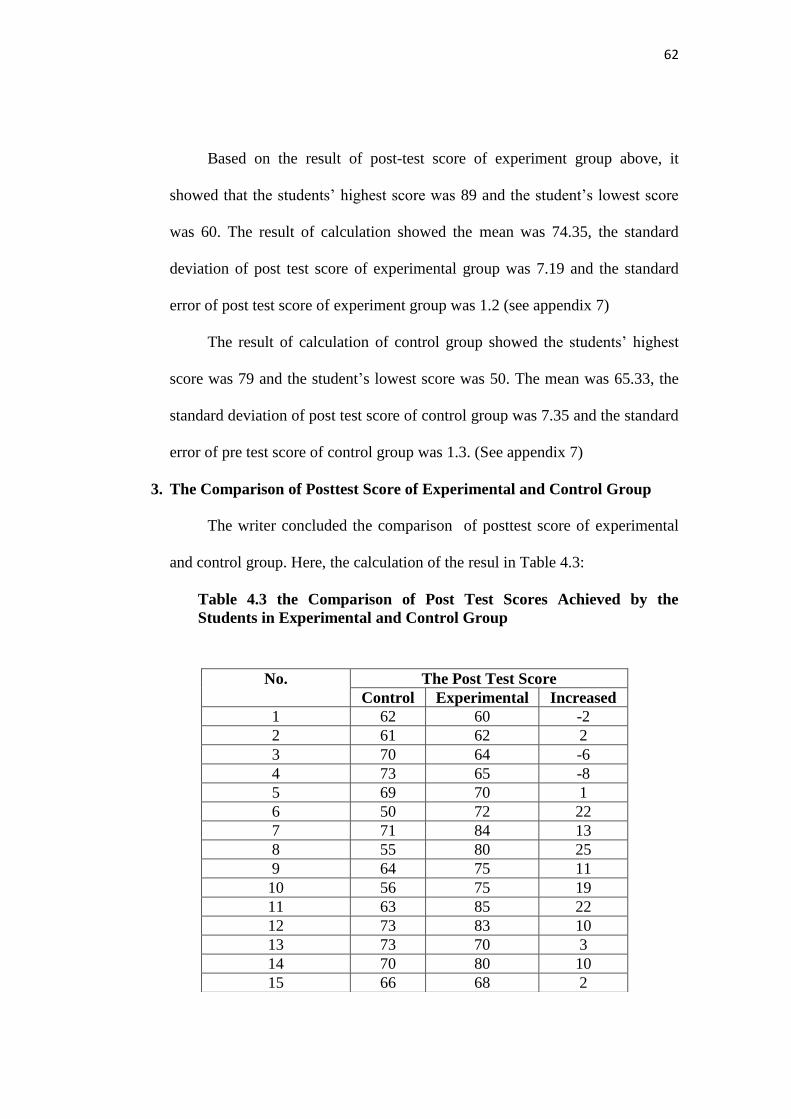
Based on the result of post-test score of experiment group above, it
showed that the students’ highest score was 89 and the student’s lowest score
was 60. The result of calculation showed the mean was 74.35, the standard
deviation of post test score of experimental group was 7.19 and the standard
error of post test score of experiment group was 1.2 (see appendix 7)
The result of calculation of control group showed the students’ highest
score was 79 and the student’s lowest score was 50. The mean was 65.33, the
standard deviation of post test score of control group was 7.35 and the standard
error of pre test score of control group was 1.3. (See appendix 7)
3. The Comparison of Posttest Score of Experimental and Control Group
The writer concluded the comparison of posttest score of experimental
and control group. Here, the calculation of the resul in Table 4.3:
Table 4.3 the Comparison of Post Test Scores Achieved by the
Students in Experimental and Control Group
No. The Post Test Score
Control Experimental Increased
1 62 60 -2
2 61 62 2
3 70 64 -6
4 73 65 -8
5 69 70 1
6 50 72 22
7 71 84 13
8 55 80 25
9 64 75 11
10 56 75 19
11 63 85 22
12 73 83 10
13 73 70 3
14 70 80 10
15 66 68 2
63
4. Testing the Normality and the Homogeneity
The writer was calculated the result of pre-test and post-test score
of experiment and control group by using SPSS 17.0 program. The criteria of
the normality test of score is the value of r (probability value/ critical value) is
the higher than or equal to the level of significance alpha defined (r ≥ǝ), it
means that the distribution is normal.1 Then, the homogeneity is used to know
the data were homogen or not.
1. The Normality of Pre Test and Post Test Score in Experiment and Control
Group
1 Budi Susetyo, M.Pd. , Statiska untuk Analisis Data Penelitian Dilengkapi Cara
Perhitungan dengan SPSS dan MS Word Exell, Bandung: PT. Refika Aditama, page: 145
16 75 70 -5
17 69 89 20
18 55 70 22
19 71 75 4
20 61 67 6
21 62 70 8
22 62 75 13
23 77 80 3
24 79 70 -9
25 67 70 3
26 70 76 6
27 65 85 20
28 73 65 -8
29 68 80 12
30 53 80 27
31 54 75 21
32 58 72 14
33 57 62 5
34 72 -
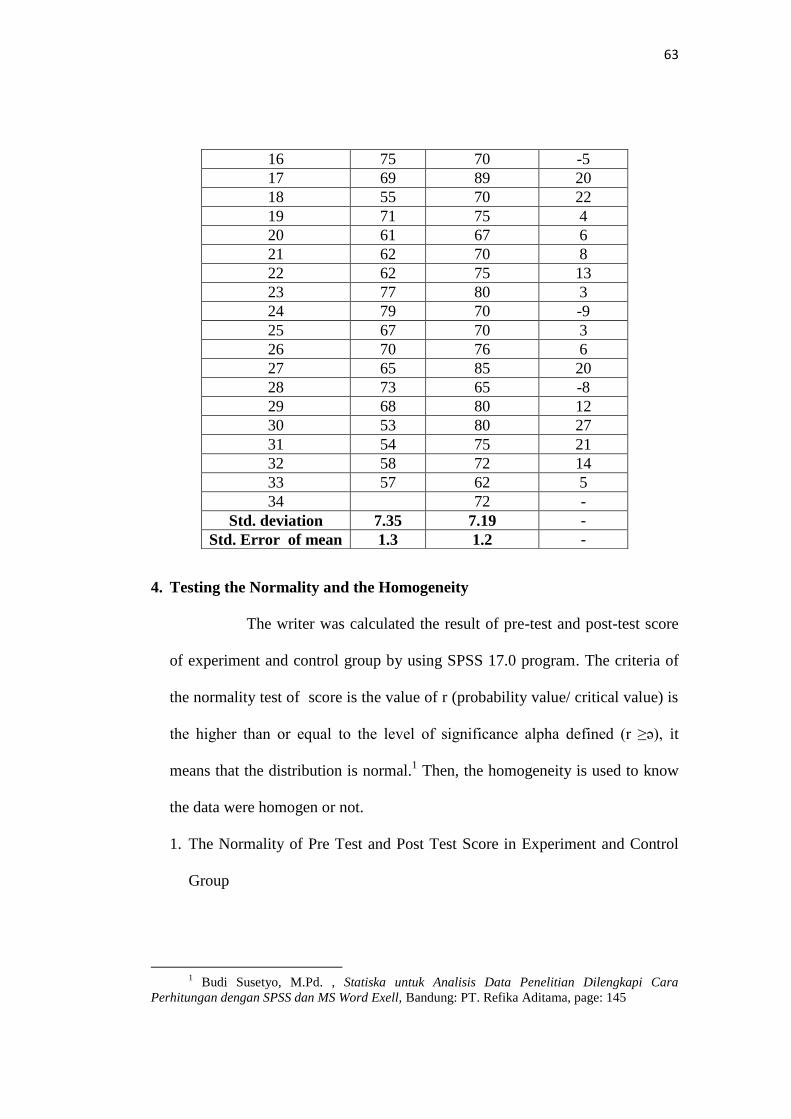
Std. deviation 7.35 7.19 -
Std. Error of mean 1.3 1.2 -
64
Table 4.4: The Test of Normality of Pretest Score
group
Kolmogorov-Smirnova Shapiro-Wilk
Statistic df Sig. Statistic df Sig.
score control .106 34 .200* .956 34 .186
experiment .156 35 .031 .888 35 .002
a. Lilliefors Significance Correction
*. This is a lower bound of the true significance.
Based on table of the Kolmogorov-Swirnov, the significance value of
control group was 0.200 and the significance value of experiment group was
0.031. The result of pretest score on Shapiro-Wilk table, it showed the
significance value of control group was 0.186 and the significance of
experiment group was 0.002. Because of control group score higher than ttable
at 5% significance level (0.200 > 0.05) and the experiment group was 0.031 >
0.05. Thus, the distribution of the data was said to be in normal distribution.
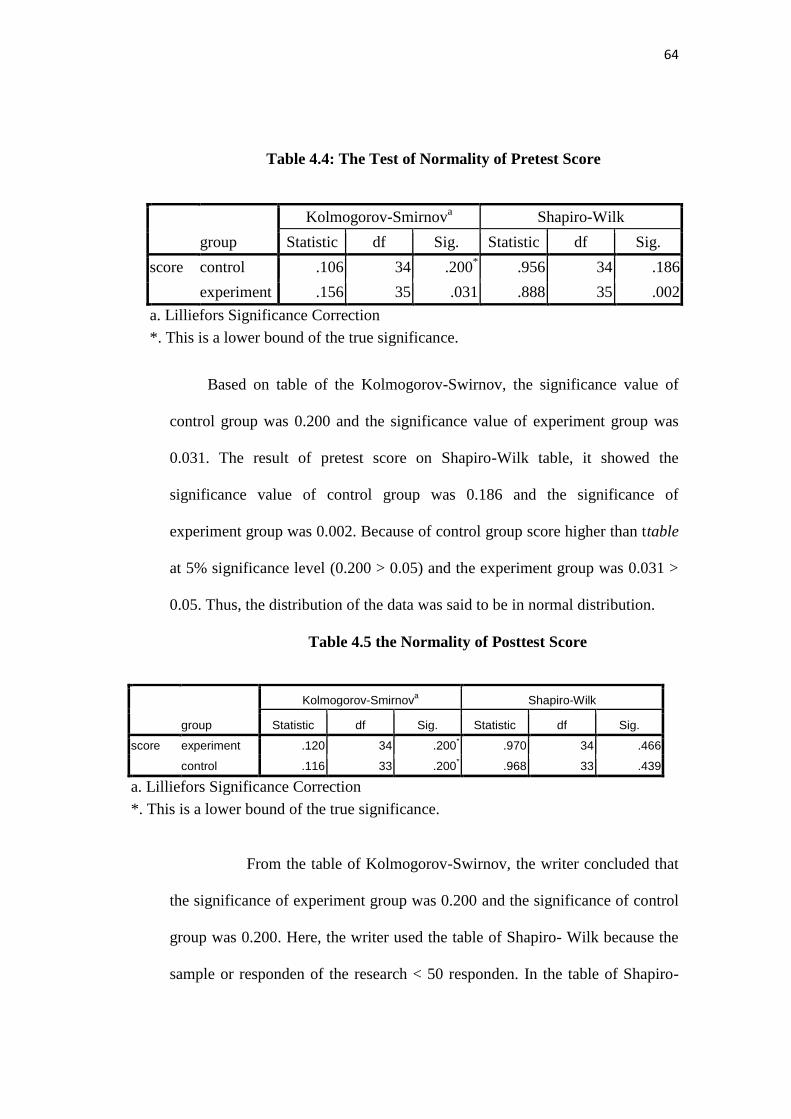
Table 4.5 the Normality of Posttest Score
From the table of Kolmogorov-Swirnov, the writer concluded that
the significance of experiment group was 0.200 and the significance of control
group was 0.200. Here, the writer used the table of Shapiro- Wilk because the
sample or responden of the research < 50 responden. In the table of Shapiro-
group
Kolmogorov-Smirnova Shapiro-Wilk
Statistic df Sig. Statistic df Sig.
score experiment .120 34 .200* .970 34 .466
control .116 33 .200* .968 33 .439
a. Lilliefors Significance Correction
*. This is a lower bound of the true significance.
65
Wilk showed that the significance of experiment score was 0.466 and the
control was 0,439. It was higher than the signifcance 0,05. Thus, the
distribution of the data was said to be in normal distribution.
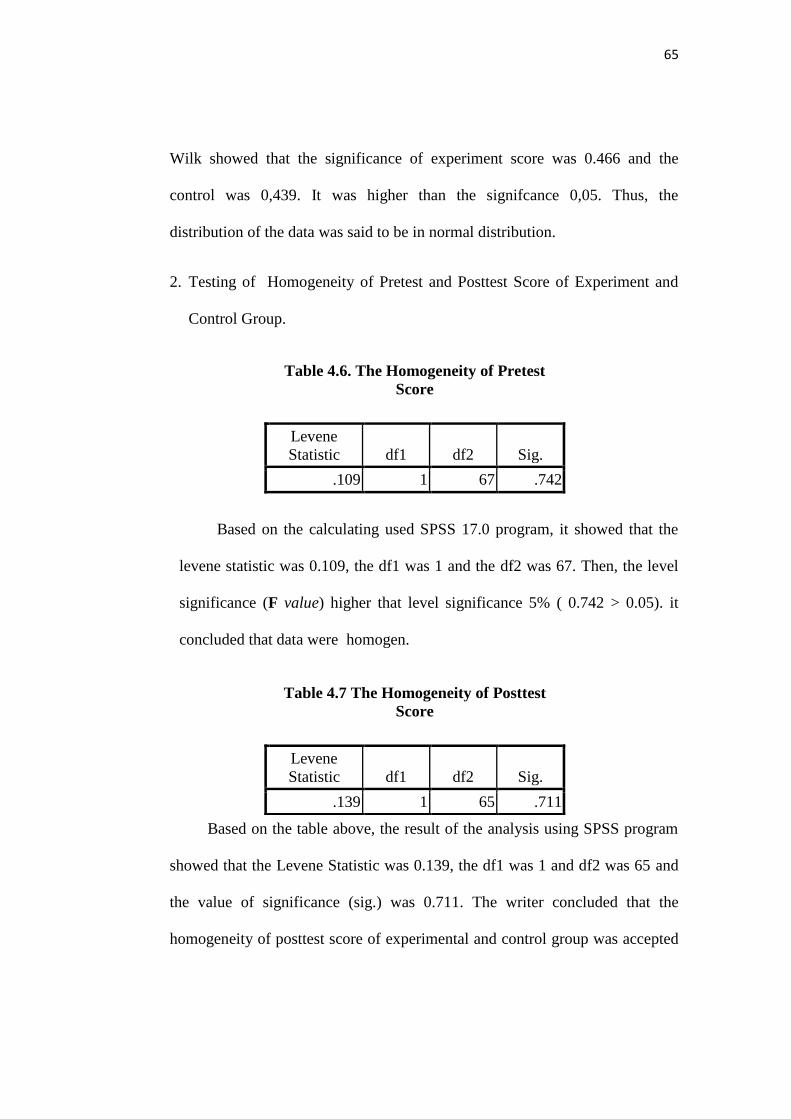
2. Testing of Homogeneity of Pretest and Posttest Score of Experiment and
Control Group.
Table 4.6. The Homogeneity of Pretest
Score
Levene
Statistic df1 df2 Sig.
.109 1 67 .742
Based on the calculating used SPSS 17.0 program, it showed that the
levene statistic was 0.109, the df1 was 1 and the df2 was 67. Then, the level
significance (F value) higher that level significance 5% ( 0.742 > 0.05). it
concluded that data were homogen.
Based on the table above, the result of the analysis using SPSS program
showed that the Levene Statistic was 0.139, the df1 was 1 and df2 was 65 and
the value of significance (sig.) was 0.711. The writer concluded that the
homogeneity of posttest score of experimental and control group was accepted
Table 4.7 The Homogeneity of Posttest
Score
Levene
Statistic df1 df2 Sig.
.139 1 65 .711
66
because the value of significance (sig) was 0,711 higher than the significance
level 5% was 0,05. Thus, it was said that the data were homogen.
B. The Result of Data Analysis
1. Testing Hypothesis Using Manual Calculation
To test the hypothesis of the study, the writer used t-test statistical
calculation. Firstly, the writer calculated the standard deviation and the
standard error of X1 and X2.It was found the standard deviation and the
standard error of post test of X1 and X2 at the previous data presentation. It
could be seen on this following table 4.8:
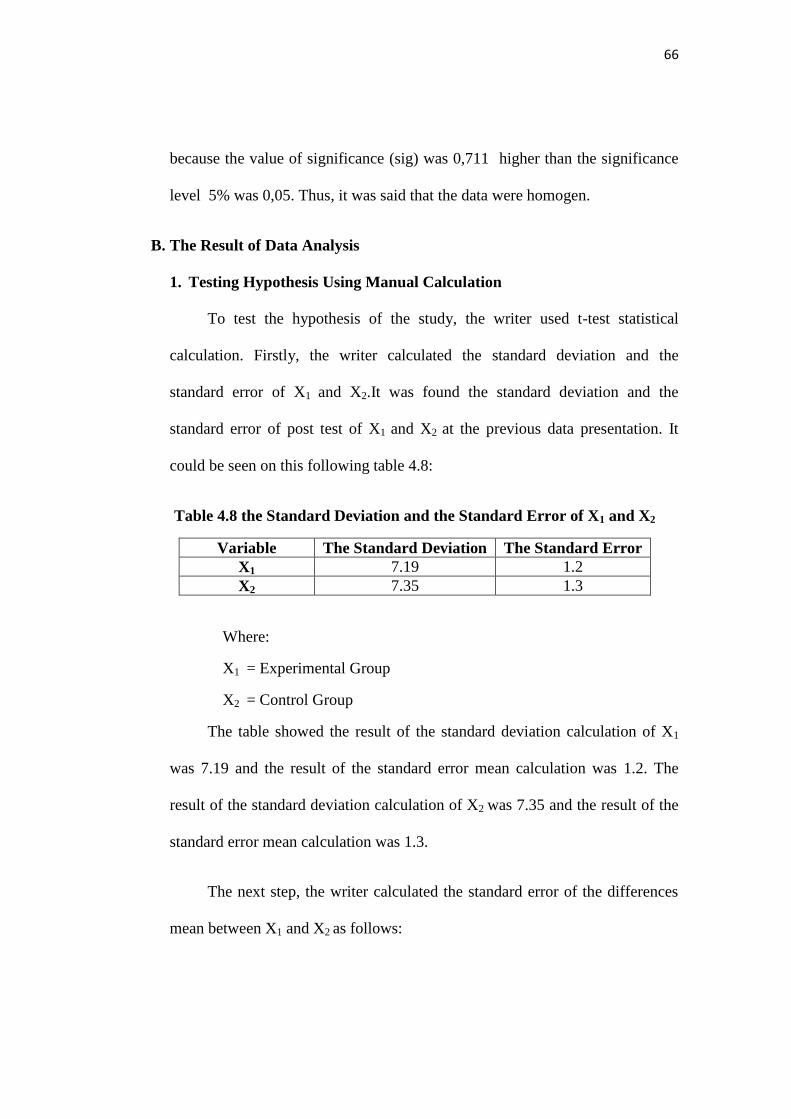
Table 4.8 the Standard Deviation and the Standard Error of X1 and X2
Variable The Standard Deviation The Standard Error
X1 7.19 1.2
X2 7.35 1.3
Where:
X1 = Experimental Group
X2 = Control Group
The table showed the result of the standard deviation calculation of X1
was 7.19 and the result of the standard error mean calculation was 1.2. The
result of the standard deviation calculation of X2 was 7.35 and the result of the
standard error mean calculation was 1.3.
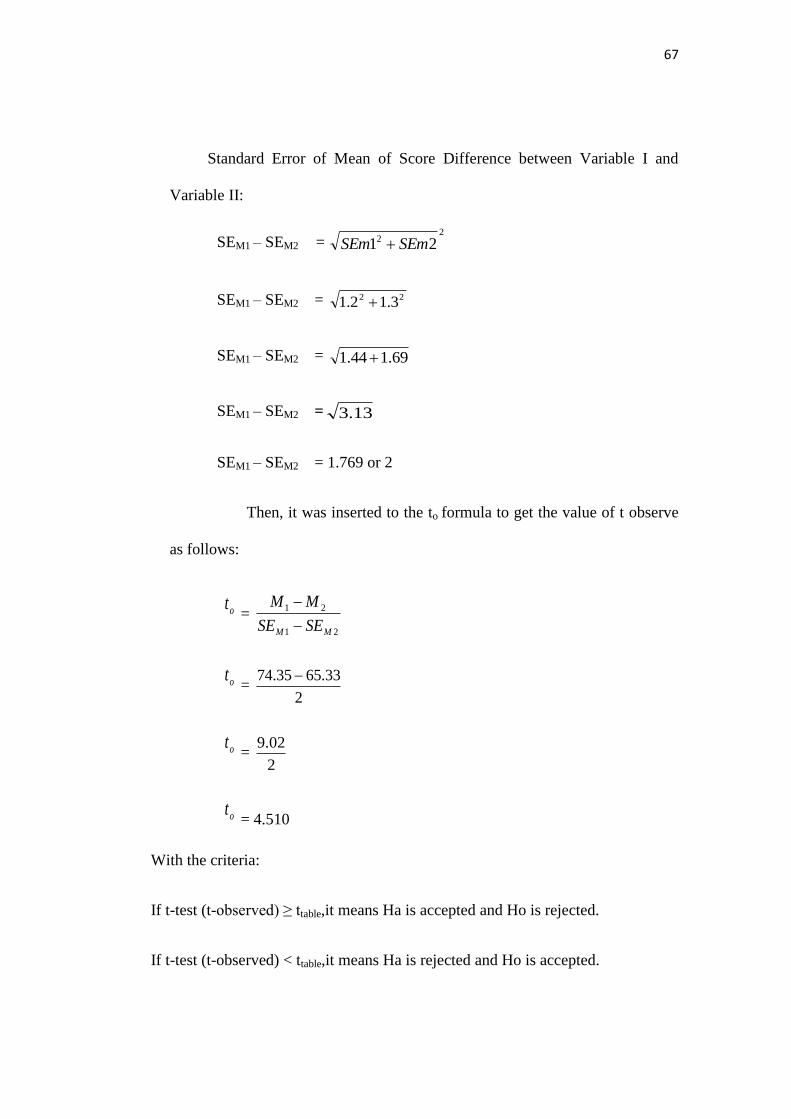
The next step, the writer calculated the standard error of the differences
mean between X1 and X2 as follows:
67
Standard Error of Mean of Score Difference between Variable I and
Variable II:
SEM1 – SEM2 =
22 21 SEmSEm
SEM1 – SEM2 = 22 1.31.2
SEM1 – SEM2 = 69.144.1
SEM1 – SEM2 = 13.3
SEM1 – SEM2 = 1.769 or 2
Then, it was inserted to the to formula to get the value of t observe
as follows:
ot = 21
21
MM SESE
MM
ot = 2
33.6535.74
ot = 2
02.9
ot = 4.510
With the criteria:
If t-test (t-observed) ≥ ttable,it means Ha is accepted and Ho is rejected.
If t-test (t-observed) < ttable,it means Ha is rejected and Ho is accepted.

68
Then, the writer interpreted the result of t- test. Previously, the writer
accounted the degree of freedom (df) with the formula:
df = )2( 21 NN
= )23334(
= 65
tablet at df 65 at 5% significant level = 2.000
The calculation above showed the result of t-test calculation as in the
table follows:
Table 4.9 the Result of T-test
Variable t observe t table Df/db
5% 1%
X1- X2 4.510 2.000 2.660 65
Where:
X1 = Experimental Group
X2 = Control Group
t observe = The calculated Value
t table = The distribution of t value
df/db = Degree of Freedom
Based on the result of hypothesis test calculation, it was found that the
value of tobserved was higher than the value of table at 1% and 5% significance
level or 2.000 <4.510> 2.660. it could be interpreted that alternative
hypothesis ( Ha ) was accepted. It meant there is significant difference between
students’ ability using picture series and without picture series in writing
69
narrative text at eight grade of SMPN-8 Palangka Raya. On the other hand,
there is no significant difference between students’ ability using picture series
and without picture series in writing narrative text at eight grade of SMPN-8
Palangka Raya was rejected. Simply, it could be interpreted that null
hyphothesis was rejected.
Teaching writing using Picture Series gave significant effect on the
students’ writing ability at the eight grade of SMPN-8 Palangka Raya. It meant
students who are taught by using picture series have better writing achievement
than those taught by non series picture.
2. Testing Hypothesis Using SPPS Program
The writer also applied SPSS 17.0 program to calculate t test in testing
hypothesis of the study. The result of t test using SPSS 17.0 was used to
support the manual calculation of the t test. The result of the t test using SPSS
17.0 program could be seen as follows:
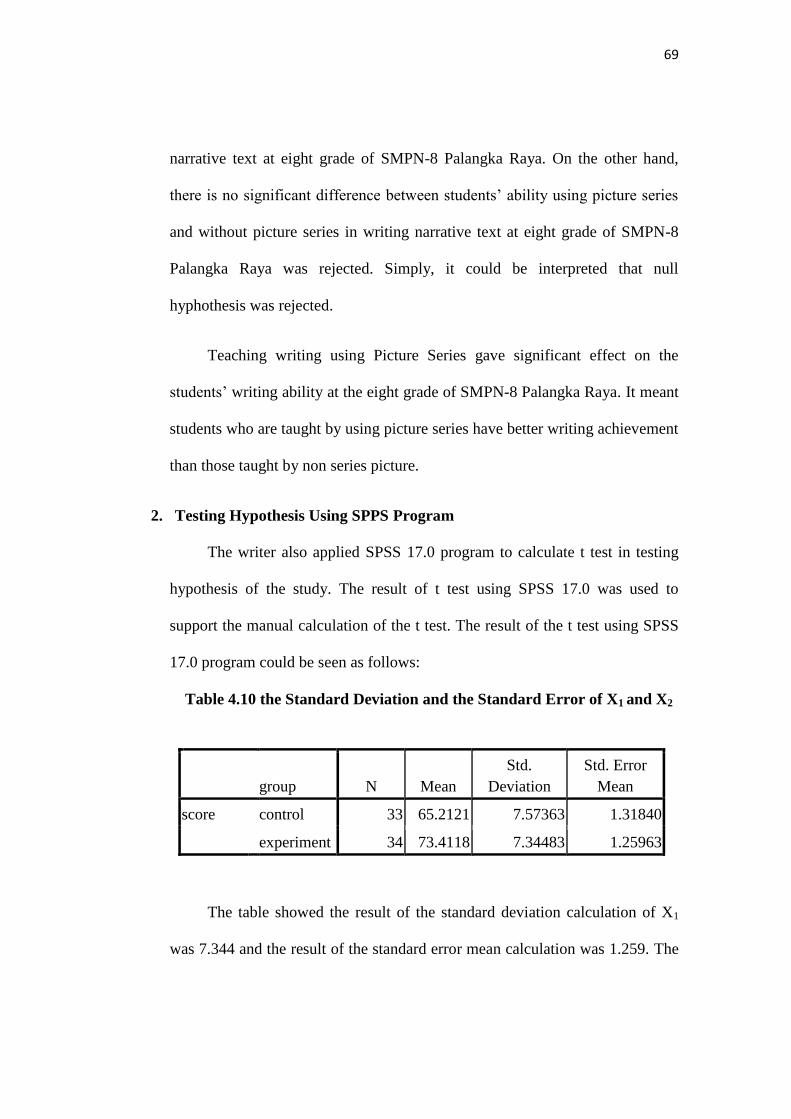
Table 4.10 the Standard Deviation and the Standard Error of X1 and X2
The table showed the result of the standard deviation calculation of X1
was 7.344 and the result of the standard error mean calculation was 1.259. The
group N Mean
Std.
Deviation
Std. Error
Mean
score control 33 65.2121 7.57363 1.31840
experiment 34 73.4118 7.34483 1.25963
70
result of the standard deviation calculation of X2 was 7.573 and the standard
error mean calculation was 1.318.
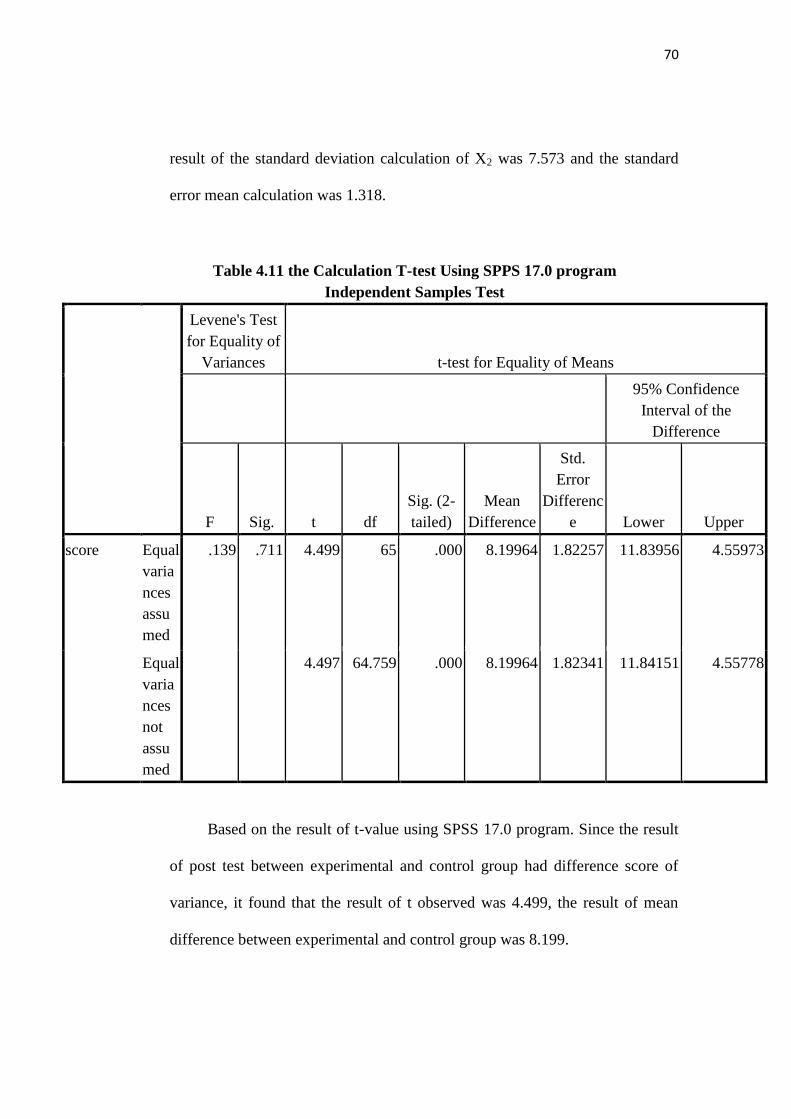
Table 4.11 the Calculation T-test Using SPPS 17.0 program
Independent Samples Test
Levene's Test
for Equality of
Variances t-test for Equality of Means
95% Confidence
Interval of the
Difference
F Sig. t df
Sig. (2-
tailed)
Mean
Difference
Std.
Error
Differenc
e Lower Upper
score Equal
varia
nces
assu
med
.139 .711 4.499 65 .000 8.19964 1.82257 11.83956 4.55973
Equal
varia
nces
not
assu
med
4.497 64.759 .000 8.19964 1.82341 11.84151 4.55778
Based on the result of t-value using SPSS 17.0 program. Since the result
of post test between experimental and control group had difference score of
variance, it found that the result of t observed was 4.499, the result of mean
difference between experimental and control group was 8.199.
71
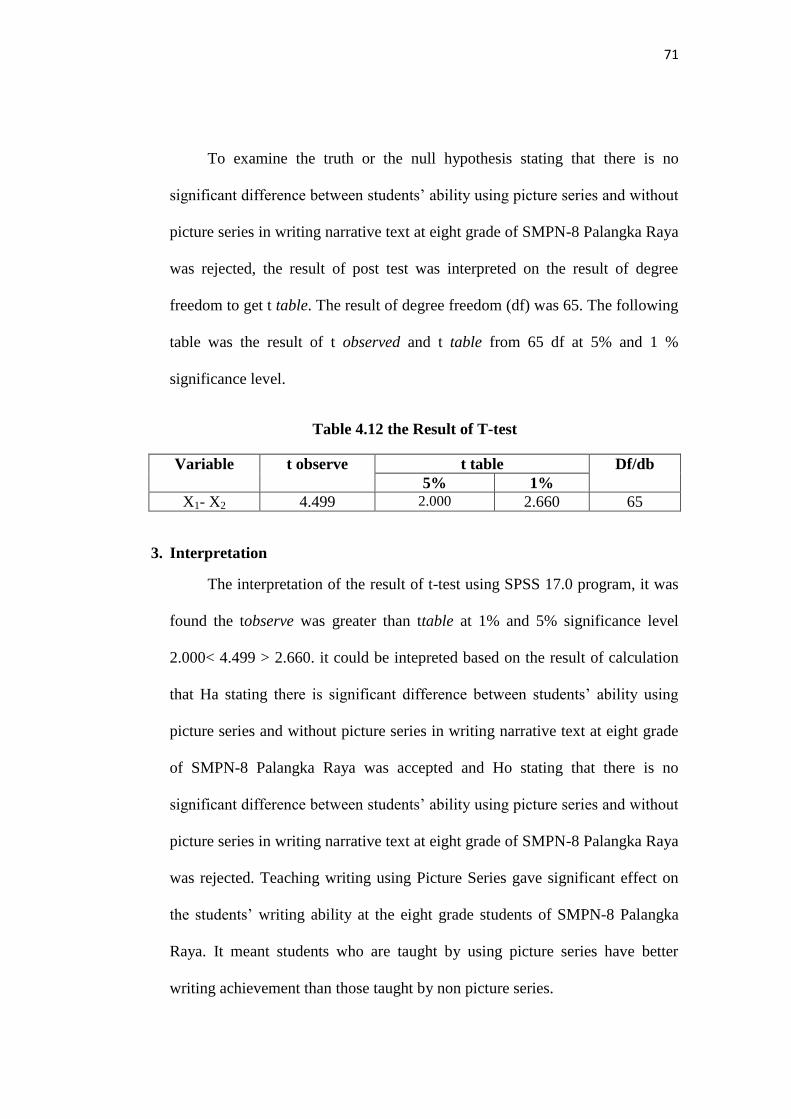
To examine the truth or the null hypothesis stating that there is no
significant difference between students’ ability using picture series and without
picture series in writing narrative text at eight grade of SMPN-8 Palangka Raya
was rejected, the result of post test was interpreted on the result of degree
freedom to get t table. The result of degree freedom (df) was 65. The following
table was the result of t observed and t table from 65 df at 5% and 1 %
significance level.
Table 4.12 the Result of T-test
Variable t observe t table Df/db
5% 1%
X1- X2 4.499 2.000 2.660 65
3. Interpretation
The interpretation of the result of t-test using SPSS 17.0 program, it was
found the tobserve was greater than ttable at 1% and 5% significance level
2.000< 4.499 > 2.660. it could be intepreted based on the result of calculation
that Ha stating there is significant difference between students’ ability using
picture series and without picture series in writing narrative text at eight grade
of SMPN-8 Palangka Raya was accepted and Ho stating that there is no
significant difference between students’ ability using picture series and without
picture series in writing narrative text at eight grade of SMPN-8 Palangka Raya
was rejected. Teaching writing using Picture Series gave significant effect on
the students’ writing ability at the eight grade students of SMPN-8 Palangka
Raya. It meant students who are taught by using picture series have better
writing achievement than those taught by non picture series.

72
C. Discussion
The finding of the study intepreted that alternative hypothesis stating that
there is significant difference between students’ ability using picture series and
without picture series in writing narrative text at eight grade of SMPN-8
Palangka Raya was accepted and the null hypothesis stating that there is no
significant difference between students’ ability using picture series and without
picture series in writing narrative text at eight grade of SMPN-8 Palangka Raya
was rejected. It meant students who taught by using series picture have better
writing English achievement than those who are taught by using non series
picture.
Based on the results finding of the study, picture series showed the
significant difference on the students ability in writing narrative text. There
were some reasons why the picture series effective in teaching writing at eight
grade students of SMPN-8 Palangka Raya. First, when the writer taught the
students by the picture, the students interested in writing English because
series picture is one of visual media. Students did not bored, because they
looked colorful pictures and also they was active to study. The Second reason,
series picture given motivation to the students. By the picture the sudents was
enthusiasm, its stimulate their imagination to get idea more easily. Third,
picture series can increase students’ vocabulary and language use. Because, it
would be design into activities vocabulary and grammar. Fourth, by using
series picture, the students could generate ideas correctly and organize the
ideas based on background knowledge. Fifth, series picture helped the students
to visualize what happened and what will happen next in the picture, it made them
73
easier to predict the event that might be happened when they see it in the picture,
therefore, they were able to express their idea easily.
In line with this, Jeremy Harmer stated that motivation is some kind of
internal drive which pushes some to do things in order to achieve something.2
Wright and Sofia in Arifah states that using visual aids will make teaching
more effective, communicative and interesting.3
Moreover, according to Rimes (1983) in Omid Akbari also stated,
pictures can help the teachers and students in teaching and learning vocabulary,
and other components of language. As a matter of fact pictures can help
students to imagine the real object. In short, the concept of picture is the shared
experience of many people because of their matching ability which enables
them to match the words with pictures. It should be mentioned that pictures as
mental representation of mind can better affect learning.
2 Jeremy Harmer, The Practice of English Language Teaching,Third Edition, Longman:
Cambridge, UK, p.51 3 Arifah, The Use of Picture to Write Narrative in Teaching Writing at M.A Raudlatul Ulum
Klampis Bangkalan, (Unpublished Thesis), Surabaya: Sunan Ampel, 2009, p.27