chapter ii performance audit relating to statutory corporation
TRANSCRIPT

Chapter II
Performance Audit relating to Statutory Corporation


19
Chapter II
Performance Audit relating to Statutory Corporation Gujarat State Road Transport Corporation 2 Functioning of Gujarat State Road Transport Corporation
Executive Summary
Introduction
Gujarat State Road Transport Corporation (Corporation) was established on 01 May 1960 under Section 3 of the Road Transport Corporations (RTC) Act, 1950 with mandate to provide an efcient, adequate, economical and properly co-ordinated Road Transport services. As on 31 March 2017, the Corporation had a eet strength of 7,603 buses. Further, 39 Volvo buses were taken on hire for operating services on 10 selected routes. The Corporation carried on an average 21.61 lakh passengers per day during 2016-17. As per the latest nalised accounts for the year 2014-15, the Corporation had accumulated losses of ₹ 2,721.52 crore. Audit Findings Financial Performance The income per km increased from ₹ 24.20 to ₹ 27.68 due to two fare revisions and increase in other income besides subsidy. However, the Corporation continued to report net loss. The net worth was negative for the three years 2012-13 to 2014-15. Operational Performance The load factor decreased from 69.18 per cent to 61.81 per cent during 2012-16. It increased in 2016-17 to 66.22 per cent due to increase in eet utilisation. The percentage of overage buses in the eet increased from 2.90 in 2012-13 to 7.47 in 2015-16 but decreased to 3.52 in 2016-17. The eet utilisation of the Corporation ranged between 83.89 per cent and 86.72 per cent against all India average of 89.50 per cent to 91 per cent during 2012-13 to 2016-17. Cancellation of schedule KMs decreased from 9.09 per cent in 2012-13 to 7.47 per cent in 2016-17. The cancellation of schedule KMs was mainly for want of crew and eet which was avoidable. The share of the Corporation in public transport declined from 15.48 per cent in 2012-13 to 12.30 per cent in 2016-17 due to decrease in eet of the Corporation. Manpower and fuel constituted 71 per cent to 72 per cent of total cost. The operating cost of Corporation buses was higher due to non-procur ement of fuel efcient buses (mini-buses), inadequate recovery of

20
toll tax and excess crew. In the hiring contract of Volvo buses , the Corporation incurred a net loss of ₹ 7.03 crore on its operations during March 2011 to March 2017.
Financial Management
Delay in submission of fare proposals to GoG led to delay in fare revisions. In the fare proposals, the Corporation did not consider the Motor Accident Claim and payment of pay arrears to its employees. The Corporation suffered interest loss of ₹ 6.97 crore due to investment of available fund for shorter durations besides interest loss of ₹ 3.96 crore due to balances lying in non-interest bearing Personal Ledger Account.
Internal Control and Monitoring
The internal control mechanism of the Corporation was weak. Peripatetic Audit Parties had not been constituted and Bank Reconciliation Statements were not prepared. Monitoring by top management was decient as evident from non submission of Management Information System reports to Board of Directors, delay in submission of subsidy claims and fare revision proposals.
Introduction
2.1 Gujarat State Road Transport Corporation (Corporation) was established on 01 May 1960, under Section 3 of Road Transport Corporations (RTC) Act, 1950. The Corporation is mandated to provide an efcient, adequate, economical and properly co-ordinated Road Transport services. The Corporation is under the administrative control of the Ports and Transport Department of the Government of Gujarat (GoG).
As on 31 March 2017, the Corporation had a eet strength of 7,603 buses. Further, 39 Vol vo buses were taken on hire for operating services on 10 selected routes. The Corporation carried on an average 21.61 lakh passengers per day during 2016-17. As on 31 March 2017, the Corporation had 37,688 employees. As on 31 March 2017, the share capital of the Corporation was ₹ 2,635.91 crore (GoG: ₹ 2,529.63 crore and Government of India (GoI): ₹ 106.28 crore). As per the latest nalised accounts for the year 2014-15, the Corporation had accumulated losses of ₹ 2,721.52 crore.
Organisational Set-up
2.2 The Management of the Corporation is vested with a Board of Directors (BOD) comprising of the Chairman, the Vice Chairman & Managing Director (VCMD) and 14 ofcial and non-ofcial Directors
Audit Report (PSUs) for the year ended 31 March 2017 - Report No. 3 of 2018

Chapter II, Performance Audit relating to Statutory Corporation
21
appointed by the GoI/ GoG. The VCMD is the Chief Executive who manages the day to day operations of the Corporation.
The Corporation has 16 divisions headed by Divisional Controllers and 125 depots headed by Depot Managers. The divisions are responsible for operation of buses under its depots and maintenance of buses at divisional workshops. Depots are responsible for the day to day operations of the buses under their jurisdiction. The Corporation has Central Workshop for fabrication of bus bodies and reconditioning of bus engines. Besides, the Corporation also gets fabrication of bus bodies done through external agencies. The Corporation has seven tyre retreading plants; one at Central Workshop at Ahmedabad and six in divisions.
Audit Objectives
2.3 The main audit objectives were to assess whether:
· the Corporation’s operations kept pace with the demand for public transport and the operations were run efciently;
· the nancial performance of the Corporation was sound and the Corporation had adequate nancial resources to run the operations efciently;
· the Corporation fullled its social obligation by operating on uneconomic obligatory routes; and
· the Corporation has an efcient internal control and monitoring system to oversee the day to day operations.
Scope of Audit
2.4 A review on the performance of the Corporation was included in the Report of the Comptroller and Auditor General of India for the year ended 31 March 2009 (Commercial), Government of Gujarat. The Committee on Public Undertakings (COPU) discussed (13 August 2013/ 03 September 2013) the review and made (July 2014) three recommendations1. The COPU discussed (October 2016) action taken on the recommendations and no further recommendations were made.
The present Performance Audit (PA) conducted during December 2016 to June 2017 covered a period of ve years from 2012-13 to 2016-17. As accounts of the Corporation have been nalised only upto 2014-15, the nancial gures derived from accounts have been compared for the period 2011-12 to 2014-15. The audit examination involved scrutiny of records at the Head Ofce, Central Workshop, Purchases and Stores Department, Trafc Department and test check of ve division ofces2.
1 The three recommendations were (i) Enhance working efciency and reduce annual decit,
(ii) Spare vehicles to be reduced from 10 to 6 per cent and (iii) Recruitment of staff to enhance efciency and reduce loss by cancellation of kilometres.
2 Bhavnagar, Mehsana, Nadiad, Vadodara and Valsad.

22
Audit Criteria
2.5 The audit objectives were evaluated against the following criteria:
· Performance standards and operational norms xed by the Association of State Road Transport Undertakings;
· Performance and Quick Review of State Transport Undertakings published by Ministry of Road Transport & Highways;
· Agenda and minutes of the meetings of the Board of Directors (BoD), purchase and stores committee and other committees;
· Budget Estimates and Plan, Annual accounts and other circulars;
· Physical and nancial targets/ norms xed by the Management, Contracts with service providers; and
· Sanction orders for grants and subsidies, instructions issued by Government of India (GoI), GoG and other relevant rules and regulations.
Audit Methodology
2.6 The methodology adopted for attaining the audit objectives involved explaining the same in an entry conference held on 02 March 2017 with the representatives of Management and Port & Transport Department, GoG. It also involved interaction with the audited entity personnel and raising audit queries after scrutiny/ examination of the records. The draft Performance Audit Report was issued to the Management and the Port & Transport Department on 22 July 2017 for their comments. The exit conference was held on 23 August 2017. The reply of the Management was received on 28 December 2017 and their views have been considered while nalising the report.
Audit Findings
2.7 The Audit ndings of the Corporation are discussed under the following headings, i) Financial performance, ii) Operational Performance, iii) Financial Management and iv) Internal Control and Monitoring.
Financial Performance
2.8 The nancial performance of the Corporation in terms of its working results, earning and expenditure per kilometer are given in Annexure 3 and the sources and application of funds and various ratios derived therefrom are given in Annexure 4. The quality of accounts and some parameters of nancial performance are discussed below:
Quality of accounts and arrears in nalization of accounts
2.8.1 The Corporation has nalised its accounts up to 2014-15 only. The Comptroller and Auditor General of India (C&AG) certifies the accounts of
Audit Report (PSUs) for the year ended 31 March 2017 - Report No. 3 of 2018

23
the Corporation under Section 33(2) of RTC Act, 1950. The C&AG has issued adverse opinion on the accounts of the Corporation for all the three years 2012-13 to 2014-15 due to non-provision for gratuity liability, non-investment of depreciation fund in approved securities, non-adjustment of Government grants received against outstanding dues from Government, non-rectication of other issues pointed out in earlier Audits and deciencies in internal control.
The Management stated (December 2017) that due to nancial crunch, it did not create gratuity fund and did not invest depreciation fund. It also stated that as regards non-adjustment of Government grants against outstanding dues the rectication would be done in the accounts for the year 2016-17.
Working results of the Corporation
2.8.2 As depicted in Annexure 3, the operating losses of the Corporation increased from ₹ 242.28 crore in 2011-12 to ₹ 318.17 crore in 2014-15. The net loss which was ₹ 183.58 crore in 2011-12 decreased to ₹ 132.45 crore in 2013-14 and again increased to ₹ 184.45 crore in 2014-15. The manpower and fuel cost constituted 71 to 72 per cent of the total cost whereas the trafc income was 67 to 70 per cent of the total income for the period 2011-12 to 2014-15.
Sources and Application of funds
2.8.3 The main sources of funds of the Corporation are capital contribution and borrowings from GoG and GoI. The broad elements of sources and uses of funds of the Corporation are depicted in Annexure 4.
· The current ratio represented by the ratio of current assets to current liabilities, improved from 0.99:1 in 2012-13 to 2.06:1 in 2014-15 due to conversion of current liability into equity capital and loan (2013-14) and increase in cash and bank balances due to receipt of grant/ subsidy.
· The protability ratios of the Corporation represented by the return on equity and return on capital employed were negative during 2012-13 to 2014-15 due to losses in each year.
· The accumulated losses as per the last nalised accounts for the year 2014-15 was ₹ 2,721.52 crore. Its networth was negative during 2012-13 to 2014-15 as its accumulated losses exceeded its capital and reserves indicating complete erosion of capital and stood at (-) ₹ 975.56 crore as at the end of 2014-15. The GoG continued to support the Corporation in form of equity, loans and subsidy during the review period.
· During 2012-13 to 2016-17, the Corporation added 5,879 new buses at a cost of ₹ 1,063.42 crore. The expenditure was mainly funded through loan (₹ 209 crore) and equity (₹ 891 crore) contributed by the GoG. However, the Corporation did not generate adequate resources through its operations to nance the replacement of buses by removing operational inefciencies and achieving economy in costs.
Chapter II, Performance Audit relating to Statutory Corporation

24
· Increase in the income per km from ₹ 24.20 to ₹ 27.68 during the period 2012-13 to 2014-15 was due to increase in trafc revenue because of two fare revisions in 2013-14, other income and subsidy.
The Management stated (December 2017) that the liabilities decreased from 2011-12 to 2014-15 due to equity/ loan/ grants given by GoG and rise in passenger income.
Operational Performance
2.9 The operational performance of the Corporation for the ve years ending 31 March 2017 is given in the Annexure 5. It is seen from the Annexure that though the average number of vehicles held increased from 7,719 in 2012-13 to 7,863 in 2016-17, the eet utilization decreased from 86.72 per cent to 84.48 per cent in the said period. The load factor reduced from 69.18 per cent in 2012-13 to 66.22 per cent in 2016-17. Though the population of Gujarat increased from 6.27 crore to 6.71 crore during 2012-13 to 2016-17, the passengers carried decreased from 8,410.60 lakh per year (2012-13) to 7,887.10 lakh per year (2016-17). The Corporation required a load factor in the range of 89 per cent to 108 per cent during 2012-13 to 2016-17
to break-even against which it achieved load factor in the range of 61.81 per cent to 69.18 per cent. Hence the Corporation continued to incur losses.
The operational performance of the Corporation was evaluated on the basis of performance against operational parameters like age prole of buses, eet utilization, vehicle productivity and load factor; share of Corporation in public transport of the state; and components of operational cost and possibility of its reduction through adopting efcient alternatives. The audit observations on the operational performance are discussed in the succeeding paragraphs.
Operational Efciency
2.10 As per the Report on the Review of the performance of State Road Transport Undertakings (SRTU) for 2015-16 published by Ministry of Road Transport and Highways, the revenue and cost structures of SRTUs and their net prots/ losses are determined by the operational efciency within which the SRTU functions. The operational efciency parameters include eet utilization, capacity utilization, occupancy ratio/ load factor, age of vehicle, staff productivity and fuel efciency.
Load Factor
2.10.1 Capacity utilisation of a transport undertaking is measured in terms of Load Factor, which represents the percentage of passengers carried to seating capacity. The schedules to be operated are to be decided after proper study of routes in terms of passenger trafc, frequency of service, etc. and periodical reviews are necessary to improve the load factor. The Corporation reported decrease in load factor during 2012-13 to 2015-16 from 69.18 per cent to 61.81 per cent. The load factor, however, increased to 66.22 per cent during 2016-17 due to increase in the eet utilisation and number of passengers travelled during 2016-17. The all India average load
Audit Report (PSUs) for the year ended 31 March 2017 - Report No. 3 of 2018

25
factor was in the range of 67.90 per cent to 70.20 per cent during 2012-13 to 2015-16.
Audit observed that the Corporation decided (June 2012) to purchase mini-buses for village services wherein load factor was less than 40 per cent. It was felt that mini-buses would be convenient for village roads and would increase the load factor. However, it was only in September 2015 that 302 mini buses were purchased. Even these mini-buses were allotted (April 2016) based on schedules of divisions rather than load factor. For the years 2016-17 and 2017-18, tenders for purchase of 775 mini-buses were under nalization. Thus, due to delay in implementing decision to purchase mini-buses, the benet of consequent increase in load factor could not be achieved.
Age prole of the eet
2.10.2 The Corporation prescribed (October 2011) the life of a bus as eight lakh KMs for diesel buses, 6.5 lakh KMs for Compressed Natural Gas (CNG) buses and ve years or six lakh KMs whichever was later (September 2016) for mini-buses. The Corporation declares the buses as overage based on these criteria. The Table 2.1 shows the age-prole of the buses held by the Corporation for the last ve years ended 2016-17.
Table 2.1: Fleet strength and age prole of eet during 2012 -13 to 2016-17 (in nos.)
Sl. No.
Particulars 2012-13 2013-14 2014-15 2015-16 2016-17
1 Total number of buses at the beginning of the year
7,805 8,062 7,914 7,875 8,086
2 Additions during the year (as per Corporation’s data of registration of vehicles)
2,075 576 500 972 1,756
3 Buses scrapped during the year (1+2-4) 1,818 724 539 761 2,239 4 Buses held at the end of the year 8,062 7,914 7,875 8,086 7,603 5 No. of overage buses 234 147 222 604 268 6 Percentage of overage buses to total
buses at the end of year 2.90 1.86 2.82 7.47 3.52
Source: Information provided by the Corporation except at Sl.No.3 which has been derived.
The eet strength reduced from 8,062 buses at the end of 2012-13 to 7,603 buses at the end of 2016-17. During 2012-13 to 2016-17, though 5,879 new buses were added to the eet, the Corporation scrapped 6,081 buses from its eet. The percentage of overage buses to the total buses held at the end of the year increased from 2.90 in 2012-13 to 7.47 in 2015-16 but decreased to 3.52 in 2016-17.
Fleet utilisation
2.10.3 Fleet utilisation represents the ratio of buses on road to those held by the Corporation. Optimum eet utilisation is necessary for enhancing the operational performance.
The Corporation did not x any target for eet utilisation. The GoG, however, xed (July 2010) certain efciency parameters that had to be achieved if full
Chapter II, Performance Audit relating to Statutory Corporation
26
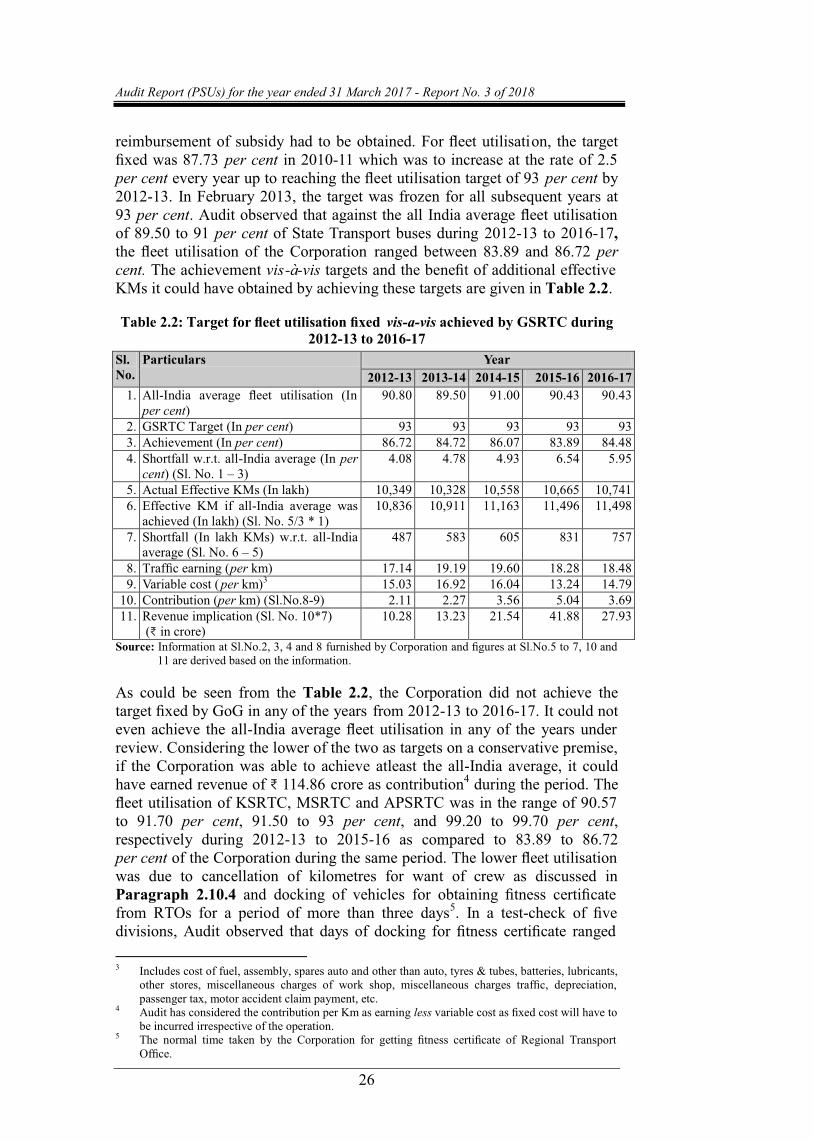
reimbursement of subsidy had to be obtained. For eet utilisation, the target xed was 87.73 per cent in 2010-11 which was to increase at the rate of 2.5 per cent every year up to reaching the eet utilisation target of 93 per cent by 2012-13. In February 2013, the target was frozen for all subsequent years at 93 per cent. Audit observed that against the all India average eet utilisation of 89.50 to 91 per cent of State Transport buses during 2012-13 to 2016-17, the eet utilisation of the Corporation ranged between 83.89 and 86.72 per cent. The achievement vis-à-vis targets and the benet of additional effective KMs it could have obtained by achieving these targets are given in Table 2.2.
Table 2.2: Target for eet utilisation xed vis-a-vis achieved by GSRTC during 2012-13 to 2016-17
Sl. No.
Particulars Year 2012-13 2013-14 2014-15 2015-16 2016-17
1. All-India average eet utilisation (In per cent)
90.80 89.50 91.00 90.43 90.43
2. GSRTC Target (In per cent) 93 93 93 93 93 3. Achievement (In per cent) 86.72 84.72 86.07 83.89 84.48 4. Shortfall w.r.t. all-India average (In per
cent) (Sl. No. 1 – 3) 4.08 4.78 4.93 6.54 5.95
5. Actual Effective KMs (In lakh) 10,349 10,328 10,558 10,665 10,741 6. Effective KM if all-India average was
achieved (In lakh) (Sl. No. 5/3 * 1) 10,836 10,911 11,163 11,496 11,498
7. Shortfall (In lakh KMs) w.r.t. all-India average (Sl. No. 6 – 5)
487 583 605 831 757
8. Trafc earning (per km) 17.14 19.19 19.60 18.28 18.48 9. Variable cost (per km)3 15.03 16.92 16.04 13.24 14.79
10. Contribution (per km) (Sl.No.8-9) 2.11 2.27 3.56 5.04 3.69 11. Revenue implication (Sl. No. 10*7)
(₹ in crore) 10.28 13.23 21.54 41.88 27.93
Source: Information at Sl.No.2, 3, 4 and 8 furnished by Corporation and gures at Sl.No.5 to 7, 10 and 11 are derived based on the information.
As could be seen from the Table 2.2, the Corporation did not achieve the target xed by GoG in any of the years from 2012-13 to 2016-17. It could not even achieve the all-India average eet utilisation in any of the years under review. Considering the lower of the two as targets on a conservative premise, if the Corporation was able to achieve atleast the all-India average, it could have earned revenue of ₹ 114.86 crore as contribution4 during the period. The eet utilisation of KSRTC, MSRTC and APSRTC was in the range of 90.57 to 91.70 per cent, 91.50 to 93 per cent, and 99.20 to 99.70 per cent, respectively during 2012-13 to 2015-16 as compared to 83.89 to 86.72 per cent of the Corporation during the same period. The lower eet utilisation was due to cancellation of kilometres for want of crew as discussed in Paragraph 2.10.4 and docking of vehicles for obtaining tness certicate from RTOs for a period of more than three days5. In a test-check of ve divisions, Audit observed that days of docking for tness certicate ranged 3 Includes cost of fuel, assembly, spares auto and other than auto, tyres & tubes, batteries, lubricants,
other stores, miscellaneous charges of work shop, miscellaneous charges trafc, depreciation, passenger tax, motor accident claim payment, etc.
4 Audit has considered the contribution per Km as earning less variable cost as xed cost will have to be incurred irrespective of the operation.
5 The normal time taken by the Corporation for getting tness certicate of Regional Transport Ofce.
Audit Report (PSUs) for the year ended 31 March 2017 - Report No. 3 of 2018

27
from four to 143 days resulting in 8,098 buses being held up for 74,868 bus days after considering an allowable period of three days.
The issue was also highlighted in Paragraph 3.10.5 of the Report of the Comptroller and Auditor General of India (Commercial), Government of Gujarat for the year ended 31 March 2009, but no measures were taken by the Corporation to improve the eet utilisation.
The Management stated (December 2017) that if vehicle is utilised more, then the wear and tear on buses will increase and crew cost will reduce. However, if Corporation reduces the spare vehicle percentage to enhance eet utilisation, the shortage of buses will adversely affect operations and cancellation will increase.
The reply is not convincing as the spare percentage of buses has been factored in while xing the target of eet utilisation. It does not address the concerns of cancellation of KMs for want of crew and more time taken for docking vehicles for obtaining tness certicate which led to lower eet utilisation.
Cancellation of scheduled Kilometres
2.10.4 A review of the operations of the Corporation indicated that the scheduled kilometres (KMs) were not fully operated mainly due to non-availability of adequate number of buses, under-utilisation of crew and other factors like breakdown, accidents, late arrivals, etc. The details of scheduled KMs, cancelled KMs and cause-wise analysis are given in Table 2.3 below:-
Table 2.3: Scheduled, effective and cancelled KMs of buses of the Corporation Sl.No.
Particulars Year 2012-13 2013-14 2014-15 2015-16 2016-17
1. Scheduled (In lakh Km) 10,871.27 10,950.06 11,140.12 11,220.30 11,227.65 2. Cancelled (In lakh Km) 987.65 1,011.56 873.75 754.84 838.50 3. Percentage of cancellation 9.09 9.24 7.84 6.73 7.47 Cause-wise analysis:- (In lakh Km) 4. Want of eet 10.94 10.34 8.86 8.15 36.26 5. Want of crew 459.82 609.71 505.37 376.59 478.46 6. Casual contract 202.92 112.45 108.79 101.56 146.04 7. Low-trafc 182.45 159.22 133.65 47.23 66.60 8. Others6 131.52 119.85 117.08 221.30 111.14 9. Avoidable cancellation (Sl.
No.4+5) 470.76 620.05 514.23 384.74 514.72
10. Trafc earning (₹ per km) 17.14 19.19 19.60 18.28 18.48 11. Variable cost (₹ per km)7 15.03 16.92 16.04 13.24 14.79 12. Contribution (₹ per km)
(Sl. No. 10-11) 2.11 2.27 3.56 5.04 3.69
13. Revenue implication (₹ in crore) (Sl. No. 9*12)
9.93 14.08 18.31 19.39 19.00
Source: Information at Sl. No. 1, 2, 4 to 8, 10 and 11 provided by Corporation and gures at Sl. No. 3, 9, 11, 12 and 13 are derived based on the information
6 Unmotorable roads, break-downs, accident, road-blockade, civil strike, etc. 7 Includes cost of fuel, assembly, spares auto and other than auto, tyre & tubes, batteries, lubricants,
other stores, miscellaneous charges work shop, miscellaneous charges trafc and depreciation.
Chapter II, Performance Audit relating to Statutory Corporation

28
It is seen from the above table that the cancellation of scheduled KMs has decreased from 9.09 per cent in 2012-13 to 7.47 per cent in 2016-17. Further, the cancellation of scheduled KMs was mainly for want of crew and eet, which ranged from 47.66 per cent (2012-13) to 61.38 per cent (2016-17) of the cancelled KMs and was avoidable.
On detailed scrutiny of cause-wise cancellations, Audit observed that:
· In ve test-checked divisions, drivers and conductors had been used to discharge duties other than their regular duty (viz., booking clerk, cashier) which resulted in a loss of 3,37,770 man days during 2012-13 to 2016-17.
· Any trip requires one driver and one conductor. Hence, number of drivers and conductors in any division should be equal even considering the reserve to be maintained for leave. However, in the ve test-checked divisions, Audit observed that there were excess drivers as compared to conductors against the actual operated crew in the range of one to 142 during 2012-13 to 2016-17. Further, conductors were excess against the drivers in the range of three to 73 during the same period. The Corporation needs to rationalise crew position across divisions.
· Cancellation for want of eet increased from 10.94 lakh KMs (2012-13) to 36.26 lakh KMs (2016-17). The increase in cancellation of KMs for want of eet in 2016-17 was due to the fact that in November 2016 a decision to withdraw 1,027 overage buses from operations was taken and consequently the cancellation was 18.30 lakh KMs in the months of December 2016 and January 2017 which was 50 per cent of the cancellation for the year. The decision to withdraw overage buses was taken to provide better services to the passengers by having lower levels of breakdowns and lower risk of accidents. Audit analysed the breakdown and KMPL of overage buses for the period April to November 2016 and found that during this period the breakdown in overage buses was nil and KMPL was only 0.03 KMs less than the regular buses. Hence, Corporation could have considered the option of removing the overage buses in synchronization with 786 new buses introduced during December 2016 to March 2017.
The Management stated (December 2017) that cancellation of scheduled KMs was mainly due to low trafc, absence of crew, vehicles breakdown/ accidents, rain, calamities, bad road conditions, vehicles given to government and others on casual contracts besides other variety of reasons. It was also stated that services of drivers/ conductors were used for providing other services to passengers in view of shortage of administrative staff.
The reply did not state any measures taken or proposed to be taken to reduce cancellation of scheduled KMs for want of crew. Further, the reply does not give any justication for cancellations for want of eet and withdrawal of overage buses without matching its replacement with new buses.
Audit Report (PSUs) for the year ended 31 March 2017 - Report No. 3 of 2018

29
Operation of buses on uneconomical routes
2.10.5 The Corporation prepares ABC8 classication for operation of local/ express buses to ascertain the economic viability of each trip. Based on the above criteria, the Corporation decides the Earning per Kilometer (EPKM) to be achieved for meeting operational cost, division cost and total cost, which varies from division to division. If any trip does not meet its operational cost, it is considered as an uneconomic trip. The GoG compensated the Corporation by subsidy where such uneconomic trips were obligatory. The Corporation also decided (April 2012) that express trips run without any obligation, hence express trips which do not recover the operational cost plus division cost should not be scheduled.
In the test checked divisions, Audit observed that during 2012-17, the number of trips ranging from 33 to 80, 62 to 161, 95 to 170, 38 to 81 of Valsad, Mehsana, Nadiad and Vadodara divisions respectively were uneconomical and subsidy for the same was claimed from the GoG. Thus, the Corporation violated its own decision of April 2012 of not operating express buses on uneconomic trips. Not only that, the Corporation was operating express buses on uneconomic trips but was also claiming subsidy for such trips from GoG, as discussed in Paragraph 2.12.2.1.
The Management stated (December 2017) that it provides facilities to passengers in remote villages, students, patients, handicapped persons, victims of natural calamities and for marriages and election duties as a social obligation. It further stated that express services are organized to provide speedy, efcient and safer transport facilities to the passengers and express services not covering operation cost are operated owing to representations from public representatives.
The reply is not convincing because the Corporation has social obligation to provide facilities to passengers on uneconomic routes but there is no obligation on the part of the Corporation to operate express buses on uneconomic routes.
Share of Corporation in public transport
2.10.6 The State has not framed any transport policy to achieve balanced mix of public operators and private operators in the public transport to meet the needs of general public. The GoG, however, approved (1994) a scheme of Road Transport Services authorizing the Corporation to operate bus services under Stage Carriage9 Services in the entire State. Private operators were permitted to operate buses only under contract carriage10 when plying between two cities. In addition, permits were given to Municipal 8 A refers to fuel cost, B refers to operation cost and C refers to division cost in local trips and A
refers to the operation cost, B refers to the division cost and C refers to the total cost in respect of express trips.
9 A motor vehicle adapted to carry more than six persons excluding driver which carries passengers for hire or reward at separate fares paid by or for individual passengers, either for the whole journey or for stages of the journey.
10 Contract carriage is one in which fares are collected only for full journey and not for different stages.
Chapter II, Performance Audit relating to Statutory Corporation

30
Corporations, Municipalities and private operators in 27 cities/ towns to operate stage carriage services within city limits.
Audit observed that private operators who were permitted to operate inter-city buses only under contract carriage were also plying vehicles on these routes on stage carriage basis. Hence, the Corporation was facing competition from private operators even in inter-city routes. The Corporation needs to take up the matter with the Ports and Transport Department as the Regional Transport Ofces (RTOs) which give permission to the private operators, are also under the purview of the same department.
The details of year-wise growth of public transport in the State during the ve years ended 31 March 2017 is given in Table below:
Table 2.4 : Year wise growth of public transport in the State (in nos.)
Sl. No.
Particulars Years 2012-13 2013-14 2014-15 2015-16 2016-17
1. Corporation buses at the end of year11
8,062 7,914 7,875 8,086 7,603
2. Private buses 44,030 45,650 47,009 50,508 54,214 3. Total buses for public transport 52,092 53,564 54,884 58,594 61,817 4. Percentage share of corporation
(Sl.No. 1/ 3 * 100) 15.48 14.77 14.35 13.80 12.30
5. No. of passengers travelled in GSRTC buses (in crore)
84.11 80.50 77.35 76.13 78.87
6. Average Passengers carried by Corporation per day per bus (Sl.No.5/365/Sl.No.1)
286 279 269 258 284
Source: As per information furnished by Corporation.
As can be seen from Table 2.4, the Corporation has not been able to keep pace with the growing demand for public transport as the number of buses of the Corporation reduced from 8,062 to 7,603 during 2012-17. However, private buses have increased signicantly from 44,030 to 54,214 over the period. The percentage share of Corporation’s buses in the public transport of the State decreased from 15.48 per cent in 2012-13 to 12.30 per cent in 2016-17-
due to decrease in the eet of the Corporation .
The average number of passengers travelled per day per bus decreased from 279 in 2013-14 to 258 in 2015-16 and increased to 284 in 2016-17.
The gradual reduction in share of public transport indicates that there is lack of adequate planning on the part of the GoG as well as the Corporation for co-relating the need of public transport with the growing population and the role of the Corporation in the public transport sector.
The Management stated (December 2017) that decrease in number of passengers travelling by Corporation buses was due to unauthorised use of contract permit by private vehicles for stage carriage service. It was further stated that increase in operations was not possible due to shortage of
11 This gure is the number of vehicles held on the last day of the year and is therefore different from
the average vehicles held during the same year.
Audit Report (PSUs) for the year ended 31 March 2017 - Report No. 3 of 2018

31
administrative as well as crew staff, increase in private vehicles and non-increase in schedules of the Corporation vis-à-vis population growth in the State.
The reply is not convincing as the reasons like shortage of staff leading to reduced operations and non-increase in schedules are attributable to the Corporation and could be overcome by proper planning. The reply does not state the efforts being made by the Corporation to increase its share in public transport.
Public transport has denite benets in terms of costs, congestion on roads and environmental impact. The public transport services have to be adequate to derive those benets. However, the Corporation was not able to maintain its share in public transport.
Operational cost of running the Corporation buses
2.11 The cost incurred in connection with the business of transportation of passengers is termed as “operating cost”. It includes all items of expenditure incurred in connection with the operation of services. Minimising the operational cost leads to reduction of losses and thereby improving the operational performance of the Corporation. Audit analysed the various components of operational cost and major observations relating to it are discussed in the succeeding paragraphs.
Reduction in fuel cost by increasing fuel efciency
2.11.1 Fuel is a major cost element which constituted 33 to 38 per cent of total expenditure during the period 2011-12 to 2014-15. Fuel efciency is measured in terms of Kilometre per Litre (KMPL). The Corporation has xed target for KMPL considering local conditions and past experience. The Table 2.5 gives the targets xed vis-à-vis actual fuel efciency achieved.
Table 2.5: Fuel efciency targets and achievement there against Sl. No.
Particulars Year 2012-13 2013-14 2014-15 2015-16 2016-17
1. Target for diesel buses (in KMPL) 5.51 5.50 5.50 5.50 5.53 2. Achievement for diesel buses (in KMPL) 5.50 5.49 5.48 5.48 5.42 Source: Information provided by Corporation.
As can be seen from the above Table, the Corporation was very near to achieving the target set for fuel efciency in terms of KMPL. In fact, the Corporation achieved higher KMPL in comparison to some other STUs like Andhra Pradesh SRTC, Karnataka SRTC, Maharashtra SRTC and Uttar Pradesh SRTC.
The Management stated (December 2017) that the targets are xed based on total operated kilometres of previous years and consumption of diesel thereon. It was further stated that due to upgradation of emission norms, the engine horse power is required to be enhanced which also resulted in decrease in KMPL. The Corporation has purchased 600 buses following the above norms.
Chapter II, Performance Audit relating to Statutory Corporation

32
Audit analysed reasons for higher fuel cost which are discussed in subsequent paragraphs:
Fuel cost not reduced by procuring fuel efcient buses
2.11.2 The Corporation was aware that mini-buses have better KMPL (6.74 to 7.04) compared to ordinary buses (5.42 to 5.50). However, as brought out in Paragraph 2.10.1, the decision to purchase mini-buses though taken in June 2012 was partially implemented only in September 2015. In September 2013 though 1,015 ordinary buses were purchased, no mini-buses were purchased. Timely procurement of mini-buses and their deployment by replacing ordinary buses (where load factor was low) during the period 2012-13 to 2016-17 could have resulted in saving of fuel expenditure.
The Management stated (December 2017) that the Corporation proposed (January 2013) to GoG to purchase 200 and 300 mini-buses for the period 2012-13 and 2013-14 respectively but GoG approved (September 2013) to procure 1,050 buses during the period 2012-13 and 2013-14 which included only 50 mini-buses. It was further stated that for the years 2016-17 and 2017-18, the Corporation planned to purchase 775 mini-buses for which the tenders were under nalisation. Management further stated that the ordinary buses though having a higher KMPL had other advantages like lower maintenance cost, higher life and higher load carrying capacity.
The reply is not convincing because the Corporation planned procurement of mini-buses after considering its benets vis-à-vis ordinary in June 2012. However, the actual procurement of mini-buses commenced only in September 2015. Better co-ordination and liasioning with GoG by the Corporation could have enabled the Corporation to procure mini-buses at an early date.
Dead Kilometres
2.11.3 Dead kilometre arises out of operation of buses between bus stand and depot or fuelling point, kilometres operated to send buses for docking, repairing and reconditioning, diversion etc. Dead kilometre is the balance of gross operated kilometre minus effective kilometre12. The dead kilometres do not earn revenue. The details of dead kilometres vis-à-vis gross kilometres operated from 2012-13 to 2016-17 are given in table below:
Table 2.6: Comparison of increase in dead Km vis-à-vis gross Km Sl. No.
Particulars Year 2012-13 2013-14 2014-15 2015-16 2016-17
1. Gross km (In lakh) 10,457 10,472 10,701 10,797 10,865 2. Effective KM (In lakh) 10,349 10,328 10,558 10,665 10,741 3. Dead KM (In lakh) 108 144 143 132 124 4. Percentage of dead KM to gross KM
(Sl. No. 3/1) 1.03 1.38 1.34 1.22 1.14
Source: Information provided by Corporation.
12 Total revenue earning kms wherein the revenue is received through sale of tickets to passengers are
known as effective kms.
Audit Report (PSUs) for the year ended 31 March 2017 - Report No. 3 of 2018

33
It may be seen from the above table that dead kilometres as a percentage of gross kilometres reduced marginally from 1.38 in 2013-14 to 1.14 in 2016-17. During test-check of divisions, Audit observed that in two cases, dead Km could have been avoided by the Corporation as discussed below:
· In Central Bus Stand (CBS), Vadodara, the fuel station was within the CBS premises. However, during re-development of CBS under Public Private Partnership (PPP) mode, there was no provision for workshop/ fuel station in the CBS. As a result, fuel station in the new CBS was not constructed. For fuelling and regular maintenance, the buses are required to go to Panigate bus depot since February 2014, i.e., nine KMs away from the CBS Vadodara every day resulting in dead KMs of 1,224 km per day both ways for the 68 schedules. This led to extra fuel expenditure of ₹ 2.18 crore for the period February 2014 to March 2017.
· In Ahmedabad CBS, there was a fuel station for CNG and diesel within the premises till 2010-11. In the master plan for the construction of new CBS under PPP at the same place, a provision for the workshop/ fuel station was made. However, the fuel station was not constructed in the earmarked area, the reasons for which were not on record. As a result, the buses are now diverted to Chandola Depot (in Ahmedabad) resulting into dead KMs of 236 km per day and additional fuel expenditure of ₹ 0.53 crore for the period September 2014 to 2016-17.
The Management stated (December 2017) that out of the 126 depots of the Corporation, most of the depots are located at place different from the bus stand resulting in dead kilometres for the purpose of fuelling & normal maintenance.
The reply is not convincing as it does not state the reasons for not providing fuel station for CNG and diesel at CBS, Vadodara and Ahmedabad.
Inadequate recovery of toll tax
2.11.4 The Corporation proposed (July 2011) to GoG to change the rates of toll tax recoverable from passengers from the at rate of ₹ one per passenger to the range of ₹ 1 to ₹ 7 where the range of toll tax payable by the Corporation was ₹ 50 to ₹ 301 and above. GoG approved (January 2012) the proposal and the rates were implemented from 13 January 2012.
Audit observed that though the Corporation got partially compensated against the impact of toll tax due to the revised rates, there was still short recovery to the extent of ₹ 56.05 crore13 during the period 2012-13 to 2016-17 as the new rates assumed a load factor of 100 per cent against the actual load factor of the buses of 69 per cent. Further, toll taxes are subject to yearly increase based on price index formulae, which have not been factored in by the Corporation in its proposed rates.
13 2012-13 : ₹ 7.80 crore, 2013-14 : ₹ 8.93 crore, 2014-15 : ₹ 9.93 crore, 2015-16 : ₹ 17.15 crore and
2016-17 : ₹ 12.24 crore.
Chapter II, Performance Audit relating to Statutory Corporation

34
The Management while accepting the fact stated that the Corporation was constantly striving to lessen the burden of toll tax by getting exemption from Government.
Excess crew
2.11.5 The manpower cost constituted 34 to 39 per cent (2011-12 to 2014-15) of the total cost of the Corporation. Optimum utilisation of manpower and control over its cost are essential to achieve high productivity and saving in cost. The table below provides the details of manpower, its cost and productivity during 2012-13 to 2016-17.
Table 2.7: Statement of manpower cost and manpower per bus employed Sl. No. Particulars 2012-13 2013-14 2014-15 2015-16 2016-17
1 Total Manpower (Nos.) 40,370 40,070 39,257 39,707 37,688 2 Manpower Cost (₹ in crore) 1,014.92 1,048.04 1,070.78 1,108.89 1,172.58 3 Effective KMs (in lakh) 10,349.00 10,327.58 10,557.66 10,665.37 10,740.52 4 Productivity per day per
person (KMs) (Sl. No. 3/Sl. No. 1/365)
70.23 70.61 73.68 73.59 78.07
Source: Information provided by Corporation.
It could be seen from the Table 2.7 that during 2012-13 to 2016-17, the manpower cost increased by 15.53 per cent. The productivity per day per person (in Kms) increased by 11.16 per cent. The increase in productivity was lesser in proportion to the increase in manpower cost. As compared to the previous years, during 2016-17 though the total manpower reduced, the Corporation was able to achieve more effective Kms.
As per the settlement (August 1987) with the workers union, the normal duty hours prescribed for operating crew is 11 hours, which includes steering duty of 8 hours. Against this the Corporation was able to achieve normal duty ranging between 8.15 to 8.30 hours and steering duty ranging between 6.56 to 7.24 hours. Based on the normal duty hours, on an average, each bus schedule required 5.25 persons14 forming two crew per schedule and including prescribed reserve ratio for the weekly off and leave. As steering duty hours achieved by the Corporation was lesser than the settlement, Audit analysed whether the kilometres operated could have been achieved with lesser manpower and thereby avoided excess crew as given in Table below.
14 2 drivers and 2 conductors for to and fro for one route + 0.66 person for weekly off (4*1/6) + 0.59
Leave Reserve (4.66*1/8).
Audit Report (PSUs) for the year ended 31 March 2017 - Report No. 3 of 2018

35
Table 2 8: Excess crew due to non-achievement of norms. Sl. No.
Particulars 2012-13 2013-14 2014-15 2015-16 2016-17
1 Persons in position (crew staff) 30,113 29,986 29,535 30,052 28,482 2 Average steering duty hr/ per crew 7.10 7.12 7.24 7.17 6.56 3 Average spread duty hr/ per crew 8.16 8.15 8.30 8.16 8.13 4 Average crew utilisation (in KMs) per
day 257 263 269 273 274
5 Gross km operated (in lakh KM) 10,456.98 10,472.10 10,700.71 10,796.98 10,865.28 6 Persons required as per norms15 (crew
staff) 29,262 28,636 28,609 28,443 28,519
7 Excess persons (crew staff) (Sl. No.1-6) 851 1350 926 1,609 (-) 37 Source: Information at Sl.No.1 to 6 provided by Corporation and gures at Sl.No.7 are
derived based on the information.
As seen from the above table, the crew was not utilised optimally as per settlement. There was excess crew available with the Corporation during 2012-16 than required. The issue was also highlighted in Paragraph 3.14.1 to 3.14.4 of the Report of the Comptroller and Auditor General of India (Commercial) for the year ended 31 March 2009, Government of Gujarat.
The Management stated (December 2017) that crew utilisation in numbers and KMs are not mutually connected with each other due to different average utilisation of crew duty in different types of buses, difference in crew use along with crew duty hours as per types of service, shortage of administrative staff leading to diversion of crew and unavoidable leave due to illness, accidents, license and suspension of crew.
The reply is not convincing as Audit had worked out excess crew considering average crew utilisation as per settlement norms. The manpower utilisation for 2016-17 proves that the Corporation could achieve better utilisation of the available manpower.
Non-rationalisation of terms of hiring contracts
2.11.6 The Corporation decided (2009-10) to start Volvo bus service through hiring contracts. Accordingly, the Corporation entered into agreements with private parties to provide Volvo buses. As on 31 March 2017, the Corporation had hired 39 Volvo buses. The Corporation had the exibility of operating the hired Volvo buses on any of the routes as decided by the Corporation and change its trip or route. The important terms and conditions of the contracts were as below:
15 Worked out by rst dividing Gross Kilometre by the product of (Average crew utilisation in KMs x
365) which will give the crew utilised per year by the Corporation. As two crew are required for a schedule of 24 hours and it consists of 5.25 persons, one crew will require 2.625 persons. The crew utilised per year multiplied by 2.625 will give the persons required.
Chapter II, Performance Audit relating to Statutory Corporation

36
Table 2.9: Important terms and conditions of Volvo contracts Year of Agreement 2010 2014 2016
Name of party Konduskar Travels Modern Tours & Travels, Sai Tours & Travels Konduskar Travels
Konduskar Travels
Period of contract 5 + 1 years (Up to 2015)
4 + 1 years (Up to 2018) 4 + 1 years (Up to 2020)
Diesel fuel station GSRTC owned Private Fuel pumps GSRTC owned Diesel Consumption Clause
Diesel usage at the rate of 3 KMPL will be borne by Corporation. Diesel in excess 3 KMPL to be recovered from contractor
Payment to be done at rate of fuel pump decided by the contractor. Diesel usage at the rate of 3.15 KMPL will be borne by Corporation. Diesel in excess 3.15 KMPL to be recovered from contractor
Contractor will be responsible for increase/ decrease in KMPL. However, ideal KMPL not mentioned.
Source: Information provided by Corporation.
Audit observed that the Corporation incurred a net loss of ₹ 7.03 crore during March 2011 to March 2017 on operation of Volvo buses. A review in Audit of trip-wise earning and cost incurred for operating the Volvo bus es during 2015-16 and 2016-17 revealed that out of total 74,533 trips operated during this period, the Corporation incurred loss of ₹ 6.84 crore in 20,972 trips. Further, it was observed that the Ahmedabad-Rajkot-Raiya-Surat trips were operated even though these trips were running in persistent losses due to low trafc. This indicated that the Corporation did not review trip-wise / route-wise earnings generated and cost incurred on operation of Volvo buses.
In the hiring contracts entered into in 2014, the Corporation was required to compensate the diesel expenses of operator at the rate of private fuel pumps because in 2014 the bulk rates were higher than retail rates of diesel. Subsequently, the bulk rates were reduced by the oil Companies in August 2014. But as the hiring contracts of 2014 did not have an enabling clause to change the fuel pumps in the event of decrease in bulk prices, the Corporation continue to pay the higher prices of private fuel pumps. During the period 2014-15 to 2016-17, the Corporation paid ₹ 25.29 crore to contractors for the diesel lled from the private fuel pumps. Had the diesel been taken from the Corporation’s own pumps during this period, the fuel cost could have reduced by ₹ 1.36 crore.
As the Corporation is already incurring losses in its own services, the terms and conditions of hiring contracts need to be rationalised so that the Corporation does not incur losses in hiring contracts.
The Management reiterated (December 2017) that as the bulk price of diesel was more than the retail price, the condition to purchase diesel from outside was inserted in the contract entered in the year 2014.
The reply is not convincing because the Corporation could have inserted an enabling clause to ll diesel from private pumps in the event of a fall in price of retail diesel rather than limiting the fuel station to private fuel pumps only for a period of four years.
Audit Report (PSUs) for the year ended 31 March 2017 - Report No. 3 of 2018

37
Financial Management
2.12 As depicted in Annexure 4, the main source of long term funds for the Corporation are equity and borrowings from GoG and GoI. The funds for the day to day operations are met through revenue earning from the buses and subsidies received from the GoG. An efcient nancial management of the Corporation requires that fare revisions include all allowable elements of cost and are got approved at regular intervals to ensure sufcient receipt of revenue, subsidy claims are submitted in time and accurately to the GoG, the dues from GoG are recovered without delay, funds received from GoG in advance of requirement are prudently invested to earn maximum revenue, and the system of collection and remittance of daily revenue ensures funds are not blocked at any level. Major observations relating to these areas are discussed below:
Delays in Fare revisions
2.12.1 The GoG devised (25 February 2003) a formula for passenger fare revision under which the Corporation could submit the fare revision proposals if there is increase/ decrease in the dearness allowance of employees and in the cost of fuel, tyres, tubes and chassis to a given extent. If fare revision was required for increase in cost of items other than those mentioned above, the quantum of its impact on fare revision had to be specically computed by the Corporation. Prior approval of GoG had to be obtained for any increase in the fare. The details of proposal sent and approved by the GoG for the period 2012-13 to 2016-17 is as under:
Table 2.10: Details of proposal sent and approved by GoG during 2012-13 to 2016-17
Date of proposal submitted by
Trafc Section
Date of proposal sent
to GoG
Percentage change
proposed
Date of approval of
GoG
Percentage change approved
by GoG
Date of effect of revision
14-09-2012 20-11-2012 (+) 16.02 GoG did not reply to GSRTC 21-12-2012 (+) 18.43 Proposal sent including MACT claim amount.
However, GoG did not reply to GSRTC 18-01-2013 (+) 32.50 02-03-2013 (+) 15.00 04-03-2013
19-07-2013 08-08-2013 (+) 15.15 21-12-2013 (+) 15.15 22-12-2013 25-07-2014 28-07-2014 (-) 8.51 13-08-2014 (-) 8.51 15-08-2014 17-01-2015 29-01-2015 (-) 6.21 GoG did not reply to GSRTC Source: Information provided by Corporation
Audit observed that the Corporation did not submit the proposal for fare revision on half yearly basis. However, no reasons for the same were on record.
Audit further noticed that the GoG accorded (10 December 2012) approval to include the Motor Accident Claim Tribunal (MACT) claim in the proposal for fare revision. Accordingly, the Corporation submitted (21 December 2012) the proposal including annual estimated MACT claim of ₹ 37.16 crore. However, in the proposal dated 08 August 2013 and 28 July 2014 the Corporation did not include the actual MACT claims of ₹ 28.26 crore for 2012-13 and MACT claim of ₹ 20.62 crore for the year 2013-14 respectively.
Chapter II, Performance Audit relating to Statutory Corporation

38
Due to above omissions, the approval granted by GoG in December 2013 and August 2014 did not factor this element for fare revision.
On implementation of sixth pay commission, the Corporation paid ₹ 136.81 crore (during 2011-17) towards arrears of pay, however, it did not consider it for proposing the fare revisions hence the same remains unrecovered (up to March 2017).
The Management stated (December 2017) that the Corporation has made timely fare revision proposal to GoG. Further, it was stated that in proposal of December 2012, an estimated MACT claim for the period 2012-13 to 2013-14 was considered. It was also stated that in the fare revision proposal submitted to GoG on 16 June 2017, the proposal for increase was made after considering the estimated MACT expenses of ₹ 75 crore for the period 2014-15 to 2016-17. The approval for the latest fare revision is under consideration of the GoG.
The reply is not convincing because the Corporation had not submitted fare proposal on half yearly basis. Further, MACT expense was included on estimated basis for one year only i.e. 2011-12 in the fare proposal of December 2012. As a result, the MACT expense for the period 2012-13 and 2013-14 remained unrecovered through fare proposal. The reply does not give the reasons for not considering the pay arrears in fare revision proposals.
Subsidy claims
2.12.2 The Corporation receives three types of subsidies from GoG viz., (i) for operation of buses on city route (city losses) (ii) for obligatory services operated on uneconomic routes and (iii) for concession provided to students in Gujarat. For reimbursement of subsidy, the Corporation submits the claims to GoG every year. The subsidy claims are prepared on estimate basis. The subsidies released by the GoG for the year are accounted for only on actual receipt. However, the same is not according to the claim made which results in shortfall against the claims for the subsidy.
GoG constituted (25 February 2004) a Committee to settle the subsidy claims and form directive principles and procedure for settlement of claims. The Committee xed (31 July 2010) ve16 efciency parameters to be achieved based on which subsidy amount payable to the Corporation was to be determined each year after verication of claims. In case of non-achievement, penalty @ 200 per cent would be levied against each parameter. During the period 2010-11 to 2016-17, the Corporation submitted annual subsidy claims of ₹ 5,269.64 crore against which the GoG periodically released ₹ 3,936.05 crore resulting in a shortfall of ₹ 1,333.59 crore as detailed in Table 2.11:
16 Fuel efciency, Vehicle productivity, Increase in non-trafc income, Break-down and eet
utilisation.
Audit Report (PSUs) for the year ended 31 March 2017 - Report No. 3 of 2018

39
Table 2.11: Details of claim for Shortfall of subsidy (₹ in crore)
Year Opening balance of shortfall in subsidy
reimbursement
Total subsidy claimed
Subsidy reimbursed
by GoG
Closing balance of shortfall in subsidy
reimbursement 2010-11 Nil 684.34 501.00 183.34 2011-12 183.34 675.50 501.00 357.84 2012-13 357.84 728.25 600.00 486.09 2013-14 486.09 812.10 600.00 698.19 2014-15 698.19 713.89 713.89 698.19 2015-16 698.19 757.17 536.54 918.82 2016-17 918.82 898.39 483.62 1333.59 TOTAL 5,269.64 3,936.05
Source: Information provided by the Corporation
In addition to the yearly claims for the subsidy, the Corporation submitted two claims (October 2012 and March 2017) to recover the shortfall in subsidy. The details of the claims lodged by the Corporation for shortfall in subsidy are discussed below:
Submission of claims to recover shortfall in subsidy
2.12.2.1 The Corporation submitted (October 2012) a claim for shortfall of subsidy for 2010-11 to 2012-13 amounting to ₹ 585.09 crore. Against this, the GoG reimbursed ₹ 99.00 crore in March 2013. The GoG approved the claim for remaining ₹ 486.09 crore in February 2013 and asked the Corporation to include the same in the ensuing budget provision. Audit observed that the same did not materialise as the Corporation did not make provision in the Revised Estimate for the year 2012-13 and the Budget Estimate for the year 2013-14.
The Corporation submitted (March 2017) another claim of ₹ 1,333.59 crore for shortfall in subsidy for the period 2010-11 to 2016-17. Audit observed that the second claim was submitted after a period of more than four years from submission of rst claim.
Audit observed discrepancies in the second claim for shortfall of subsidy as discussed below:
· At the time of submission of outstanding claim for 2010-11 to 2016-17 in March 2017, the Corporation was aware of the actual gures of expenditure for the period 2010-11 to 2015-16. Even at the time of submission (November 2017) of budgeted estimate for the year 2018-19-
to GoG, it was aware of the actual expenditure incurred during 2016-17. However, the Corporation did not revise its original claims based on actual expenditure. The Corporation, therefore, claimed excess subsidy to the tune of ₹ 404.60 crore as shown in the table below:
Chapter II, Performance Audit relating to Statutory Corporation

40
Table 2.12 : Details of excess subsidy claim (₹ in crore)
Year Total subsidy claimed based on budgeted
estimates
Subsidy receivable based on actual
expenditure
Excess subsidy claim
2012-13 728.25 723.55 4.70 2013-14 812.10 740.85 71.25 2014-15 713.89 730.71 (-) 16.82 2015-16 757.17 564.24 192.93 2016-17 898.39 745.85 152.54 TOTAL 3,909.80 3,505.20 404.60
Source: Information provided by the Corporation
· The Corporation calculated the penalty for the period 2010-11 to 2016-17 based on actual gures as ₹ 47.28 crore which consisted of ₹ 36.04 crore for non-achievement of eet utilisation target, ₹ 8.49 crore for non-achievement of targeted increase in non-trafc revenue and ₹ 2.75 crore for excess breakdown than target xed. The penalty of ₹ 36.04 crore for non-achievement of eet utilisation target was overstated by ₹ 13.25 crore17 due to considering eet utilisation target as 95 per cent instead of 93 per cent xed and considering operating revenue instead of trafc revenue for the calculation. This led to short claim of ₹ 13.25 crore.
· The claim for losses due to city services was to be worked out after deducting cost of operations from income generated on these services. However, the Corporation considered only trafc income instead of total income generated through these services which resulted in excess claim of ₹ 40.28 crore (Total income ₹ 170.31 crore less trafc income ₹ 130.03 crore) for 2012-13 to 2016-17.
· As pointed out in Paragraph 2.10.5, the GoG was to compensate uneconomic trips where they were obligatory and Corporation had also decided from its side not to run express buses on uneconomic trips as there was no obligation to run such trips. However, the Corporation ran express buses on uneconomic routes also and claimed subsidy for such uneconomic express trips. The extent of subsidy claimed for uneconomic trips and how much of it was for express trips for the period 2012-13 to 2016-17 are shown in the Table below: Table 2.13: Claim of subsidy for uneconomic express KMs during 2012-13 to
2016-17 Year Total
mofussil Km
operated (in lakh)
Express Ordinary Subsidy claimed (₹ in crore)
KM operated (in lakh)
Derived uneconomic
Km (in lakh)
Per cent
KM operated (in lakh)
Derived uneconomic
Km (in lakh)
Per cent
Total subsidy
Worked out by Audit
Express Ordinary
2012-13 10,058.38 4,475.86 2,955.86 66.04 5,582.52 4,945.00 88.58 413.35 148.98 264.37 2013-14 10,090.18 4,559.09 3,098.81 67.97 5,531.09 5,135.62 92.85 360.98 136.35 224.63 2014-15 10,331.85 4,570.59 2,940.26 64.33 5,761.26 5,265.79 91.40 279.58 101.14 178.44 2015-16 10,436.05 4,621.05 1,983.35 42.92 5,815.00 5,070.68 87.20 105.93 30.35 75.58 2016-17 10,496.05 4,556.05 2,607.88 57.24 5,940.00 4,160.41 70.04 269.52 87.36 182.16 1,429.36 504.18 925.18 Source: Information provided by the Corporation
17 ₹ 36.04 crore (Calculated by Corporation) less ₹ 22.79 crore (calculated by audit).
Audit Report (PSUs) for the year ended 31 March 2017 - Report No. 3 of 2018

41
There was nothing available on record as to how the Corporation classied a trip as obligatory. Table 2.13 indicates that 70 to 93 per cent of the ordinary trips and 43 to 68 per cent of the express trips were uneconomic for which subsidy was being claimed considering these as being obligatory. Thus, the Corporation had made an unwarranted claim of subsidy for the uneconomic express trips of ₹ 504.18 crore though there was no obligation to run express trips on uneconomic routes.
As a result of the calculations done by Audit the outstanding claim of ₹ 1,286.31 crore will get reduced to ₹ 854.58 crore18. Further the Corporation had also claimed subsidy for express trips of ₹ 504.18 crore, though there was no obligation to run express trips on uneconomic routes.
The Management stated (December 2017) that due to a mistake in the proposal sent in March 2017, the amount of subsidy receivable by Corporation was mentioned as ₹ 1,333.59 for the period 2010-11 to 2016-17 in place of ₹ 847.50 crore for the period 2013-14 to 2016-17. Further, the subsidy amount of ₹ 470.81 crore (net of penalty ₹ 15.28 crore and ₹ 99 crore received in March 2013) to Corporation for the period 2010-11 to 2012-13 would be proposed in the revised budget estimate for the year 2017-18.
The reply is not convincing as it is silent on the audit observation on incorrect calculation of penalty for not meeting the efciency parameters, incorrect subsidy claim for losses due to city services and unwarranted claim for running express buses on uneconomic routes.
Outstanding dues
2.12.3 Huge outstanding from GoG was observed for long period of time affecting the fund available for day to day operations of the Corporation as discussed below:
Outstanding dues on casual contracts
2.12.3.1 The Corporation gives its buses on hire (on casual contract) to private parties, GoG and Police Department as per their requisitions. The parties are required to pay the charges in advance at prescribed rates ranging from ₹ 16 to ₹ 71 per kilometre or ₹ 34 to ₹ 118 per hour, whichever is higher at the time of booking. The deposits are adjusted after the completion of the contract. Audit observed that an amount of ₹ 21.66 crore was lying outstanding in respect of 10 divisions19 from private parties, GoG and Police Department up to 2016-17. Out of this outstanding ₹ 17.01 crore was from GoG. Since the Corporation was running in huge losses, it should have pursued the matter with GoG, Police Department and private parties on regular basis for recovery of the outstanding amounts.
18 ₹ 1,286.31 less ₹ 40.28 crore less ₹ 404.60 crore plus ₹ 13.25 crore. 19 Ahmedabad, Bharuch, Bhavnagar, Himmatnagar, Junagadh, Mehsana, Surat, Vadodara, Valsad and
Nadiad.
Chapter II, Performance Audit relating to Statutory Corporation

42
The Management stated (December 2017) that the Corporation has been taking up the matter through correspondence from time to time with the respective contracting parties.
The Corporation needs to take concrete steps for recovery of outstanding dues.
Failure to observe prudent investment practices
2.12.4 The GoG releases funds in the form of equity and loans for the purchase of buses and chassis. The funds are rst deposited in the Corporation’s Personal Ledger Account (PLA) from where they are transferred to Gujarat State Financial Services Limited (GSFS) deposits based on the timing when the funds would be required. As per the policy of GSFS, in case of partial premature withdrawals, the remaining amount of deposit will continue to earn interest at the original rate till maturity only for GoG entities. Audit analysed the investments made in GSFS and also the management of daily collections at division level by the Corporate ofce. The observations are discussed below:
2.12.4.1 Interest loss due to shorter duration investments in GSFS
· GoG released ₹ 290 crore during 2012-13 for purchase of buses. The Corporation invested the same in Inter-Corporate Deposit (ICD) for the shorter period ranging between 30 to 90 days and earned interest at the rate of seven per cent. However, the Corporation invited tender for purchase of diesel chassis only in October 2013 and the order was placed in April 2014. As the Corporation was aware of the delay in nalization of tender and consequent delay in its award, the amount should have invested for one year to get the benet of higher rate of interest. This resulted in shortfall in the interest receipt to the extent of ₹ 5.19 crore20.
· During 2014-15, GoG released (March 2015) ₹ 90 crore for purchase of buses which was invested in ICD for 181 days and on maturity the same was again invested for further 181 days. As on 31 March 2015, as the Corporation had unutilized funds of ₹ 107 crore (received in 2012-13), it could have invested the fund of ₹ 90 crore for a period of one year. By not doing so, the Corporation could not earn additional interest of ₹ 1.78 crore 21.
· Further as per the policy of GSFS, in case of GoG entities, even when there are premature partial withdrawals the remaining balance will continue to earn interest at the original rate till maturity. In the above cases the Corporation, therefore could have availed this benet.
20 Calculated considering GSFS rate of interest @ 9 per cent on investment of ₹ 72.5 crore, ₹ 100
crore, ₹ 82 crore and ₹ 26 crore for the period ranging from 30 to 90 days. 21 Calculated considering GSFS rate of interest @ 9 per cent on investment of ₹ 90 crore for the
period of 181 days.
Audit Report (PSUs) for the year ended 31 March 2017 - Report No. 3 of 2018

43
The Management stated (December 2017) that in spite of staff shortage, best efforts are being made not to lose interest on funds invested. It was also stated that based on Audit observation, necessary instructions have been issued to all concerned.
Substantial balances in non-interest bearing PLA account
2.12.4.2 The GoG directed (July 1995) GoG entities to deposit all surplus22 fund released by it in form of grant, equity, loan subsidy, etc., in GSFS. It further stated (31 March 2011) that the PLA of the Corporation which was till then earning interest shall be declared as non-interest bearing. As on 01 April 2011, the Corporation was having ₹ 389 crore in its PLA which it deposited in GSFS in May 2011. However, it continued to have huge balances ranging from ₹ 1.98 crore to ₹ 439.99 crore in non-interest bearing PLA. In this regard, Audit observed that out of the 60 months in 2012-17, the Corporation had the balances of more than ₹ 10 crore in 46 months. Further, during 2016-17 the balance of ₹ 439 crore was kept idle for 27 days in PLA. This resulted in potential loss of interest of ₹ 3.96 crore23.
The Management stated (December 2017) that due to delay in approval by competent authority, the fund received from GoG and those lying in PLA, were parked with GSFS with delays. However, the necessary instructions have been issued for future.
Huge balances in current accounts
2.12.4.3 The Corporation operates 17 current accounts (one with Central Ofce and one each with 16 divisions) to receive the remittances from daily revenue (passenger fare, casual contract license fees etc.) earned by the divisions. In addition, it also operates 20 current accounts (Four with central ofce and one each with 16 divisions) for daily payments and withdrawals. For making payments the central ofce transfers funds to the current account of divisions based on their demand. On scrutiny of the current accounts, Audit observed that there was huge daily balance lying unutilised at Central Workshop Account (CWA) of Central ofce during 2012-13 to 2015-16 ranging from ₹ 0.10 crore to ₹ 48.26 crore. Further, during the 48 months period from 2012-13 to 2015-16, the Corporation had the minimum balances of more than 1 crore in 44 months.
Based on the test-check of records, Audit worked out the average of the monthly minimum balance for 2015-16 as ranging from ₹ 19.46 lakh to ₹
3.12 crore in respect of seven accounts24 maintained at division ofces and Central
Ofce, Ahmedabad. Since the Corporation was running in huge losses, it could have earned some interest by depositing the idle balances lying in the current accounts in GSFS’s ICDs. 22 As per FD’s instruction (December 1999), surplus would mean any operating surplus with the
enterprise in form of cash in current account with bank or otherwise that is required in future date even after one day for the enterprise.
23 Calculated by taking minimum balance of the month from 2012-13 to 2016-17 at the LDR of 6 to 7 per cent.
24 Ahmedabad, Bhavnagar, Mehsana, Nadiad, Vadodara, CWA and Account Section (at Central Ofce).
Chapter II, Performance Audit relating to Statutory Corporation

44
The Management stated (December 2017) that necessary instructions have been issued in this regard.
Internal Control and Monitoring
2.13 An effective internal control mechanism is an integral process within an entity which provides reasonable assurance of economical, efcient and effective operations and adequate safeguards for entity’s resources against loss. The Management Information System takes care of reporting on achievements of targets and guides the management in addressing system deciencies. Under Rule 29 of the Road Transport Rules, 1971, the Corporation is required to form Peripatetic Audit Parties (PAP) which carries inspections of initial records and accounts maintained by the units. Review of internal control mechanism of the Corporation showed the following:
· The MIS reports generated for monitoring of operations on quarterly basis, were not submitted to BoD after December 2015.
· No PAP was constituted during the review period and hence internal audit was not conducted during 2012-13 to 2016-17. In absence of internal audit, top Management could not be apprised of any weaknesses in various systems and procedures followed in divisions/ depots and recommend remedial action.
· The Corporation has not prepared Bank Reconciliation Statement (BRS) of 17 bank accounts since 2010-11. In absence of BRS, Management could not verify the correctness of the bank balance available with the Corporation. Also, the possibility of frauds or mis-appropriation of funds from the Bank Accounts could not be ruled out.
· All the modules of Integrated Depot Management System and Integrated Information Management System & Decision support system (IIMS & DS) were still not operational though the work on it started in 2007 and 2013 respectively. Due to this, the objective of data extraction and its use in day to day operations by the top management in decision making was defeated.
Besides, Audit observed inadequate monitoring by top management as regards timely submission of subsidy claims, fare revision proposals, management of funds and procurement of buses as discussed in the preceding paragraphs.
The Management while accepting the facts stated (December 2017) that MIS reports will be submitted to BoD henceforth. It was also stated that PAP has been started from October 2017. It was also informed in the reply that the Corporation has developed BRS software which is in operation at division level.
Conclusion and Recommendations
2.14 Gujarat State Road Transport Corporation was established to provide an efcient, adequate, economical and properly co-ordinated Road Transport
Audit Report (PSUs) for the year ended 31 March 2017 - Report No. 3 of 2018

45
services. As on 31 March 2017, the Corporation had a eet strength of 7,603 buses and carried on an average 21.61 lakh passengers per day during 2016-17. The share of Corporation in public transport decreased from 15.48 per cent in 2012-13 to 12.30 per cent in 2016-17. The areas of concern in relation to the performance of the Corporation on operations, nancial management and internal control and monitoring are discussed below:
Operational Performance
The operational performance was decient due to lower eet utilisation, operation of express buses on uneconomic routes, cancellation of scheduled kilometres, non-procurement of fuel efcient mini-buses and inadequate recovery of toll tax.
Financial Management
The management of funds was inadequate as Corporation failed to submit subsidy claims and fare revision proposals in time, did not follow up for recovery of outstanding dues on casual contract and lost opportunity to earn interest income on funds lying idle or deployed for shorter periods.
Internal control and monitoring
The internal control mechanism system was weak coupled with lack of monitoring by top management.
Recommendations
Ø The Corporation may review the routes periodically to optimise its revenue.
Ø The Corporation may submit outstanding subsidy claims and fare proposals in time and prudently invest its idle funds.
Ø Internal control and monitoring mechanism may be adequately strengthened for ensuring economical, efcient and effective operations.
The matter was reported to Government/ Management (July 2017). The reply of Government is awaited (December 2017).
Chapter II, Performance Audit relating to Statutory Corporation

46
Audit Report (PSUs) for the year ended 31 March 2017 - Report No. 3 of 2018