chapter ii 2 performance reviews relating to statutory...
TRANSCRIPT

21
Chapter II
2 Performance reviews relating to Statutory corporations
Punjab State Electricity Board
2.1 Construction and commissioning of Stage II (Units III and IV) of Guru Hargobind Thermal Plant, Lehra Mohabbat
Executive Summary
On the basis of 15th Power Survey conducted (July 1995) by Central Electricity Authority, Punjab State Electricity Board estimated demand gap of 1,111 MW and 947 MW at the end of ninth Five Year Plan period (1997-2002) and tenth plan period (2002-07) in the State of Punjab. To reduce this gap of power, the State Government decided in January 1999 to add generating capacity of 500 MW by setting up two additional units of 250 MW each under Stage II at Guru Hargobind Thermal Plant, Lehra Mohabbat which earlier had an installed capacity of 420 MW under Stage I. The performance audit was conducted to assess economy and efficiency in project planning, execution and commissioning of the units against envisaged standards.
Project planning
The Board/State Government failed to decide the mode of execution of the project for more than three years since the date of techno economic clearance of the project by Central Electricity Authority in September 2000. It was only in December 2003 that the State Government decided to implement the project. Audit scrutiny indicated that the indecisiveness on the part of Board/State Government in deciding the mode of execution of the project resulted in abnormal delay in installation/commissioning of the project with consequential increase in project cost and other avoidable payments. Delay in placement of order for execution of the project resulted in huge time and cost overrun.
Award of contract
The turn key contract for construction of the project was awarded (May 2004) to BHEL on single quotation basis without inviting competitive bidding which deprived the Board of getting competitive rates. Due to improper analysis of BHEL offer, the Board had to incur excess expenditure of
Rs 47.40 crore on price escalation on inadmissible items and wrong application of price variation formula.
Execution of the project
There was cost and time overrun. The expenditure incurred on the project was Rs. 2,353.86 crore as of March 2009 against the estimated project cost of Rs. 1,789.67 crore. Due to substantial time overrun in execution of both the units, the Board was saddled with additional capital costs of Rs. 564.19 crore coupled with avoidable extra expenditure of Rs. 2,061.16 crore (mainly towards purchase of power at very high rates).
Commissioning of the project
The scheduled dates for commissioning of the units-III and IV were December 2006 and March 2007. The Unit-III was synchronised for trial operation in February 2008 and the Unit-IV in August 2008. Due to synchronisation of the units without ensuring completion of all the works, the period of trial operation prolonged abnormally. The Unit-III was commercially commissioned only in October 2008 and the Unit-IV had not been commissioned so far (August 2009). Prolonged period of trial run resulted in excess consumption of inputs of Rs. 18.17 crore, which could not be recovered from BHEL in the absence of enabling clause in the contract.
Conclusion and Recommendations
The Board failed to fulfill the primary objective of bridging the demand gap and also deprived itself of the benefit of interest rebate and interest subsidy.
The review contains five recommendations which include the need to have stringent liquidated damages clause in the contracts and strengthening of the monitoring mechanism to ensure completion of the projects within the stipulated time.
Audit Report (Commercial) for the year ended 31 March 2009
22
Introduction
2.1.1 The Guru Hargobind Thermal Plant (GHTP), Lehra Mohabbat had an installed capacity of 420 MW from two generating units (210 MW each) under Stage-I. These units were commissioned in December 1997 and October 1998. In order to meet the increased demand for power in the State, the Punjab State Electricity Board (Board) installed another two units (Unit III and IV) of 250 MW each under Stage-II in the same plant. The unit-III was commissioned on 16 October 2008 and commissioning of the unit IV was awaited (August 2009). The Board had incurred an expenditure of Rs. 2,353.86 crore on the two additional units up to 31 March 2009.
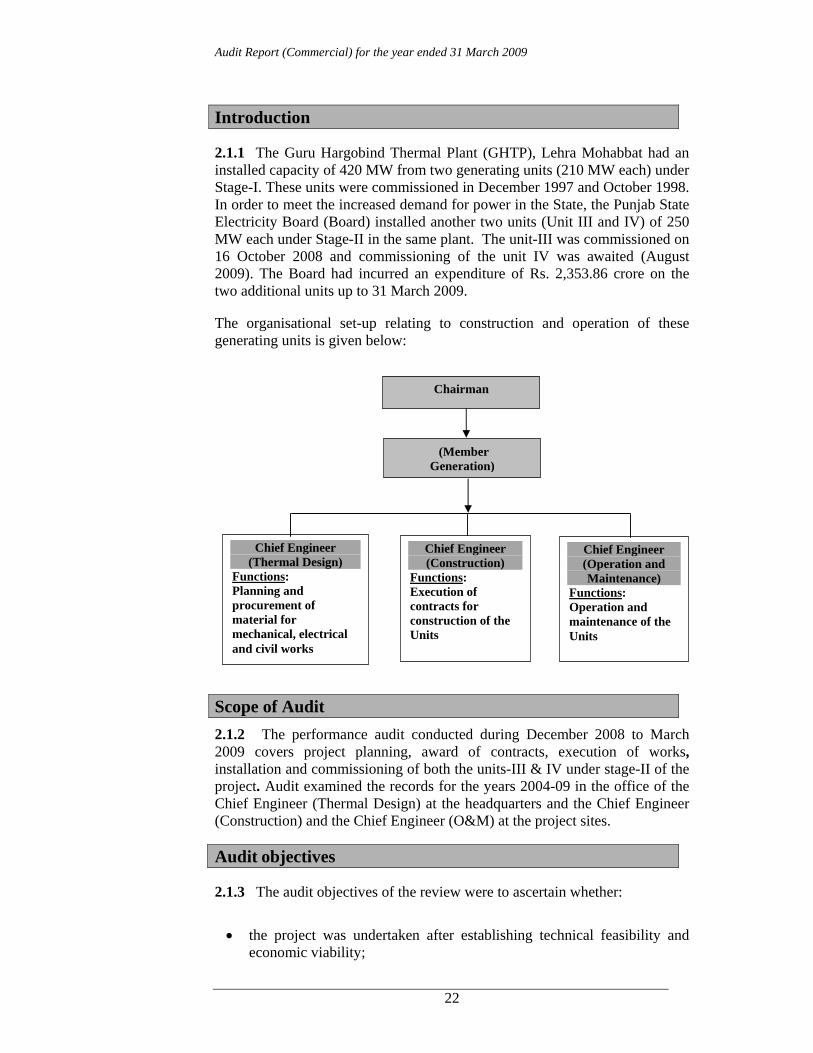
The organisational set-up relating to construction and operation of these generating units is given below:
Scope of Audit 2.1.2 The performance audit conducted during December 2008 to March 2009 covers project planning, award of contracts, execution of works, installation and commissioning of both the units-III & IV under stage-II of the project. Audit examined the records for the years 2004-09 in the office of the Chief Engineer (Thermal Design) at the headquarters and the Chief Engineer (Construction) and the Chief Engineer (O&M) at the project sites.
Audit objectives
2.1.3 The audit objectives of the review were to ascertain whether:
• the project was undertaken after establishing technical feasibility and economic viability;
Chief Engineer (Thermal Design)
Functions: Planning and procurement of material for mechanical, electrical and civil works
Chairman
Chief Engineer (Operation and Maintenance)
Functions: Operation and maintenance of the Units
Chief Engineer (Construction)
Functions: Execution of contracts for construction of the Units
(Member Generation)
Chapter II Performance review relating to Statutory corporations
23
• the contracts were awarded in a competitive and transparent manner with due regard to economy and efficiency;
• the project was executed within the estimated project cost and time; and
• the rules and regulations relating to environmental protection were complied with.
Audit criteria
2.1.4 The following audit criteria were adopted:
• Norms/guidelines of the Central Electricity Authority (CEA) regarding planning and implementation of the project;
• Standard procedures for award of contract;
• Terms and conditions of the contract; and
• Rules and regulations for environmental protection.
Audit methodology
2.1.5 The mix of following methodology was followed:
• Examination of relevant papers/guidelines issued by the CEA/Government from time to time;
• Scrutiny of Agenda and Minutes of the Board Meetings;
• Analysis of the project report, background papers etc. relating to the project;
• Scrutiny of documents relating to loan agreement, tenders, award of contracts, payments made to the contractors; and
• Interaction with the personnel of the Board.
Project planning
2.1.6 On the basis of demand and availability of power assessed by CEA vide its 15th Power Survey (July 1995), the Board estimated that due to growth in the demand for power, the requirement of power at the end of 9th Five Year Plan period (1997-2002) and 10th Five Year Plan period ending March 2007 would be 6,130 MW and 7,578 MW against the availability of 5,019 MW and 6,631 MW respectively. To reduce the gap between demand and supply of power, the Board proposed to set up two additional units of 250 MW each under Stage-II at GHTP, Lehra Mohabbat and submitted (September 1998) the draft project estimate of Rs. 1,550 crore for this project to CEA. The State Government accorded (January 1999) approval to this proposal. The Board prepared (June 2000) the Detailed Project Report of the project, which estimated the cost at Rs. 1,789.67 crore. While according techno-economic clearance to the project, the CEA stipulated (September 2000) that in case the time gap between techno-economic clearance of the project and the actual start
Audit Report (Commercial) for the year ended 31 March 2009
24
of work of the project was three years or more, the Board should obtain a fresh techno-economic clearance of CEA before the start of the work.
In the past, the Board had been executing thermal projects through split-package basis i.e. procuring the main equipment- steam generator and turbo generator etc. from Bharat Heavy Electrical Limited (BHEL) on negotiation basis and the other equipments from other contractors through competitive bidding. In line with that practice, the Board constituted (May 2000) a committee for negotiating the prices with BHEL. In the negotiation committee meeting (August 2001), BHEL offered to supply the main equipment such as boiler and turbo generator at variable price of Rs. 601 crore, which was subsequently (May 2002) reduced to Rs. 590 crore. In the meantime, the neighbouring power utility, Haryana Power Generation Corporation Limited (HPGCL) awarded (March 2002) a contract to BHEL for construction of two similar Units of 250 MW each at Panipat on turnkey basis. The Board also considered (June 2002) to execute the project on turnkey basis and deferred its decision to execute the project till the mode of execution of the project (viz. whether to execute the project on split package basis or get it installed by BHEL on turnkey basis) was decided at the State Government level. Subsequently, the idea of setting up of a special purpose vehicle* (SPV) or some company for execution of the project was also explored.
The Board/State Government, thus, failed to decide the mode of execution of the project for 39 months since September 2000 i.e. the date of techno economic clearance from the CEA. It was only in December 2003 that the State Government decided that the project should be executed by the Board with loan assistance from financial institutions. In spite of the delay in finalising the project for more than three years, the Board neither revised the project cost nor obtained a fresh techno-economic clearance from CEA.
The Board decided to arrange ninety per cent of the project cost as loan from Rural Electrification Corporation (REC) and remaining ten per cent from internal sources.
Audit scrutiny indicated that the indecisiveness on the part of Board/State Government in deciding the mode of execution of the project resulted in abnormal delay in installation/commissioning of the project with consequential increase in project cost and other avoidable payments as discussed in the succeeding paragraphs:
Award of contract
2.1.7 For execution of the project on turnkey basis, the Board selected BHEL on single tender basis without inviting competitive bidding on the presumption that if it resorted to global tendering, it would take more than a year to finalise the same and the project would not come up during the tenth five year plan period. The above contention and compromise of the Board with the basic principle of tendering i.e. competitive bidding for the allotment of this project were not reasonable as the Board took more than one year (November 2002♠ * This is a project/organisation structure created for accomplishment of specific objective for
specific duration, if possible. ♠ When BHEL sent its offer for execution of the project on turn key basis.
The Board/State Government failed to decide the mode of execution of the project for 39 months since the date of techno economic clearance of the project by Central Electricity Authority.
Chapter II Performance review relating to Statutory corporations
25
to March 2004) in finalising the negotiations with BHEL. The departure from the standard practice of inviting competitive bids for the project deprived the Board from getting competitive rates.
The Board decided (March 2004) the contract price on the basis of HPGCL contract with BHEL on turnkey basis for construction of similar units at Panipat at variable price (base date of December 2000) of Rs. 1,438.70 crore (supply of machinery, equipment, cement and steel: Rs. 1,080 crore and civil works and services: Rs. 358.70 crore). The Board awarded (March 2004) the contract to BHEL at a variable contract price (with the base date of November 2003) of Rs. 1,673.87 crore (Rs. 1,261.93 crore for the supply of machinery, equipment, cement and steel and Rs. 411.94 crore for civil works and services). The increase in price by Rs. 235.17 crore was on account of change in scope (Rs. 25.50 crore) and price escalation (Rs. 209.67 crore) during December 2000 to November 2003.
The delay in placement of order for execution of the project due to indecisiveness of the Board regarding mode of execution of the project had resulted in cost overrun of Rs. 209.67 crore on account of price escalation.
Audit further observed that the Board failed to make proper analysis of BHEL offer from the economic point of view. The deficiencies noticed in finalisation of the contract and in arriving at the prices are discussed in the succeeding paragraphs:
Unjustified payment of price escalation 2.1.8 The contract provided for payment of price escalation towards supply of equipment as per specified formulae. It was noticed that while arriving at the basic variable price of Rs. 1,673.87 crore, BHEL was allowed extra price escalation of Rs. 12.42 crore on fixed component (Rs. 5.92 crore) and in steel prices (Rs. 6.50 crore) on the ground that the price variation indices already adopted did not fully compensate the abnormal increase in steel prices in market. The extra payment was not justified because as per the specified price variation formulae, price escalation on fixed component was not admissible and the indices for basic metals had already been included in the specified formulae.
Incorrect computation of price variation for civil works
2.1.9 The contract had two parts: one for supply of plant and equipment which included supply of cement and steel, and the other for civil works and services. The price variation relating to steel and cement was admissible under the first part of the contract applicable for supply of equipment. The price variation on steel and cement relating to civil works was not admissible. However, the Board wrongly allowed the price variation for steel and cement as per the escalation formulae prescribed for civil works (second part of the contract). The Board failed to take note of it during negotiation, which resulted in avoidable price variation of Rs. 19.71 crore, while updating the prices upto November 2003 in respect of components of civil works.
The wrong application of price variation formula for civil works had cascading effect. During execution of the project, the construction wing at project site released payments for civil works by adopting the same price variation formulae, thereby, resulting in excess payment of escalation of
Delay in placement of order for execution of the project due to indecisiveness regarding mode of execution of the project resulted in cost overrun of Rs. 209.67 crore on account of price escalation.
Wrong application of the price variation formulae for civil works resulted in excess payment of Rs. 34.98 crore.
There was unjustified payment of price escalation of Rs. 12.42 crore on inadmissible components.
Audit Report (Commercial) for the year ended 31 March 2009
26
Rs. 15.27 crore on the civil works executed during August 2004 to December 2006. Thus, the wrong application of the price variation formulae for civil works resulted in excess payment of Rs. 34.98 crore.
Execution of contract
2.1.10 The Board had incurred an expenditure of Rs. 2,353.86 crore on construction of the units till March 2009 as against the estimated cost of Rs. 1,789.67 crore. As per terms of the contract, the scheduled dates for commissioning of the units-III and IV were December 2006 and March 2007 respectively. However, the unit-III could be commissioned only on 16 October 2008 and unit-IV has not been commissioned so far (August 2009). Audit analysed the time overrun and cost overrun as discussed below.
Time overrun 2.1.11 There was a delay of 654 days in commissioning of the unit-III and the unit-IV was still to be commissioned (August 2009) even after a lapse of more than two years. The Board attributed the delay in commissioning of the units to:
• delay in supply, erection and commissioning of equipments by BHEL;
• poor management of the project by BHEL- failure to identify critical path and failure to resolve constraints resulting in continued slippage of schedule;
• inadequate work force of BHEL at most fronts;
• delayed engineering/re-engineering by BHEL;
• poor quality control resulting in rework.
Audit, however, observed that all these factors could have been controlled with effective monitoring. BHEL was continuously lagging behind the milestones envisaged in the programme evaluation and review technique (PERT) chart. The Board was well aware that with the continuous slippage of the scheduled targets, the project would not be commissioned by the target dates. Though the Board initiated to solve the problem by conducting regular meetings with BHEL officers at site, yet it did not take up the matter at higher levels. It was only after lapse of scheduled dates of commissioning, the Board took up the matter at the higher levels to enforce BHEL to execute the project without further delay. Had the Board monitored the execution of the project closely on the basis of PERT chart agreed with BHEL and taken up the matter early at higher level at the appropriate time, the abnormal delay in commissioning of the units could have probably been avoided to a great extent. The delay in commissioning of the project led to additional financial burden on the Board which is discussed in the succeeding paragraphs:
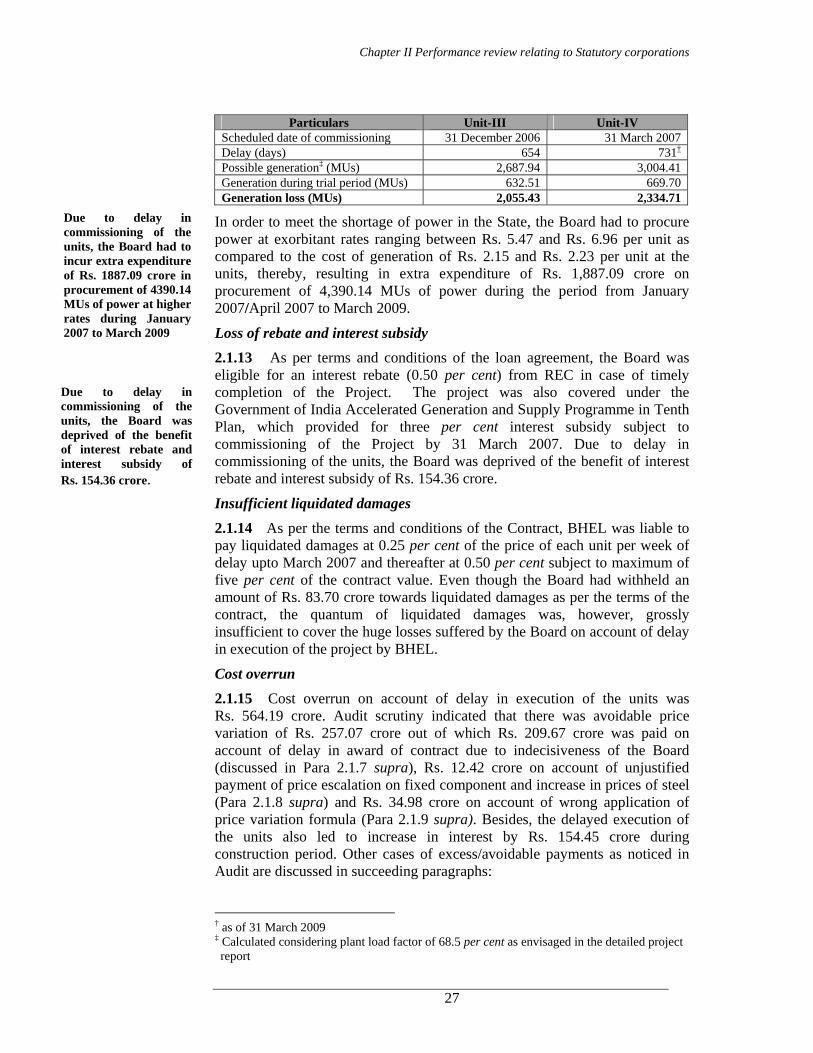
Extra expenditure on purchase of power 2.1.12 Due to delay in commissioning of the units, there was generation loss of 4,390.14 MUs as given in the following table:
Chapter II Performance review relating to Statutory corporations
27
Particulars Unit-III Unit-IV
Scheduled date of commissioning 31 December 2006 31 March 2007 Delay (days) 654 731† Possible generation‡ (MUs) 2,687.94 3,004.41 Generation during trial period (MUs) 632.51 669.70 Generation loss (MUs) 2,055.43 2,334.71
In order to meet the shortage of power in the State, the Board had to procure power at exorbitant rates ranging between Rs. 5.47 and Rs. 6.96 per unit as compared to the cost of generation of Rs. 2.15 and Rs. 2.23 per unit at the units, thereby, resulting in extra expenditure of Rs. 1,887.09 crore on procurement of 4,390.14 MUs of power during the period from January 2007/April 2007 to March 2009.
Loss of rebate and interest subsidy 2.1.13 As per terms and conditions of the loan agreement, the Board was eligible for an interest rebate (0.50 per cent) from REC in case of timely completion of the Project. The project was also covered under the Government of India Accelerated Generation and Supply Programme in Tenth Plan, which provided for three per cent interest subsidy subject to commissioning of the Project by 31 March 2007. Due to delay in commissioning of the units, the Board was deprived of the benefit of interest rebate and interest subsidy of Rs. 154.36 crore.
Insufficient liquidated damages
2.1.14 As per the terms and conditions of the Contract, BHEL was liable to pay liquidated damages at 0.25 per cent of the price of each unit per week of delay upto March 2007 and thereafter at 0.50 per cent subject to maximum of five per cent of the contract value. Even though the Board had withheld an amount of Rs. 83.70 crore towards liquidated damages as per the terms of the contract, the quantum of liquidated damages was, however, grossly insufficient to cover the huge losses suffered by the Board on account of delay in execution of the project by BHEL.
Cost overrun
2.1.15 Cost overrun on account of delay in execution of the units was Rs. 564.19 crore. Audit scrutiny indicated that there was avoidable price variation of Rs. 257.07 crore out of which Rs. 209.67 crore was paid on account of delay in award of contract due to indecisiveness of the Board (discussed in Para 2.1.7 supra), Rs. 12.42 crore on account of unjustified payment of price escalation on fixed component and increase in prices of steel (Para 2.1.8 supra) and Rs. 34.98 crore on account of wrong application of price variation formula (Para 2.1.9 supra). Besides, the delayed execution of the units also led to increase in interest by Rs. 154.45 crore during construction period. Other cases of excess/avoidable payments as noticed in Audit are discussed in succeeding paragraphs:
† as of 31 March 2009 ‡ Calculated considering plant load factor of 68.5 per cent as envisaged in the detailed project report
Due to delay in commissioning of the units, the Board had to incur extra expenditure of Rs. 1887.09 crore in procurement of 4390.14 MUs of power at higher rates during January 2007 to March 2009
Due to delay in commissioning of the units, the Board was deprived of the benefit of interest rebate and interest subsidy of Rs. 154.36 crore.

Audit Report (Commercial) for the year ended 31 March 2009
28
• The Government of India levied (September 2004) service tax on erection charges and further clarified that advance payment received by service provider prior to 10 September 2004 was exempt from service tax. Audit noticed that the Board paid service tax of Rs. 9.30 crore to BHEL on the gross amount of erection charges of Rs. 88.74 crore without excluding advance payment of Rs. 5.32 crore paid prior to 10 September 2004, resulting in excess payment of Rs. 56.22 lakh towards service tax.
• Price of diesel on base date (November 2003) adopted for price variation formula for civil works excluded the element of Sales Tax, as Punjab Sales Tax was not applicable on supplies to the Board to be made from within the State. With the replacement of Punjab Sales Tax Act by Punjab Value Added Tax (VAT) Act from 1 April 2005, VAT at concessional rate of four per cent was made applicable on sales to the Board. Audit noticed that the Board allowed variation on the price of diesel without deducting the element of Sales Tax at 8.80 per cent up to 31 March 2005 and thereafter without restricting VAT to four per cent, resulting in excess payment of Rs. 59.69 lakh on the diesel used in civil works.
• In accordance with the provisions of the contract, Maintenance Bay§ was to be constructed by BHEL. The Maintenance Bay had, however, not been constructed so far (August 2009). BHEL contested that construction of the Maintenance Bay was not in their scope of work. Audit observed that the Board had neither initiated any action to get the Maintenance Bay constructed nor imposed any penalty on BHEL. The cost for the construction of the Maintenance Bay was estimated (January 2008) at Rs. 3.43 crore. In the absence of Maintenance Bay it would not be possible to overhaul the major equipment like High Pressure turbine, Intermediate Pressure turbine, Low Pressure turbine, Generator stator etc. and to attend to any major breakdown.
Commissioning of units
2.1.16 CEA guidelines (July 2000) envisaged that the units should be commercially commissioned within three months from the date of synchronisation** for trial operation. The contract with BHEL envisaged readiness of each item of equipment as a pre-requisite before synchronization of the units for trial operation. Though the coal handling plant (CHP), coal mills, mill reject handling system, fire-fighting system, etc. were not complete, the Unit-III was synchronised for trial operation on 5 February 2008 and the Unit-IV on 2 August 2008. Audit noticed that due to synchronisation of the units without ensuring completion of all the works, the period of trial operation prolonged abnormally and the Unit-III was commercially commissioned only on 16 October 2008 and the Unit-IV had not been commissioned (August 2009). The following irregularities were noticed.
§ Maintenance Bay is the space for unloading and maintenance purposes in the turbine
generator area. ** Start functioning of various systems of the Thermal Power Station at the same time.
Chapter II Performance review relating to Statutory corporations
29
Excessive consumption of inputs
2.1.17 Prolonged period of trial run resulted in excess consumption of inputs of Rs. 18.17 crore (Fuel oil: Rs. 17.43 crore and demineralised water: Rs. 0.74 crore) during June to 15 October 2008 (unit-III) and December 2008 to March 2009 (unit-IV). In the absence of enabling clause in the contract, the loss could not be recovered from the BHEL.
Avoidable payment of demurrage charges 2.1.18 Due to non-commissioning of coal handling plant (CHP) of GHTP Stage-II before synchronisation of the Unit-III in February 2008, coal to the GHTP Stage-II was fed (February 2008 to May 2008) through the unloading system of CHP of Stage-I. Due to increased workload and poor maintenance of the unloading system of CHP of Stage-I, the Board could not unload the coal in time and had to pay demurrage charges of Rs. 2.42 crore on coal during February 2008 to May 2008. The claim for recovery of proportionate demurrage charges of Rs. 41.55 lakh†† could not be preferred against BHEL in the absence of relevant clause in the contract.
Environmental issues
Poor utilisation of fly ash
2.1.19 In order to protect the environment, conserve top soil and prevent dumping and disposal of ash on land, the Ministry of Environment & Forest vide their notification issued in September 1999 and as amended in August 2003 required that thermal power plants have to ensure disposal of ash by making arrangements for the supply of the same to manufacturers of cement, brick kiln owners, etc.
The Board did not finalise the agreement for utilization/lifting of dry fly ash before scheduled commissioning of the Units III and IV in December 2006 and March 2007 respectively. Grasim Industries Limited (firm), the existing contractor for Stage-I approached (December 2007) the Board to lift the entire quantity of fly ash of Stage-II through the piping system to be erected by them within 12 months. The Board made (December 2008) a formal agreement with the firm which, inter alia, stipulated that if the firm failed to lift the allotted quantity within one year, the unlifted quantity would be dumped temporarily in the ash pond, which had to be lifted by the firm. In case the firm failed to lift the dumped ash from the dumping pond, then the firm would have to pay penalty equal to actual lifting cost that the Board would incur for getting the dumped ash lifted from the pond.
The Board had to dump 1.12 lakh tonnes of ash in the pond up to November 2008 due to non-finalisation of the contract and 0.63 lakh tonnes of ash from December 2008 to March 2009 due to non-lifting of the ash by the firm which resultantly reduced the capacity of the pond to that extent. Thus, delay in finalisation of the agreement and non-lifting of ash resulted in extra
†† Total demurrage charges during February 2008 to May 2008: Rs. 242.16 lakh x coal fed to
Stage-II during this period: 1.45 lakh MT ÷ Total quantity of coal received in the plant: 8.45 lakh MT
Synchronisation of the units without ensuring completion of all the works led to prolonged period of trial run, which resulted in excess consumption of inputs of Rs. 18.17 crore.
Audit Report (Commercial) for the year ended 31 March 2009
30
expenditure of Rs. 1.12 crore due to decrease in life of pond.‡‡ A Committee was constituted (30 January 2009) by the Chief Engineer (O&M) of GHTP to assess the amount to be recovered from the firm for non-lifting of ash. The Committee observed that there was no lifting process or mechanism and as such it was unable to calculate the cost to be recovered from the firm for non-lifting of ash during December 2008 to March 2009. Final decision in this regard was awaited (August 2009).
Air and noise pollution 2.1.20 While giving environmental clearance, the Ministry of Environment and Forest, Government of India stressed (September 2000) that it should be ensured that suspended particulate emission should not exceed the emission standards of 150 mg/NM3 and sound level of the equipment should not be more than 75 dBA♣.
Audit observed that particulate emission of the Unit-IV was above the permissible limit since its synchronization in August 2008 and ranged between 457 mg and 1,623 mg/NM3 (November and December 2008) as compared to the permissible limit of 150 mg/NM3. The problem was due to the fact that six fields of Electro Static Precipitators (ESPs) were in tripped condition. The Chief Engineer (Construction), GHTP observed (January 2009) that despite availing of two shut downs from 2 December 2008 to 11 December 2008 and 30 December 2008 to 5 January 2009 (total more than 15 days), BHEL failed to rectify the faults in ESPs. BHEL requested (February 2009) for third shut down for one week to carry out thorough inspection of all the fields of ESPs of Unit-IV to rectify the faults.
Further, the sound levels of the equipments at the plant ranged between 91.3 dBA to 95.6 dBA against the prescribed standards of 75 dBA. There was no record to show that the plant authorities made any efforts to bring down the noise level.
Acknowledgement
2.1.21 Audit acknowledges the co-operation and assistance rendered by the Board’s Management at various stages of conducting the performance audit.
Conclusion
• Deficient planning and indecisiveness on the part of the Board/State Government led to delay of more than three years in deciding the mode of execution of the project;
• The contract was awarded to BHEL on single quotation basis without inviting competitive bidding depriving the Board the scope of getting competitive rates;
‡‡Cost of pond Rs.502.45 lakh/ by capacity of pond 7.87 lakh cum x ash dumped in pond 1.75
lakh cum. ♣ Unit of measurement of noise level.
Delay in finalization of the agreement and non lifting of ash resulted in an extra expenditure of Rs. 1.12 crore.

Chapter II Performance review relating to Statutory corporations
31
• The Board failed to make proper analysis of BHEL offer from economic point of view leading to unjustified payment of price escalation and incorrect computation of price variation of Rs. 47.40 crore;
• Due to substantial time overrun in execution of both the units, the Board was saddled with additional capital costs of Rs. 564.19 crore coupled with avoidable extra expenditure of Rs. 2,061.16 crore;
• The delayed commissioning of the units not only resulted in failure to achieve the primary objective of bridging the demand gap but also deprived the Board of the interest rebate and interest subsidy.
Recommendations
The Board should:
decide the mode of execution of the project promptly in order to place the order timely.
invite open tenders for construction of the projects as provided in its Works Regulations to avail the benefit of competitive rates.
analyse the offers of the contractors correctly to avoid extra expenditure in the execution of the projects.
have stringent liquidated damages clause to discourage delays on the part of contractors.
strengthen the monitoring mechanism to ensure completion of the projects within the stipulated time.
The matter was referred to the Government/Management in April 2009; their replies had not been received (September 2009).
32
2.2 Information Technology Audit of Large Supply billing Software
Executive Summary
The Board has got developed (November 2005) the Large Supply (LS) Billing software from Department of Electronics Accreditation for Computer Courses (DOEACC) for raising of bills through three Centralised Billing Cells (CBC) located at Patiala, Ludhiana and Jalandhar in respect of the LS and Bulk Supply consumers. The officials at the sub division level after recording the monthly meter readings manually from the premises of the consumers transmit the same to the concerned CBC through a messenger for preparation of the bills.
Software related issues
No clause for ownership of source code was incorporated in the work order for development of LS Billing software from DOEACC which was not in the interest of the Board as the system design, algorithm, source codes of such critical system were vulnerable to misuse and the Board had to depend on the firm perennially. The Software was deficient as checks to watch and control the delay in issue of bills through generation of MIS reports and a provision for giving alerts in case of short recovery of Advance Consumption Deposit were not incorporated in the software. The database generated by the software contained invalid entries or inconsistent data pointing towards lack of validation checks and input controls. Data captured was partial even in crucial fields. Data entry pertaining to mandatory fields was not done in many cases. Besides making the database unreliable, any analysis or reports for Management Information System (MIS) based on such an incomplete database was likely to furnish incomplete and misleading information. Though the Board had developed various IT applications since 1986, it was observed during the IT audit that there were inadequate and deficient general IT controls to ensure the accrual of true benefits of computerisation of billing in terms of confidentiality, availability and accuracy and completeness of the data to serve some fruitful purpose to the Management.
Implementation issues
Audit observed that main features of the software like preparation of LS consumer ledgers and preparation and monitoring of computerised Revised Bill Statement (RBS) and billing of mixed load/seasonal consumers were not yet functional. The Board could not penalise the vendor due to absence of any penalty clause in the work order for delay or incomplete execution of the software.
Other issues
The Board did not utilise the budget to the full extent during the years 2005-06 to 2008-09 and the percentage of utilisation ranged between 3.87 and 16.94. Audit observed that the decision to implement the online computerisation project in a single go not only delayed implementation of the project but also resulted in a wasteful expenditure of Rs. 7.50 lakh paid to PUNCOM. The Board failed to achieve the desired level of computerisation of its activities due to lack of clear cut IT strategy/policy.
Audit observed that 18 out of the 40 Engineers trained in IT had been posted in the offices where there were no substantial IT activities. Non inclusion of clause regarding passing of financial benefit in case of deviation in supply of material deprived the Board of benefit of Rs. 45.50 lakh.
Conclusion and Recommendations
Even after a lapse of more than five years since the project of on-line computerization was envisaged, the Board failed to achieve the desired level of computerization of its activities due to lack of clear cut IT strategy/policy. A proper IT policy should be formulated and documented. There is an urgent need to incorporate security controls and application controls to the various business applications through validation checks.
Chapter II Performance review relating to Statutory corporations
33
Introduction
2.2.1 The main functions of the Punjab State Electricity Board (Board) are to generate, transmit and distribute electricity in the State of Punjab. The Board has computerised the work of preparation of electricity bills, besides computerisation of accounting of the General Provident Fund, Pension, Inter Unit Transfers, Cheque Drawn Reconciliation, Revenue Monitoring, Human Resource database and Pay bills. An expenditure of Rs. 14.381 crore had been incurred from April 2005 to March 2009 for computerisation. The consumers of the Board have been catagorised as Large Supply (LS), Bulk Supply (BS), Medium Supply (MS), Small Power (SP), Domestic Supply (DS), Non Residential Supply (NRS) and Agricultural Power (AP) consumers. The Board has got developed (November 2005) the LS Billing software from Department of Electronics Accreditation for Computer Courses (DOEACC) for raising of bills through three Centralised Billing Cells (CBC) located at Patiala, Ludhiana and Jalandhar in respect of the LS and BS consumers. For other categories of the consumers, the work of preparation of the computerised bills has been outsourced to DOEACC and the bills are being prepared by the firm at Chandigarh and Ludhiana.
Organizational set up
2.2.2 The Board is headed by a Chairman who is assisted by six members. The Member (Finance and Accounts) is overall in charge of the IT functions except the billing work and is assisted by a Director (IT) and four Deputy Secretaries. The Chief Engineer (Commercial) under the direct charge of the Chairman is in charge of the billing work and is assisted by a Director (Billing) at headquarters and three Deputy Directors (CBC) in the field for preparation of the computerised electricity bills.
Scope of Audit
2.2.3 The present IT review was conducted between February 2009 and July 2009 by covering the offices of Director (IT) and Director (Billing) at Patiala and two of the three offices of the Deputy Directors (CBC), located at Ludhiana and Patiala. The IT Audit evaluated the general IT controls that establish a framework for controlling the design, security and computerisation in the Board and evaluated the IT application specific to the LS billing system.
Information systems set up 2.2.4 The LS Billing application was developed using Power Builder 6.0 as front end and Oracle 9i as back end. The IT system architecture was PC based client server and the operating systems in use were MS Windows Server 2003, Windows XP and Windows 98. A central server for storing the consolidated database for backup of the three CBCs on monthly basis was maintained at Ludhiana. 1 LS Billing-Rs.0.30 crore, other billing categories-Rs. 7.82 crore and other IT Applications-Rs.6.26 crore.
Audit Report (Commercial) for the year ended 31 March 2009
34
Audit objectives
2.2.5 The objectives of audit were to ascertain:
• whether appropriate methodology for system development and implementation was adopted;
• whether the information/data generated by the LS Billing software was complete, accurate, reliable and the system ensured security;
• whether the computerisation of billing enhanced the efficiency of the process of billing;
• whether the IT controls ensured adequacy and adherence to applicable business rules and terms and conditions of supply of electricity; and
• whether the instructions/directions issued by the Punjab State Electricity Regulatory Commission (PSERC) were taken into consideration and billing application supported various systems of procedure, terms and conditions, tariff orders and regulations issued by PSERC.
Audit criteria
2.2.6 The following audit criteria were adopted:
• Plan/ Project reports prepared for the computerisation activities/ programs;
• Instructions issued by the Board and other regulatory authorities from time to time; and
• Business rules of the Board relating to preparation of demands and notifications relating to tariff revision.
Audit methodology
2.2.7 Audit followed the following mix of methodologies:
• Scrutiny of decisions taken by the Board/Whole Time Members; • Scrutiny of records of the Director (IT) and Director (Billing) relating to
procurement contracts of hardware and development of software; and
• Analysis of the data generated by the LS Billing software through Computer Assisted Audit Techniques (CAAT) i.e. Interactive Data Extraction and Analysis (IDEA), covering the period April 2006 to May 2009.
Audit findings
2.2.8 The audit findings coming out as a result of examination of the records as covered under the scope and methodology of audit are as follows:
Chapter II Performance review relating to Statutory corporations
35
Software issues - LS Billing Software 2.2.9 Three CBCs were engaged in preparation of the electricity bills for the LS and BS category of consumers. The LS/BS consumers contributed revenue of Rs. 3,357.41 crore against the total revenue of Rs. 7,666.71 crore of the Board during 2007-08. The previous application software based on FoxPro database and manual billing set up (1998) on a single computer was developed in-house and was replaced by the LS Billing application in November 2005. The officials at the sub division level after recording the monthly meter readings manually from the premises of the consumers transmit the same to the concerned CBC through a messenger for preparation of the bills.
Ownership of source code 2.2.10 As a prudent practice, the Board was required to obtain an undertaking from DOEACC that it would not retain any copy of the software including documentation and would not use the software or design for any commercial gain without obtaining prior permission of the Board. A scrutiny of the work order, however, revealed that no such clause was incorporated in the work order to ensure that the source code of the developed software with algorithms, design, source codes, and documentation shall rest with the Board.
Audit observed (June 2009) that in the absence of any clause in the work order, DOEACC did not give such undertaking which was not in the interest of the Board as the system design, algorithm, source codes of such critical system were vulnerable to misuse and the Board had to depend on the firm perennially.
The matter was reported (June 2009) to the Board, but no reply was received (September 2009).
Delay in issue of bills 2.2.11 As per the Manual of instructions, Sale of Power, the Board is required to prepare the energy bills of LS Consumers immediately after taking the meter reading. Audit scrutiny at the CBC, Ludhiana and Patiala for the period 2006-09, revealed that in 43,838 bills (4,304 consumers) involving revenue of Rs. 3,066.66 crore, six to 128 days were taken for preparation of the bills. Consequently, the due date for payment of these bills had been delayed resulting in loss of interest of Rs. 1.76 crore to the Board (calculated at the rate of 9 per cent per annum after allowing a period of five days for preparation of the bill). There were no reasons on records for the delay.
It was observed that no checks were incorporated in the LS Billing application to watch and control the delay through generation of MIS reports. Had the bills been prepared and issued within a period of five days, the Board could have avoided the loss of interest of Rs. 1.76 crore.
The matter was reported (June 2009) to the Board, but no reply was received (September 2009).
No clause for ownership of source code was incorporated in the work order for development of LS Billing software
Delay in issue of monthly bills resulted in loss of interest of Rs. 1.76 crore.
Audit Report (Commercial) for the year ended 31 March 2009
36
Short recovery of Advance Consumption Deposit 2.2.12 As per Regulation 15 of the Electricity Supply Code and Related Matters Regulations 2007 as applicable from 1 January 2008, the consumers will have to maintain with the Board, an amount equivalent to two months’ average consumption charges2 as security deposit in the case of monthly billing. There was no provision made in the LS Billing software for giving alerts in case of short deposit of the security.
It was observed in audit that in case of 1,717 LS consumers of Ludhiana and Patiala, a security amount of Rs. 100.85 crore only was being collected and maintained as against the required amount of Rs. 321.20 crore, resulting in short deposit of Rs. 220.35 crore, due to non mapping of the necessary provision in the LS Billing application.
The matter was reported (June 2009) to the Board, but no reply was received (September 2009).
Delay in issue of first bill 2.2.13 As per the Electricity Supply Regulations, the Board is required to render to the consumer each month a bill for the energy consumed and other charges incidental to the supply of electric energy. It is necessary that the bills are issued promptly to realize the charges in time.
Audit observed that the first reading of the meter was being submitted late to the CBC by the field staff. Resultantly, the issue of first bill was also delayed. A checking of 539 new LS consumers at Ludhiana and Patiala from January 2005 to March 2009 revealed that the first bills amounting to Rs. 14.55 crore were issued after a delay ranging from one to 435 days after the expiry of one month from the date of connection which resulted in loss of interest of Rs. 8.80 lakh to the Board (computed at the rate of nine per cent), indicating lack of validation checks in the LS Billing application.
The matter was reported (June 2009) to the Board, but no reply was received (September 2009).
Short recovery of monthly service charges 2.2.14 Schedule of General and Service Connection Charges appended to the Electricity Supply Regulations provides that service charges are recoverable from the LS consumers at the rate of Rs. 150 per month in case of connections having load between 100 KW and 500 KW and Rs. 450 per month in case of load above 500 KW.
Scrutiny of data of Ludhiana and Patiala LS consumers for the period from January 2006 to May 2009 revealed that in respect of 181 consumers an amount of Rs. 10.35 lakh on account of service charges had not been recovered due to incorrect input in the master data regarding the load.
2 Average of monthly Consumption Charges over a period of 12 months.
Non mapping of provisions in LS Billing application resulted in short recovery of Advance Consumption Deposit of Rs. 220.35 crore.
Late submission of meter reading data by the field staff resulted in loss of interest of Rs. 8.80 lakh.
Incorrect input in the master data resulted in short recovery of monthly service charges of Rs. 10.35 lakh.
Chapter II Performance review relating to Statutory corporations
37
The matter was reported (June 2009) to the Board, but no reply was received (September 2009).
Unreliable database 2.2.15 During analysis of the billing data at CBC, Ludhiana and Patiala, it was noticed that the database contained invalid entries or inconsistent data pointing towards lack of validation checks and input controls. Analysis of the LS billing database revealed that the data captured was partial even in crucial fields. Data entry pertaining to mandatory fields was not done in many cases. Besides making the database unreliable, any analysis or reports for Management Information System (MIS) based on such an incomplete database was likely to furnish incomplete and misleading information.
Further, the officers of the Board were neither using the software nor were trained. As such, they were unable to check the data relating to the bills prepared by the Bill Assistants. Due to lack of authentication/checking of the data by Asstt. Executive Engineer/Executive Engineer at CBCs, the data was deficient and incomplete as indicated by the following findings:
• When the bill is generated by an official (user) and the same is approved by the officer (approver), the system should show user ID and approver code. It was, however, observed that in 3,193 bills amounting to Rs. 190.71 crore, the user ID and approver code was found ‘Nil’, affecting the reliability of data.
• At the time of preparing bill, the receipt number and date of payment made in respect of previous bill should be entered in the system to watch the recovery of late payment surcharge etc. However, in 2,171 bills amounting to Rs. 108.93 crore, the payment date and receipt number were ‘zero’ which showed incompleteness of data.
• As per system, each bill should be allotted a distinct number. It was, however, observed that in case of 10,704 bills amounting to Rs. 550.66 crore, the system allotted duplicate number to the bills relating to arrears on account of revision of tariff, rendering the system unreliable.
• Maximum sanctioned demand of an installation represents the maximum current consumed by the installation within a given period and should never be zero in a functional unit. If at any time during the period of billing cycle, the current consumed exceeds the maximum sanctioned demand, a demand for surcharge is to be levied on the consumer. However, in 871 cases involving Rs. 6.37 crore, it was zero leading to incorrect data.
• The ratio of current used to the total current supplied is known as Power Factor. Since the current used is always less than the current supplied, the ratio should never be more than one. In case the ratio ranges between 0.90 and 0.99, an incentive is allowed and if the ratio is less than 0.90, power factor surcharge is levied on the consumer. It was, however, observed that
Audit Report (Commercial) for the year ended 31 March 2009
38
in 599 cases involving Rs. 12.89 crore, the Power Factor ranged between 1.01 and 111.92 indicating inaccuracies in the data.
• In 776 cases, although the dates of replacement of defective CT/PT3 equipment were shown, the dates of detection of the defect were shown as ‘zero’. In 657 cases CT/PTs were replaced, but Sundry Job Order number and reasons for replacement were shown as ‘Nil’. Similarly, serial number of CT/PT was blank in 668 cases and in 3,706 cases it was in duplicate making the information unusable in case of theft/unauthorised replacement of CT/PT equipment.
• In 712 cases, the meter number was recorded as blank and in 1,346 cases it was duplicate making the information unusable in case of theft/unauthorised change of meter etc.
• In 15,063 cases involving Rs. 982.97 crore, the dates of issue of bills were prior to the dates of generation of bills. The dates of issue of the bills were changed manually, through a module, to escape the responsibility of delay causing concern about the integrity of the data.
• In six cases involving Rs. 9.96 lakh, the due dates of payment of the bills were shown prior to their issue date leading to incorrect data.
The matter was reported (June 2009) to the Board, however, no reply was received (September 2009).
Implementation issues
Implementation of the LS/BS billing software 2.2.16 The proposal of LS Billing application, inter alia, envisaged networking of computers and augmentation of the computerisation activities in the CBCs at Patiala, Ludhiana and Jalandhar. Besides preparation of bill ledgers, billing of mixed load/seasonal consumers and Revised Bill Statement (RBS)4 were to be prepared and maintained in the computer so as to record and monitor each RBS issued. The networking of the computers was also proposed to facilitate preparation of the bills at designated client workstations so as to have a unified system with consolidation on the local server at the CBC level. One system was to be used as a central server, where all the data from other CBCs would be consolidated. The systems in the network were to ensure prompt and convenient data processing and MIS reporting environment. The work order was issued (October 2003) to DOEACC for Rs. 12.00 lakh as cost of developing the Billing application within the overall cost of project of Rs. 29.50 lakh and the work was to be completed by June 2004. However, the same could only be made operational in November 2005 i.e. after a delay of 16 months.
3 CT-Current Transformer, PT-Potential Transformer. 4 When bill is revised on account of wrong reading, defective/stop meter etc a Revised Bill
Statement is issued to consumer concerned.
Chapter II Performance review relating to Statutory corporations
39
Audit scrutiny revealed that the main features of the software like preparation of LS consumer ledgers and preparation and monitoring of computerised RBS and billing of mixed load/seasonal consumers were not yet functional and incorporated in the Billing Software. Further, networking of all the three CBCs and the Director (Billing) with the Central server situated at CBC, Ludhiana had not been done. The stipulated work had only partially been completed after a delay of 16 months. The Board could not penalise the vendor due to absence of any penalty clause in the work order for delay or incomplete execution of the software.
The matter was reported (June 2009) to the Board, but no reply was received (September 2009).
General IT Controls 2.2.17 Though the Board had developed various IT applications since 1986, it was observed during the IT audit that there were inadequate and deficient general IT controls to ensure the accrual of true benefits of computerization of billing in terms of confidentiality, availability and accuracy and completeness of the data to serve some fruitful purpose to the Management. The major deficiencies noticed in respect of General IT Controls were as under:
• There was no formulated and documented IT policy defining the long term/medium term IT strategy incorporating the time frame, key performance indicators and cost benefit analysis of various applications and their integration.
• There was no IT steering committee to monitor the computerization in a systematic and coordinated manner.
• No documentation in respect of Software Requirement Specifications (SRS), feasibility study and test data detailing the layout of the reports and other documents in support of application development was provided by the software developer, though the same was required as per terms of contract with him. This not only increased the risk of unauthorised working practices being adopted but also made the system prone to vulnerability of unauthorized manipulations/amendments in the system/database.
• There was no formulated and documented IT security policy to ensure the security of IT Assets, software and the crucial data.
• Lack of physical access controls to check entry of unauthorized persons to the server room endangered the security of the data and system.
• There was no documented password policy and no logs in respect of the login and logout with date, time and user ID were maintained by the system. In the absence of this all the users at CBC Patiala were working with the same user ID-999 causing a serious threat to the security aspects of the data and rendering the integrity of the data doubtful.
Main features of LS/BS billing software were not functional despite delay in implementation of 16 months.
Lack of formulated and documented IT policy.
Audit Report (Commercial) for the year ended 31 March 2009
40
• In spite of provision in the work order for having an elaborate audit trial to trace back all the transactions, the application developer (DOEACC) did not incorporate the fields like ‘updated by’, ‘updated on’, and ‘updated from’ in the LS Billing application.
• No documented disaster recovery and business continuity plan, outlining the action to be undertaken immediately after a disaster and to effectively ensure that information processing capability can be resumed at the earliest, was in existence. Although back-ups of the data was taken but the same were not tested for restoration on frequent intervals.
• No formulated and documented anti-virus policy was in existence to avoid the instances of data losses caused due to viruses.
• There was no policy for ensuring segregation of duties of the Board’s officers/officials working in computerised environment.
The Board, while admitting (April 2009) the facts stated that a comprehensive IT policy, IT Security Policy, business continuity plan etc., documents would be developed through an expert group, in due course of time after analysing the IT governance related business requirements of the Board. As regards non-system documentation, deficient physical access controls, inadequate audit trails and anti-virus policy, the matter was reported (June 2009) to the Board, but no reply was received (September 2009).
Other issues
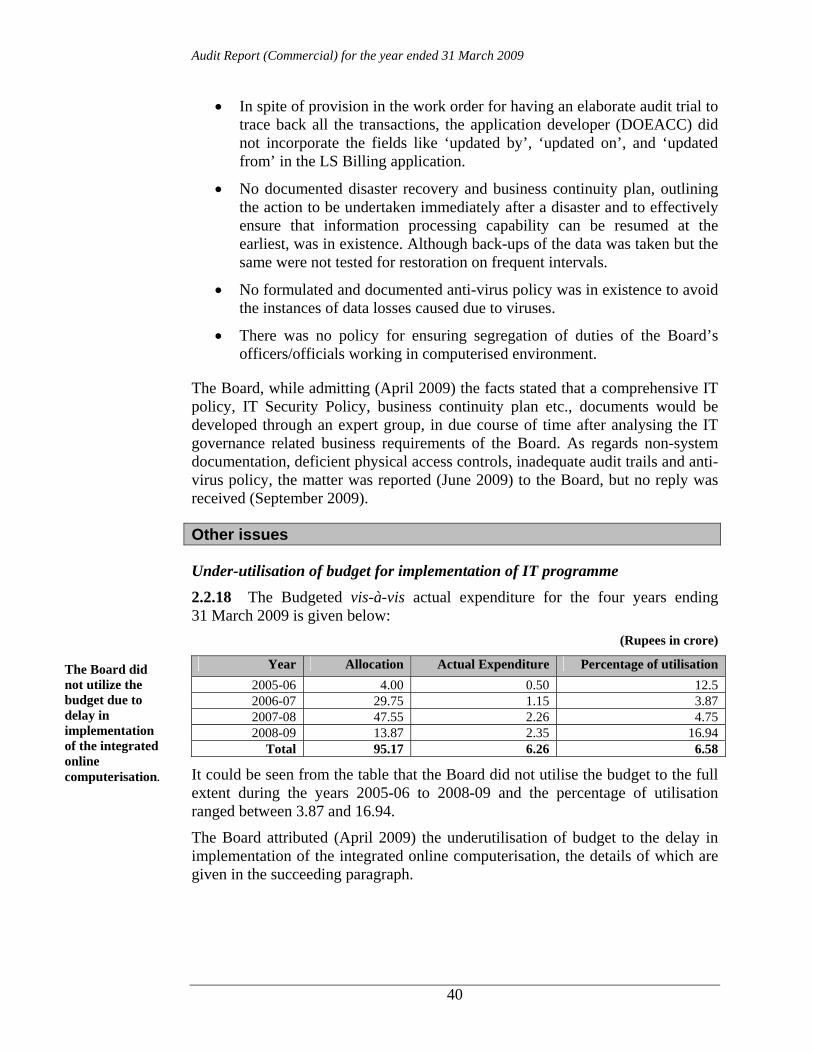
Under-utilisation of budget for implementation of IT programme 2.2.18 The Budgeted vis-à-vis actual expenditure for the four years ending 31 March 2009 is given below:
(Rupees in crore)
Year Allocation Actual Expenditure Percentage of utilisation 2005-06 4.00 0.50 12.5 2006-07 29.75 1.15 3.87 2007-08 47.55 2.26 4.75 2008-09 13.87 2.35 16.94
Total 95.17 6.26 6.58
It could be seen from the table that the Board did not utilise the budget to the full extent during the years 2005-06 to 2008-09 and the percentage of utilisation ranged between 3.87 and 16.94.
The Board attributed (April 2009) the underutilisation of budget to the delay in implementation of the integrated online computerisation, the details of which are given in the succeeding paragraph.
The Board did not utilize the budget due to delay in implementation of the integrated online computerisation.
Chapter II Performance review relating to Statutory corporations
41
Delay in deciding the On-line computerisation Project 2.2.19 To improve the commercial and operational performance, reduce Transmission and Distribution losses and bring transparency in day to day functioning, the Board envisaged an integrated ‘On-line computerisation project’ in May 2003 and appointed (September 2004) PUNCOM as consultant at a fee of Rs. 28.63 lakh for preparation, finalisation and revision of the bid document, evaluation of the tenders and monitoring of implementation of the entire project. Based on the “Request For Proposal (RFP)” prepared by the Consultant, Notice Inviting Tender was issued (March 2006). However, due to a number of ambiguities and omissions in the pre-qualification bid documents and queries of prospective bidders, nothing concrete could be finalised within the set time frame and the Board had to scrap (December 2006) the RFP document and tender enquiry based thereon. The Board also terminated the services of the Consultant after incurring an expenditure of Rs. 7.50 lakh and decided to implement the IT applications in a phased manner in the form of smaller projects and implement the Enterprises Resources Planning (ERP) software in the last, when all the other applications are in place. It was also decided to hire the services of reputed consultants to implement the various IT activities in the Board through limited tender procedure. Finally the consultancy work was allotted (November 2007) to M/s. Pricewaterhouse Coopers (PwC) at a fee of Rs. 3.60 crore. The PwC submitted the Basic Study Report in June 2008.
Audit observed that the decision to implement the online computerisation project in a single go not only delayed implementation of the project but also resulted in a wasteful expenditure of Rs. 7.50 lakh paid to PUNCOM. The Board failed to achieve the desired level of computerisation of its activities due to lack of clear cut IT strategy/policy.
The Board in its reply (April 2009) stated that IT being a totally new venture required a very carefully formulated work plan in place before taking up any IT initiatives/ projects. It added that to overcome a host of hurdles, the main being lack of IT/Computer skills and required IT project management experience/exposure, the project team had to move at a very cautious and measured pace.
The reply of the Board is not acceptable as the Board was not serious and it took three years to decide whether to go for On-line integrated applications or to computerise the functions in a phased manner.
Recruitment of IT Engineers. 2.2.20 The Board recruited 40 computer qualified Engineers during 2007-08 with knowledge of computer languages like Oracle, Visual Basic, C++ etc. for running the hardware/software, troubleshooting/repairs and development of customized software. It was, however, observed that 18 out of the 40 Engineers had been posted in the offices where no substantial IT activities, as envisaged in the proposal for the recruitment, were involved. Specific progress/achievements regarding development of IT activities made by the Board after recruitment of IT
18 IT Engineers were posted in offices where no IT activities were involved.
Audit Report (Commercial) for the year ended 31 March 2009
42
Engineers were called for (July 2009). However, no reply was received (September 2009).
Avoidable extra expenditure 2.2.21 The energy accounting of 11 KV and other higher level feeders installed at 650 grid substations of the Board was being recorded manually through 7,500 energy meters. The Board proposed (April 2008) to acquire the meter data through Automated meter reading (AMR) System and set up a Central Energy Accounting and Audit (EAA) Centre to generate the required Management Information System (MIS) reports at the Base Computer Station, Patiala. The proposed system, based on GPRS technology, through real time feeder status and load profile data was also to generate vital MIS reports to bring out transparency and accountability in the system.
The Board, after obtaining competitive rates through open tenders, placed (June 2008) a work order on M/s Easun Reyrolle Ltd (ER) for design, implementation, commissioning and O&M services at a total cost of Rs. 5.94 crore. The Work order, among other provisions, included a clause for supply of ER make 2,500 energy meters at Rs. 6,120/- per meter. The project was to be completed by the end of November 2008. Since one out of two supplied meters of the ER make failed during test for technical specifications, these were rejected by the Board. M/s ER supplied alternate energy meters of L&T make.
It was observed that the L&T make meter had been quoted at Rs. 4,300/- by one of the vendors (M/s A2Z) in his offer against the AMR tender. Though the Board claimed the cost difference benefit of Rs. 1,820 per meter (total amount: Rs. 45.50 lakh) from M/s ER, the same was refused by the firm due to the absence of appropriate clause in the work order. Thus, due to non inclusion of a clause regarding passing of the financial benefit to the Board in case of deviation in supply of material, the Board was deprived of a benefit of Rs. 45.50 lakh.
Conclusion
• The LS billing software had poor general controls such as physical access control, logical access control and audit trails. Thus, the system was easily vulnerable to un-authorised access and data manipulation.
• There was no documented IT policy regarding disaster recovery and business continuity plan, data back-up and storage and the Board had no authorised anti-virus software.
• Non mapping of business rules in many cases led to improper monitoring of the system and loss of revenue.
• Wrong data entry coupled with inadequate input and validation control in the systems and inadequacy of the software led to large scale manual interventions, disregards to the concept of computerisation.
Non inclusion of clause regarding passing of financial benefit in case of deviation in supply of material deprived the Board of benefit of Rs. 45.50 lakh.
Chapter II Performance review relating to Statutory corporations
43
• Even after a lapse of more than five years since the project of on-line computerization was envisaged, the Board failed to achieve the desired level of computerization of its activities due to lack of clear cut IT strategy/policy.
Recommendations
• A proper IT policy should be formulated and documented.
• There is an urgent need to incorporate security controls and application controls to the various business applications through validation checks.
• IT skilled personnel should be posted in IT related activities so as to have optimum utilisation of the IT resources and there should be proper IT related training for the staff.
44
2.3 Performance Audit on performance of the State Transport Undertakings
Executive Summary
The Punjab Roadways (Roadways), Punjab State Bus Stand Management Company Limited (PUNBUS) and Pepsu Road Transport Corporation (PRTC) provide public transport in the State through their 45 depots. These State Transport Undertakings (STUs) had fleet of 2,578 buses (including 35 hired buses) as on 31st March 2009 and carried an average of 8.01 lakh passengers per day during 2004-05 to 2008-09. They accounted for a share of 39.46 per cent in public transport with the rest coming from private operators. The performance audit of the STUs in Punjab for the period from 2004-05 to 2008-09 was conducted to assess efficiency and economy of their operations, ability to meet financial commitments, possibility of realigning the business model to tap non conventional sources of revenue, existence and adequacy of fare policy and effectiveness of the top management in monitoring the affairs of the STUs. Finances and Performance The STUs suffered a loss of Rs. 462.03 crore during 2004-09. The STUs earned Rs. 20.57 per kilometre and spent Rs. 23.65 per kilometre in 2008-09. Audit noticed that with a right kind of policy measures and better management of their affairs, it is possible to increase revenue and reduce costs, so as to earn profit and serve their cause better. Declining Share of STUs Out of 6,429 buses licensed for public transport in 2008-09, about 39.46 per cent belonged to the STUs. The percentage share declined from 48.12 per cent in 2004-05. Vehicle density (including private operators’ buses) per one lakh population in the State
increased from 21.66 in 2004-05 to 22.80 in 2008-09. Vehicle profile and utilisation The STUs were not able to achieve the norm of right age buses as out of 2,543 owned buses 1,210 buses were overaged. During 2004-09, the PRTC and PUNBUS purchased 379 and 887 new buses at a cost of Rs. 40.95 crore and Rs. 118.44 crore respectively. The expenditure was funded through commercial loans. The fleet utilization of STUs in 2008-09 was higher than the all India average (AIA) of 92 per cent. The overall vehicle productivity at 281 kilometres per bus was less than the AIA of 313 kilometres. The vehicle productivity of Roadways had been on the lower side for all the years under review, while vehicle productivity of PUNBUS was more than the AIA during 2005-09. The vehicle productivity of PRTC was higher than AIA in three out of five years under review except in 2004-05 and 2008-09. The passenger load factor of Roadways, PRTC and PUNBUS varied from 62 to 84 per cent, 72 to 76 per cent and 79 to 83 per cent, respectively during the period under review against the AIA of 63 per cent. The STUs did not carry out the preventive maintenance as required in 23.40 per cent cases in the Roadways and 26.31 per cent in PUNBUS, affecting the roadworthiness of their buses. No records relating to this aspect were maintained by PRTC. Economy in operations The manpower and fuel constituted 69.54 per cent of the total cost in 2008-09. Interest, depreciation and taxes- the costs of which are not controllable in the short-term, accounted for 21.97 per cent.
Chapter II Performance review relating to Statutory corporations
45
Thus, the major cost saving can come from manpower and fuel. The manpower cost per effective Km of the STUs increased from Rs. 7.94 (2004-05) to Rs. 9.24 (2008-09). The reason for increase in manpower cost per effective Km was reduction in effective Kms due to reduction in fleet operation. Two STUs (Roadways and PUNBUS) did not attain their own fuel consumption targets. PRTC did not fix internal targets for fuel consumption. The excess consumption of fuel by the STUs as compared to AIA resulted in loss of Rs. 52.72 crore during 2004-09. The Roadways and PRTC had just 35 hired buses where the bus owners provide buses with drivers and incur all expenses. The STUs provide conductors and make payment as per kilometres operated. These two STUs earned a net profit of Rs. 17.48 crore during the review period from hired buses. As this arrangement has the potential to cut down the cost substantially, the STUs need to explore possibility of hiring of more buses to increase/replace their fleet. Revenue Maximisation The route planning in the STUs was deficient as curtailment, extension and change in frequency of operation of routes during peak hours was not done on the basis of profitability of routes. PRTC and PUNBUS did not carry out any exercise to identify the profitable/unprofitable routes. In Roadways, profit making routes declined from 23 to 15 per cent during 2004-09. The share of non-traffic revenue was nominal at 5.08 per cent of the total revenue during the period under review. The STUs were unable to tap sources of non-traffic revenue substantially. The PRTC and PUNBUS have about 8.48 lakh Square metres of land. As they mainly utilise ground floor/ land for
their operations, the space above can be developed on public private partnership basis to earn steady income which can be used to cross-subsidise their operations. Need for a regulator The fare per kilometre stood at 49 paise from July 2006. Though the Government approves the fare increase, there is no scientific basis for its calculation. The STUs have also not formed norms for providing services in the uneconomical routes. Thus, it would be desirable to have an independent regulatory body (like State Electricity Regulatory Commission) to fix the fares, specify operations in the uneconomical routes and address grievances of the commuters. Inadequate monitoring The fixation of targets for various operational parameters and an effective Management Information System (MIS) for obtaining feed back on achievement thereof are essential for monitoring by the top management. The monitoring by top management fell short as it did not fix targets for various operational parameters. Conclusion and Recommendations Though the Roadways and PRTC are incurring losses, it is mainly due to their high cost of operations and negligible reliance on hired buses. The STUs can control the losses by resorting to hiring of buses and tapping non-conventional sources of revenue, besides controlling their cost of operations. This review contains ten recommendations to improve the STUs performance. Hiring of buses, creating a regulator to regulate fares and services and tapping of the non-conventional sources of revenue are some of these recommendations.
Audit Report (Commercial) for the year ended 31 March 2009
46
Introduction 2.3.1 In Punjab, the public road transport is primarily provided by three State transport undertakings (STUs) namely, Punjab Roadways (Roadways), Punjab State Bus Stand Management Company Limited (PUNBUS) and Pepsu Road Transport Corporation (PRTC) which are mandated to provide an efficient, adequate, economical and properly co-ordinated road transport. The State also allows the private operators to provide public transport. The State has reserved certain routes exclusively for the STUs while allowing the STUs and private operators to operate on some other routes. The fare structure is controlled and approved by the Government. This structure is same for the STUs as well as private operators. 2.3.2 The Roadways was established in 1948, PRTC was incorporated on 7 January 1956 under Section 3 of the Road Transport Corporations Act, 1950 by the State Government and PUNBUS was incorporated on 7 March 1995 under the Companies Act, 1956 with the main objective of construction and management of bus stands. Subsequently, by amending its object clause, PUNBUS started operation of buses from May 2005 on the route permits of Roadways. PUNBUS utilises services of the Roadways staff for operations and maintenance of its buses on payment basis besides hiring of drivers and conductors on contract basis. These STUs are under the administrative control of the Transport Department of the Punjab Government. 2.3.3 The Management of the Roadways is vested with the Director, State Transport appointed by the Government of Punjab. The day-to-day operations are carried out by him with the assistance of Deputy Director, State Transport; Additional Director (Finance & Accounts); Chief Store & Purchase Officer; Mechanical Automobile Engineer and Administrative Officer at the Head Office and General Manager in each depot. The Roadways has 18 Depots and a tyre retreading plant. The bus body building operation is carried out through external agencies. 2.3.4 The Management of PRTC is vested with a Board of Directors comprising 12 Directors. 11 Directors including the Chairman and Managing Director are appointed by the State Government and one Director is appointed by the Central Government. The day to day operations are carried out by the Managing Director, who is the Chief Executive Officer, with the assistance of Additional Managing Director, General Managers, Chief Automobile Engineer cum Technical Advisor and Chief Accounts Officer cum Financial Advisor. PRTC has nine Depots, a Special Cell and a Central Workshop each headed by a General Manager. PRTC also has a tyre retreading plant and a bus body fabrication cell. 2.3.5 The Management of PUNBUS is vested with a Board of Directors comprising Chairman, Managing Director and five Directors appointed by the State Government. The day to day operations are carried out by the Managing Director, with the assistance of Directors and Depot Managers. PUNBUS carries out its operation through 18 Depots, which are functionally the same as that of Roadways. 2.3.6 The STUs had a fleet strength of 2,578 buses as on 31 March 2009 including 35 hired buses. The STUs carried an average of 8.01 lakh passengers per day during 2004-05 to 2008-09. The STUs’ share in the passenger transport operations in the State was 39.46 per cent and the remaining 60.54 per cent was accounted for by
Chapter II Performance review relating to Statutory corporations
47
private operators. The turnover of the STUs was Rs. 534.99 crore in 2008-09, which was equal to 0.34 per cent of the State Gross Domestic Product. The STUs employed 12,415 employees as on 31 March 2009. 2.3.7 A review on the working of the Roadways was included in the Report of the Comptroller and Auditor General of India for the year ended March 2000 (Civil), Government of Punjab. The review was discussed by the Public Accounts Committee during October 2006 and its recommendations were awaited (September 2009). 2.3.8 A review on the working of PRTC was included in the Report of the Comptroller and Auditor General of India for the year ended March 2006 (Commercial), Government of Punjab. The Review is under discussion by the Committee on Public Undertakings (September 2009).
Scope of Audit and Audit methodology 2.3.9 The present review conducted during February 2009 to June 2009 covers the performance of the STUs during the period from 2004-05 to 2008-09 (from 2005-06 to 2008-09 in the case of PUNBUS since it started operations from May 2005). The review mainly deals with operational efficiency, financial management, fare policy, fulfillment of social obligations and monitoring by top management of the STUs. The audit examination involved scrutiny of records of the Head Office and nine♦ depots of Roadways, selected on the basis of geographical location. The nine depots had a fleet strength of 390 buses and turnover of Rs. 33.76 crore, out of the total fleet strength of 719Θ and turnover of Rs. 59.12 crore of the Roadways in 2008-09. In PRTC, the audit examination involved the scrutiny of records at the Head Office, central workshop, tyre retreading plant, body fabrication cell, special cell and six* out of nine depots selected on the basis of geographical location and their financial and physical performance for the last five years ending March 2008. The six depots had a fleet strength of 658 buses and turnover of Rs. 151.86 crore, out of the total fleet strength of 974♣ and turnover of Rs. 226.67 crore of PRTC in 2008-09. In case of PUNBUS, the audit examination involved scrutiny of records of the Head Office and fiveΣ depots out of 18 depots, selected on the basis of geographical location. The five depots had a fleet strength of 257 buses and turnover of Rs. 74.55 crore, out of the total fleet strength of 885 and turnover of Rs. 249.20 crore of PUNBUS in 2008-09. 2.3.10 The methodology adopted for attaining the audit objectives with reference to audit criteria consisted of explaining audit objectives to top Management, scrutiny of records at Head Office and selected units, interaction with the auditee personnel, analysis of data with reference to audit criteria, raising of audit queries, discussion of
♦ Amritsar-II, Batala, Ferozepur, Hoshiarpur, Jagraon, Jalandhar-I, Ludhiana, Pathankot and
Roopnagar. Θ including two hired buses. ♣ including 33 hired buses. * Patiala, Sangrur, Bathinda, Budhlada, Ludhiana and Chandigarh. Σ Amritsar II, Roopnagar, Ludhiana, Jagraon and Pathankot.
Audit Report (Commercial) for the year ended 31 March 2009
48
audit findings with the Management and issue of draft review report to the Management for comments.
Audit objectives
The objectives of the performance audit were to assess: 2.3.11 Operational performance • the extent to which the STUs were able to keep pace with the growing
demand for public transport; • whether the STUs succeeded in recovering the cost of operations; • the extent to which the STUs were running their operations efficiently; • whether adequate maintenance was undertaken to keep the vehicles
roadworthy; and • the extent to which economy was ensured in cost of operations.
2.3.12 Financial management • whether the STUs were able to meet their commitments and recover their
dues efficiently; and • the possibility of realigning the business model of the STUs to tap non-
conventional sources of revenue and adopting innovative methods of accessing such funds.
2.3.13 Fare policy and fulfilment of social obligations • the existence and adequacy of fare policy; and • whether the STUs operated adequately on uneconomical routes.
2.3.14 Monitoring by top management • whether the monitoring by STUs’ top management was adequate and
effective.
Audit criteria 2.3.15 The criteria adopted for assessing the achievement of the audit objectives were: • all India averages for performance parameters;
Chapter II Performance review relating to Statutory corporations
49
• performance standards and operational norms fixed by the Association of State Road Transport Undertakings (ASRTU);
• physical and financial targets/ norms fixed by the Management; • manufacturers’ specifications, norms for life of a bus, preventive
maintenance schedule, fuel efficiency norms, etc.; • instructions of the Government of India (GOI) and the Government of
Punjab and other relevant rules and regulations; • corporate policy for investment of funds; and • procedures laid down by the STUs. Financial position and working results
2.3.16 The proforma accounts of the Roadways are in arrears from the year 2000-01, hence, figures of Liabilities and Assets of the Roadways for 2004-05 to 2008-09 are not available. The financial position∝ of PRTC and PUNBUS for the years 2004-08♦ is given below:
(Rupees in crore) Particulars 2004-05 2005-06 2006-07 2007-08
A. Liabilities Paid up Capital 117.33 117.33 167.33 167.33 Reserve & Surplus (including Capital Grants but excluding Depreciation Reserve) 0.58 1.16 491.89 485.75
Borrowings (Loan Funds) 76.73 119.08 132.67 136.76 Current Liabilities & Provisions 181.34 215.75 230.55 248.13 Total 375.98 453.32 1,022.44 1,037.97B. Assets Gross Block 115.49 165.69 740.30 777.24 Less: Depreciation 86.37 100.54 118.78 145.36 Net Fixed Assets 29.12 65.15 621.52 631.88 Capital works-in-progress (including cost of chassis) 1.09 2.41 4.24 2.57
Investments 0.03 0.03 0.03 0.03 Current Assets, Loans and Advances 34.85 58.92 61.05 67.03 Accumulated losses 310.89 326.81 335.60 336.46 Total 375.98 453.32 1,022.44 1,037.97
∝ The STU-wise financial position is given in Annexure 7. ♦ Figures for 2008-09 not yet finalised by the PRTC.
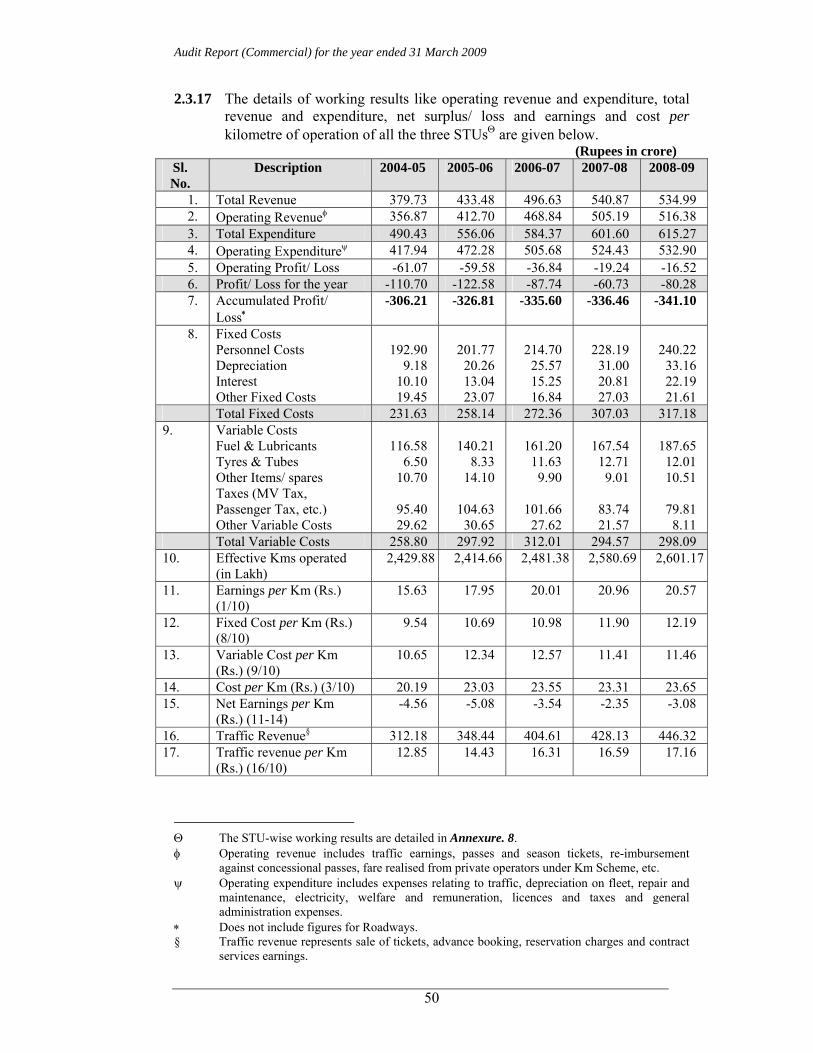
Audit Report (Commercial) for the year ended 31 March 2009
50
2.3.17 The details of working results like operating revenue and expenditure, total revenue and expenditure, net surplus/ loss and earnings and cost per kilometre of operation of all the three STUsΘ are given below.
(Rupees in crore) Sl. No.
Description 2004-05 2005-06 2006-07 2007-08 2008-09
1. Total Revenue 379.73 433.48 496.63 540.87 534.99 2. Operating Revenueφ 356.87 412.70 468.84 505.19 516.38 3. Total Expenditure 490.43 556.06 584.37 601.60 615.27 4. Operating Expenditureψ 417.94 472.28 505.68 524.43 532.90 5. Operating Profit/ Loss -61.07 -59.58 -36.84 -19.24 -16.52 6. Profit/ Loss for the year -110.70 -122.58 -87.74 -60.73 -80.28 7. Accumulated Profit/
Loss∗ -306.21 -326.81 -335.60 -336.46 -341.10
8. Fixed Costs Personnel Costs Depreciation Interest Other Fixed Costs
192.90
9.18 10.10 19.45
201.77
20.26 13.04 23.07
214.70
25.57 15.25 16.84
228.19
31.00 20.81 27.03
240.22
33.16 22.19 21.61
Total Fixed Costs 231.63 258.14 272.36 307.03 317.18 9. Variable Costs
Fuel & Lubricants Tyres & Tubes Other Items/ spares Taxes (MV Tax, Passenger Tax, etc.) Other Variable Costs
116.58
6.50 10.70
95.40 29.62
140.21
8.33 14.10
104.63
30.65
161.20
11.63 9.90
101.66
27.62
167.54
12.71 9.01
83.74 21.57
187.65
12.01 10.51
79.81 8.11
Total Variable Costs 258.80 297.92 312.01 294.57 298.09 10. Effective Kms operated
(in Lakh) 2,429.88 2,414.66 2,481.38 2,580.69 2,601.17
11. Earnings per Km (Rs.) (1/10)
15.63 17.95 20.01 20.96 20.57
12. Fixed Cost per Km (Rs.) (8/10)
9.54 10.69 10.98 11.90 12.19
13. Variable Cost per Km (Rs.) (9/10)
10.65 12.34 12.57 11.41 11.46
14. Cost per Km (Rs.) (3/10) 20.19 23.03 23.55 23.31 23.65 15. Net Earnings per Km
(Rs.) (11-14) -4.56 -5.08 -3.54 -2.35 -3.08
16. Traffic Revenue§ 312.18 348.44 404.61 428.13 446.32 17. Traffic revenue per Km
(Rs.) (16/10) 12.85 14.43 16.31 16.59 17.16
Θ The STU-wise working results are detailed in Annexure. 8. φ Operating revenue includes traffic earnings, passes and season tickets, re-imbursement
against concessional passes, fare realised from private operators under Km Scheme, etc. ψ Operating expenditure includes expenses relating to traffic, depreciation on fleet, repair and
maintenance, electricity, welfare and remuneration, licences and taxes and general administration expenses.
∗ Does not include figures for Roadways. § Traffic revenue represents sale of tickets, advance booking, reservation charges and contract
services earnings.
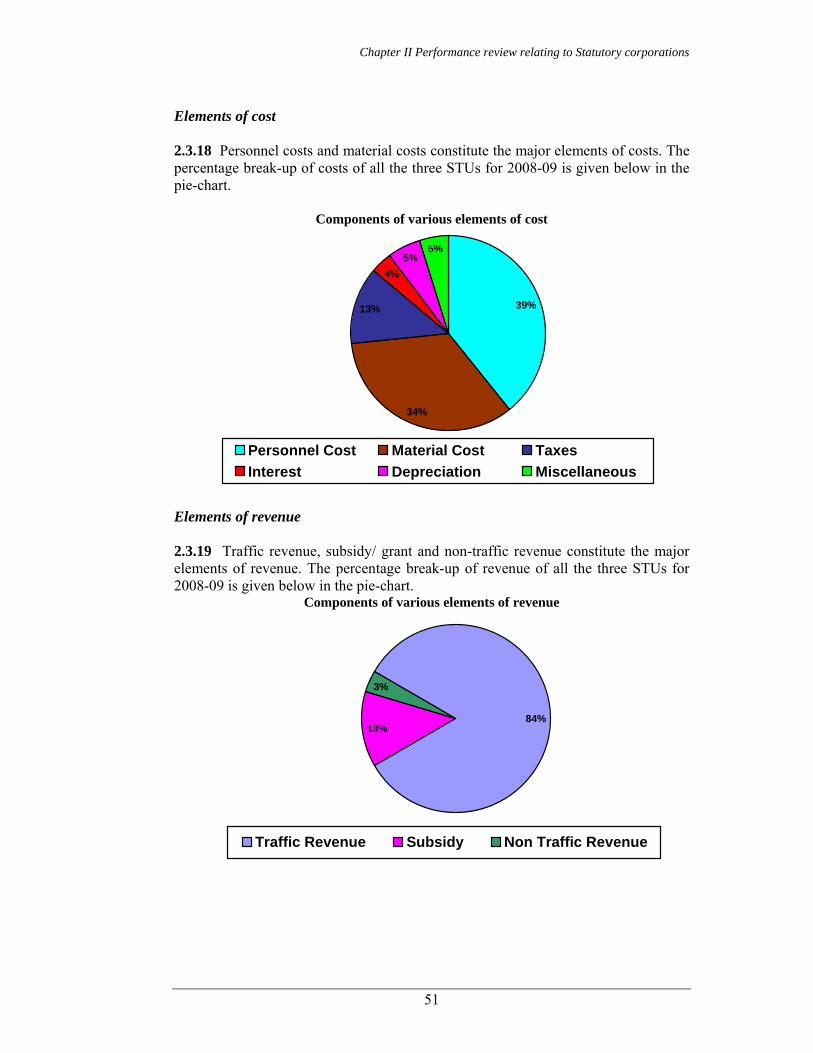
Chapter II Performance review relating to Statutory corporations
51
Elements of cost 2.3.18 Personnel costs and material costs constitute the major elements of costs. The percentage break-up of costs of all the three STUs for 2008-09 is given below in the pie-chart.
Components of various elements of cost
13%
4%5%
5%
34%
39%
Personnel Cost Material Cost TaxesInterest Depreciation Miscellaneous
Elements of revenue 2.3.19 Traffic revenue, subsidy/ grant and non-traffic revenue constitute the major elements of revenue. The percentage break-up of revenue of all the three STUs for 2008-09 is given below in the pie-chart.
Components of various elements of revenue
3%
13%84%
Traffic Revenue Subsidy Non Traffic Revenue
Audit Report (Commercial) for the year ended 31 March 2009
52
Audit findings
2.3.20 Audit explained the audit objectives to PRTC during an ‘entry conference’ on 26 February 2009 and to the Roadways and PUNBUS on 27 February 2009. Subsequently, audit findings were reported to the STUs and the Government in July 2009 and discussed in an ‘exit conference’ held on 2 September 2009, which was attended by Director, State Transport cum Managing Director of the PUNBUS with Assistant Controller (Finance & Accounts) and on 4 September 2009 with the Managing Director PRTC and Chief of Accounts. The views expressed by them have been considered while finalising this review. The audit findings are discussed below. Operational performance
2.3.21 The operational performance of the STUs for the five years ending 2008-09 is given in the Annexure 9. The operational performance of the STUs was evaluated on various operational parameters as described below. It was also seen whether the STUs were able to maintain pace with the growing demand of public transport. The audit findings show that the losses were controllable and there is scope for improvement in performance. Share of STUs in public transport 2.3.22 In order to provide adequate transportation to the public in the State, the State Government formed (August 1990 and modified in October 1997) a transport scheme. The main provisions of the scheme are as under:
• All vehicles running on interstate routes shall be operated by the State Transport Undertakings.
• All operations on monopoly routes shall be undertaken by the STUs, provided that a private operator may be allowed to operate on a portion of 20 per cent of the monopoly route or up to 15 Kms of the route which ever is less, where it is necessary or is in public interest to do so.
• All operations on the routes falling on National highways within the state shall be undertaken by STUs and private operators in the ratio of 75:25.
• All operations on the routes falling on the State highways and other roads shall be undertaken by STUs and private operators in the ratio of 40:60.
The transport scheme emphasises on operation by STUs only on inter state routes, higher participation of STUs on monopoly routes and routes falling on the National highways, besides higher participation of private operators on routes falling on the State Highways and other roads. The State Transport Commissioner (Non-commercial Wing of the Transport department) is responsible for issue of permits and implementation of the transport scheme. Audit noticed that scheme was not being implemented in letter and spirit as on several occasions, the private operators were allotted excess routes on National highways/monopoly routes in disregard to the scheme. In case of violation, the STU filed petitions with the State Transport Appellate Tribunal (STAT) for cancellation of permit granted in violation of scheme. As on date, 107 petitions filed by the Roadways were pending with STAT.
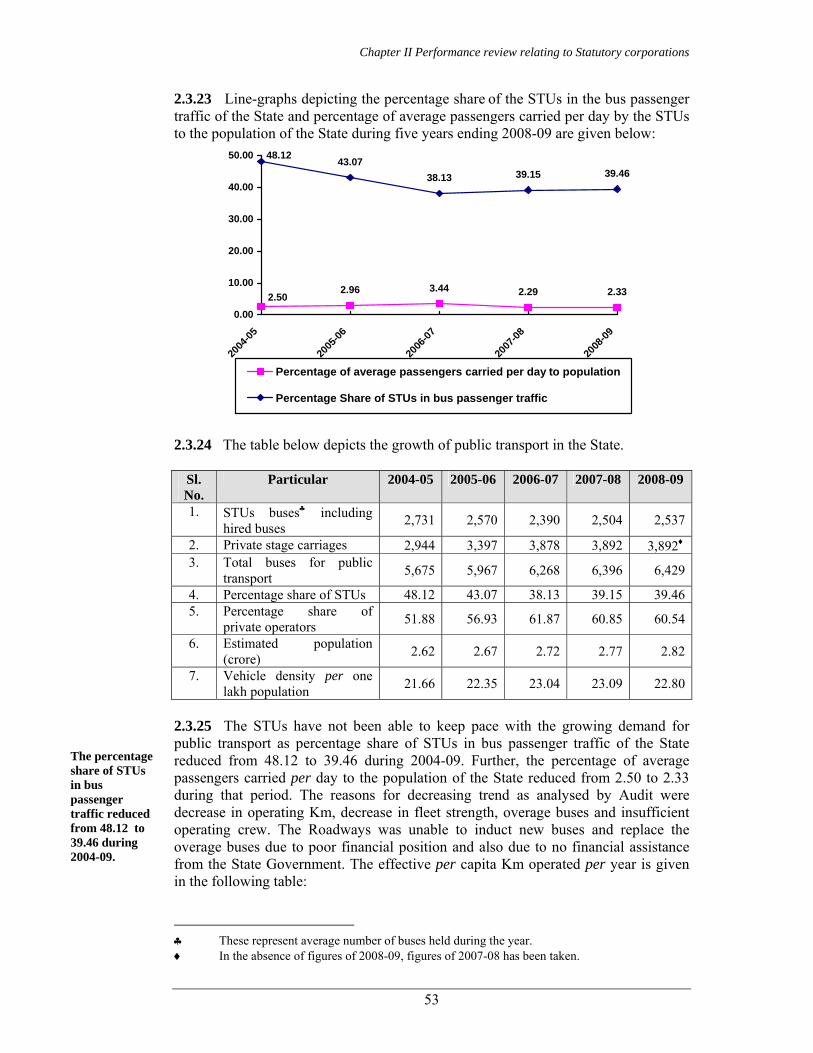
Chapter II Performance review relating to Statutory corporations
53
2.3.23 Line-graphs depicting the percentage share of the STUs in the bus passenger traffic of the State and percentage of average passengers carried per day by the STUs to the population of the State during five years ending 2008-09 are given below:
2.96 3.44 2.29 2.33
43.0738.13 39.15 39.46
2.50
48.12
0.00
10.00
20.00
30.00
40.00
50.00
2004
-05
2005
-06
2006
-07
2007
-08
2008
-09
Percentage of average passengers carried per day to population
Percentage Share of STUs in bus passenger traffic
2.3.24 The table below depicts the growth of public transport in the State.
Sl. No.
Particular 2004-05 2005-06 2006-07 2007-08 2008-09
1. STUs buses♣ including hired buses 2,731 2,570 2,390 2,504 2,537
2. Private stage carriages 2,944 3,397 3,878 3,892 3,892♦
3. Total buses for public transport 5,675 5,967 6,268 6,396 6,429
4. Percentage share of STUs 48.12 43.07 38.13 39.15 39.465. Percentage share of
private operators 51.88 56.93 61.87 60.85 60.54
6. Estimated population (crore) 2.62 2.67 2.72 2.77 2.82
7. Vehicle density per one lakh population 21.66 22.35 23.04 23.09 22.80
2.3.25 The STUs have not been able to keep pace with the growing demand for public transport as percentage share of STUs in bus passenger traffic of the State reduced from 48.12 to 39.46 during 2004-09. Further, the percentage of average passengers carried per day to the population of the State reduced from 2.50 to 2.33 during that period. The reasons for decreasing trend as analysed by Audit were decrease in operating Km, decrease in fleet strength, overage buses and insufficient operating crew. The Roadways was unable to induct new buses and replace the overage buses due to poor financial position and also due to no financial assistance from the State Government. The effective per capita Km operated per year is given in the following table:
♣ These represent average number of buses held during the year. ♦ In the absence of figures of 2008-09, figures of 2007-08 has been taken.
The percentage share of STUs in bus passenger traffic reduced from 48.12 to 39.46 during 2004-09.
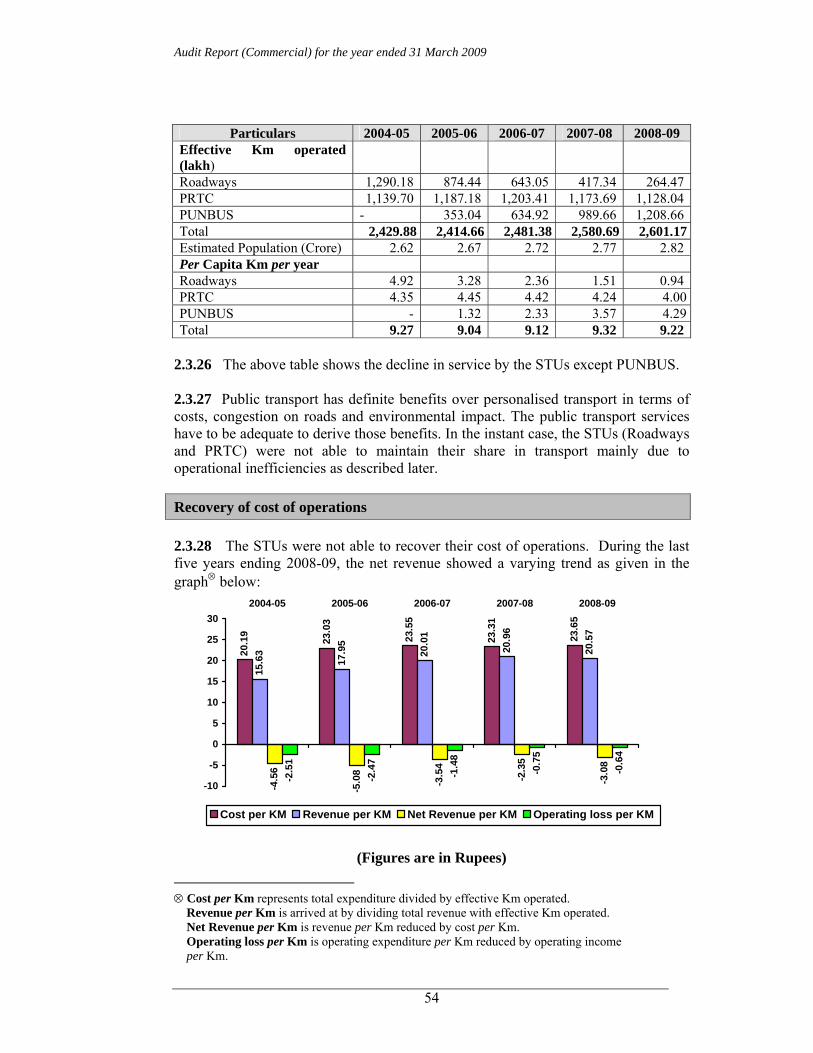
Audit Report (Commercial) for the year ended 31 March 2009
54
Particulars 2004-05 2005-06 2006-07 2007-08 2008-09 Effective Km operated (lakh)
Roadways 1,290.18 874.44 643.05 417.34 264.47PRTC 1,139.70 1,187.18 1,203.41 1,173.69 1,128.04PUNBUS - 353.04 634.92 989.66 1,208.66Total 2,429.88 2,414.66 2,481.38 2,580.69 2,601.17Estimated Population (Crore) 2.62 2.67 2.72 2.77 2.82Per Capita Km per year Roadways 4.92 3.28 2.36 1.51 0.94PRTC 4.35 4.45 4.42 4.24 4.00PUNBUS - 1.32 2.33 3.57 4.29Total 9.27 9.04 9.12 9.32 9.22
2.3.26 The above table shows the decline in service by the STUs except PUNBUS. 2.3.27 Public transport has definite benefits over personalised transport in terms of costs, congestion on roads and environmental impact. The public transport services have to be adequate to derive those benefits. In the instant case, the STUs (Roadways and PRTC) were not able to maintain their share in transport mainly due to operational inefficiencies as described later. Recovery of cost of operations 2.3.28 The STUs were not able to recover their cost of operations. During the last five years ending 2008-09, the net revenue showed a varying trend as given in the graph⊗ below:
20.1
9
23.0
3
23.3
1
23.6
5
15.6
3
17.9
5
20.0
1
20.9
6
20.5
7
-4.5
6
-5.0
8
-3.5
4
-2.3
5
-3.0
8
-2.5
1
-2.4
7
-1.4
8
-0.7
5
-0.6
4
23.5
5
-10
-5
0
5
10
15
20
25
302004-05 2005-06 2006-07 2007-08 2008-09
Cost per KM Revenue per KM Net Revenue per KM Operating loss per KM
(Figures are in Rupees)
⊗ Cost per Km represents total expenditure divided by effective Km operated. Revenue per Km is arrived at by dividing total revenue with effective Km operated. Net Revenue per Km is revenue per Km reduced by cost per Km. Operating loss per Km is operating expenditure per Km reduced by operating income per Km.
Chapter II Performance review relating to Statutory corporations
55
2.3.29 The above graph indicates the poor performance of the STUs over the period. The net earnings were negative. None of the STUs was able to contain the cost within the All India Average (AIA) cost (Rs. 19.94). The poor performance has been impacting the ability of the Roadways and PRTC to provide public transport services adequately as they
are not able to replace their fleet on time or increase the fleet strength to meet the growing demand. Efficiency and economy in operations Fleet strength and utilisation Fleet strength and its age profile 2.3.30 The STUs have their own fleet of buses. They also hire buses from contractors except PUNBUS. Audit findings in respect of hired buses are given in paragraphs 2.3.69 and 2.3.70. The table below explains the position of STUs’ own fleet. 2.3.31 The Association of State Road Transport Undertakings (ASRTU) had prescribed (September 1997) the desirable age of a bus as eight years or five lakh kilometres, whichever was earlier. PRTC, however, fixed (April 2000) the life of a bus as eight years or 6.5 lakh kilometres keeping in view the practical experience and improvement in technology. In the case of PUNBUS, the entire fleet was less than four years old. The table below shows the age-profile of the buses held by the STUs∗ for the period of five years ending 2008-09. Sl. No.
Particulars∏ 2004-05 2005-06 2006-07 2007-08 2008-09
1 Total No. of buses at the beginning of the year
2,491 2,511 2,526 2,360 2,456
2 Additions during the year 92 457 226 311 1803 Buses scrapped during the
year 72 442 392 215 93
4 Buses held at the end of the year (1+2-3)
2,511 2,526 2,360 2,456 2,543
5 Of (4), No. of buses more than 8 years old
1,892 1,568 1,403 1,280 1,210
6 Percentage of overage buses to total buses
75.35 62.07 59.45 52.12 47.58
2.3.32 The PRTC and Roadways were not able to achieve the norm of right age buses. During 2004-09, PRTC added 379 new buses at a cost of Rs. 40.95 crore ∗ STU-wise age profile of buses is given in Annexure 10. ∏ Excludes hired buses.
Orissa, Uttar Pradesh and Karnataka registered best net earnings per Km at Rs. 0.49, Rs. 0.47 and Rs. 0.34 respectively during 2006-07 (Source: STUs profile and performance 2006-07 by CIRT, Pune)
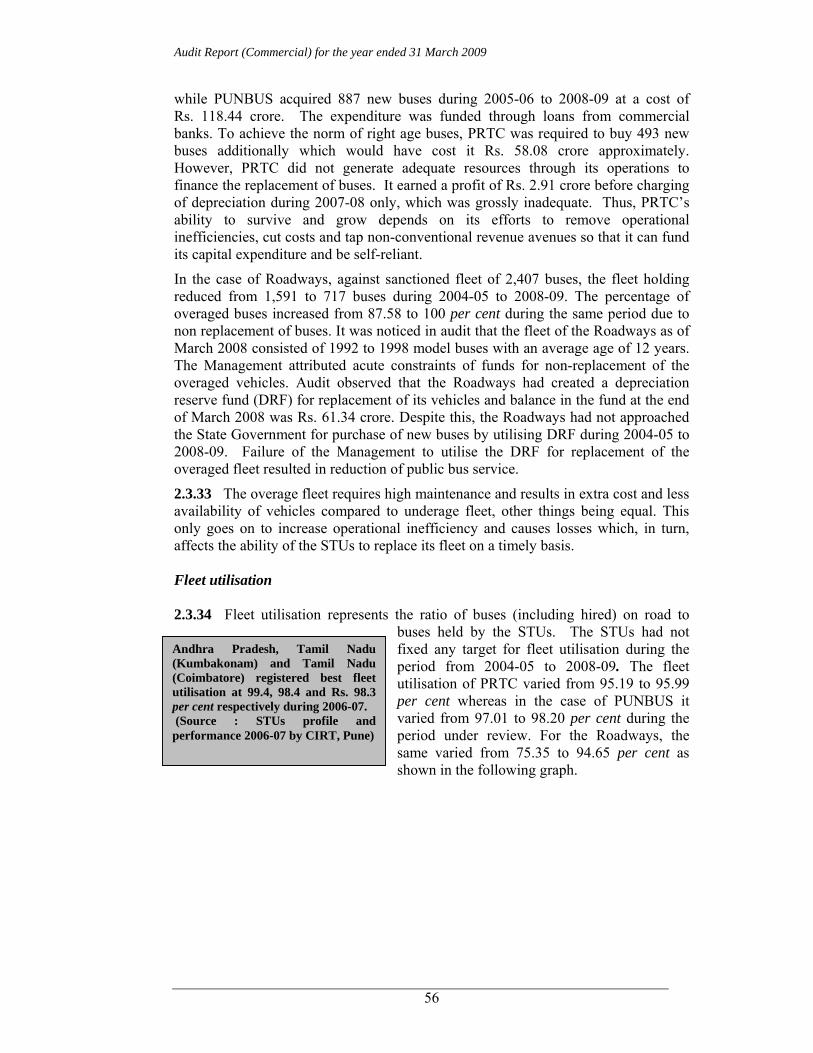
Audit Report (Commercial) for the year ended 31 March 2009
56
while PUNBUS acquired 887 new buses during 2005-06 to 2008-09 at a cost of Rs. 118.44 crore. The expenditure was funded through loans from commercial banks. To achieve the norm of right age buses, PRTC was required to buy 493 new buses additionally which would have cost it Rs. 58.08 crore approximately. However, PRTC did not generate adequate resources through its operations to finance the replacement of buses. It earned a profit of Rs. 2.91 crore before charging of depreciation during 2007-08 only, which was grossly inadequate. Thus, PRTC’s ability to survive and grow depends on its efforts to remove operational inefficiencies, cut costs and tap non-conventional revenue avenues so that it can fund its capital expenditure and be self-reliant.
In the case of Roadways, against sanctioned fleet of 2,407 buses, the fleet holding reduced from 1,591 to 717 buses during 2004-05 to 2008-09. The percentage of overaged buses increased from 87.58 to 100 per cent during the same period due to non replacement of buses. It was noticed in audit that the fleet of the Roadways as of March 2008 consisted of 1992 to 1998 model buses with an average age of 12 years. The Management attributed acute constraints of funds for non-replacement of the overaged vehicles. Audit observed that the Roadways had created a depreciation reserve fund (DRF) for replacement of its vehicles and balance in the fund at the end of March 2008 was Rs. 61.34 crore. Despite this, the Roadways had not approached the State Government for purchase of new buses by utilising DRF during 2004-05 to 2008-09. Failure of the Management to utilise the DRF for replacement of the overaged fleet resulted in reduction of public bus service.
2.3.33 The overage fleet requires high maintenance and results in extra cost and less availability of vehicles compared to underage fleet, other things being equal. This only goes on to increase operational inefficiency and causes losses which, in turn, affects the ability of the STUs to replace its fleet on a timely basis. Fleet utilisation 2.3.34 Fleet utilisation represents the ratio of buses (including hired) on road to
buses held by the STUs. The STUs had not fixed any target for fleet utilisation during the period from 2004-05 to 2008-09. The fleet utilisation of PRTC varied from 95.19 to 95.99 per cent whereas in the case of PUNBUS it varied from 97.01 to 98.20 per cent during the period under review. For the Roadways, the same varied from 75.35 to 94.65 per cent as shown in the following graph.
Andhra Pradesh, Tamil Nadu (Kumbakonam) and Tamil Nadu (Coimbatore) registered best fleet utilisation at 99.4, 98.4 and Rs. 98.3 per cent respectively during 2006-07. (Source : STUs profile and performance 2006-07 by CIRT, Pune)
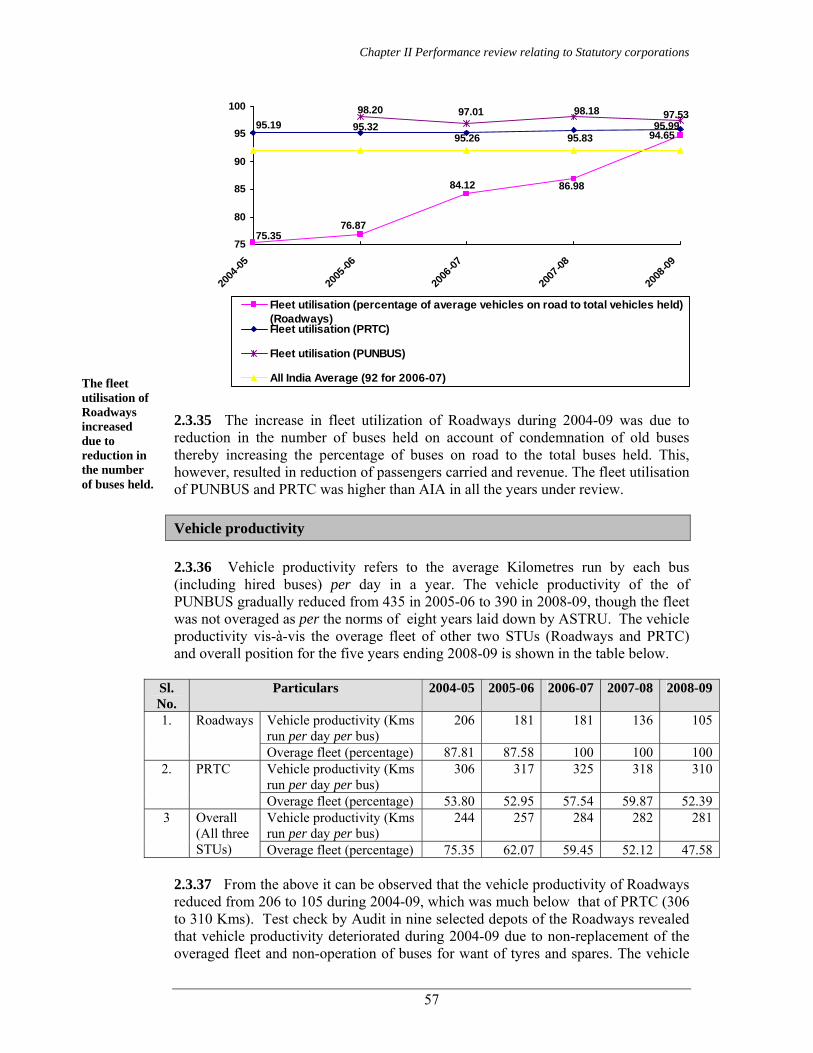
Chapter II Performance review relating to Statutory corporations
57
2.3.35 The increase in fleet utilization of Roadways during 2004-09 was due to reduction in the number of buses held on account of condemnation of old buses thereby increasing the percentage of buses on road to the total buses held. This, however, resulted in reduction of passengers carried and revenue. The fleet utilisation of PUNBUS and PRTC was higher than AIA in all the years under review. Vehicle productivity 2.3.36 Vehicle productivity refers to the average Kilometres run by each bus (including hired buses) per day in a year. The vehicle productivity of the of PUNBUS gradually reduced from 435 in 2005-06 to 390 in 2008-09, though the fleet was not overaged as per the norms of eight years laid down by ASTRU. The vehicle productivity vis-à-vis the overage fleet of other two STUs (Roadways and PRTC) and overall position for the five years ending 2008-09 is shown in the table below.
Sl. No.
Particulars 2004-05 2005-06 2006-07 2007-08 2008-09
Vehicle productivity (Kms run per day per bus)
206 181 181 136 1051. Roadways
Overage fleet (percentage) 87.81 87.58 100 100 100Vehicle productivity (Kms run per day per bus)
306 317 325 318 3102. PRTC
Overage fleet (percentage) 53.80 52.95 57.54 59.87 52.39Vehicle productivity (Kms run per day per bus)
244 257 284 282 2813 Overall (All three STUs) Overage fleet (percentage) 75.35 62.07 59.45 52.12 47.58
2.3.37 From the above it can be observed that the vehicle productivity of Roadways reduced from 206 to 105 during 2004-09, which was much below that of PRTC (306 to 310 Kms). Test check by Audit in nine selected depots of the Roadways revealed that vehicle productivity deteriorated during 2004-09 due to non-replacement of the overaged fleet and non-operation of buses for want of tyres and spares. The vehicle
76.8775.35
84.12 86.98
94.6595.26 95.8395.9995.19 95.32
98.18 97.5397.0198.20
75
80
85
90
95
100
2004
-05
2005
-06
2006
-07
2007
-08
2008
-09
Fleet utilisation (percentage of average vehicles on road to total vehicles held)(Roadways)Fleet utilisation (PRTC)
Fleet utilisation (PUNBUS)
All India Average (92 for 2006-07)The fleet utilisation of Roadways increased due to reduction in the number of buses held.
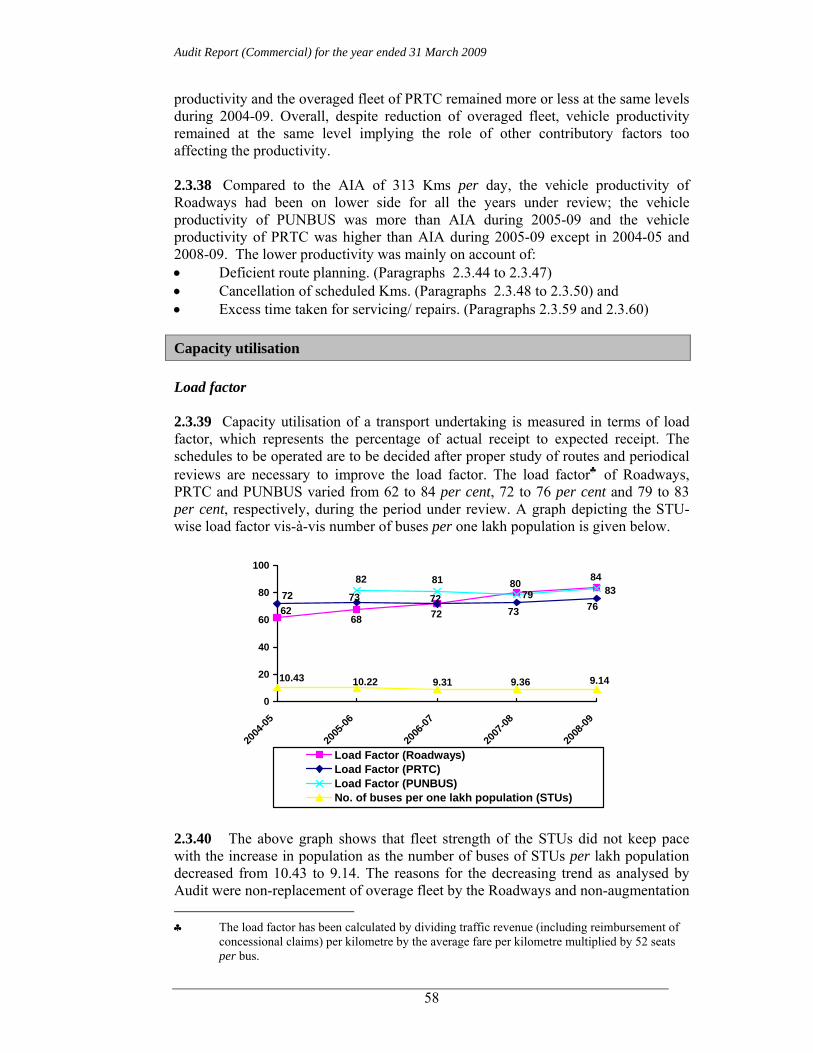
Audit Report (Commercial) for the year ended 31 March 2009
58
productivity and the overaged fleet of PRTC remained more or less at the same levels during 2004-09. Overall, despite reduction of overaged fleet, vehicle productivity remained at the same level implying the role of other contributory factors too affecting the productivity. 2.3.38 Compared to the AIA of 313 Kms per day, the vehicle productivity of Roadways had been on lower side for all the years under review; the vehicle productivity of PUNBUS was more than AIA during 2005-09 and the vehicle productivity of PRTC was higher than AIA during 2005-09 except in 2004-05 and 2008-09. The lower productivity was mainly on account of: • Deficient route planning. (Paragraphs 2.3.44 to 2.3.47) • Cancellation of scheduled Kms. (Paragraphs 2.3.48 to 2.3.50) and • Excess time taken for servicing/ repairs. (Paragraphs 2.3.59 and 2.3.60) Capacity utilisation Load factor 2.3.39 Capacity utilisation of a transport undertaking is measured in terms of load factor, which represents the percentage of actual receipt to expected receipt. The schedules to be operated are to be decided after proper study of routes and periodical reviews are necessary to improve the load factor. The load factor♣ of Roadways, PRTC and PUNBUS varied from 62 to 84 per cent, 72 to 76 per cent and 79 to 83 per cent, respectively, during the period under review. A graph depicting the STU-wise load factor vis-à-vis number of buses per one lakh population is given below.
6862 72
80 84
72 73 7273 76
82 8179 83
9.149.369.3110.43 10.22
0
20
40
60
80
100
2004
-05
2005
-06
2006
-07
2007
-08
2008
-09
Load Factor (Roadways)Load Factor (PRTC)Load Factor (PUNBUS)No. of buses per one lakh population (STUs)
2.3.40 The above graph shows that fleet strength of the STUs did not keep pace with the increase in population as the number of buses of STUs per lakh population decreased from 10.43 to 9.14. The reasons for the decreasing trend as analysed by Audit were non-replacement of overage fleet by the Roadways and non-augmentation ♣ The load factor has been calculated by dividing traffic revenue (including reimbursement of
concessional claims) per kilometre by the average fare per kilometre multiplied by 52 seats per bus.
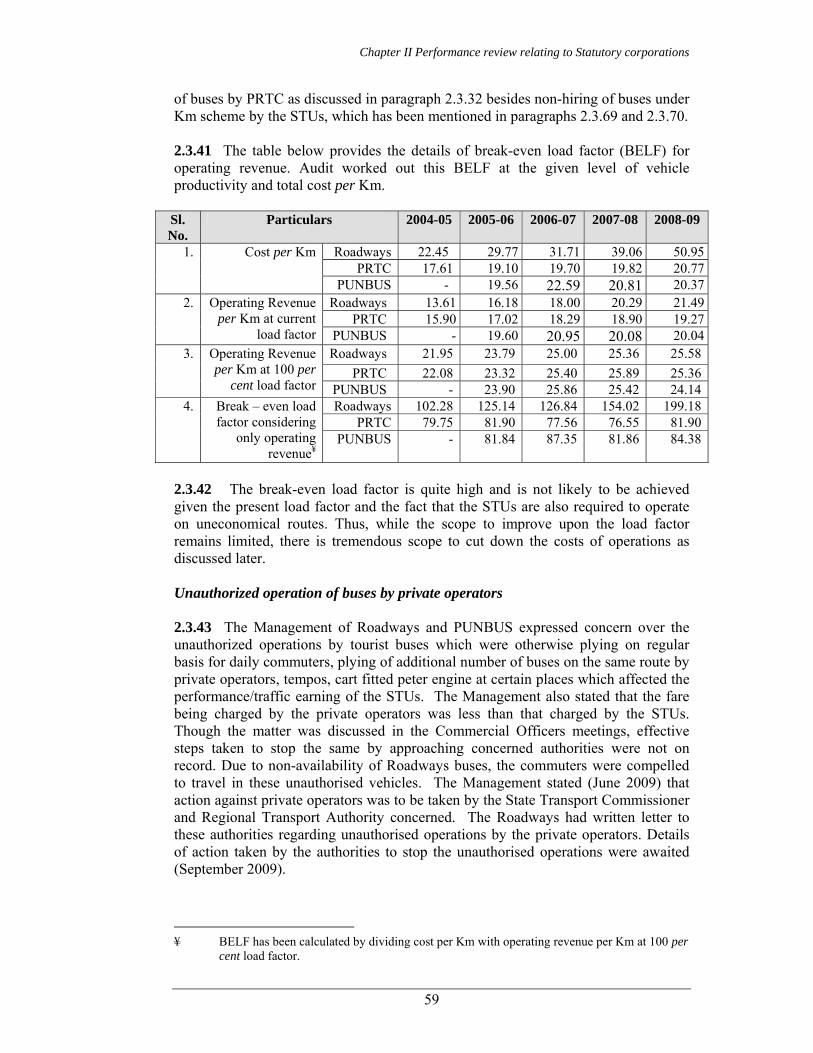
Chapter II Performance review relating to Statutory corporations
59
of buses by PRTC as discussed in paragraph 2.3.32 besides non-hiring of buses under Km scheme by the STUs, which has been mentioned in paragraphs 2.3.69 and 2.3.70. 2.3.41 The table below provides the details of break-even load factor (BELF) for operating revenue. Audit worked out this BELF at the given level of vehicle productivity and total cost per Km.
Sl. No.
Particulars 2004-05 2005-06 2006-07 2007-08 2008-09
Roadways 22.45 29.77 31.71 39.06 50.95PRTC 17.61 19.10 19.70 19.82 20.77
1. Cost per Km
PUNBUS - 19.56 22.59 20.81 20.37Roadways 13.61 16.18 18.00 20.29 21.49
PRTC 15.90 17.02 18.29 18.90 19.272. Operating Revenue
per Km at current load factor PUNBUS - 19.60 20.95 20.08 20.04
Roadways 21.95 23.79 25.00 25.36 25.58PRTC 22.08 23.32 25.40 25.89 25.36
3. Operating Revenue per Km at 100 per
cent load factor PUNBUS - 23.90 25.86 25.42 24.14Roadways 102.28 125.14 126.84 154.02 199.18
PRTC 79.75 81.90 77.56 76.55 81.904. Break – even load
factor considering only operating
revenue¥ PUNBUS - 81.84 87.35 81.86 84.38
2.3.42 The break-even load factor is quite high and is not likely to be achieved given the present load factor and the fact that the STUs are also required to operate on uneconomical routes. Thus, while the scope to improve upon the load factor remains limited, there is tremendous scope to cut down the costs of operations as discussed later. Unauthorized operation of buses by private operators 2.3.43 The Management of Roadways and PUNBUS expressed concern over the unauthorized operations by tourist buses which were otherwise plying on regular basis for daily commuters, plying of additional number of buses on the same route by private operators, tempos, cart fitted peter engine at certain places which affected the performance/traffic earning of the STUs. The Management also stated that the fare being charged by the private operators was less than that charged by the STUs. Though the matter was discussed in the Commercial Officers meetings, effective steps taken to stop the same by approaching concerned authorities were not on record. Due to non-availability of Roadways buses, the commuters were compelled to travel in these unauthorised vehicles. The Management stated (June 2009) that action against private operators was to be taken by the State Transport Commissioner and Regional Transport Authority concerned. The Roadways had written letter to these authorities regarding unauthorised operations by the private operators. Details of action taken by the authorities to stop the unauthorised operations were awaited (September 2009). ¥ BELF has been calculated by dividing cost per Km with operating revenue per Km at 100 per
cent load factor.
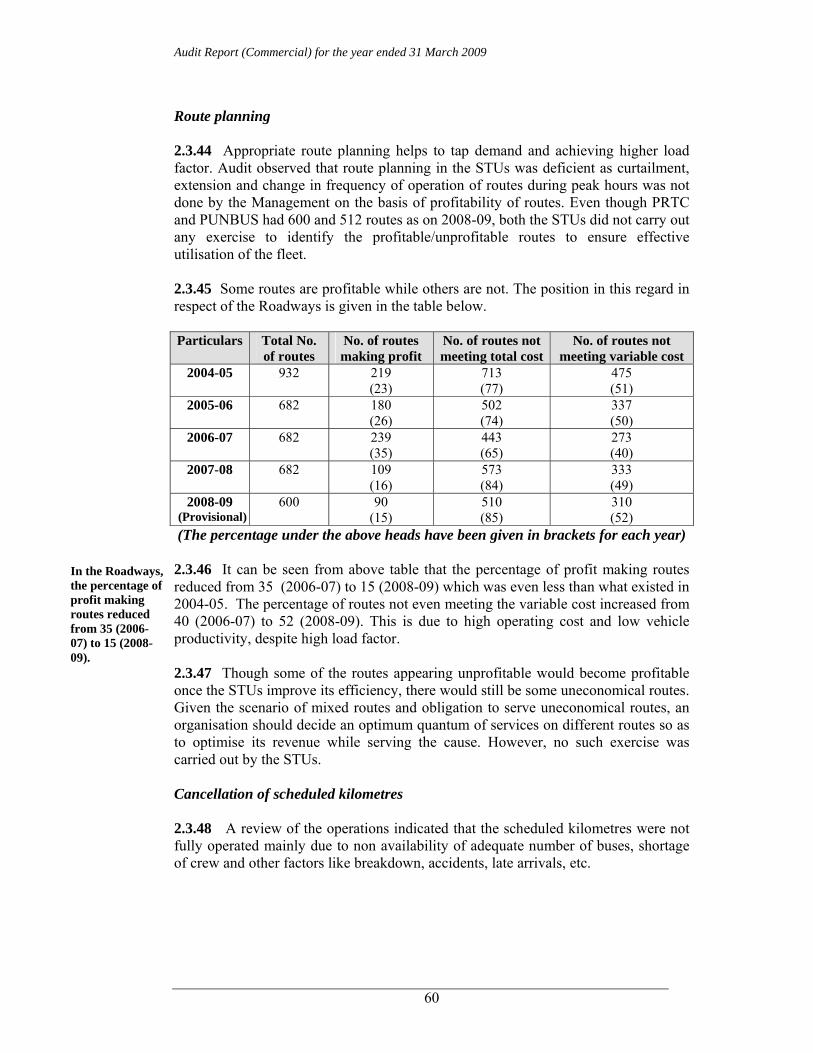
Audit Report (Commercial) for the year ended 31 March 2009
60
Route planning 2.3.44 Appropriate route planning helps to tap demand and achieving higher load factor. Audit observed that route planning in the STUs was deficient as curtailment, extension and change in frequency of operation of routes during peak hours was not done by the Management on the basis of profitability of routes. Even though PRTC and PUNBUS had 600 and 512 routes as on 2008-09, both the STUs did not carry out any exercise to identify the profitable/unprofitable routes to ensure effective utilisation of the fleet. 2.3.45 Some routes are profitable while others are not. The position in this regard in respect of the Roadways is given in the table below. Particulars Total No.
of routes No. of routes making profit
No. of routes not meeting total cost
No. of routes not meeting variable cost
2004-05 932
219 (23)
713 (77)
475 (51)
2005-06 682
180 (26)
502 (74)
337 (50)
2006-07 682
239 (35)
443 (65)
273 (40)
2007-08 682
109 (16)
573 (84)
333 (49)
2008-09 (Provisional)
600
90 (15)
510 (85)
310 (52)
(The percentage under the above heads have been given in brackets for each year)
2.3.46 It can be seen from above table that the percentage of profit making routes reduced from 35 (2006-07) to 15 (2008-09) which was even less than what existed in 2004-05. The percentage of routes not even meeting the variable cost increased from 40 (2006-07) to 52 (2008-09). This is due to high operating cost and low vehicle productivity, despite high load factor. 2.3.47 Though some of the routes appearing unprofitable would become profitable once the STUs improve its efficiency, there would still be some uneconomical routes. Given the scenario of mixed routes and obligation to serve uneconomical routes, an organisation should decide an optimum quantum of services on different routes so as to optimise its revenue while serving the cause. However, no such exercise was carried out by the STUs. Cancellation of scheduled kilometres 2.3.48 A review of the operations indicated that the scheduled kilometres were not fully operated mainly due to non availability of adequate number of buses, shortage of crew and other factors like breakdown, accidents, late arrivals, etc.
In the Roadways, the percentage of profit making routes reduced from 35 (2006-07) to 15 (2008-09).
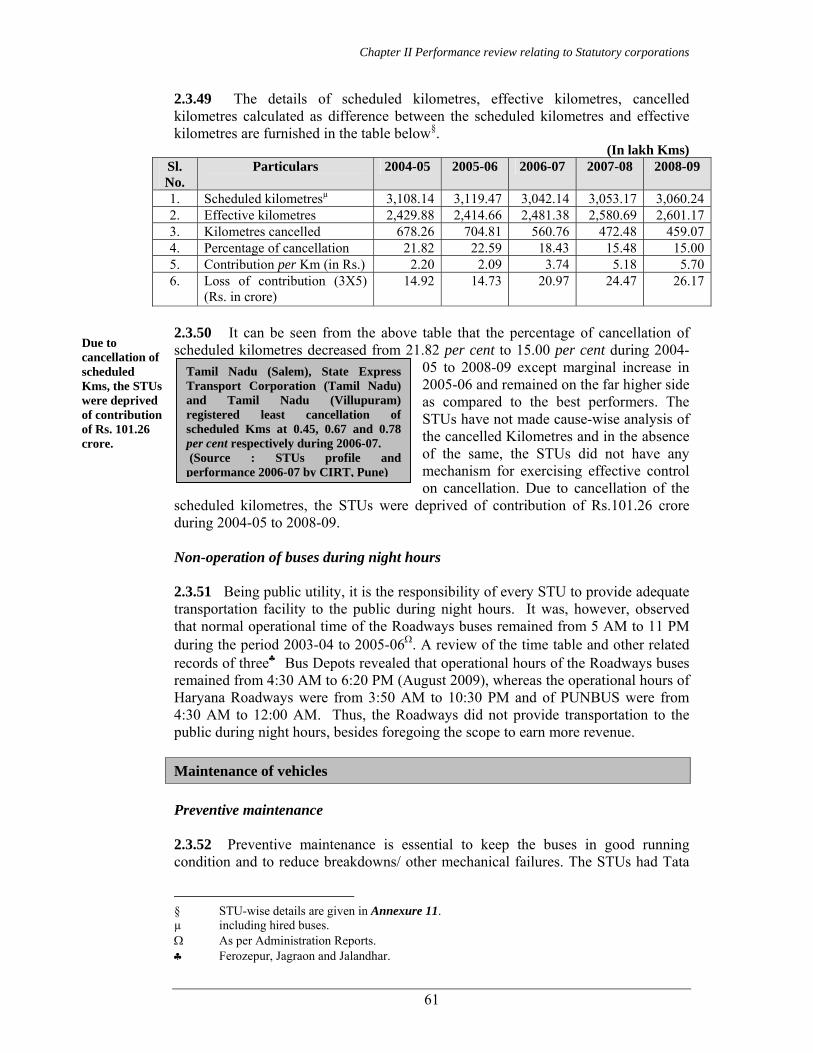
Chapter II Performance review relating to Statutory corporations
61
2.3.49 The details of scheduled kilometres, effective kilometres, cancelled kilometres calculated as difference between the scheduled kilometres and effective kilometres are furnished in the table below§.
(In lakh Kms) Sl. No.
Particulars 2004-05 2005-06 2006-07 2007-08 2008-09
1. Scheduled kilometresµ 3,108.14 3,119.47 3,042.14 3,053.17 3,060.242. Effective kilometres 2,429.88 2,414.66 2,481.38 2,580.69 2,601.173. Kilometres cancelled 678.26 704.81 560.76 472.48 459.074. Percentage of cancellation 21.82 22.59 18.43 15.48 15.005. Contribution per Km (in Rs.) 2.20 2.09 3.74 5.18 5.706. Loss of contribution (3X5)
(Rs. in crore) 14.92 14.73 20.97 24.47 26.17
2.3.50 It can be seen from the above table that the percentage of cancellation of scheduled kilometres decreased from 21.82 per cent to 15.00 per cent during 2004-
05 to 2008-09 except marginal increase in 2005-06 and remained on the far higher side as compared to the best performers. The STUs have not made cause-wise analysis of the cancelled Kilometres and in the absence of the same, the STUs did not have any mechanism for exercising effective control on cancellation. Due to cancellation of the
scheduled kilometres, the STUs were deprived of contribution of Rs.101.26 crore during 2004-05 to 2008-09. Non-operation of buses during night hours 2.3.51 Being public utility, it is the responsibility of every STU to provide adequate transportation facility to the public during night hours. It was, however, observed that normal operational time of the Roadways buses remained from 5 AM to 11 PM during the period 2003-04 to 2005-06Ω. A review of the time table and other related records of three♣ Bus Depots revealed that operational hours of the Roadways buses remained from 4:30 AM to 6:20 PM (August 2009), whereas the operational hours of Haryana Roadways were from 3:50 AM to 10:30 PM and of PUNBUS were from 4:30 AM to 12:00 AM. Thus, the Roadways did not provide transportation to the public during night hours, besides foregoing the scope to earn more revenue. Maintenance of vehicles Preventive maintenance 2.3.52 Preventive maintenance is essential to keep the buses in good running condition and to reduce breakdowns/ other mechanical failures. The STUs had Tata
§ STU-wise details are given in Annexure 11. µ including hired buses. Ω As per Administration Reports. ♣ Ferozepur, Jagraon and Jalandhar.
Tamil Nadu (Salem), State Express Transport Corporation (Tamil Nadu) and Tamil Nadu (Villupuram) registered least cancellation of scheduled Kms at 0.45, 0.67 and 0.78 per cent respectively during 2006-07. (Source : STUs profile and performance 2006-07 by CIRT, Pune)
Due to cancellation of scheduled Kms, the STUs were deprived of contribution of Rs. 101.26 crore.
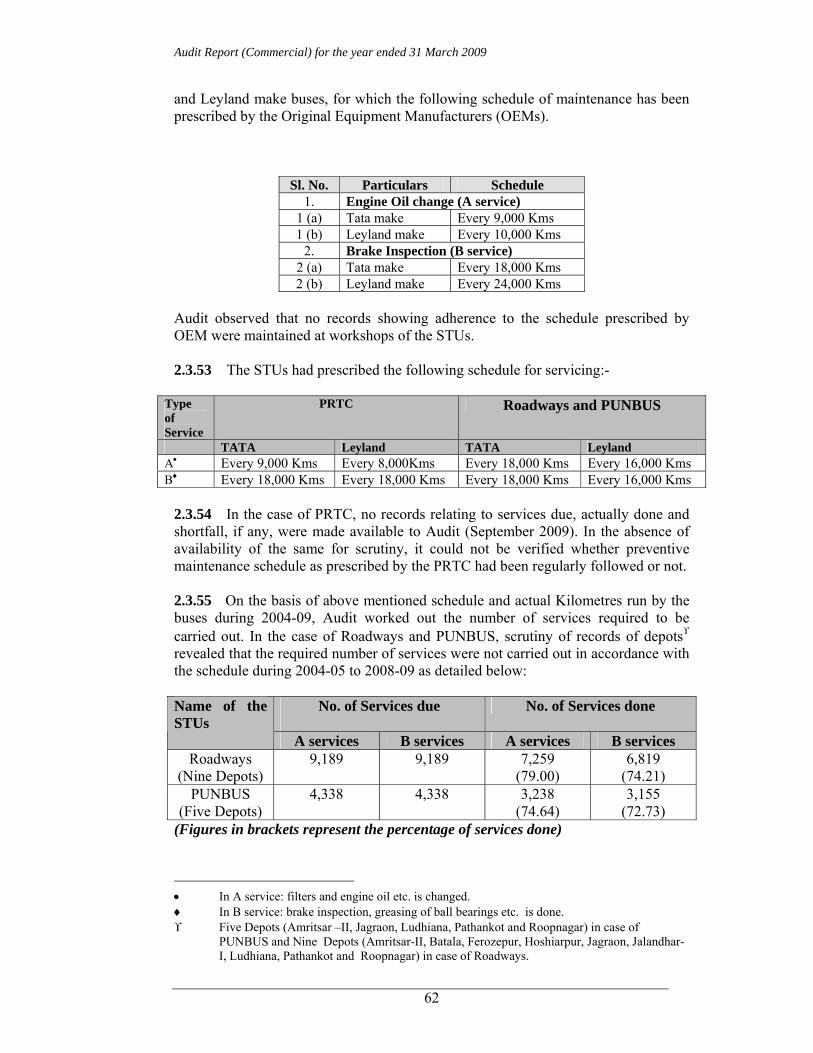
Audit Report (Commercial) for the year ended 31 March 2009
62
and Leyland make buses, for which the following schedule of maintenance has been prescribed by the Original Equipment Manufacturers (OEMs).
Sl. No. Particulars Schedule 1. Engine Oil change (A service)
1 (a) Tata make Every 9,000 Kms 1 (b) Leyland make Every 10,000 Kms
2. Brake Inspection (B service) 2 (a) Tata make Every 18,000 Kms 2 (b) Leyland make Every 24,000 Kms
Audit observed that no records showing adherence to the schedule prescribed by OEM were maintained at workshops of the STUs.
2.3.53 The STUs had prescribed the following schedule for servicing:-
Type of Service
PRTC Roadways and PUNBUS
TATA Leyland TATA Leyland A• Every 9,000 Kms Every 8,000Kms Every 18,000 Kms Every 16,000 Kms B♦ Every 18,000 Kms Every 18,000 Kms Every 18,000 Kms Every 16,000 Kms
2.3.54 In the case of PRTC, no records relating to services due, actually done and shortfall, if any, were made available to Audit (September 2009). In the absence of availability of the same for scrutiny, it could not be verified whether preventive maintenance schedule as prescribed by the PRTC had been regularly followed or not. 2.3.55 On the basis of above mentioned schedule and actual Kilometres run by the buses during 2004-09, Audit worked out the number of services required to be carried out. In the case of Roadways and PUNBUS, scrutiny of records of depotsϒ revealed that the required number of services were not carried out in accordance with the schedule during 2004-05 to 2008-09 as detailed below:
No. of Services due
No. of Services done Name of the STUs
A services B services A services B services Roadways
(Nine Depots) 9,189 9,189 7,259
(79.00) 6,819
(74.21) PUNBUS
(Five Depots) 4,338 4,338 3,238
(74.64) 3,155
(72.73) (Figures in brackets represent the percentage of services done)
• In A service: filters and engine oil etc. is changed. ♦ In B service: brake inspection, greasing of ball bearings etc. is done. ϒ Five Depots (Amritsar –II, Jagraon, Ludhiana, Pathankot and Roopnagar) in case of
PUNBUS and Nine Depots (Amritsar-II, Batala, Ferozepur, Hoshiarpur, Jagraon, Jalandhar-I, Ludhiana, Pathankot and Roopnagar) in case of Roadways.
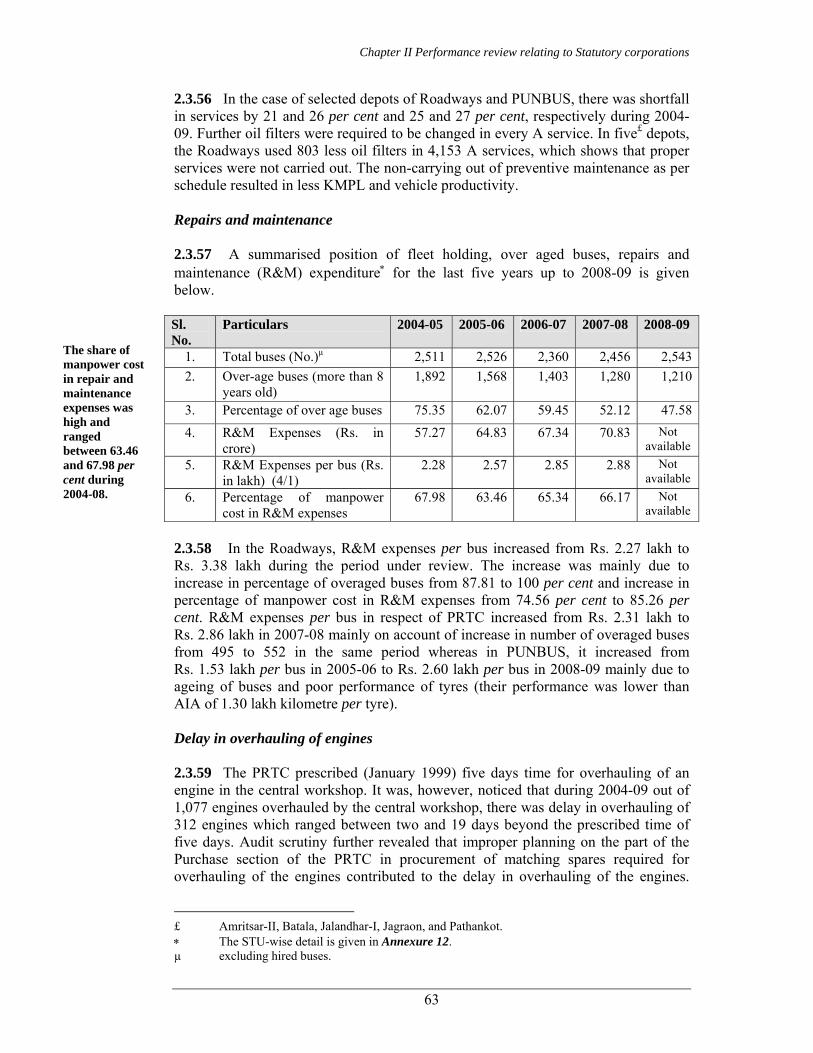
Chapter II Performance review relating to Statutory corporations
63
2.3.56 In the case of selected depots of Roadways and PUNBUS, there was shortfall in services by 21 and 26 per cent and 25 and 27 per cent, respectively during 2004-09. Further oil filters were required to be changed in every A service. In five£ depots, the Roadways used 803 less oil filters in 4,153 A services, which shows that proper services were not carried out. The non-carrying out of preventive maintenance as per schedule resulted in less KMPL and vehicle productivity. Repairs and maintenance 2.3.57 A summarised position of fleet holding, over aged buses, repairs and maintenance (R&M) expenditure∗ for the last five years up to 2008-09 is given below. Sl. No.
Particulars 2004-05 2005-06 2006-07 2007-08 2008-09
1. Total buses (No.)µ 2,511 2,526 2,360 2,456 2,5432. Over-age buses (more than 8
years old) 1,892 1,568 1,403 1,280 1,210
3. Percentage of over age buses 75.35 62.07 59.45 52.12 47.584. R&M Expenses (Rs. in
crore) 57.27 64.83 67.34 70.83 Not
available 5. R&M Expenses per bus (Rs.
in lakh) (4/1) 2.28 2.57 2.85 2.88 Not
available 6. Percentage of manpower
cost in R&M expenses 67.98 63.46 65.34 66.17 Not
available
2.3.58 In the Roadways, R&M expenses per bus increased from Rs. 2.27 lakh to Rs. 3.38 lakh during the period under review. The increase was mainly due to increase in percentage of overaged buses from 87.81 to 100 per cent and increase in percentage of manpower cost in R&M expenses from 74.56 per cent to 85.26 per cent. R&M expenses per bus in respect of PRTC increased from Rs. 2.31 lakh to Rs. 2.86 lakh in 2007-08 mainly on account of increase in number of overaged buses from 495 to 552 in the same period whereas in PUNBUS, it increased from Rs. 1.53 lakh per bus in 2005-06 to Rs. 2.60 lakh per bus in 2008-09 mainly due to ageing of buses and poor performance of tyres (their performance was lower than AIA of 1.30 lakh kilometre per tyre). Delay in overhauling of engines 2.3.59 The PRTC prescribed (January 1999) five days time for overhauling of an engine in the central workshop. It was, however, noticed that during 2004-09 out of 1,077 engines overhauled by the central workshop, there was delay in overhauling of 312 engines which ranged between two and 19 days beyond the prescribed time of five days. Audit scrutiny further revealed that improper planning on the part of the Purchase section of the PRTC in procurement of matching spares required for overhauling of the engines contributed to the delay in overhauling of the engines.
£ Amritsar-II, Batala, Jalandhar-I, Jagraon, and Pathankot. ∗ The STU-wise detail is given in Annexure 12. µ excluding hired buses.
The share of manpower cost in repair and maintenance expenses was high and ranged between 63.46 and 67.98 per cent during 2004-08.
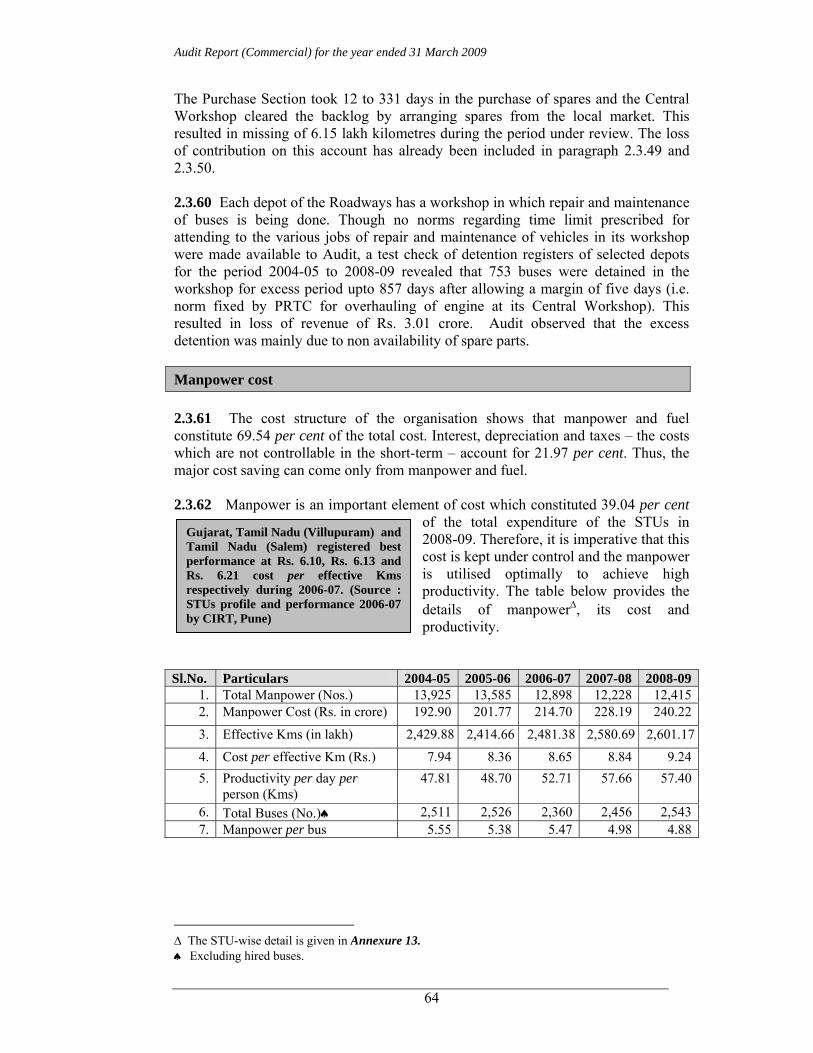
Audit Report (Commercial) for the year ended 31 March 2009
64
The Purchase Section took 12 to 331 days in the purchase of spares and the Central Workshop cleared the backlog by arranging spares from the local market. This resulted in missing of 6.15 lakh kilometres during the period under review. The loss of contribution on this account has already been included in paragraph 2.3.49 and 2.3.50. 2.3.60 Each depot of the Roadways has a workshop in which repair and maintenance of buses is being done. Though no norms regarding time limit prescribed for attending to the various jobs of repair and maintenance of vehicles in its workshop were made available to Audit, a test check of detention registers of selected depots for the period 2004-05 to 2008-09 revealed that 753 buses were detained in the workshop for excess period upto 857 days after allowing a margin of five days (i.e. norm fixed by PRTC for overhauling of engine at its Central Workshop). This resulted in loss of revenue of Rs. 3.01 crore. Audit observed that the excess detention was mainly due to non availability of spare parts. Manpower cost 2.3.61 The cost structure of the organisation shows that manpower and fuel constitute 69.54 per cent of the total cost. Interest, depreciation and taxes – the costs which are not controllable in the short-term – account for 21.97 per cent. Thus, the major cost saving can come only from manpower and fuel. 2.3.62 Manpower is an important element of cost which constituted 39.04 per cent
of the total expenditure of the STUs in 2008-09. Therefore, it is imperative that this cost is kept under control and the manpower is utilised optimally to achieve high productivity. The table below provides the details of manpower∆, its cost and productivity.
Sl.No. Particulars 2004-05 2005-06 2006-07 2007-08 2008-09
1. Total Manpower (Nos.) 13,925 13,585 12,898 12,228 12,4152. Manpower Cost (Rs. in crore) 192.90 201.77 214.70 228.19 240.22
3. Effective Kms (in lakh) 2,429.88 2,414.66 2,481.38 2,580.69 2,601.174. Cost per effective Km (Rs.) 7.94 8.36 8.65 8.84 9.245. Productivity per day per
person (Kms) 47.81 48.70 52.71 57.66 57.40
6. Total Buses (No.)♠ 2,511 2,526 2,360 2,456 2,5437. Manpower per bus 5.55 5.38 5.47 4.98 4.88
∆ The STU-wise detail is given in Annexure 13. ♠ Excluding hired buses.
Gujarat, Tamil Nadu (Villupuram) and Tamil Nadu (Salem) registered best performance at Rs. 6.10, Rs. 6.13 and Rs. 6.21 cost per effective Kms respectively during 2006-07. (Source : STUs profile and performance 2006-07 by CIRT, Pune)

Chapter II Performance review relating to Statutory corporations
65
2.3.63 The above table shows that manpower cost per effective Km of the STUs increased from Rs. 7.94 (2004-05) to Rs. 9.24 (2008-09). The manpower cost per effective Km was highest in the case of Roadways, which increased from Rs. 9.73 (2004-05) to as high as Rs. 33.37 (2008-09). The reasons for extra ordinary increase in manpower cost per effective Km was
reduction in effective Kms from 1,290.18 lakh to 264.47 lakh due to substantial reduction in fleet from 1,591 (2004-05) to 717 (2008-09) and decrease in vehicle productivity from 206 Kms (2004-05) to 105 Kms (2008-09). In the case of PUNBUS, manpower cost per effective Km increased during 2005-07 due to deployment of high cost manpower of the Roadways for running the operations of the PUNBUS, but it decreased during 2007-08 and 2008-09 due to outsourcing of operational staff through private contractors. To curtail the manpower cost, PRTC has started outsourcing the operating and other staff since February 2004 and as on March 2009 it had 1,735 outsourced employees, which constituted 37 per cent of its total employees. 2.3.64 The manpower productivity of the Roadways decreased from 38.08 Kms (2004-05) to 20.91 Kms (2008-09) and it was much less than the AIA of 48.92 Kms to 51.97 Kms (2004-05 to 2006-07). In respect of Roadways, Audit worked out that the low manpower productivity with reference to AIA of manpower productivity resulted in excess manpower cost of Rs. 194.83 crore during 2004-09. High cost coupled with poor effective Kms led to overall low productivity. Further, manpower per bus of the Roadways reduced from 5.82 (2004-05) to 4.82 (2008-09) and of the PUNBUS increased from 3.42 (2005-06) to 4.80 (2008-09) due to allocation of manpower/crew staff to PUNBUS from the Roadways. 2.3.65 In case of all the three STUs, the normal duty hours prescribed for operating crew is eight hours including steering duty. Test check revealed that the actual duty hours of the operating crew exceeded their normal duty hours and the STUs had to make overtime payment which worked out to Rs.1.96 crore in case of selected Depots of Roadways, Rs. 24.79 crore and Rs.16.96 crore in PRTC and PUNBUS, respectively during the period under review. Fuel cost 2.3.66 Fuel is another major cost element which constituted 30.50 per cent of the total expenditure in 2008-09. Control of fuel costs by a road transport undertaking has a direct bearing on its productivity. The following table gives the targets fixed by the STUs for fuel consumption, actual consumption, mileage obtained per litre (Kilometre per litre i.e. KMPL), AIA and estimated extra expenditure.
In the Roadways, low manpower productivity resulted in excess manpower cost of Rs. 194.83 crore.
North West Karnataka State Road Transport, Karnataka State Road Transport and Himachal Pradesh registered best performance at 4.89, 4.99 and 4.94 manpower per bus. (Source : STUs profile and performance 2006-07 by CIRT, Pune )
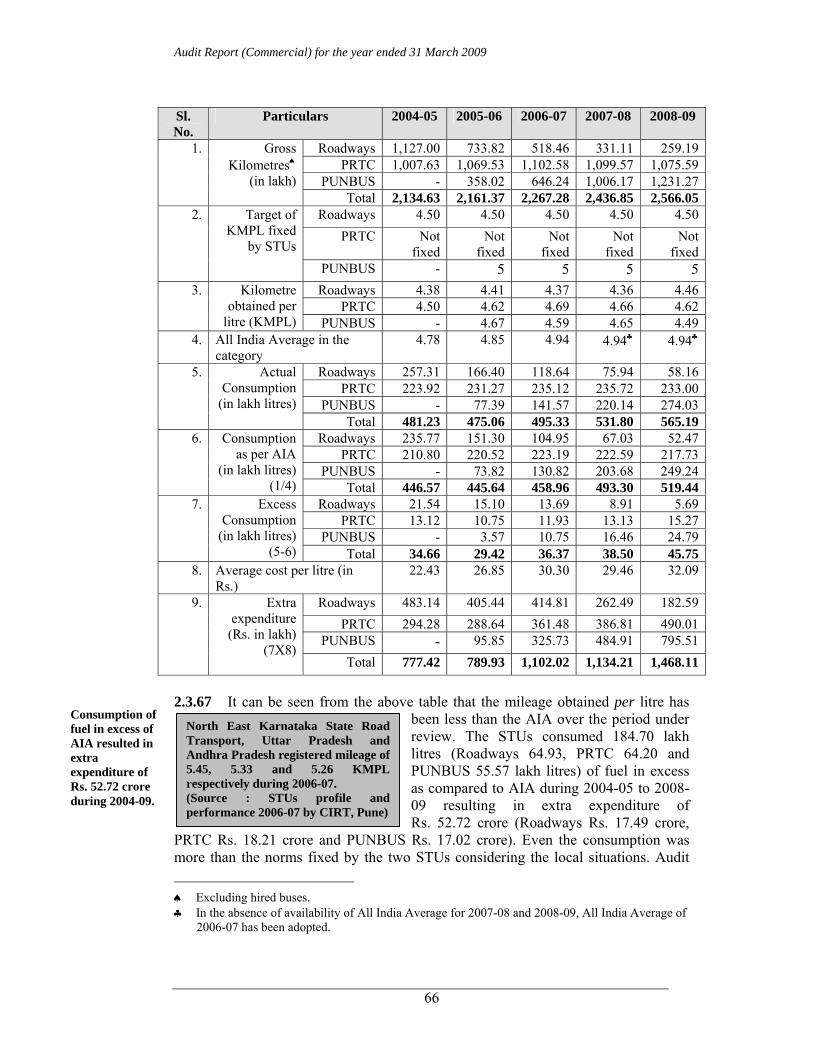
Audit Report (Commercial) for the year ended 31 March 2009
66
Sl. No.
Particulars 2004-05 2005-06 2006-07 2007-08 2008-09
Roadways 1,127.00 733.82 518.46 331.11 259.19PRTC 1,007.63 1,069.53 1,102.58 1,099.57 1,075.59
PUNBUS - 358.02 646.24 1,006.17 1,231.27
1. Gross Kilometres♠
(in lakh) Total 2,134.63 2,161.37 2,267.28 2,436.85 2,566.05
Roadways 4.50 4.50 4.50 4.50 4.50PRTC Not
fixedNot
fixedNot
fixedNot
fixed Not
fixed
2. Target of KMPL fixed
by STUs PUNBUS - 5 5 5 5Roadways 4.38 4.41 4.37 4.36 4.46
PRTC 4.50 4.62 4.69 4.66 4.623. Kilometre
obtained per litre (KMPL) PUNBUS - 4.67 4.59 4.65 4.49
4. All India Average in the category
4.78 4.85 4.94 4.94♣ 4.94♣
Roadways 257.31 166.40 118.64 75.94 58.16PRTC 223.92 231.27 235.12 235.72 233.00
PUNBUS - 77.39 141.57 220.14 274.03
5. Actual Consumption
(in lakh litres) Total 481.23 475.06 495.33 531.80 565.19
Roadways 235.77 151.30 104.95 67.03 52.47PRTC 210.80 220.52 223.19 222.59 217.73
PUNBUS - 73.82 130.82 203.68 249.24
6. Consumption as per AIA
(in lakh litres) (1/4) Total 446.57 445.64 458.96 493.30 519.44
Roadways 21.54 15.10 13.69 8.91 5.69PRTC 13.12 10.75 11.93 13.13 15.27
PUNBUS - 3.57 10.75 16.46 24.79
7. Excess Consumption
(in lakh litres) (5-6) Total 34.66 29.42 36.37 38.50 45.75
8. Average cost per litre (in Rs.)
22.43 26.85 30.30 29.46 32.09
Roadways 483.14 405.44 414.81 262.49 182.59PRTC 294.28 288.64 361.48 386.81 490.01
PUNBUS - 95.85 325.73 484.91 795.51
9. Extra expenditure
(Rs. in lakh) (7X8)
Total 777.42 789.93 1,102.02 1,134.21 1,468.11
2.3.67 It can be seen from the above table that the mileage obtained per litre has
been less than the AIA over the period under review. The STUs consumed 184.70 lakh litres (Roadways 64.93, PRTC 64.20 and PUNBUS 55.57 lakh litres) of fuel in excess as compared to AIA during 2004-05 to 2008-09 resulting in extra expenditure of Rs. 52.72 crore (Roadways Rs. 17.49 crore,
PRTC Rs. 18.21 crore and PUNBUS Rs. 17.02 crore). Even the consumption was more than the norms fixed by the two STUs considering the local situations. Audit ♠ Excluding hired buses. ♣ In the absence of availability of All India Average for 2007-08 and 2008-09, All India Average of
2006-07 has been adopted.
North East Karnataka State Road Transport, Uttar Pradesh and Andhra Pradesh registered mileage of 5.45, 5.33 and 5.26 KMPL respectively during 2006-07. (Source : STUs profile and performance 2006-07 by CIRT, Pune)
Consumption of fuel in excess of AIA resulted in extra expenditure of Rs. 52.72 crore during 2004-09.
Chapter II Performance review relating to Statutory corporations
67
further observed that in the Roadways, kilometres run were not being recorded/ accounted on the basis of meter reading of buses but on estimate basis.
2.3.68 A test check in audit of two months Petrol, Oil and Lubricants (POL) statements for each year under review, showed that in case of PRTC, proper procedure was being followed and remedial action taken by effecting token recovery from the concerned driver to improve KMPL. The depotsϒof Roadways and PUNBUS compiled vehicle wise and driver wise data for consumption of fuel. However, the same had not been used so as to exercise effective management control. Further, the two STUs had not prescribed any ideal driving speed/ norms so as to enhance fuel economy. Cost effectiveness of hired buses 2.3.69 The PRTC and Roadways started hiring private buses on Kilometre payment basis (Km Scheme) from November 1999 and August 2000, respectively. Agreements with the private bus owners were initially entered into for a period of three years under Km scheme in both the cases. The owners of these buses were required to provide buses with drivers and to incur all expenditure for running of the buses. The STUs were to provide conductors and make payment as per the actual Kilometres operated by the hired buses. During 2004-05 to 2008-09, the Roadways earned a net profit of Rs. 6.95 crore from the operation of 121 to 2 hired buses while the PRTC earned a net profit of Rs. 10.53 crore from the operation of 101 to 33 hired buses during 2004-05 to 2008-09 as shown in the following table:
ϒ Five Depots (Amritsar-II, Hoshiarpur, Jalandhar-I, Ludhiana and Roopnagar) in case of
Roadways and two depots (Jagraon and Pathankot) in case of PUNBUS.
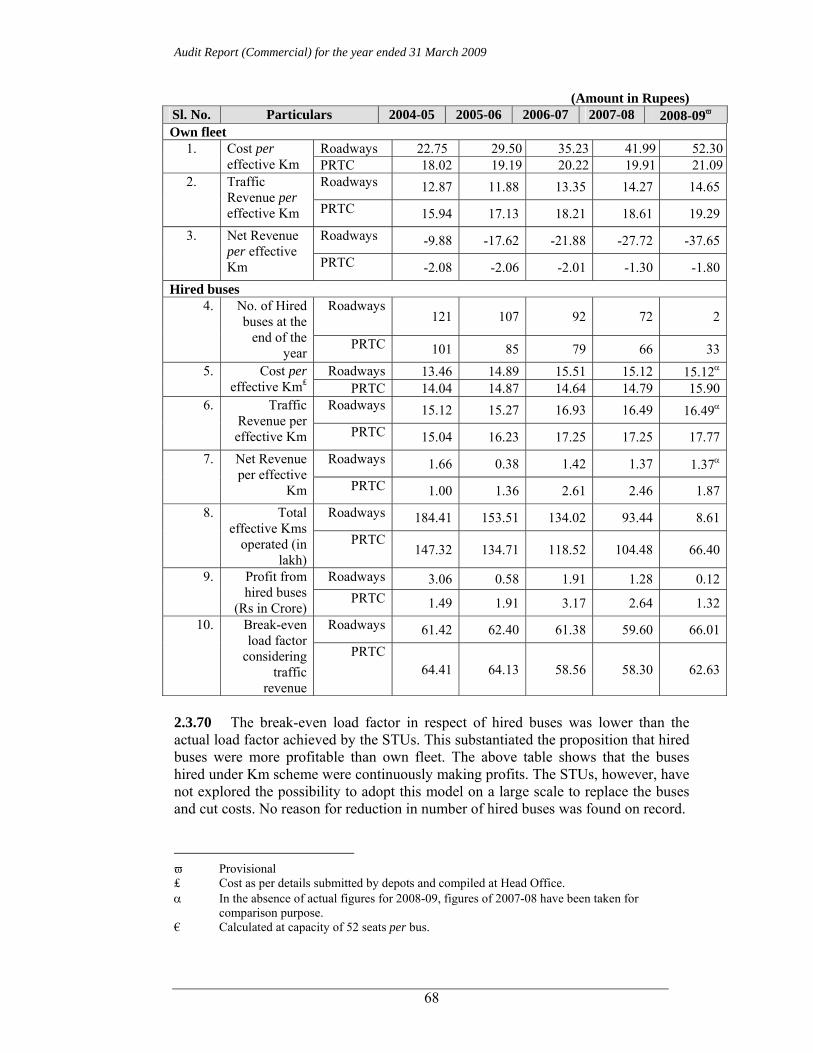
Audit Report (Commercial) for the year ended 31 March 2009
68
(Amount in Rupees) Sl. No. Particulars 2004-05 2005-06 2006-07 2007-08 2008-09ϖ Own fleet
Roadways 22.75 29.50 35.23 41.99 52.301. Cost per effective Km PRTC 18.02 19.19 20.22 19.91 21.09
Roadways 12.87 11.88 13.35 14.27 14.652. Traffic Revenue per effective Km PRTC 15.94 17.13 18.21 18.61 19.29
Roadways -9.88 -17.62 -21.88 -27.72 -37.653. Net Revenue per effective Km PRTC -2.08 -2.06 -2.01 -1.30 -1.80
Hired buses Roadways
121 107 92 72 24. No. of Hired
buses at the end of the
year PRTC 101 85 79 66 33
Roadways 13.46 14.89 15.51 15.12 15.12α5. Cost per effective Km₤ PRTC 14.04 14.87 14.64 14.79 15.90
Roadways 15.12 15.27 16.93 16.49 16.49α6. Traffic Revenue per effective Km PRTC 15.04 16.23 17.25 17.25 17.77
Roadways 1.66 0.38 1.42 1.37 1.37α7. Net Revenue per effective
Km PRTC 1.00 1.36 2.61 2.46 1.87Roadways 184.41 153.51 134.02 93.44 8.618. Total
effective Kms operated (in
lakh) PRTC
147.32 134.71 118.52 104.48 66.40
Roadways 3.06 0.58 1.91 1.28 0.129. Profit from hired buses
(Rs in Crore) PRTC 1.49 1.91 3.17 2.64 1.32
Roadways 61.42 62.40 61.38 59.60 66.0110. Break-even load factor
considering traffic
revenue
PRTC64.41 64.13 58.56 58.30 62.63
2.3.70 The break-even load factor in respect of hired buses was lower than the actual load factor achieved by the STUs. This substantiated the proposition that hired buses were more profitable than own fleet. The above table shows that the buses hired under Km scheme were continuously making profits. The STUs, however, have not explored the possibility to adopt this model on a large scale to replace the buses and cut costs. No reason for reduction in number of hired buses was found on record.
ϖ Provisional ₤ Cost as per details submitted by depots and compiled at Head Office. α In the absence of actual figures for 2008-09, figures of 2007-08 have been taken for
comparison purpose. € Calculated at capacity of 52 seats per bus.

Chapter II Performance review relating to Statutory corporations
69
Body building 2.3.71 PRTC has a body building unit having installed capacity of 240 buses per annum. The unit besides fabricating new buses also repair/ renovate the old bus bodies, on which Rs. 15.08 crore were spent during 2004-09. PUNBUS outsourced fabrication of buses to private contractors. The cost and efficiency of body building unit is compared against the private contractors in the table given below: Sl. No. Particulars 2004-05 2005-06 2006-07 2007-08 2008-09
PRTC 1 No. of buses (ordinary)
fabricated in house 92 97 18 71 76
2. Average Cost of fabrication per bus (Rs. in lakh)
2.73 2.91 3.74 3.80 4.30
3. No. of days taken to fabricate a bus
21 12 56 24 24
PUNBUS 4. No. of buses (ordinary)
fabricated through private contractors
- 360 208 230 56
5. Average Cost of fabrication per bus (Rs. in lakh)
- 3.57 5.78 5.81 5.81
6. No. of days taken to fabricate a bus
- 44 32 38 37
2.3.72 As the outsourcing of fabrication of buses from private parties is costly in case of PUNBUS, it may consider the option of fabricating its buses from the PRTC.
Financial management 2.3.73 Raising of funds for capital expenditure, i.e., for replacement/ addition of buses happens to be the major challenge in financial management of STUs affairs. This issue has been covered in paragraph 2.3.32. The section below deals with the STUs efficiency in raising claims and their recovery. This section also analyses whether an opportunity exists to realign the business model to generate more resources without compromising on service delivery. Claims and dues 2.3.74 The STUs give their buses on hire to Government departments at prescribed rates per kilometre basis. It was noticed during audit that the charges due were not promptly recovered from the departments/institutions. An amount of Rs. 3.19 croreα
α Chairman, Anandpur Sahib Foundation (Roadways-Rs. 81.11 lakh: PRTC-Rs. 35.70 lakh), Competent
Authority Maharaja Ranjit Singh Tajposhi celebration (Roadways-Rs. 50.01 lakh; PRTC-Rs. 29.06 lakh), opening ceremony of Shahpur Kandi Dam (Roadways-Rs. 28.87 lakh), Ranjit Sagar Dam (PRTC-Rs. 13.98 lakh), President Cricket Association Mohali (Roadways Rs. 24.96 lakh: PRTC-Rs.7.97 lakh) Bhagat Singh centenary celebration (PRTC-Rs. 45.28 lakh), Election duty ( PRTC-Rs. 2.44 lakh).

Audit Report (Commercial) for the year ended 31 March 2009
70
(Roadways-Rs. 1.85 crore and PRTC-Rs. 1.34 crore) was due as on 31 March 2009 from various Government departments/institutions out of which Rs. 2.39 crore (Roadways-Rs. 1.60 crore and PRTC-Rs. 0.79 crore) was pending for more than five years, which indicate ineffective follow up action. 2.3.75 The STUs provide free/ concessional passes to various categories of public like students, senior citizens, etc. The State Government reimburses at the prescribed rate for each category of pass holder. The number of passes issued under each category during 2004-05 to 2008-09, amount recoverable and the amount actually recovered in respect of PRTC are shown in the table below (there were no unrealisable claims in respect of the PUNBUS and Roadways as on 31 March 2009).
(Rupees in crore) Sl. No.
Particulars 2004-05 2005-06 2006-07 2007-08 2008-09
1. No. of student passes issued (in lakh)
0.83 0.95 1.10 1.17 0.89
2. No. of other passes issued NA NA NA NA NA 3. Amount recoverable for student
passes 14.13 18.02 20.93 29.85 34.01
4. Amount recoverable for other passes
10.94 12.79 12.35 13.00 10.98
5. Total amount recoverable from Government
25.07 30.81 33.28 42.85 44.99
6. Amount actually received 23.00 28.22 29.69 29.41 29.44 7. Unrealised claims** 2.07 2.59 3.59 13.44 15.55 2.3.76 It can be seen from the above table that unrealised claim from the Government in case of PRTC as on 31 December 2008 amounted to Rs. 15.55 crore. 2.3.77 An analysis in audit of the debts outstanding as a percentage of turnover and the percentage of outstanding debts for more than five years to the total debts for the five years ending March 2009 are depicted in the graph below.
2.58 3.78
1.46 1.23
18.23
8.80
23.13
18.07
3.008.41
5.872.10
0
5
10
15
20
25
2004
-05
2005
-06
2006
-07
2007
-08
2008
-09
Percentage of Debts outstanding for more than five years to the total debtsas on 31 March of each year (PRTC)Percentage of Debts to turnover as on 31 March of each year (PRTC)
Percentage of Debts to turnover as on 31 March of each year (PUNBUS)
2.3.78 From the above graphs, it can be seen that the percentage of outstanding dues to the turnover has increased from 3.00 in 2004-05 to 8.41 in 2007-08 and 1.46
** This includes unrealised claims of previous years.

Chapter II Performance review relating to Statutory corporations
71
in 2005-06 to 2.10 in 2008-09 in the case of the PRTC and the PUNBUS respectively. Realignment of business model 2.3.79 The STUs are mandated to provide an efficient, adequate and economical road transport to public. Therefore, the STUs cannot take an absolutely commercial view in running their operations. They have to cater to uneconomical routes to fulfil their mandate. They also have to keep the fares affordable. In such a situation, it is imperative for the STUs to tap the non-traffic revenue sources to cross-subsidize their operations. However, the share of non-traffic revenues (other than interest on investments) was nominal at 5.08 per cent of the total revenue during 2004-09. This revenue of Rs. 121.24 crore during 2004-09 mainly came from advertisements and restaurant/ shop rentals. Audit observed that the STUs had non-traffic revenue sources which they did not tap substantially. 2.3.80 Over a period of time, the PRTC and PUNBUS have come to acquire sites at prime locations in district and tehsil headquarters. The two STUs generally use the ground floor/ land for their operations, leaving an ample scope to construct and utilise spaces above. Audit observed that the STUs have land (mostly owned/ leased by Government) at important locations measuring 8.48 lakh square meters as shown below.
Particulars District
Hqrs. Tehsil Hqrs.
Total
PRTC 11 4 15 PUNBUS 11 8 19
Number of sites
Total 22 9 34 PRTC 3.54 0.62 4.16 PUNBUS 3.29 1.03 4.32
Occupied Land (in lakh Sq. mtrs.) Total 6.83 1.65 8.48
2.3.81 It is, thus, possible for the PRTC and PUNBUS to undertake projects on public private partnership (PPP) basis for construction of shopping complexes, malls, hotels, office spaces, etc. above (from first or second floor onwards) the existing sites so as to bring in a steady stream of revenues without any investment by it. Such projects can be executed without curtailing the existing area of operations of both the STUs. Such projects can yield substantial revenue for the PRTC and PUNBUS which can only increase year after year. 2.3.82 Audit observed that the PRTC has no clear title of land except at the head office at Patiala and Bus Stands at Bathinda, Ludhiana and Ahmedgarh. However, the Punjab Government has transferred (June 2008) 74,894 Sq.mtrs. of land to PRTC for setting up new bus stands on Design, Build, Operate and Transfer basis. The PRTC has signed (May 2009) an agreement with Spirit Global Construction Limited (Concessionaire) for the construction of a new bus stand at Patiala. As per the agreement, concessionaire would pay Rs. 27.00 crore as upfront money in two equal instalments and concession fees at the rate of five per cent of upfront money every year with annual increase of five per cent per year over the previous year’s annual concession fee. First instalment of upfront money of Rs. 13.50 crore was received in
The STUs did not have a policy in place to undertake large scale tapping of non-traffic revenue sources.
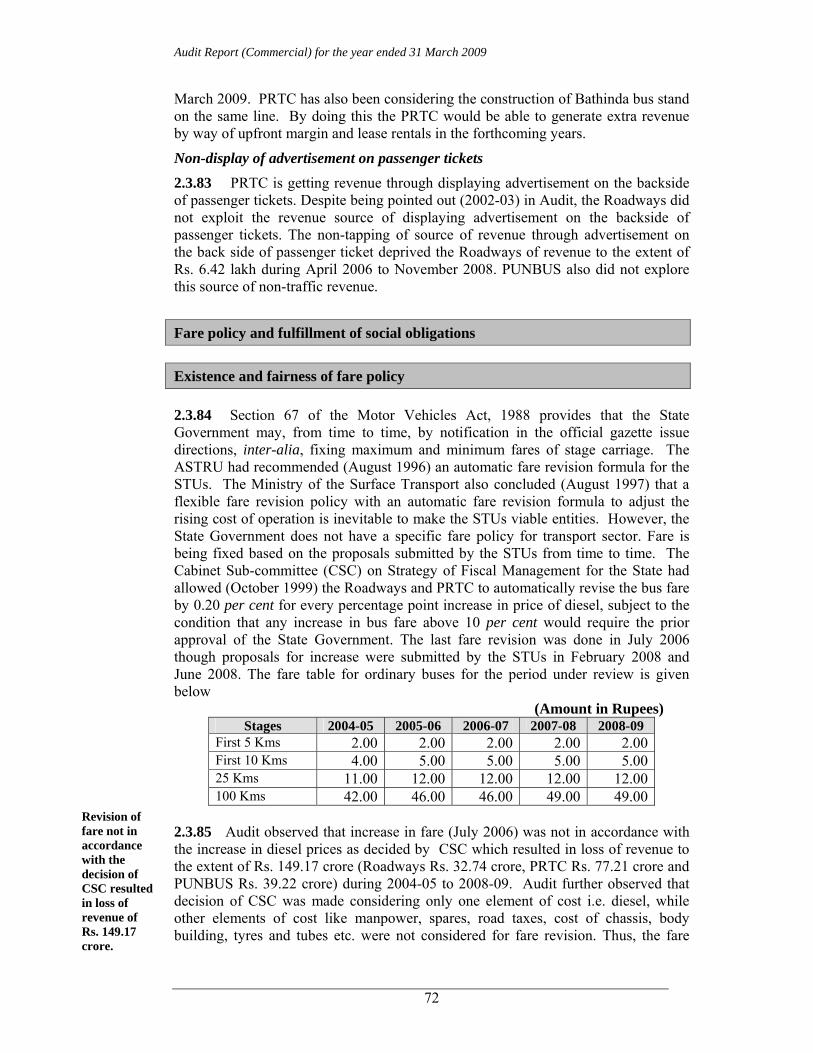
Audit Report (Commercial) for the year ended 31 March 2009
72
March 2009. PRTC has also been considering the construction of Bathinda bus stand on the same line. By doing this the PRTC would be able to generate extra revenue by way of upfront margin and lease rentals in the forthcoming years.
Non-display of advertisement on passenger tickets
2.3.83 PRTC is getting revenue through displaying advertisement on the backside of passenger tickets. Despite being pointed out (2002-03) in Audit, the Roadways did not exploit the revenue source of displaying advertisement on the backside of passenger tickets. The non-tapping of source of revenue through advertisement on the back side of passenger ticket deprived the Roadways of revenue to the extent of Rs. 6.42 lakh during April 2006 to November 2008. PUNBUS also did not explore this source of non-traffic revenue.
Fare policy and fulfillment of social obligations Existence and fairness of fare policy 2.3.84 Section 67 of the Motor Vehicles Act, 1988 provides that the State Government may, from time to time, by notification in the official gazette issue directions, inter-alia, fixing maximum and minimum fares of stage carriage. The ASTRU had recommended (August 1996) an automatic fare revision formula for the STUs. The Ministry of the Surface Transport also concluded (August 1997) that a flexible fare revision policy with an automatic fare revision formula to adjust the rising cost of operation is inevitable to make the STUs viable entities. However, the State Government does not have a specific fare policy for transport sector. Fare is being fixed based on the proposals submitted by the STUs from time to time. The Cabinet Sub-committee (CSC) on Strategy of Fiscal Management for the State had allowed (October 1999) the Roadways and PRTC to automatically revise the bus fare by 0.20 per cent for every percentage point increase in price of diesel, subject to the condition that any increase in bus fare above 10 per cent would require the prior approval of the State Government. The last fare revision was done in July 2006 though proposals for increase were submitted by the STUs in February 2008 and June 2008. The fare table for ordinary buses for the period under review is given below (Amount in Rupees)
Stages 2004-05 2005-06 2006-07 2007-08 2008-09 First 5 Kms 2.00 2.00 2.00 2.00 2.00 First 10 Kms 4.00 5.00 5.00 5.00 5.00 25 Kms 11.00 12.00 12.00 12.00 12.00 100 Kms 42.00 46.00 46.00 49.00 49.00
2.3.85 Audit observed that increase in fare (July 2006) was not in accordance with the increase in diesel prices as decided by CSC which resulted in loss of revenue to the extent of Rs. 149.17 crore (Roadways Rs. 32.74 crore, PRTC Rs. 77.21 crore and PUNBUS Rs. 39.22 crore) during 2004-05 to 2008-09. Audit further observed that decision of CSC was made considering only one element of cost i.e. diesel, while other elements of cost like manpower, spares, road taxes, cost of chassis, body building, tyres and tubes etc. were not considered for fare revision. Thus, the fare
Revision of fare not in accordance with the decision of CSC resulted in loss of revenue of Rs. 149.17 crore.

Chapter II Performance review relating to Statutory corporations
73
policy of the STUs has no scientific basis as it does not take into account the normative cost.
2.3.86 The table below shows how the STUs could have curtailed cost and increased revenue with better operational efficiency.
Sl. No. Particulars 2004-05 2005-06 2006-07 2007-08 2008-09 PRTC 17.61 19.10 19.70 19.82 20.771. Cost per Km
PUNBUS - 19.56 22.59 20.81 20.37PRTC 16.64 17.67 19.04 19.67 20.092. Revenue per
Km PUNBUS - 19.85 22.46 20.91 20.61PRTC
- - - - 0.19 3. Loss of
revenue due to less vehicle productivity
(per Km) PUNBUS
- - - - -
PRTC 0.26 0.24 0.30 0.33 0.43
4. Excess cost due to excess consumption
of fuel (per Km)
PUNBUS - 0.27 0.51 0.49 0.66
PRTC 16.64 17.67 19.04 19.67 20.28
5. Ideal revenue per Km (2+3)
PUNBUS - 19.85 22.46 20.91 20.61
PRTC 17.35 18.86 19.40 19.49 20.34 6. Ideal cost per Km (1-4)
PUNBUS - 19.29 22.08 20.32 19.71 PRTC (-)0.97 (-)1.43 (-)0.66 (-)0.15 (-)0.68 7. Net revenue
per Km (2-1) PUNBUS - 0.29 (-)0.13 0.10 0.24 PRTC
(-)0.71 (-)1.19 (-)0.36 0.18 (-)0.06 8. Net ideal
revenue per Km (5-6) PUNBUS - 0.56 0.38 0.59 0.90
PRTC 1,139.70 1,187.18 1,203.41 1,173.69 1,128.049. Effective Kms (in lakh)
PUNBUS - 353.04 634.92 989.66 1,208.66PRTC
2.96 2.85 3.61 3.87 6.99
PUNBUS - 0.95 3.24 4.85 7.98
10. Avoidable loss (Rs. in crore)
[(7-8) X 9] Total 2.96 3.80 6.85 8.72 14.97
2.3.87 The above table does not take into account other inefficiencies such as low fleet utilisation, excess tyre cost, defective route planning, etc. However, if the operations were properly planned and efficiently managed, the net loss could be lower by Rs. 37.30 crore. Thus, the case made by the STUs for increase in fare, included their inefficiencies and in a way would make the commuters pay more than what they should be actually paying. 2.3.88 In case of Roadways, considering 100 per cent overage fleet and substantial reduction in operations from 1,591 buses in 2004-05 to just 717 buses in 2008-09, the net ideal revenue per KM has not been worked out in Audit. 2.3.89 The above facts lead to conclude that it is necessary to regulate the fares on the basis of a normative cost and it would be desirable to have an independent
Audit Report (Commercial) for the year ended 31 March 2009
74
regulatory body (like State Electricity Regulatory Commission) to fix the fares, specify operations on uneconomical routes and address the grievances of commuters. Adequacy of services on uneconomical routes 2.3.90 The PRTC and PUNBUS did not carry out any exercise to identify profitable/unprofitable routes to ensure effective utilisation of the fleet as mentioned in Paragraph 2.3.44. The Roadways had about 15 per cent profit making routes as of March 2009 as mentioned in the paragraph 2.3.45. However, the position would change if the Roadways improves its efficiency. Nonetheless, there would still be some routes which would be uneconomical. Though the Roadways is required to cater to these routes, the Roadways has not formulated norms for providing services on uneconomical routes. In the absence of norms, the adequacy of services on uneconomical routes cannot be ascertained in audit. The Management has not taken effective steps to make the uneconomical routes viable by rationalizing time, frequency and extension or curtailment of routes. The operation of the uneconomical routes resulted in loss of Rs. 119.91 crore∂ during 2004-05 to 2007-08. Audit observed that despite persistent operating loss, the Management neither initiated any strategic approach to turnaround the operations to make these routes economical, nor approached the State Government for getting compensation for the loss suffered by operating on these uneconomical routes by way of subsidy etc., so that proper/adequate transportation facility continued to be provided to the public on these routes. Instead of making uneconomical routes viable, the Roadways had surrendered 216 routes having 46,863 scheduled Kms during 2005-07 as a result of which the commuters were deprived of the public transport facility. The desirability to have an independent regulatory body to specify the quantum of services on uneconomical routes, taking into account the specific needs of commuters, is further emphasised. Monitoring by top management MIS data and monitoring of service parameters 2.3.91 For an organisation like State Transport Undertaking to succeed in operating economically, efficiently and effectively, there has to be written norms of operations, service standards and targets. Further, there has to be a Management Information System (MIS) to report on achievement of targets and norms. The achievements need to be reviewed to address deficiencies and also to set targets for subsequent years. The targets should generally be such that the achievement of which would make an organization self-reliant. In the light of this, Audit reviewed the system obtaining in the STUs. The status in this regard is given below. 2.3.92 No STU set target for operational parameters except for fuel efficiency. Monthly meetings were taken by Executive Heads of the respective STUs. The physical and financial data in respect of various operational parameters, elements of cost and revenue were submitted on monthly basis by depots to Head Office. This ∂ As calculated by the Management.

Chapter II Performance review relating to Statutory corporations
75
was compiled for review and monitoring by top management in the monthly meetings. Minutes of the meetings were circulated to the departmental heads for further action and follow-up. 2.3.93 Audit observed the following deficiencies in MIS:
• The STUs did not set targets for important operational parameters i.e. fleet utilisation, vehicle productivity, staff productivity and load factor except fuel efficiency to improve performance through monitoring against targets;
• Data of regularity and punctuality of bus service was not being compiled/consolidated at depot level/head office to take remedial measures;
• Data of A and B services was not being compiled and consolidated at Head Office level for monitoring the level of preventive maintenance;
• The Head Office had not maintained data relating to number of routes, route kilometres and frequency of trips to work out the exact number of scheduled kilometres each year; and
• The proforma accounts of the Roadways were in arrears since 2000-01 due to non-monitoring by the top management.
2.3.94 The top management of the STUs is expected to demonstrate managerial capability to set realistic and progressive targets, address areas of weakness and take remedial action wherever the things are not moving on expected lines. However, such ability was not seen demonstrated either from records or performance of the STUs during the period under review. Conclusion Operational performance • The STUs did not keep pace with the growing demand for public
transport as their share declined from 48.12 per cent in 2004-05 to 39.46 per cent in 2008-09.
• The STUs could not recover the cost of operations in any of the five
years under review. This was mainly due to operational inefficiencies, weak financial management and inadequate/ ineffective monitoring by top management.
• The STUs were not running their operations efficiently as their
performance on important operational parameters like vehicle productivity, fuel utilization, load factor etc. was below the best performers.
• In the absence of availability of information from PRTC, Audit could
not analyse the impact of preventive maintenance on its operations. The other two STUs did not carry out the preventive maintenance as required in 23.40 per cent cases in Roadways and 26.31 per cent cases in PUNBUS, affecting the roadworthiness of their buses.
Audit Report (Commercial) for the year ended 31 March 2009
76
• The STUs did not ensure economy in operations as their manpower and fuel costs were higher than the AIA.
• The route planning in STUs were deficient as curtailment, extension and
change in frequency of operation of routes during peak hours was not done by the Management on the basis of profitability of routes. In Roadways, profit making routes declined from 23 to 15 per cent during 2004-09. PRTC and PUNBUS did not carry out any exercise to identify the profitable/unprofitable routes.
• The STUs did not increase their profitability by increasing hiring of
buses, which could otherwise have been a profitable venture. Financial management • The STUs did not demonstrate effective action in recovering of their
dues. • The STUs have potential to tap non-conventional sources of revenue but
they did not have a policy in place to undertake large scale tapping of such sources.
Fare policy and fulfilment of social obligations • Though the State has a fare policy, it is not based on scientific norms
and does not take into account the normative costs of STUs. • No policy yardstick has been laid down for operation on uneconomical
routes. Therefore, the adequacy of operations could not be ascertained in audit.
Monitoring by top management • The MIS system of STUs was not adequate and the monitoring by its top
management of key operational parameters and service standards was ineffective.
On the whole, there is scope to improve the performance of the STUs. Effective monitoring of key parameters, coupled with certain policy measures, can see improvement in performance. Recommendations Operational performance • The STUs may consider the option of hiring of buses to make up
shortage of fleet for providing adequate transport services.
Chapter II Performance review relating to Statutory corporations
77
• The STUs need to take steps to recover the cost of operations by further improving vehicle productivity, reducing cancellation of kilometres, doing rational route planning and controlling fuel consumption through effective monitoring.
• Preventive maintenance needs to be carried out as per the schedule so as
to increase the operational efficiency. Proper records should be kept and monitored at Head Office level.
• The STUs should explore the possibility of reducing the manpower cost
by conducting study for optimum utilization of manpower. • Considering the persistent and chronic losses, inefficiency in
performance and negligible share of the Roadways in public transport, Government may have to either make the Roadways viable by converting it as a corporation or transfer its operations to other transport undertakings in the State.
Financial management • The Roadways and PRTC should generate adequate resources through
their operations to facilitate replacement of the overaged buses. • The Government/STUs may tap the non-conventional sources of revenue
on a large scale by undertaking PPP projects, which will result in steady inflow of revenue without additional investment.
• The Roadways should take effective steps to clear the arrears in
accounts. Fare policy and fulfilment of social obligations • The Government may consider creating a regulator to regulate the fares
and services of the STUs. Monitoring by top management • The STUs should take effective steps for strengthening of the MIS and
make use of them for control of the activities. The matter was reported to the Managements of the STUs and the Government during July and August 2009; their replies were awaited (September 2009).