chapter ii agricultural subsidies in india – an...
TRANSCRIPT
CHAPTER II
AGRICULTURAL SUBSIDIES IN INDIA – AN OVERVIEW
2.1 INTRODUCTION
Agriculture plays an important role in the economic growth
of our country. Almost all the activities revolve round agriculture. It
provides employment to around 60 per cent of the total workforce in the
country (Swaminathan, 2009).1 Extremity in climate and variety of soil
condition have made possible the cultivation of every item. Introduction of
new high yielding varieties after the spread of Green Revolution in the late
sixties resulted in record of food grains production. For stimulating
agriculture production and attaining self-sufficiency the government
provides various incentives together with price supporting schemes.
Among the agriculture production incentives, subsidies are considered to
be the most powerful instruments for accelerating the growth of
agricultural production. Most of the subsidies provided are designed to
�������������������������������������������������������������
1 Swaminathan, M.S., (2009), “Drought Management for Rural Livelihood Security”, The Hindu,
August 17, p.7.

62
compensate the high cost of production and to stimulate the use of modern
inputs.
2.2 AGRICULTURAL SUBSIDIES IN INDIA
Major items of agricultural subsidies are food, fertilizer,
irrigation, power and credit. While food and fertilizer subsidies are borne
by the Centre, power and irrigation subsidies are borne by the respective
state government. Credit subsidies are given through the banking system.
Food subsidy is the difference between the price at which the Food
Corporation of India (FCI) procures from farmers and sells through the
Public Distribution System (PDS). The food subsidy in India was Rs.12060
crores in 2000-01 and it increased to Rs.56002 crores in 2009-10.2
For fertilizer inputs, subsidy is the difference between the
price paid to fertilizer manufacturers and price received from the farmers.
For other inputs, it is the difference between economic cost of input and
issue price to the farmers, which is paid by the government. Credit subsidy
is applicable for short term loans provided for production purpose for a
period of one year. It is the difference between cost of credit and the actual
interest paid by the farmers. Credit subsidy includes interest subvention
and interest subsidy. In the case of Nationalised Banks interest subvention
is only applicable and it is provided by the Government of India through
�������������������������������������������������������������2 Government of India, (2010), Union Budget 2009-2010, Expenditure Budget, Vol.1, p.15.

63
the RBI. For the Co-operative Banks both the interest subvention and the
interest subsidy is applicable and it is given through the NABARD.
To augment the agricultural production, in addition to the
above the Government of India is providing some other subsidies to the
farmers, through the Farmers’ Co-operative Societies in the form of seeds,
development of oil seeds, pulses, cotton, rice, maize, crop insurance
schemes and price support schemes. The total agricultural subsidies for the
past ten years from 2000-01 to 2009-10 and the agricultural subsidies per
hectare of GCA in India is presented in Table 2.1.
TABLE 2.1
AGRICULTURAL SUBSIDIES IN PER HECTARE OF GROSS
CROPPED AREA IN INDIA
Year Total Agricultural
Subsidies (in crores)
GCA in India
(million ha)
Subsidy per
hectare (in Rs.)
(1) (2) (3) (4)
2000-01 50440 185.34 2658
2001-02 56747 188.29 3062
2002-03 59679 175.58 3399
2003-04 66625 190.08* 3506
2004-05 75635 191.55* 3948
2005-06 82967 193.05* 4297
2006-07 91737 193.23* 4748
2007-08 119036 195.83* 6078
2008-09 204668 195.83* 10451
2009-10 108982 195.83* 5565
Source: (2) Central Statistical Organisation, New Delhi.
(3) Agricultural Statistics at a glance – 2010
(4) As per calculation
Note: 2009-10 includes only fertilizer and food subsidy * Provisional
2008-09 and 2009-10 GCA pertains to 2007-08

64
It is noted from Table 2.1 that the total agricultural subsidies
include fertilizer, irrigation, other subsidies and electricity. During 2000-01
the total subsidies in Indian agriculture accounted for Rs.50440 crores and
Rs.108982 crores in 2009-10. The amount of subsidy is increasing at a
considerably higher rate year after year. The increase in total subsidy may
be due to the increase in the consumption of fertilizers, increase in the use
of electricity for irrigation purpose and easy availability of credit at a
subsidized rate. The subsidy amount per hectare of GCA was Rs.2658
during 2000-01 and it was Rs.10,451 per hectare during 2008-09.
2.2.1 Fertilizer Subsidy in India
Fertilizer plays a major role in increasing agricultural
production and productivity. The fertilizer prices both at producer and farm
level are determined by the government in most of the countries and such
government interventions generally have the basic objectives (i) to provide
fertilizers to farmers at stable and affordable prices in order to encourage
higher consumption of fertilizer and to increase agricultural production
thereby and (ii) to encourage domestic production. To make fertilizers
available to farmers at affordable prices and ensuring adequate returns on
investments to the entrepreneurs, the Government of India introduced the
Retention Price-cum-Subsidy Scheme (RPS), a cost-plus approach, for
nitrogenous fertilizers in November 1977 and extends to complex

65
fertilizers in February 1979. The RPS scheme also aimed at assuring a
reasonable return on investment and to attract further investment in the
fertilizer sector.
Under RPS, the difference between the retention price
(normative cost of production of the urea is determined by the government
plus 12 per cent post tax return on net worth) and the notified sale price
minus the distribution margin is paid as subsidy to the individual
manufacturing units. A freight subsidy is also paid to the individual units to
cover the cost of transportation of fertilizers from the production points to
the consumption centres. Since there is a uniform issue price both for
indigenous and imported controlled fertilizers, the difference between the
delivery cost of imported fertilizer and the issue price (reduced by
distribution margin) is borne by the government as subsidy.3
Introduction of high yielding variety of seeds in mid-sixties
and pragmatic policies adopted in mid-seventies and eighties led to the
growth in consumption of fertilizers and agricultural production over the
years. However, decontrol of complex fertilizers such as Di-Ammonium
Phosphate (DAP) and Muriate of Potash (MoP) in August 1992 decelerate
the growth in consumption. The government extended a flat rate
concession on these fertilizers. But urea imports continue to be restricted
and canalized. Based on the recommendations of various committees, a
�������������������������������������������������������������3 Government of India, Economic Survey 2000-2001, p.162.

66
New Pricing Scheme (NPS) for urea units was implemented in a phased
manner from April 2003 with an objective to bring transparency,
uniformity and efficiency and thereby reduce cost of production.
From 1st April,2010 the Government of India fixed subsidy
on the fertilizer nutrients ‘N’-Nitrogen, ‘P’-Phosphorous, ‘K’-Potash and
‘S’-Sulphur contents present in the fertilizer which is known as Nutrient
Based Fertilizer Subsidy (NBS). The NBS regime is applicable to
Di Ammonium Phosphate, Mono Ammonium Phosphate, Triple Super
Phosphate and 12 grades of complex fertilizers and Ammonium Sulphate.
Under the NBS scheme, the subsidy on the nutrients shall remain fixed, the
selling price of fertilizers at farm gate level will be decontrolled and
determined by market forces and the retail price of the subsidized fertilizer
will be decided by the companies. NBS would promote balanced use of
plant nutrients and thereby reduce the demand and increase agricultural
production.
While considering the fertilizer subsidy, government is
providing subsidy both for the indigenous and imported fertilizers. A
sizeable portion is allotted to this in the budget. Table 2.2 presents the
details of expenditure met by the government in order to subsidize
fertilizers during the period 2000-01 to 2009-10.

67
TABLE 2.2
DETAILS OF EXPENDITURE ON SUBSIDY/CONCESSION
DURING THE YEAR 2000-01 TO 2009-10
(in crores)
Period
Amount of Concession Disbursed on
Decontrolled Fertilizers
(Indigenous + Imported)
Amount of Subsidy Disbursed on
Urea Total for
all
Fertilizers Indigenous
P & K
Imported
P & K Total
Indigenous
Urea
Imported
Urea
Total
Urea
2000-01 3595.00 724.00 4319 9480 1.00 9481 13800.00
2001-02 3759.52 744.00 4503.52 8044.00 147.50 8191.50 12695.02
2002-03 2487.94 736.8 3324.52 7790.00 1.16 7791.16 11015.68
2003-04 2606.00 720.00 3326.00 8521.00 0.82 8521.82 11847.82
2004-05 3977.00 1165.18 5142.18 10243.15 742.37 10985.52 16127.70
2005-06 4499.20 2096.99 6596.19 10652.57 2140.37 12793.45 19389.64
2006-07 6648.17 3649.95 10298.12 12650.37 5071.06 17721.43 28019.55
2007-08 10333.80 6600.00 16933.80 16450.37 9934.99 26385.36 43319.16
2008-09 32957.10 32597.69 65554.79 20968.74 12971.18 33939.92 99494.71
2009-10 16000.00 23452.06 39452.06 17580.25 6999.98 24580.23 64032.29
Source: Central Statistical Organisation, National Account Statistics,
Government of India (2010).
It is noted from Table 2.1 that the amount of subsidy
disbursed during the year 2000-01 was Rs.9481 crores and it was
Rs.24580.23 crores for the year 2009-10.The amount of subsidy provided
for domestic (indigenous) production is more than that of imported
fertilizer except the year 2009-10.
2.2.2 Consumption of Fertilizers
While considering the consumption of fertilizers there is a lot
of variation from state to state. The consumption pattern of fertilizers has
direct relevance to output pattern of crops i.e. states consuming more
nutrients is producing more grains. States like Punjab, Haryana,

68
Tamilnadu, Andhra Pradesh and Uttar Pradesh have higher consumption,
while states like Assam, Madhya Pradesh and Rajasthan have very low
consumption. Even though such states are consuming very low volume of
fertilizers, India is not self-sufficient in fertilizer production and about 30
per cent of the need is met by imports. Even after subsiding fertilizers to a
very great extent, the consumption of certain states are very low, if there
was no subsidy at all, the consumption pattern of fertilizer would have
been still very low.4 Table 2.3 exhibits the data regarding the fertilizer
consumption per hectare of GCA in India for the years 1991-92 and
2001-02.
TABLE 2.3
FERTILIZER CONSUMPTION PER HECTARE OF
GCA (KG) IN INDIA
Farm Size 1991-92 2001-02
Marginal (Below 1 hectare) 72.2 126.2
Small (1-2 Hectare) 65.5 100.6
Semi-medium (2-4 hectare) 61.7 88.8
Medium (4-10 hectare) 56.3 75.8
Large (Above 10 hectare) 46 55.9
Overall 60.7 92.6
Source: All India Report on Input Survey, Ministry of Agriculture,
Government of India (2007-08).
It is clear from Table 2.3 that the fertilizer consumption per
hectare of gross cropped area by size of holding reveals that the fertilizer
�������������������������������������������������������������4 Badi, R.V., and Badi, N.V., (2002), Rural Marketing, Himalaya Publishing House, p.225.

69
use was significantly higher in the case of marginal and small farmers
when compared to large farmers. During the year 1991-92 the average
consumption was higher on marginal farmers, than the small and the lowest
on large farmers which was recorded as 46 kg. Smaller the farm size,
higher the fertilizer consumption. Similar trend was established in the year
2001-02 also.
Those states whose consumption is more than one percent to
the total consumption of fertilizer is considered and is presented in
Table 2.4 for the year 2008-09.
TABLE 2.4
STATE-WISE CONSUMPTION OF CHEMICAL FERTILIZERS
Sl.
No. State
Total
Consumption
NPK
(in ‘000 tonnes)
%
Share
Consumption
per hectare
(in kgs)
Fertilizer
Subsidy per
ha (in Rs.)
Rank
1. Andhra Pradesh 3.070.88 12.32 239.71 9732.22 1
2. Bihar 1,37.02 5.44 178.98 7266.59 5
3. Gujarat 1,716.98 6.89 140.71 5712.42 9
4. Haryana 1,289.17 5.17 201.62 8184. 96 4
5. Karnataka 1,831.83 7.35 147.28 5979.57 8
6. Kerala 260.91 1.05 89.41 3630.05 11
7. Madhya Pradesh 1,423.40 5.71 70.77 2874.00 13
8. Chattisgarh 462.82 1.88 80.74 3278.04 12
9. Maharashtra 2.566.11 10.3 113.69 4615.81 10
10. Orissa 534.87 2.15 61.64 2502.58 14
11. Punjab 1,767.56 7.09 221.42 8989.65 2
12. Rajasthan 1,052.02 4.22 48.85 1983.31 15
13. Tamilnadu 1,265.22 5.08 216.54 8791.52 3
14. Uttar Pradesh 4,032.76 16.18 156.31 6346.19 7
15. West Bengal 1,519.31 6.09 157.69 6402.21 6
16. Others 730.54 2.93 64.26 2608.96
Source: Statistical Abstract, AP – 2010, Directorate of Economics and
Statistics, Hyderabad.

70
From the Table 2.4 it is clear that there is large variation in
the shares of states in total fertilizers consumption and this is because of
the variation in total cropped area among states. Therefore, it would be
appropriate to examine inter-state equity in terms of average consumption
per hectare of cropped area. That is, larger the fertilizer consumption per
hectare greater would be the fertilizer subsidy enjoyed. As per the table,
Andhra Pradesh, Punjab, Tamilnadu, Haryana, Bihar, West Bengal and
Uttar Pradesh are the main beneficiaries of fertilizer subsidy on per hectare
basis. The fertilizer consumption per hectare is significantly higher than the
average in those states. States like Chattisgarh, Madhya Pradesh, Orissa
and Rajasthan had less than the average subsidy. The state Andhra Pradesh
ranks first in fertilizer consumption per hectare as well as fertilizer subsidy
and it was more than four times when compared with the state Rajasthan
(Rs.1983).
2.2.3 Availability and Amount of Fertilizer Subsidy
Out of the total amount of subsidies, agricultural subsidies
contribute the major portion and that too fertilizer subsidy. In order to
achieve self-sufficiency in fertilizer production, subsidies are being
provided and it is observed that India has to import fertilizer from other
countries to meet its demand. The rate of fertilizer subsidy for domestic
production as well as import is given in Table 2.5 from the year 2000-01 to
2009-10.

71
TABLE 2.5
AVAILABILITY AND AMOUNT OF SUBSIDIES ON
FERTILIZERS IN INDIA (2001-2010)
Year
Availability of
Fertilizer ('000 tonnes)
(1)
Fertilizer Subsidy
(Rs. crores)
(2)
Rate of Fertilizers subsidy
(Rs. per tonne)
(3)
Dom
esti
c
Pro
du
ctio
n
Imp
ort
s
Tota
l
Dom
esti
c
Pro
du
ctio
n
Imp
ort
s
Tota
l
Dom
esti
c
Pro
du
ctio
n
Imp
ort
s
Tota
l
2000-01 14704 2091 16795 13075 725 13800 8892 3467.24 8216.73
2001-02 14628 2399 17027 11803.52 8991.5 12695.02 8069.13 3716.13 7455.82
2002-03 14474 1674 16148 10277.94 737.74 11015.68 7100.97 4407.05 6821.70
2003-04 14266 2018 16284 11127 720.82 11847.82 7799.66 371.95 7275.74
2004-05 15405 2750 18155 14220.15 1907.55 16127.7 9230.87 6936.55 8883.34
2005-06 15575 5253 20828 15151.57 4237.87 19389.44 9728.13 8067.52 9309.31
2006-07 16095 6080 22175 19298.54 8721.01 28019.55 11990.39 14343.77 126.35.65
2007-08 14707 7583 22290 26784.17 16534.99 43319.16 18211.85 21805.34 19434.35
2008-09 14334 10151 24485 53925.84 45568.87 99494.71 37620.93 44891.02 40634.96
2009-10 16320 8123 24443 33580.25 30452.04 64032.29 20576.13 37488.66 26196.58
Source: (1) and (2) Government of India, (3) as per calculation.
It is clear from Table 2.5 that the total availability of
fertilizer, that is, both the domestic production and imported fertilizer
shows an increasing trend except for two years, 2002-03 and 2009-10. The
availability of domestic fertilizer from 2001-02 was showing a declining
trend. Only after 2005, it shows an increasing trend and in 2009-10 it
reaches 16,320 thousand tonnes. It is inferred that in 2000-01 the subsidy
paid for imports was Rs.725 crores and in 2009-10 the subsidy amount
raised to Rs.30,452.04 crores.

72
2.2.4 Credit Subsidy
Credit is the most important input that controls the growth of
agricultural production. Till the end of 1966, credit for agriculture was
considered to be synonymous with co-operative credit. Only after the
nationalization of Commercial Banks in 1969 and establishment of RRB’s
in 1975 these banks entered in the field of agricultural financing. The most
important development in the field of agricultural credit is the setting up of
the National Bank for Agricultural and Rural Development (NABARD) in
July 1982. It is guiding all the major agencies operating in the rural credit
market namely the Commercial Banks, the Regional Rural Bank and the
Co-operative Credit Institution.
The present agricultural credit system in the country has
already a functional bias, that Co-operative Credit Society’s extent only
short term and medium term loans. Commercial and Regional Rural Banks
extended all types of agricultural credit-short, medium and long term. The
Reserve Bank of India directly or indirectly subsidies these agencies to
make them more effective.
According to the Rural Credit Survey Committee, loans are
classified under three heads depending on the duration of the loans.
Short term or seasonal credit is one which provides farmers
with the working capital to run their farms efficiently, to obtain the crop in
73
the best possible circumstances and to hold credit until the harvest can be
sold. The period of credit of this type does not exceed 15 months.
Medium term credit is one which provides capital to farmers
to purchase live-stock and farm machinery and also to carry out
improvement of an average duration e.g. the conversion of the system of
cultivation. These credits are for a period longer than fifteen months, but
not more than 5 years.
Long-term credit is one which offers farmers the means
required for purchasing holdings or to effect permanent improvement e.g.
drainage, construction of wells, embankments and the erection of live-
stock sheds, stock houses and other farm buildings, litigation and
repayment of old debts. The period of sub debts varies from country and
place to place.5
Credit system in rural India can be classified as institution
credit sources and non-institution sources. Institution credit sources include
Co-operatives, Commercial Bank and RRB’s. The Non-institution sources
comprises of professional money lender, commission agents, friends and
relatives. The flow of institutional credit to agriculture sector from
2000-2001 to 2009-10 is given in Table 2.6.
�������������������������������������������������������������5 Banarjee, P.K., (1985), Indian Agricultural Economy: Financing Small Farmers, Chetana
Publication, New Delhi, pp.83-84.
74
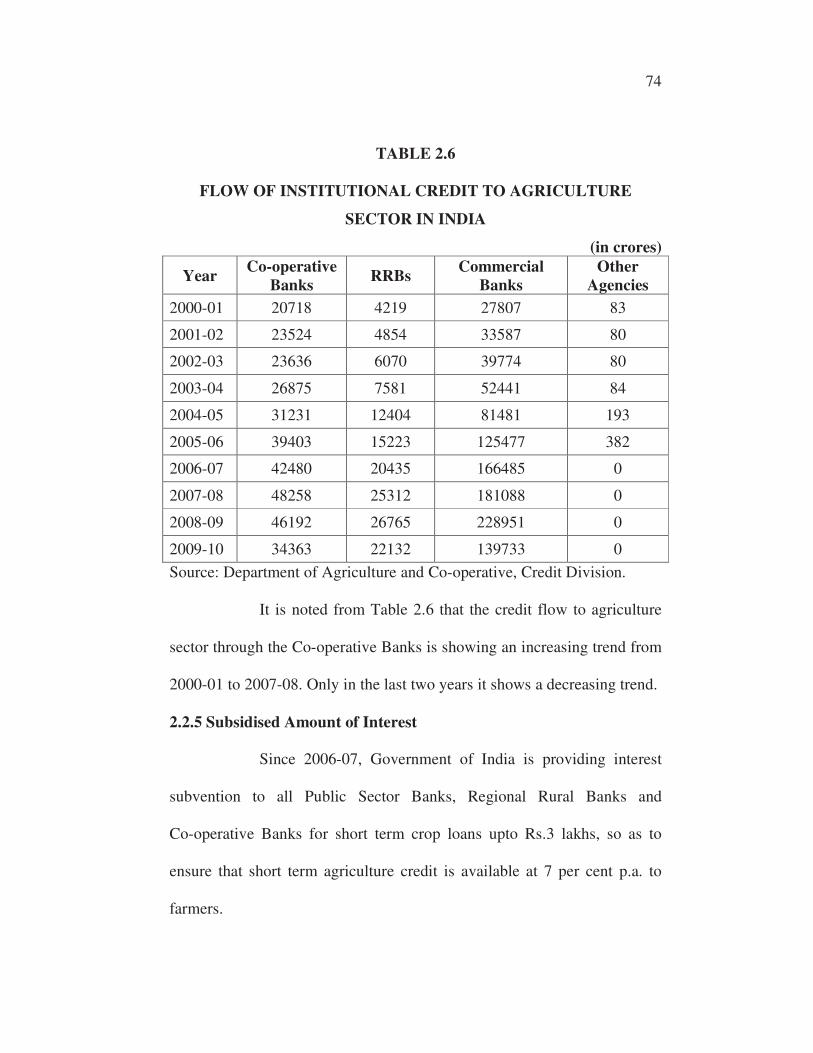
TABLE 2.6
FLOW OF INSTITUTIONAL CREDIT TO AGRICULTURE
SECTOR IN INDIA
(in crores)
Year Co-operative
Banks RRBs
Commercial
Banks
Other
Agencies
2000-01 20718 4219 27807 83
2001-02 23524 4854 33587 80
2002-03 23636 6070 39774 80
2003-04 26875 7581 52441 84
2004-05 31231 12404 81481 193
2005-06 39403 15223 125477 382
2006-07 42480 20435 166485 0
2007-08 48258 25312 181088 0
2008-09 46192 26765 228951 0
2009-10 34363 22132 139733 0
Source: Department of Agriculture and Co-operative, Credit Division.
It is noted from Table 2.6 that the credit flow to agriculture
sector through the Co-operative Banks is showing an increasing trend from
2000-01 to 2007-08. Only in the last two years it shows a decreasing trend.
2.2.5 Subsidised Amount of Interest
Since 2006-07, Government of India is providing interest
subvention to all Public Sector Banks, Regional Rural Banks and
Co-operative Banks for short term crop loans upto Rs.3 lakhs, so as to
ensure that short term agriculture credit is available at 7 per cent p.a. to
farmers.

75
From the year 2010-11, an additional 2 per cent interest
subvention is being provided to those farmers, who repay their short term
crop loans in time under this scheme. Thus, the short term crop credit is
available to farmers at the rate of 5 per cent per annum in 2010-11. The
government has also proposed to further incentivize the farmers who make
prompt repayment by providing a further incentive of 3 per cent additional
interest subvention for the year 2011-12. That is, loans will be available to
farmers who pay in time at the rate of 4 per cent per annum. Thereby the
interest rate recommended by the National Commission for Farmers has
been decided to implement. Table 2.7 shows the details of interest
subvention provided by the government.
TABLE 2.7
SUBSIDY ON AGRICULTURE CREDIT IN INDIA
Year Interest Subsidy
(in crores)
2005-06 1701.00
2006-07 2534.13
2007-08 1737.26
2008-09 640.00
2009-10 2011.00
Source: Government of India, Union Budget, various issues
It is clear from Table 2.7 that in the year 2006-07, the
government has provided Rs.1100 crores as interest subvention for
providing short term credit to farmers and Rs.1359.13 crores as waiver of

76
interest on overdue loans in debt stressed states. Then in the year 2007-08,
an additional amount of Rs.1737.26 crores was provided and in 2009-10,
Rs.2011 crores was allotted. The agricultural credit subsidy includes
interest subsidy and interest subvention.
2.3 AGRICULTURAL SUBSIDIES IN TAMILNADU
Though the four subsidies namely fertilizer, power, irrigation
and credit have direct or indirect implications on the state exchequer, this
strategy has been followed to augment the production of agricultural
commodities by assuring remunerative prices to the farmers and at the
same time provide food grains to the consumers at reasonable prices. The
fertilizer subsidies are borne by the central government and power
subsidies at the state government. In addition to this indirect subsidies, the
Tamilnadu state government through the Agriculture Department
concerned, provide direct subsidies on different items such as seeds,
sprinkler set, micro-nutrients, pesticides, tractors, spray pumps and many
other implements. In this chapter an attempt has been made to analyze the
growth and distribution of direct and indirect subsidies provided to the
farmers of Tamilnadu state. The indirect subsidies analyzed are restricted
to three major inputs namely, fertilizer, power and credit.
Direct Subsidies
The Tamilnadu State Government, through the Department
of Agriculture provides subsidies directly to the farmers in order to achieve

77
higher productivity. The state government individually and together with
the central government provides various facilities and subsidies through
various schemes such as ISOPOM (Integrated Scheme for Oilseeds Pulses
Oilpalm and Maize), ICDP (Integrated Cereals Development Programme)
and NFSM (National Food Security Mission). Subsidies directly paid to the
farmers on different items such as seeds, micro nutrients, pesticides,
tractor, gypsum, and spray pumps are discussed in the following
paragraphs.
Seeds
Seed, which is the carrier of new technology for crop
production and higher crop yields, is a critical input for sustained growth of
agriculture. In India, more than four-fifths of the farmers rely on farm-
saved seed leading to a low seed-replacement rate.6 The Department of
Agriculture in Tamilnadu provides improved varieties of seed under
various programmes such as Intensive Cereal Development Programme,
Seed-Village Programme and National Pulses Development Programme.
Under these schemes, seeds of paddy, oilseeds, cotton and pulses are
provided to the farmers in packing ranging from 0.5 kg to 15 kg. In
addition to the state agencies, the private sector also plays a significant role
in production and distributing of seed, after the introduction of the Seed
Policy of 1988 particularly for food crops and cereals. The Department of
�������������������������������������������������������������6 Government of India, Economic Survey, 2006-07, p.174.
78
Agriculture provides subsidy on seeds at differential rates for different
period. For the period 2009-10, the rate of subsidy on seeds of paddy was
Rs.300 per quintal.
Sprinkler Sets
To encourage the participation of farmers in irrigation
purpose the government of Tamilnadu provides subsidy on sprinkler sets. It
is most useful for those districts where irrigation facilities are limited.
Under the state scheme for sprinkler irrigation, government grants Rs.7500
and Rs.12500 per set to general category of farmers. Under the Intensive
Cotton Development Programme (ICDP), government provides 50 per cent
of cost to SC/ST, small, marginal and women farmers limited to Rs.15,000
per hectare and to the general category of farmers 33 per cent of cost
limiting to Rs.10,000 per hectare.
Gypsum
Gypsum is a mineral chalk like substance used as a fertilizer
to reclaim the saline and alkaline lands and converts them into cultivable
pieces. The rate of subsidy on gypsum was 50 per cent of the cost incurred
for the reclamation of saline and alkaline land as per the soil test results.
The rate of subsidy on zinc sulphate was also 50 per cent of the cost
incurred. Since most of the land do not require any reclamation this scheme
was not utilized by the beneficiaries in the study area.

79
Implements
The government of Tamilnadu is sanctioning various
proposals of Tamilnadu Agricultural University for implementation of
Agricultural Mechanization in Tamilnadu. Distribution and Introduction of
agricultural machinery is carried through incentives by the Agriculture
Department. Subsidies is provided on agricultural implements like Mini
Combined Harvester, Shredder, Maize Husker and Chisel Plough. On
these items government grants 50 per cent of the cost as subsidy. In order
to popularize agricultural mechanization through conventional equipments
like Power Tiller, Rotovator, Cultivator, Disc Plough, government grants
subsidy.
Tractor
To promote mechanization in agriculture, the government of
Tamilnadu offers subsidy to the farmers. The subsidy on tractor to the
general category was 30 per cent of the cost or Rs.30,000 whichever was
less. A special subsidy was provided to small tractors.
Bio-Fertilizers
In order to promote a balanced use of NPK fertilizers in
addition to organic, green manure, compost and bio-fertilizers were added
with emphasis on the use of micro nutrients in almost all the regions where
intensive cultivation is practiced. Azospirillum is being distributed to the
farmers under the state schemes and central and state shared schemes such

80
as ISOPOM and ICDP. The subsidy on bio-fertilizers such as
Azospirillum, Rhizobium and Phospho bacterium was Rs.6 per 200gm
packets.
2.3.1 Pattern of Direct Subsidies to Farmers in Tamilnadu
The pattern of direct subsidies on various components
available to the farmers in Tamilnadu during 2009-10 has been furnished in
Table 2.8. These are available to the farmers during the respective year
based on the decisions of Government of India and State Government at
the same level or with some modifications.

81
TABLE 2.8
DIRECT SUBSIDIES ON VARIOUS COMPONENTS TO THE
FARMERS IN TAMILNADU (2009-2010)
Sl.
No Subsidy schemes Rate of subsidy
1. Green manure seed distribution 25 % subsidy
2. Reclamation of Saline and Alkaline lands as per soil test results
For Gypsum 50 % subsidy
Zinc Sulphate 50% subsidy
3. Minikit of Rice 90 % subsidy
4. Integrated farming in coconut holding for productivity improvement
(Coconut Development Scheme)
a) Cut and removal of snile and
diseased tree
Rs. 250 per tree
b) Laying of Demonstration Rs.17500/ha/year
c) Establishment of organic
manure unit
One number(Rs.20000)
5. Integrated Cereals Development Programme Rice.
a) Hybrid Rice demonstrations Rs.1000/acre
b) Distribution of Bio-fertilizer 25 % subsidy
c) Distribution of Micro-nutrient
Mixture
25 % subsidy
d) IPM Demonstrations Rs.6000 Demonstration
e) System of Rice Intensification
Demonstrations
Rs.2000/acre
f) Subsidy on paddy seed Rs.2 Per Kg
6. Intensive Cotton Development Programme
a) Certified seed distribution 50% of the cost limited to Rs.1000/Qtl
b) Supply of breeder seed Full cost on reimbursement basis
c) Field Demonstrations Rs.2500/ha.
�
Contd…

82
Sl.
No Subsidy schemes Rate of subsidy
d) Distribution of Sprinkler 50% if cost to SC/ST, Small,
Marginal and Women farmer limited
to Rs.15000/ha and 33% of cost to
other farmers limiting to Rs.1000/ha
d) Pheromone trap distribution 50% of the cost limited to Rs.500/ha
e) Supply of Bio-agents 50% of the cost limited to Rs.300/ha
f) Supply of sprayers and dusters 50% of the cost limited to
Rs.700(Manually operated) 50% of
the cost limited to Rs.1500(Power
operator)
7. Oil Seed Production Programme
a) Distribution of RC Packet Rs.50/ha
b) IPM Demonstration Rs.1500/ha
c) PP Equipment Rs.420/equipment
d) Distribution of Gypsum Rs.350/ha
e) Distribution of MN Mixture Rs.138/ha
8. Sugarcane Development Scheme
a) Release of parasite Rs.10/ha
9. National Pulses Development Project
a) Breeder seed procurement
subsidy
100% subsidy
b) Foundation seed production
subsidy
Rs.500/Qtl
c) Certified seed procurement
subsidy
Rs.500/Qtl
d) Compact Block demonstration Rs.15000/10ha
e) IPM Demonstration Rs.1500/ha
f) Distribution of RC Packet Rs.200/ha
g) PP equipment distribution 50% of cost or Rs.800/ equipment
(hand operator) 50% of cost or
Rs.2000/ equipment (power operator)
h) Distribution of Gypsum 50% of cost of chemical + Transport
changes limited to Rs.500/ha
Contd…

83
Sl.
No Subsidy schemes Rate of subsidy
10. Oil Palm Development Project
a) Distribution of seedling 50% of the cost of the seed
b) Cultivation Maintenance Rs.7490 in three installments
Other Services Installation of drip irrigation
11. Supply of coconut seedlings
Tall Rs.12/ seedling
Tall × Dwarf Rs.20/ seedling
12. Bio-fertilizer
a) Azospirillum Rs.6/200gm packets
b) Rhizobium Rs.6/200gm packets
c) Phospho bacterium Rs.6/200gm packets
Source: Agriculture Department, Government of Tamilnadu
Indirect Subsidies
After discussing in detail the various direct subsidy provided
to farmers by the Tamilnadu Agricultural Department to enhance
agricultural production in the state, the indirect subsidies have been
analyzed for the state Tamilnadu and Kanyakumari district. The indirect
subsidies analyzed are restricted to three major subsidies namely power,
fertilizer and credit. The reason for not considering irrigation subsidy is
due to its low impact as reported by the Tamilnadu Agricultural
Development and World Bank. The study conducted by the Tamilnadu
Agricultural Development revealed that majority of the rural households in
Tamilnadu do not benefit directly from canal irrigation subsidies and only
7 per cent of rural households (15 per cent of households cultivating crops)

84
enjoys these implicit subsidies.7 Moreover, the World Bank has stated that
the distribution of canal irrigation subsidies among households that use
canal irrigation is less regressive than in other major Indian states (World
Bank, 2003a).
2.3.2 Fertilizer Subsidy in Tamilnadu
Since data on state-wise fertilizer subsidies is not available,
an indirect method was used to compute state level subsidies. The rate of
subsidies for NPK per tonne at All-India level is multiplied with the
fertilizer consumption in the state in order to arrive at the fertilizer subsidy.
Table 2.9 shows the details regarding fertilizer subsidy for the state of
Tamilnadu.
TABLE 2.9
FERTILIZER SUBSIDY IN TAMILNADU
Year Fertilizer Consumption (L.M.T) Fertilizer Subsidy
(in crores) N P K Total
2000-01 5.47 2.08 2.08 9.63 791.27
2001-02 5.05 2.05 2.28 9.38 699.36
2002-03 4.20 1.51 1.72 7.43 506.85
2003-04 3.78 1.59 1.76 7.13 518.76
2004-05 4.83 2.11 2.8 9.52 845.69
2005-06 5.59 2.6 2.84 10.99 1022.43
2006-07 5.86 2.69 2.70 11.25 1421.51
2007-08 5.43 2.28 3.04 10.76 2091.14
2008-09 6.47 2.55 3.63 12.65 5140.32
2009-10 6.32 2.54 3.72 13.11 3434.27
Source: Agrostat, 2010.
�������������������������������������������������������������7 Tamilnadu Agricultural Development, Executive Summary 2001-02, p.30.

85
It was noted from Table 2.9, that the consumption of
fertilizer in terms of nutrients (NPK) in Tamilnadu has increased from 9.63
lakh metric tonnes in 2000-01 to 13.11 lakh metric tonnes in 2009-10.
Subsidy given by central government is calculated as Rs.791.27 crores
during 2000-01 and an amount of Rs.3434.27 crores during 2009-10 under
fertilizer subsidy.
2.3.3 Fertilizer Subsidy in Kanyakumari District
Chemical fertilizer, one of the major inputs, play a vital role
in crop production in Kanyakumari District. The dosage of fertilizer to be
applied to each crop is recommended to the farmers based on soil test. In
the absence of soil test result the blanket recommendations are made to
each crop by the Agriculture Department officials. Table 2.10 shows the
details regarding the fertilizer consumption and subsidy in the district.
TABLE 2.10
FERTILIZER SUBSIDY IN KANYAKUMARI DISTRICT
Year Fertilizer Consumption (L.M.T) Fertilizer Subsidy
Total (in crores) N P K Total
2000-01 0.07 0.03 0.04 0.14 11.50
2001-02 0.06 0.04 0.04 0.14 10.43
2002-03 0.06 0.02 0.04 0.12 8.18
2003-04 0.05 0.03 0.04 0.12 8.73
2004-05 0.06 0.03 0.06 0.15 13.32
2005-06 0.07 0.05 0.07 0.19 17.68
2006-07 0.06 0.02 0.04 0.12 15.16
2007-08 0.04 0.02 0.03 0.09 17.49
2008-09 0.05 0.03 0.04 0.12 48.76
2009-10 0.06 0.02 0.04 0.12 31.43
Source: Statistical Hand Book of Tamilnadu, Department of Economics
and Statistics, Chennai.
86
From the Table 2.10 it is noted that the consumption of
fertilizers in Kanyakumari District recorded 0.14 lakh metric tonnes in
2000-01 and 2001-02. During the subsequent years there is decelaration in
the growth of consumption of fertilizers except 2004-05 and 2005-06. The
consumption of fertilizer was reasonably good in the year 2005-06 and
again there is decline in growth rate. The entire decade continued with
slow growth rate.
2.3.4 Electricity Subsidy
Electricity is one of the major inputs in agricultural activities
and which inturn has a direct impact on the process of economic
development. As stated earlier, power subsidy is provided by the concerned
state government as electricity fall within their domain. Generally the
electricity consumed by agricultural sector is unmetered and it is
consequently difficult to know the actual energy consumption by the
agricultural sector. Moreover agricultural consumption of power is broadly
estimated on residual basis, that is, after deducting the metered
consumption of other sectors from the total supplied. As such there is the
possibility of adding units of leakage or transmission loss (line loss) and
theft. As far as the question of actual beneficiaries for power subsidies is
concerned, it is necessary to note the farmers who are benefitted more and
the water-intensive crops which account for a significant portion of the
subsidies.

87
2.3.5 Agricultural Power Tariffs
Electricity is provided to the farming community at a
subsidized rate by the SEB’s on the direction of the state government. The
Tamilnadu government introduced free supply of electricity to marginal
farmer in the state from 1984-85 and to small farmers from 1.8.99.8 In
addition to Tamilnadu, the state of Punjab was also providing free power to
the farmers from 2000-01. Some of the other states were using only a pure
flat rate system irrespective of the capacity of pump sets.
The Electricity Act, 2003 enacted by the central government
had a provision for mandatory metering of supply of electricity and put
pressure on states to meter agriculture consumers’. The TNEB had started
metering new agriculture connections since July 1, 2003. The TN
Electricity Regulatory Commission (TNERC) notified its first tariff order,
reducing the cross-subsidy on electricity with the introduction of an
agricultural tariff. After 12 years of free supply of power to farmers, the
new tariff order has introduced a flat rate for unmetered connection of
Rs.250/HP per annum and a charge of Rs.0.20/kwh for metered
connections.9 The reintroduction of agriculture power tariff became a
highly contentious issue in Tamilnadu during the national election. The
�������������������������������������������������������������8 Government of Tamilnadu, Economic Appraisal 2005-2006, p.43.
9 Tamilnadu Agricultural Development, Executive Summary, 2001-2002, p.29.

88
Table 2.11 shows the tariff system of electricity prevailing in the state
Tamilnadu.
TABLE 2.11
TARIFF SYSTEM OF ELECTRICITY IN TAMILNADU
(rate in paise per kwh)
Small farmers Other farmers
With effect from 1-5-79 13.84 15.84
15-9-84 Free Rs.75/hp
1-4-90 Free Rs.50* Rs.75
*
1-4-91 onwards Free Free
16-3-03 Free 20 paise/kwh
Source: Narayana Moorthy, A., “Electric Pumpsets and Ground water
Management: Macro and Micro Evidence”, The Asian Economic
Review, The Journal of the Indian Institute of Economics, April,
1995, p.96.
Note: *Rs.50/hp/annum up to 10 hp and Rs.75/hp for > 10h
From the Table 2.11 it is noted that the input power is
provided to the small farmers at free rate. The Tamilnadu Electricity
Regulatory Commission (TNERC) in its tariff order stated that during
2009-10, the subsidy received from the government was Rs.263 crores as
against Rs.5828 crores. This is the reason for the poor financial health of
the TNEB.
2.3.6 Energy Consumption in Tamilnadu
Electricity subsidy is not paid to the individual directly. The
government directs the concerned SEB’s to supply electricity at a lower
rate than that of generation, transmission and distribution. The loss

89
incurred due to the lower rate realised that is, the difference is paid as
subsidy by the respective government to the SEB’s. Most of the researchers
in their study defined power subsidy per unit as the difference between the
unit cost of power supplied to the state and the average tariff charged from
farmers. Gulati and Narayanan have estimated that the average revenue-
tariff from power supply to agricultural consumer in 2000-01 was only
28.42 paise per kwh whereas the estimated average cost of supply of power
to all sector combined was as high as 303.86 paise per kwh. This implies a
subsidy of 275.44 paise on every Kilowatt-hour supplied to agriculture.
They have estimated that in 2000-01, SEB’s were recovering from
agriculture only 9.35 percent of the average unit cost of power supply. In
2009-10 the average cost of supplying power by the TNEB to the farmers
was 489 paise per kwh and the cost of realization was only 20 paise per
unit. SEB was recovering only 4.17 per cent cost of the average unit cost of
power supply. The actual amount of tariff subsidy paid by the government
of Tamilnadu on behalf of the farmers is shown in Table 2.12.

90
TABLE 2.12
POWER SUPPLY IN TAMILNADU
Year
Power
sold
(in M.U)
Power
consumed
by Agri.
Sector
(in M.U)
Per unit
cost of
supply
(paise/kwh)
Per unit
realization
from
Agriculture
Sector
Amount
of subsidy
(in crores)
2000-01 33,418 9,181 285 16 250
2001-02 35,202 9,495 305 18 322.50
2002-03 36,347 9,030 318 22 250.00
2003-04 38,697 9,588 325 22 139.86
2004-05 41,200 9,764 337 22 200.85
2005-06 44,592 9,804 352 24 201.18
2006-07 50,159 10,610 345 23 243.85
2007-08 52,831 10,716 396 23 249.79
2008-09 53,506 10,528 460 24 258.25
2009-10 55,185 11,918 489 20 263.00
Source: TNEB, Chennai.
It is noted from Table 2.12 that over the period under study,
the per unit cost of supply of electricity by the SEB’s is going at an
increasing rate whereas the per unit realization from agriculture sector is
more or less constant. It is clear that throughout, per unit cost of supply of
electricity has remained quite high as compared to per unit realisation from
agriculture sector.
2.3.7 Energisation of Pumpsets
As per the final report of the Tamilnadu Agricultural
Development submitted during the year 2001-02, the power subsidies

91
reaches only 16 per cent Tamilnadu farmers who own pump sets. The vast
majority of rural households have not been benefitted directly from
agricultural power subsidy because they do not own electric pump sets.
The majority of electric pump set owners are large farmers. The study
revealed that medium and large farmers representing 21 percent of all
agricultural pump set owners receive a disproportionately large share of the
total agricultural power subsidy compared to their representation in the
population. Since the introduction of free electricity for agriculture in 1984,
the number of connection has increased by 50 per cent and the annual
electricity consumption per pump set has doubled.10
Upto 2008-09 total
pump sets energized in Tamilnadu is 18,72,734. Agricultural pump sets
energized in Kanyakumari district as on 31-03-2011 is 7051. The details
regarding the number of pumpsets energised in Tamilnadu as a whole and
especially Kanyakumari district is shown in the Table 2.13.
�������������������������������������������������������������10
Mats Lannerstad & David Molden, (2002), “Pumped out: Basin Closure and Farmer
Adaptations in the Bhavani Basin in Southern India”, International Water Management
Institute, Sri Lanka, pp.259-260.

92
TABLE 2.13
ENERGISATION OF AGRICULTURAL PUMPSETS
Year No. of Pump sets in
Tamilnadu Kanyakumari
2000-01 42,548 NA
2001-02 40,307 NA
2002-03 29,863 NA
2003-04 27,484 96
2004-05 33,039 139
2005-06 31,786 215
2006-07 34,325 172
2007-08 34,642 170
2008-09 35,145 148
2009-10 NA 180
Source: Statistics at a Glance, TNEB.
From the Table 2.13 it is noted that there were 35,145 farm
connections in Tamilnadu during the year 2008-09. But there were 42,548
farm connections for the year 2000-01. More number of connections were
noticed in 2000-01 for the state but in the case of the district more
connections were noticed in the year 2005-06.
2.3.8 Electricity Subsidy in Kanyakumari District
Power subsidy in the district played an important role in
improving the agricultural production. The power consumed by the
agriculture sector and the calculated amount of subsidy pertaining to it is
given in the Table 2.14.

93
TABLE 2.14
POWER SUPPLY IN KANYAKUMARI DISTRICT
Year Power sold
(in M.U)
Power Consumed by
Agri. Sector
(in M.U)
Amount of Subsidy
(in crores)
2000-01 5120 48.25 12.98
2001-02 5483 51.60 14.81
2002-03 5632 52.86 15.65
2003-04 5930 53.83 16.31
2004-05 6026 54.01 17.01
2005-06 6165 54.69 17.94
2006-07 6383 55.74 17.63
2007-08 6552 56.92 21.23
2008-09 6722 57.80 25.20
2009-10 6871 58.00 27.20
Source: TNEB, Parvathipuram.
From the Table 2.14 it is clear that the amount of electricity
subsidy is showing an increasing trend throughout the study period. The
highest amount of power subsidy in the district is recorded in the year
2009-10.
2.3.9 Credit Subsidy in Tamilnadu
Gulati and Sharma pointed out that the credit subsidy may be
looked under two alternative ways-from the lender's point of view. The
first one consists of two components.
a) Interest subsidy that accrued to agriculture due to the concessional rate
of interest charged to this sector when compared to other sources and

94
b) Default subsidy which accrues to agriculture in the form of bad-debts.
Accordingly, interest and default subsidy can be calculated
separately and then added to get the subsidy on credit to Indian agriculture.
The second one perceives credit subsidy as the difference between the cost
of supplying credit to the agriculture sector and rate of interest received
from the agricultural sector.
For the study, agricultural credit subsidy means only the 2
per cent interest subsidy received by the farmers for their prompt payment
and that too, the Co-operative Banks are being taken into account and not
the nationalized banks. The actual amount entered in the accounts of the
respective department is taken into account. The rate of interest prevalent
in Tamilnadu was 12 per cent up to 2003-04 and 9 per cent in the following
two years.
With a view to rejuvenating the agriculture sector, the
government has reduced the interest on crop loans from 9 per cent to 7 per
cent in the year 2006-07 and 2 per cent interest subsidy comes into effect
from April 2006. The interest rate was further reduced to 5 per cent in the
year 2007-08. It was further reduced to 4 per cent in the year 2008-09. That
is the farmers can avail a 3 per cent interest subsidy for the prompt
payment. From the year 2009-10, the government declared not to charge
interest on co-operative crop loans who repay their crop loans in time.
Only in Tamilnadu interest free crop loans are extended through

95
Co-operative Bank for the farmers who repay the loan promptly.
Table 2.15 shows the details of agriculture credit subsidy given to the
farmers in the state Tamilnadu.
TABLE 2.15
AGRICULTURAL CREDIT SUBSIDY IN TAMILNADU
Year Amount (in crores)
2000-01 71.0900
2001-02 310.5100
2002-03 121.0000
2003-04 124.8500
2004-05 17.1250
2005-06 38.5610
2006-07 18.2800
2007-08 15.0400
2008-09 26.6857
2009-10 38.2235
Source: Tamilnadu Co-operative Bank, Chennai.
It is clear from Table 2.15 that the highest amount of credit
subsidy is provided for the farmers during the year 2001-02. In the year
2003-04 an amount of Rs.124.85 crores was given. In the subsequent years
smaller amount is recorded.
2.3.10 Credit Subsidy in Kanyakumari District
Credit is an important source of finance for a large section of
the population in the district. Especially the marginal and small farmers
who are unable to mobilize the finance depends mostly on the Co-operative

96
Banks for their credit needs. After the introduction of the interest free loan
many of the marginal and small farmers approach the Co-operative Banks
and make the payment promptly to avail the benefit. Table 2.16 shows the
position of credit subsidy in the district.
TABLE 2.16
CREDIT SUBSIDY IN KANYAKUMARI DISTRICT
Year Amount
(in Rs.)
No. of
Beneficiaries
2005-06 3,86,98,465 7,939
2006-07 1,61,751 8,428
2007-08 28,98,532 10,845
2008-09 93,97,318 19,046
2009-10 4,35,47,795 35,960
Source: Kanyakumari District Central Co-operative Bank, Nagercoil.
From the Table 2.16 it is noted that the amount of credit
subsidy availed by the farmers in the district is showing an increasing
trend. The number of farmers benefitted by the interest free loan is five-
fold more than that of the year 2005-06.
2.4 DEBT WAIVER AND DEBT RELIEF
Most of the small and marginal farmers rely upon the non-
institutional credit to meet their growing needs as the banks are reluctant to
advance loans to this farmers. Moreover, the continuing default of the
farmers makes them unable to avail of fresh loans in the bank and forced
them to approach money lenders to get credit for exorbitant high interest

97
rates. According to a recent study, the dependence on non-institutional
agencies is high amongst low land holding classes: it is as high as 47 to 77
percent amongst owning below one hectare of land and 42 per cent for the
1 to 2 hectare category.11
Due to successive droughts, the co-operative credit institution
is in a position of financial crisis. The farmers are also not able to obtain
fresh loans. At this juncture, the Honorable Chief Minister J. Jayalalitha
enable them to obtain fresh crop loan by rescheduling their outstanding
loan together with interest due to co-operative credit institution as on
31.3.2004 amounting to Rs.2,598 crores into a term loan repayable in a
period of 5 years with a moratorium of 2 years. Very few states have
undertaken this major restructuring of repayments of loans due from
farmers. Further to support the marginal and small farmers from their debt
crisis the government of Tamilnadu during the year 2006-07 have waived
agricultural loan obtained from Co-operative Bank to the tune of Rs. 6,866
crores. Of which, the share of Kanyakumari district was Rs.125.68 crores
and benefitted 80,378 beneficiaries.
A debt waiver and debt relief scheme was then announced by
the Finance Minister in the union budget 2008-09. The total value of
overdue loan to be waived was estimated at Rs.50,000 crores and One
�������������������������������������������������������������11
EPW Research Foundation, (2008), “Loan Waiver Scheme”, Economic and Political Weekly,
March 15, p.28.

98
Time Settlement (OTS) relief on the overdue loan was estimated at
Rs.10,000 crores. Thus a total sum of Rs.60,000 crores was announced, out
of which Rs.2843.90 crores waived for the agricultural loan obtained by
the Tamilnadu farmers from Commercial Banks. Later the amount was
enhanced to Rs.71,680. The government estimates that, as a result of this,
the number of beneficiaries will raise from 40 million to 43 million. While
presenting the Interim Budget for the Year 2009-10 on February 16, 2009,
the Finance Minister stated that the total debt waiver and debt relief till that
date had amounted to Rs.65,300 crores covering 36 million farmers
throughout the country.12
Table 2.17 shows the details regarding the debt waiver and
debt relief scheme implemented by the state government as well as the
central government in various time periods.
TABLE 2.17
AMOUNT OF DEBT WAIVER IN TAMILNADU
Year
1
Nature
2
Applicable To
3
TN
(in crores)
4
K.K.DIST
(in crores)
5
2005-06 Rescheduled Co-operative Banks 2,598 3.87
2006-07 Waiver Co-operative Banks 6,866 125.68
2008-09 Waiver Nationalised and
Co-operative Banks
2,843.90 1.24
Source: 4. various budgets, 5. KDCC Bank, Nagercoil.
�������������������������������������������������������������12 Misora Puri, (2002), Indian Economy, Himalaya Publishing House, New Delhi, p.313.

99
2.5 SHARE OF AGRICULTURAL INPUT SUBSIDIES IN
TAMILNADU
Agricultural input subsidies stimulate additional production
of scarce commodities. By providing incentives to the farming community
they may use the scarce land more efficiently. Table 2.18 shows the
quantum of direct and indirect subsidies utilized by farmers during the year
2009-10.
TABLE 2.18
SHARE OF IMPORTANT AGRICULTURAL SUBSIDIES IN
TAMILNADU (2009-2010)
Subsidy Value
(in crores) % share
Per Hectare
(in Rs.)
Direct Subsidy 55.04 1.41 94.20
Indirect Subsidy
Fertilizer
Power
Credit
3434.37
263.00
140.00
88.23
6.76
3.60
5877.96
450.13
239.61
Total 3892.41 100.00 6661.90
Source: Computed Data.
Considering all the three inputs together with direct
subsidies, the total subsidies in agriculture amounted to Rs.3892.41 crores
during 2009-10. Of the total subsidy, direct subsidy accounted for 1.41 per
cent, fertilizer subsidy 88.23 per cent, power subsidy 6.76 per cent and
credit accounted for 3.6 per cent. The per hectare subsidy of GCA
amounted Rs.6661.90 in Tamilnadu for the year 2009-10. As per Acharya

100
and Jogi the per hectare input subsidy for Tamilnadu during the year
2000-01 was Rs.5683. While considering the total agricultural subsidies in
India, in the year 2000-01 it was Rs.50440 crores and Rs.108,982 crores in
the year 2009-10. There was a double fold increase in the total subsidy and
it is not reflected in the per hectare subsidy amount of the state.
2.6 SHARE OF AGRICULTURAL INPUT SUBSIDIES IN
KANYAKUMARI DISTRICT
There is considerable variation in per hectare input subsidy of
Tamilnadu state and the District. The per hectare subsidy found more than
that of the state. Table 2.19 indicates the share of agricultural input
subsidies in Kanyakumari District for the year 2009-10.
TABLE 2.19
SHARE OF AGRICULTURAL INPUT SUBSIDIES IN
KANYAKUMARI DISTRICT (2009-2010)
Subsidy Value
(in crores) % share
Per Hectare
(in Rs.)
Direct Subsidy 5.34 7.22 516.97
Indirect Subsidy
Fertilizer
Power
Credit
36.68
27.60
4.35
49.59
37.31
5.88
3963.18
2938.89
421.13
Total 73.79 100.00 7840.17
Source: Computed data.
The results pertaining to the share of different subsidies in
total showed that the fertilizer subsidy amounted to more than half of the

101
percent. Out of the total subsidy, 49.59 per cent relates to fertilizer subsidy
and the rest goes to other categories. The power subsidy accounted for
37.31 percent. The direct subsidy provided through the department
accounted to 7.22 percent of the total subsidy. This shows the fact that
more emphasis is given to direct subsidy which reach the intended
beneficiaries without much reduction.
As regards credit subsidies, only Rs.421.13 was subsidized
per hectare. In Kanyakumari district the major subsidized input was
fertilizer followed by power. Among the three indirect subsidies referred,
credit formed the lowest proportion, i.e., 5.88 per cent of the total input
subsidies in the district. The value of input subsidy accruing to the farmers
was estimated as Rs. 7840.17 per hectare of gross cropped area in
Kanyakumari District for the year 2009-10.
2.7 UTILISATION OF SUBSIDIES BY SAMPLE FARMERS
The information pertaining to the amount of subsidies
utilized by different farm size groups are estimated and presented in this
section. As the input subsidy amount is not directly available, certain
approaches are adopted to generate the amount for the year 2010-11.
Direct subsidies are implemented through various schemes of
government by the concerned department officials. The direct subsidies
available to the farmers in the district are seed subsidy, implements
required for day to day agricultural operations, demonstration, subsidy on

102
green manure seeds, micronutrients and bio-fertilizers. Direct subsidies are
specifically earmarked for the small and marginal farmers,
women farmers (30 per cent) and scheduled caste and scheduled tribes (20
per cent). The amount meant for the different farm size groups are
calculated on the basis of the information provided by the sample farmers.
Depending on the usage of inputs the indirect subsidies
referred such as power, fertilizer and credit benefit the farmers. In the case
of fertilizer subsidy, the amount of fertilizer used by the sample farmers
during the reference period was multiplied by the rate of subsidy to arrive
at the fertilizer subsidy availed by the different farm size.
As regards the amount utilized by different size groups of
farmers in electricity subsidy, the units of power consumed by the farmers
for agricultural purposes have been computed and multiplied with the per
unit rate of power subsidy.
Based on the requirements and financial strength, the farmers
may avail loans from the Co-operative Banks. The interest subsidy may be
availed if the loan amount is repaid on or before the due date. The amount
reported by the sample farmers was taken as the amount of credit subsidy
utilized. Table 2.20 shows the detail of the amount utilized by different
size groups of farms in each subsidy in the study unit.

103
TABLE 2.20
UTILISATION OF INPUT SUBSIDIES IN KANYAKUMARI
DISTRICT (2010-2011)
(in Rs.)
Source: Computed data.
The utilization of direct subsidy by marginal farmers was
found to be very high when compared to other category. Lesser amount
was availed by the large farmers and it was valued at Rs.112.42. The
medium and small farmers utilized direct subsidy worth of Rs.120.85 and
Rs.121.81 respectively.
Regarding the utilization of fertilizer subsidy, the small
farmers reaped higher benefits than other categories (Rs.1569.67). Second
the marginal farmers received more benefits which amounted to
Rs.1419.72. The fertilizer subsidy utilized by the large farmers was
surprisingly very low. The medium farmers also reaped only a smaller
amount. Majority of the fertilizer subsidy were availed by the marginal and
small farmers.
Farm Size Direct
subsidy Fertilizer Power Credit Total
Marginal 233.59 1419.72 1326.13 120.00 3267.43
Small 121.81 1569.67 1310.62 140.00 3148.10
Medium 120.85 1175.18 1806.18 80.00 3182.30
Large 112.42 1200.53 2087.03 0 3399.58
Overall 115.34 1336.68 1727.20 84.00 3263.22

104
The use of power subsidy by the large farmers was found
very high and they utilized power subsidy worth Rs.2087.03 against
Rs.1310.62 and Rs.1326.13 by small and marginal farmers. The medium
farmers also utilized an amount of Rs.1806.16. This could be due to the
capacity and capability of the medium and large farmers.
The share of credit subsidy in the total subsidy by the sample
farmers is nil in the case of large farmers. Credit subsidies were utilized
mainly by the marginal and small farmers and not by large farmers. It may
be noted that the medium farmers utilized only a lesser amount than the
other two categories namely marginal and small farmers.
The farm level data of input subsidies utilized by the farmers
showed that the subsidies were not mainly confined to a particular category
of farmers. Though the total subsidy availed by the large farmers is higher
in comparison to other categories, the larger proportion in the power
subsidy is availed by them. The power subsidy benefits the large and
medium farmers while fertilizer subsidies benefit the marginal and small
farmers.
2.8 CONCLUSION
The input subsidies played an important role in the ushering
of green revolution in India from the year 1960. Still now it plays a
dominant role in sustainability of agriculture sector in the country. In the
present situation the fertilizer subsidy is concerned more beneficial to the

105
farmers to compete against the uncertainty rise in prices. The study shows
that there is remarkable improvement in the payment of different type of
subsidies including fertilizer subsidy for the development of agriculture
sector in India.