chapter i introduction 1.1 calcium sensing receptor gene
TRANSCRIPT

2
Chapter I
Introduction
1.1 Calcium Sensing Receptor Gene
The calcium-sensing receptor (CaSR) is a class C G-protein coupled receptor
Figure (1.1), plays a key role in regulating extracellular fluid calcium levels by its
actions on the parathyroid gland and kidney cell (Brown et al. 1993; Thompson et al.
2005). Activation of the CaSR by increased extracellular ionized calcium inhibits
parathyroid hormone (PTH) secretion and promotes urinary calcium excretion (Brown
2002).
The CaSR (based on structural homology of seven transmembrane domains,
with related sequences and functions) that includes the glutamate receptors, the gamma-
amino butyric acid receptors and the recently described taste receptors and is expressed
primarily in the parathyroid cells and cells lining the kidney tubule (Nelson et al. 2001;
Staszewski et al. 2002). It plays a key role in calcium-regulated signaling and is
essential in maintaining mineral ion homeostasis (Hendy et al. 2000). CaSR is expressed
in the developing tooth, and might provide a mechanism for the rapid response to
alterations in extracellular calcium concentrations during tooth formation (Mathias et al.
2001).

3
Figure 1.1: Structure of CaSR Protein (Brown et al. 1993; Thompson et
al. 2005).

4
The function of the CaSR protein is to maintain the serum calcium concentration within
a narrow physiological range. It is expressed mainly in the principal parathyroid cells
and renal tubular cells, although it has also been described in many other tissues and
cells (lung, terminal ileum, colon, adrenal gland, thyroid, osteoclasts). Calcium
regulation takes place through two mechanisms: increased PTH secretion by the
parathyroid glands and calcium reabsorption in the renal tubules (Hendy et al. 2000).
The CASR gene codes a polypeptide of 1078 amino acid (Brown et al. 1993)
and the CASR gene that maps to 3q13.3-21 (Janicic et al. 1995).
Mutations in the human CASR gene have been reported, lead to a range of
diseases associated with failure of calcium regulation. Mutations can be the cause of the
monogenic diseases familial hypocalciuric hypercalcemia and neonatal severe
hyperparathyroidism (Pollack et al. 1993). Other inactivating mutations have been found
in parathyroid lip hyperplasia (Fukumoto et al. 2001) but no evidence for CASR point
mutations was found in familial idiopathic hypercalciuria. Furthermore, evidence of a
role for the CASR in more complex multigenic diseases. Recently, several single
nucleotide polymorphisms in exon 7 in the CASR gene were evaluated for their role in
calcium stone formation (Lerolle et al. 2001).
1.1.1 Calcium Sensing Receptor Gene Polymorphisms
There are three polymorphisms in the intracellular tail encoded by exon 7:
986Ala/Ser (A986S), 990Arg/Gly (R990G) and 1011Gln/Glu (Q1011E), Figure (1.2)
(Table 1.1), and they encode non conservative exchanges of single amino acids. Among
these polymorphisms, the A986S is the most common and widely studied variant in

5
Figure 1.2: Location of the CASR single nucleotide polymorphisms (Janicic et al. 1995).

6
Table 1.1 Polymorphisms of CASR gene (Heath et al. 1996)
7
Caucasian subjects. Most studies on the A986S polymorphism focused on its effects on
various bone and mineral disorders in which serum calcium and PTH concentrations had
a prominent part. Since the A986S polymorphism was the most commonly observed, it
may thus be a genetic determinant of serum calcium concentrations and an interesting
candidate for genetic predisposition to diseases of bone and mineral metabolism. In
some way, this candidate locus is likely to be a useful therapeutic and diagnostic target
with clinical significance (Heath et al. 1996).
Most research has focused on A986S polymorphism, which results from an
amino acid shift in codon A986 (alanine to serine). The polymorphism has a significant
effect on extracellular calcium, and the presence of allele S is associated with increased
serum calcium (Lorentzon et al. 2001) related to a decrease of urinary calcium excretion
(Brown and Hebert 1997).
1.2 Vitamin D and Parathyroid Hormone
Vitamin D and PTH are in general recognized for their important roles in
maintaining extracellular calcium and phosphorous homeostasis and in regulating bone
formation and bone resorption. Vitamin D is largely obtained from the exposure to
sunlight as well as from dietary and supplemental sources (Forman et al. 2007).
Vitamin D deficiency may increase the bone turnover and lower the bone
mineral density (BMD), thus increase the fracture incidence. Vitamin D supplementation
has confirmed an increase of BMD, a decrease of bone turnover and a decrease of
fracture (Lips et al. 2011).
The active vitamin D metabolite 1-25- dihydroxy- vitamin D [1, 25(OH)2 D]
opens up calcium channels in the gut, stimulates the formation of calcium binding

8
protein in the intestinal cell, and thereby stimulates the absorption of calcium and
phosphate from the gut. In this way, optimal circumstances for bone mineralization are
created. Mineralization in itself is a passive process, once sufficient calcium and vitamin
D are available. In case if vitamin D deficiency the 1, 25(OH)2 D concentration may
drop and less calcium will be available for bone mineralization. The PTH level will
increase, stimulating the hydroxylation of 25(OH)2 D in the kidney to 1, 25(OH)2 D. The
increased serum PTH stimulates bone turnover, leading to bone loss, Figure (1.3) (Lips
2001).
PTH is the regulating factor in the calcium and phosphate metabolism. PTH
effects calcium and phosphate metabolism in bone and kidneys, Figure (1.4). If the
calcium level in the blood is decreased then the PTH stimulates multiple pathways to
raise the calcium level:
1- Stimulating bone resorption (osteocalsis) which releases extra calcium
from the bone.
2- Reducing renal calcium excretion, increasing renal phosphate excretion.
3- Promoting bioactive vitamin D production by the kidney which enhances
calcium and phosphate absorption by the small intestines (Potts 2005).
If the body continues to produce excess PTH, such as in patients with
primary hyperparathyroidism this will effects faster bone resorption than bone
formation, this will eventually lead to osteoporosis (Roschger 2007).
9
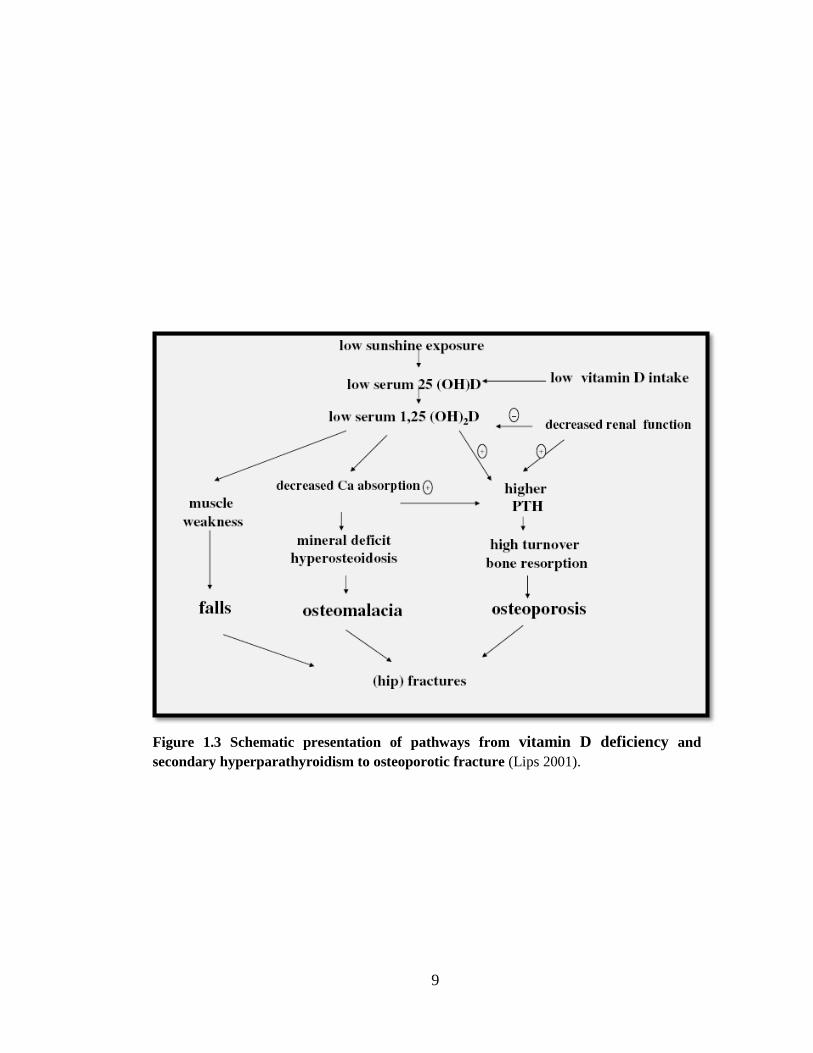
Figure 1.3 Schematic presentation of pathways from vitamin D deficiency and
secondary hyperparathyroidism to osteoporotic fracture (Lips 2001).

10
Figure 1.4 Role of PTH in regulating the balance in calcium and phosphate metabolism
(Potts 2005).

11
1.3 Bone
1.3.1 Bone Strength and Remodelling
Bone strength depends on the vertebral bone density and the trabecular bone
structure. It is therefore of interest to investigate the relationship between the static
histomorphometric measures and the vertebral bone strength (Kleerekoper et al. 1985).
Bone turnover markers (BTMs) reflect whole body rates of bone resorption
and bone formation. Specific assays for bone turnover have been developed that have
aided in the diagnosis and management of metabolic bone diseases, including
osteoporosis. BTMs are now commonly used in clinical trials as measures of
antiresorptive and anabolic effects. Markers of bone turnover, particularly markers of
bone resorption, have been shown in some, but not all, prospective epidemiologic
studies to be associated with fracture risk (Bone 2004) and this association appears to be
independent of BMD (Delmas 2000).
Bone remodelling is the continuous process of bone resorption and bone
formation occurring in the skeleton of vertebrates throughout their lifetime (Mundy
2000). Remodelling occurs asynchronously at multiple spatially and temporally isolated
sites of the skeleton in order to remove portions of damaged or older bone, replacing this
with newly formed bone (Parfitt 2002). The purpose of bone remodelling is to:
First: Repair of micro-factures that may lead to macro scale weakness fractures under
repeated cyclic loading, sometimes referred to as targeted remodeling (Martin 2002).
Second: Mineral homeostasis, by providing access to the stored of calcium and
phosphate, sometimes referred to as random remodelling is accomplished by groups of

12
bone forming cells (osteoblasts) and bone desorbing cells (osteoclasts), which work
together in so-called basic multicellular units’ (BMUs) (Burr 2002).
A BMU consists of cells of the osteoblastic and osteoclastic lineage at
different stages of maturation. The osteoblasts are derived from mesenchymal stem cells
located in the bone marrow, spleen or liver and the osteoclasts are derived from
hematopoietic stem cells. Depending on the gene expression profiles and cell markers,
various stages of maturation of these cell lines can be distinguished (Aubin 1998).
BTMs are dynamic variables that are affected by several environmental (e.g.
climate, country), epidemiological (e.g. age, gender), and lifestyle factors (e.g. smoking
status, BMI, alcohol consumption) (Glover 2009). It is important to understand the
influence of these lifestyle factors on BTM levels. Furthermore, BTMs are also
correlated with 25(OH)2 D levels, as lower 25(OH)2 D levels result in an increase in PTH
levels, which in turn stimulates bone resorption and turnover (Glover 2008).
1.4 Calcium Sensing Receptor and Osteoporosis
The bone remodelling process is characterized by a sequence of actions
starting by resorption of the mineralized matrix by osteoclasts and deposition of a new
bone matrix by osteoblasts, resulting in replacement of the resorbed bone. The
maintenance of bone mass is dependent on the balance between bone resorption and
formation during bone remodelling. The age-related difference between the increased
bone resorption and decreased formation results in bone loss and osteoporosis (Raisz
2005). Bone remodelling is physiologically finely regulated by a variety of hormones,

13
cytokines and growth factors that control osteoclast and osteoblast number and function
(Martin and Seeman 2008).
Extracellular calcium is important to control the bone remodelling by
directly regulating the parathyroid cells through the activation of the seven-
transmembrane-spanning extracellular CaSR, CaSR is a member of the G-protein
coupled receptor (GPCR) family (Garrett et al. 1995). The receptor plays a key role in
maintaining extracellular calcium ion concentration through its actions on PTH secretion
and renal calcium reabsorption (Brown et al. 1998). Activation of CaSR by extracellular
calcium concentration in the parathyroid gland down regulates PTH secretion. The
CASR mutations result in disorders of calcium homeostasis. Mutations of the CASR
gene can be either inactivating or activating mutation. The loss-of-function mutations
can cause a disease such as autosomal dominant familial hypocalciuric hypercalcemia
(FHH). The Gain-of-function CASR mutations are related with autosomal dominant
hypocalcemia (ADH) and normal PTH levels (Raue et al. 2006). Clinical observations
provided support for the central role of the CaSR in calcium homeostasis through
regulation of PTH secretion and renal calcium treatment. Recent genetic and
biochemical data specify that the CaSR plays an important role in the control of bone
cells.
Osteoporosis is a multi-factorial disorder characterized by low BMD and
micro architectural deterioration of bone, resulting in loss of bone strength and thus
increased fracture risk. Feebleness fractures are the most important and disabling
consequences of osteoporosis and result in a loss of functional ability, serious morbidity,
elevated mortality, and high socio-economic burden (Johnell and Kanis. 2006). Due to
increased life expectancy, the incidence of fractures is increasing over time, thereby
14
increasing the population burden of fractures (Holt et al. 2009). Several studies of
different populations have established the importance of clinical risk factors as
determinants for low bone mass, and fragility fractures no one risk factor alone is able to
predict bone mass or risk of fractures on its own individual merits.
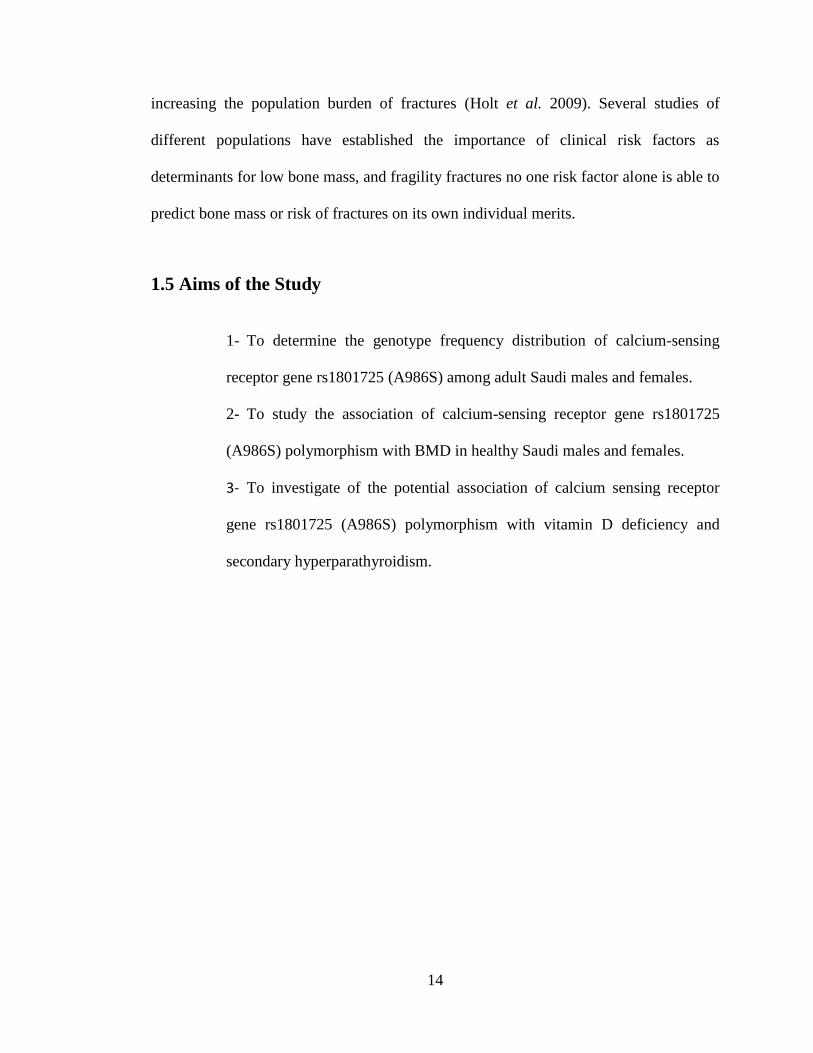
1.5 Aims of the Study
1- To determine the genotype frequency distribution of calcium-sensing
receptor gene rs1801725 (A986S) among adult Saudi males and females.
2- To study the association of calcium-sensing receptor gene rs1801725
(A986S) polymorphism with BMD in healthy Saudi males and females.
3- To investigate of the potential association of calcium sensing receptor
gene rs1801725 (A986S) polymorphism with vitamin D deficiency and
secondary hyperparathyroidism.

CHAPTER TWO
MATERIALS AND METHODS

16
Chapter П
Materials and Methods
2.1 Materials
2.1.1 Subjects
The study was carried out by recruiting 50 Saudi males and 63 Saudi
females. They were convenience samples, quantitative cross sectional exploratory study,
selected from subjects attending the center of excellence for osteoporosis research
(CEOR), with age range between 20 and 60. Each subject was medically examined and
interviewed using a standardized questionnaire. It contain questions on socioeconomic
status, lifestyle, smoking habits, level of physical activity in leisure time, sun exposure,
and the use of vitamins and medications. Dietary intakes of calcium and vitamin D
supplementation were also recorded. Exclusion criteria were: known renal disease,
thyroid disorders, diabetes mellitus, pregnancy, patients on medications that affects bone
metabolism such as steroids and antiepileptic medications.
The practical works of this research were conducted in the center of
excellence for osteoporosis research (CEOR), King AbdulAziz University, Jeddah,
Saudi Arabia.

17
2.1.2 Kits
2.1.2.1 Genomic DNA Extraction Kit
The DNA extraction kit Gentra Puregene Blood Kit was purchased from
QIAGEN Inc, USA. The kit contains RBC lysis solution, cell lysis solution, protein
precipitation solution and DNA hydration solution; all reagents were stored at room
temperature (15–25°C).
2.1.2.2 Polymerase Chain Reaction (PCR) Kit
Amplification of genomic DNA for subjects were performed by using
Promega Go Taq® Hot Star Green Master Mix Kit (100 units), USA. The kit contains
Go Taq® Hot Star Green Master Mix, 2X and nuclease free water.
2.1.2.3 Restriction Enzymes
The restriction enzymes are SacI restriction enzyme and HinP1I (Hin6I)
restriction enzymes were carried out by using Thermo Scientific FastDigest restriction
enzyme, Fermentas, U.S.A.
2.1.2.4 Primers
The primers for SNP A986S (rs1801725) were ordered from Metaboin
international AG, Germany. The concentration was 100 pmol/ µl.
1. Forward primer 5´- CTT TGA TGA GCC TCA GAA GAG C -3´, the oligo
number: 10706B3- 9642C01.

18
2. Reverse primer 5´- ACA ACT CTT CAG GGT CCT CC -3´, the oligo number:
10706B3-9642D01.
2.1.3 Reagents
Agarose, ethanol, SYBR green, O‘RangeRuler 50 bp DNA Ladder and TBE buffer
(10 X) were all purchased from Fermentas, U.S.A.
2.2 Methods
2.2.1 Anthropometric Measurements
Anthropometric measurements were performed in the morning, before
breakfast, with the subjects wearing light clothes and bare footed. Weight and height
measurement were performed using a digital scale. The body mass index (BMI) was
calculated by dividing the body weight (in kilograms) by the square of the height (in
meters).
2.2.2 Sample Collection
Venous blood samples were obtained from the antecubital vein after 9 hours
overnight fasting; 7 ml of blood was withdrawn into a plain vacutainer tube for serum
preparation. Then 3 ml of blood was withdrawn into EDTA vacutainer tube to be used
for DNA extraction.

19
2.2.3 Bone Mineral Densitometry Measurements
BMD (g/cm2) was determined for the anteroposterior lumbar spine (L1-L4)
and the neck femurs by dual-energy X-ray absorptiometry (DXA) (LUNAR Prodigy
Model, Lunar Corp., Madison, WI).
BMD values were classified according to WHO criteria: a T-score between -1 and -2.5 is
indicative of osteopenia, while a T-score of -2.5 and below reflects osteoporosis: a T-
score of -1 and above is considered normal.
2.2.4 Genomic DNA Extraction from Whole Blood
Three hundred microliter of the whole blood was added to 1.5 ml micro
centrifuge tube containing 900 µl red blood cell lyses solution. The tube was then mixed
by inverting it 10 times. The mixture was incubated at room temperature for 1 min, then
spin briefly for 20 s at 13000-16000 ×g. The supernatant were then carefully discarded
by pipetting. After that cell lyses solution (300 µl) was added to the sample and mixed
by vortex for 10 s. Then protein precipitation solution (100 µl) was added and mixed by
vortex for 20 s. The mixture centrifuged for 1 min at 13000–16000×g. Isopropanol (300
µl) was added into a 1.5 ml micro centrifuge. Then the supernatant from the previous
step was added and mix by inverting 50 times until the DNA was visible as threads. This
is followed by spinning the mixture for 1 min. Then the supernatant were carefully
discarded, and the tube was drained by inverting it on a clean piece of absorbent paper.
Next 70% ethanol (300 µl) was added (to wash the DNA pellet) and the mixture was
inverted several times. Then centrifuged for 1 min at 13000-16000 ×g. Subsequently the
supernatant were carefully discarded, and the tube was drained by inverting it on a clean
piece of absorbent paper. DNA hydration solution (100 µl) was added and vortex for 5s

20
at medium speeds and then incubated at 65ºC for 5 min to dissolve the DNA. After that
the DNA was incubated at room temperature (15-25ºC) overnight.
2.2.5 Determination of DNA Concentration
A UV spectrophotometer (Gene Quant 1300, Model No. 80-2120-02,
England) was used to determine DNA concentration by the quantitative method that was
based on the measurement of the optical density. The DNA concentration was
determined by reading the absorbance at wavelength of 260nm.
2.2.6 Primers Dilution
The primers have been centrifuged for 30 second at 10,000 xg. Then RNAse
free water (327 µl) was added for the forward primer and mixed well to give a final
concentration of 100µM, after that the primers were left to stand for 15 minutes. Finally,
an aliquot were made in eppendorf tubes to avoid contamination. The primers were then
stored at - 20ºC.
2.2.7 Polymerase Chain Reaction (PCR)
The fragments that contains A986S (rs1801725) SNP was amplified by using
the Forward primer 5´- CTT TGA GCC TCA GAA GAG C -3´, and Reverse primer 5´-
ACA ACT CTT CAG GGT CCT CC -3´. PCR amplification products were carried out
in a final volume of 50 µl [25 µl HotStar Taq Master Mix, 6 µl (2µg/µl) genomic DNA,
15 µl RNase free water, and 2 µl of each primer] in athermal cycler (BIO-RAD, DNA
Engine Tetrad2 Peltier Thermal Cycler, serial number: AL116086, U.S.A.). The

21
amplification conditions were as follows: 94ºC for 5 min, followed by 30 cycle of 30s
each at 94ºC, 58ºC, and 72ºC, and ending with a single 7 min extension step at 72ºC.
After the thermal cycle have been terminated, 5 µl of each PCR products
with 2 µl loading dye was loaded into the wells of 2 % agarose gel to ensure that the
amplification had occurred. The remaining PCR product was stored at - 20ºC.
2.2.8 Electrophoresis
2.2.8.1 Preparation of 2% Agarose Gel
In order to prepare 2% agarose gel. In a conical flask, 2 g of agarose was
diluted into 100 ml of 1X TBE buffer than placed in a microwave until the agarose
completely dissolved. Then the agarose left to cool on the bench for 5 minutes down to
about 60ºC, while the agarose cooling, the gel casting tray was prepared clean and ready
on a level surface and two spacers were inserted firmly between the edges of the casting
tray, sample comp then was insert in its correct position. In order to visualize the band
clearly 10 µl of SYBR green was added carefully, and then swirled to mix. Then the gel
was poured slowly into the casting tray. After that, any bubbles were pushed away to the
far side of the try by using a disposable tip. Finally the gel left the polymerized for at
least 30 minutes.
2.2.8.2 Running Gel
After the gel was allowed to set for half an hour then the combs and the two
spacer were removed gently. The gel casting trays of the electrophoresis were filled with
1X TBE buffer. After that, (8µl DNA ladder of the 50 bp + 8µl RNase free water) were
22
loaded into the well, then the samples were loaded in the rest of the wells. The samples
were loaded slowly and carefully.
Electrophoresis lead was attached firmly and was connected to the power
supply generator (ensuring that the DNA will migrate from the negative to the positive
terminal). The electrophoresis was started at a voltage of 120 volts for 45 minutes using
power supply (BIO-RAD, Model No. Power Pac 300, USA). The distance DNA
migrated in the gel was judged by visually monitoring migration of the tracking dyes.
2.2.8.3 Visualization of the DNA bands
DNA band were visualized by previous staining of the gel with SYBR green
(10 µl) from 10X stock solution. This fluorescent dye intercalates between bases of
DNA and it was incorporated into the gel so that staining occurs during electrophoresis.
The gel then was placed on a gel documentation system (BIO-RAD, Model No.
Universal Hood П, USA) to examined, visualized and then photographed.
2.2.9 Genotyping
2.2.9.1 Genotyping of A986S SNP in CASR gene by Hin6I
The genotypes for this SNP were determined by restriction fragment length
polymorphism (RFLP) procedure. The PCR products were digested by combining the
following components in a 200 µl microfuge tube to a total volume of 30 µl:

23
PCR product 5 µl (0.2 µg/µl)
RNase free water 22 µl
10X NE Buffer 2 µl
Restriction enzyme (hin6I) 1 µl
Samples were incubated at 37ºC for 5 min then inactivated the enzyme by
heating at 80ºC for 10 min and after that; the genotypes were resolved after running it on
2% agarose gels electrophoresis.
2.2.9.2 Genotyping of A986S SNP in CASR gene by SacI
The genotypes for this SNP determined by restriction fragment length
polymorphism (RFLP) procedure. They prepared in a total volume of 30 µl as follow:
PCR product 5 µl (0.2 µg/µl)
RNase free water 22 µl
10X NE Buffer 2 µl
Restriction enzyme (SacI) 1 µl
Then the tube incubated at 37ºC for 30 min then inactivated the enzyme by
heating at 65ºC for 5 min and after that, the genotypes were resolved after running it on
2% agarose gels electrophoresis.
2.3 Biochemical analysis
Calcium was measured using Filter photometric (VTROS 250, USA). Bone marker
serum osteocalcin (s-OC) was measured using ECLIA Elecsys autoanalyzer [Roche
Diagnostics GmbH, D-68298 Mannheim, Germany]. Serum bone-specific alkaline

24
phosphatase (s-bone ALP) was measured with a Metra Biosystem immunoassay kit in a
microtiter strip (Alkphase-B, Metra Biosystems, Inc., Mountain View, CA, USA).
Serum procollagen type 1 N-terminal propeptide (s-PINP) was measured using ECLIA
Elecsys autoanalyzer [Roche DiagnosticsnGmbH, D-68298 Mannheim, Germany].
Serum crosslinked C-terminal telopeptide of type 1 collagen (s-CTX) was measured by
Elecsys β-CrossLaps assay using ECLIA Elecsys autoanalyzer. All analysis was
conducted at the CEOR, King AbdulAziz University, Jeddah, Saudi Arabia.
2.4 Hormones analysis
Estradiol, free hormone (LH), parathyroid hormone (PTH), thyroid
stimulating hormone (TSH), thyroid test (T3 and T4) where analyzed at CEOR, King
AbdulAziz University, Jeddah, Saudi Arabia.
2.5 Statistical Analysis
The clinical and laboratory data recorded on an investigative report form.
Statistical analysis of the data performed using statistical package for social sciences
(SPSS for windows, version 18) (SPSS Inc., Chicago, IL, USA). Descriptive data
were given as mean ± standard deviation (SD). Correlation between different
variables was assessed using Pearson’s or Spearman’s correlation as appropriate. P
values < 0.05 were considered significant. Differences in biochemical values relative
to genotype were tested by one-way ANOVA and Tukey post-hoc comparisons.
Hardy-Weinberg Equilibrium was used to determine allele frequency and genotype
frequency in a population.

CHAPTER THREE
RESULTS

26
Chapter Ш
Results
3.1 Subjects
In this study, 113 Saudi volunteers (50 males and 63 females) were involved. All study
subjects were of Saudi origin without any known ancestors of other ethnic origins. All
the participants underwent complete physical examination and routine biochemical
analysis of blood. Allele and genotype frequencies for the CASR gene A986S
polymorphism were determined, the association of the CASR gene A986S
polymorphism with BMD, vitamin D deficiency and secondary hyperparathyroidism
were evaluated.
3.2 Physical and biochemical characteristics
The clinical characteristics including the serum concentration of calcium and
BMD and PTH and 25(OH) D and other Physical and biochemical characteristics in
Table 3.1. The subjects were divided into two groups according to gender. The number
of males was 50 and females were 63 subjects. The BMD at lumbar spine, 1.09±0.15
g/cm2 in males and 1.04±0.18 g/cm
2 in females.

27
Table 3.1: Physical and biochemical characteristics for the male and female subjects
SD: Std. Deviation, ALP: alkaline phosphatase,
s-OC: marker serum osteocalcin, s-CTX :crosslinked C-terminal telopeptide of type1 , s-
PINP: collagen serum procollagen type 1 N-terminal propeptide , PTH: Parathyroid
hormone.
Groups
Males
(n=50)
Females
(n=63)
Mean SD
Mean SD
Age (years) 43.32 13.87 44.40 13.22
Weight (kg) 83.15 18.59 73.28 15.36
Height (cm) 167.35 7.24 154.58 6.91
BMI (kg/m2) 29.67 6.24 30.89 7.12
BMD lumbar
spine (g/cm2)
1.09 0.15 1.04 0.18
BMD neck
femur (g/cm2)
0.97 0.13 0.94 0.14
s- Calcium
(mmol/L) 2.34 0.11 2.32 0.12
ALP (U/L) 93.76 30.74 88.57 28.92
s-OC (ng/ml) 26.24 11.12 51.50 212.46
p-CTX
(ng/ml) 335.08 169.36 285.40 149.20
s-P1NP
(ng/ml) 44.31 17.65 45.50 18.96
s-BALP
(ng/ml) 20.16 9.67 19.75 8.24
s-PTH
(pmol/L) 5.12 2.42 6.08 3.58
s-25-(OH)D
(nmol/L) 31.93 14.04 35.21 30.77

28
Mean PTH level in males is 5.12±2.42 pmol/L and 6.08±3.58 pmol/L in females. Mean
vitamin D Level in males is 31.93±14.04 nmol/L and 35.21±30.77 nmol/L in females.
3.3 Correlation between calcium level and other variables
The subjects were divided into two groups according to gender. The calcium
correlation with physical and biochemical parameter were done by using Pearson
correlation. The overall results showed in male group that there is a significant negative
correlation between calcium and weight (P=0.024) (Table 3.2). There is a significant
negative correlation between calcium and BMI (P=0.014).
The results showed in female group that there is a significant correlation
between calcium and 25-(OH) D (P=0.029) (Table 3.3).
3.4 Correlation between PTH and other variables
The subjects were divided into two groups according to gender. The PTH
correlation with physical and biochemical parameter were done by using Pearson
correlation. The PTH and age, PTH and BMI is highly significant correlation (P=0.001)
and (P=0.008) respectively in males group (Table 3.4). The correlation between PTH
and weight is significant (P=0.014).
In female group the PTH correlation with BMI is significant (P=0.015)
(Table 3.5). There is no correlation between PTH and other physical and biochemical
parameter.

29
Table 3.2: Correlation between calcium and other variables in male group
Asterisk indicates statistical significance at:* P < 0.05.
ALP: alkaline phosphatase, PTH: Parathyroid hormone.
Variables
Calcium
Pearson correlation P value
Age ( years) -0.272 0.056
Weight (kg) -0.319 0.024*
Height (cm) 0.018 0.900
BMI (kg/m2) -0.346 0.014*
BMD lumbar spine
(g/cm2)
-0.134 0.353
BMD neck femur (g/cm2) 0.173 0.244
ALP (U/L) 0.123 0.396
PTH (pmol/L) -0.269 0.059
25-(OH)D (nmol/L) -0.094 0.515

30
Table 3.3: Correlation between calcium and other variables in female group
Asterisk indicates statistical significance at:* P < 0.05.
ALP: alkaline phosphatase, PTH: Parathyroid hormone.
Variables Calcium
Pearson correlation P value
Age ( years) 0.178 0.163
Weight (kg) -0.126 0.327
Height (cm) -0.145 0.255
BMI (kg/m2) -0.060 0.638
BMD lumbar spine
(g/cm2)
0.244 0.054
BMD neck femur
(g/cm2)
0.234 0.086
ALP (U/L) 0.065 0.614
PTH (pmol/L) -0.153 0.232
25-(OH) D (nmol/L) 0.276 0.029*

31
Table 3.4: Correlation between PTH and other variables in male group
Variables
PTH
Pearson correlation P value
Age ( years) 0.474 0.001**
Weight (kg) 0.344 0.014*
Height (cm) -0.034 0.813
BMI (kg/m2) 0.369 0.008**
BMD lumbar spine
(g/cm2)
-0.147 0.307
BMD neck femur
(g/cm2)
-0.273 0.063
ALP (U/L) 0.220 0.124
s- Calcium (mmol/L) -0.269 0.059
25-(OH)D (nmol/L) -0.169 0.241
Asterisk indicates statistical significance at:* P < 0.05, ** P <0.01
ALP: alkaline phosphatase, PTH: Parathyroid hormone.

32
Table 3.5: Correlation between PTH and other variables in female group
Variables
PTH
Pearson correlation P value
Age ( years) 0.140 0.273
Weight (kg) 0.246 0.052
Height (cm) -0.207 0.104
BMI (kg/m2) 0.305 0.015*
BMD lumbar spine
(g/cm2)
0.064 0.619
BMD neck femur
(g/cm2)
-0.048 0.727
ALP (U/L) 0.216 0.089
s- Calcium (mmol/L) -0.153 0.232
25-(OH)D (nmol/L) -0.240 0.058
Asterisk indicates statistical significance at:* P < 0.05.
ALP: serum bone-specific alkaline phosphatase, PTH: Parathyroid hormone.

33
3.5 Correlation between 25-(OH) D and other variables
The 25-(OH) D correlation with physical and biochemical parameter were
done by using Spearman correlation and the subjects were divided into two groups
according to gender. There is negative significant correlation between 25-(OH) D and
alkaline phospatase (P=0.017) in male group (Table 3.6) and no correlation between 25-
(OH) D and other parameter.
In female group there is significant correlation between 25-(OH) D and age,
25-(OH) D and alkaline phosphatase, 25-(OH) D and calcium (P=0.022), (P=0.013) and
(P=0.029) respectively (Table 3.7).
3.6 Correlation between BMD and other variables
The correlation between BMD at lumbar spine, dual femur and other
physical and biochemical was done by Pearson correlation and divided to two groups
according to gender. There is significant correlation between BMD lumbar spine and
height (P=0.017) and highly significant between BMD lumbar spine and weight
(P=0.008) in males group (Table 3.8).
In females groups there is a significant correlation between BMD lumbar
spine and calcium (P=0.024) and no significant differences between other variables.
There is a highly significant between BMD neck femur and weight (0.007) (Table 3.9).

34
Table3.6: Correlation between 25-(OH) D and other variables in male group
Variables
25-(OH)D
Spearman correlation P value
Age ( years) 0.140 0.334
Weight (kg) -0.086 0.553
Height (cm) 0.065 0.654
BMI (kg/m2) -0.123 0.397
BMD lumbar spine
(g/cm2)
0.074 0. 610
BMD neck femur
(g/cm2)
-0.028 0.852
ALP (U/L) -0.336 0.017*
s- Calcium (mmol/L) -0.094 0.515
PTH (pmol/L) -0.169 0.241
Asterisk indicates statistical significance at:* P < 0.05.
ALP: alkaline phosphatase, PTH: Parathyroid hormone.

35
Table 3.7: Correlation between 25-(OH) D and other variables in female group
Variables
25-(OH) D
spearman correlation P value
Age ( years) 0.288 0.022*
Weight (kg) 0.005 0.968
Height (cm) -0.209 0.101
BMI (kg/m2) 0.090 0.482
BMD lumbar spine
(g/cm2)
-0.039 0.763
BMD neck femur
(g/cm2)
-0.151 0.270
ALP (U/L) 0.310 0.013*
s- Calcium (mmol/L) 0.276 0.029*
PTH (pmol/L) -0.240 0.058
Asterisk indicates statistical significance at:* P < 0.05.
ALP: alkaline phosphatase, PTH: Parathyroid hormone.

36
Table 3.8: Correlation between BMD and other variables in male group
Variables
BMD lumbar spine (L1-L4) BMD neck femur
Pearson
correlation P value
Pearson
correlation P value
Age ( years) -0.019 0.861 -0.214 0.148
Weight (kg) 0.345 0.008** 0.166 0.265
Height (cm) 0.290 0.017* -0.035 0.816
BMI (kg/m2) 0.254 0.064 0.206 0.164
ALP (U/L) -0. 211 0.098 -0.219 0.139
s-Calcium
(mmol/L) -0. 134 0.525 0.173 0.244
PTH (pmol/L) -0.147 0.373 -0.273 0.063
25-(OH)D
(nmol/L) 0.162 0.385 0.054 0.719
Asterisk indicates statistical significance at:* P < 0.05, ** P <0.01
ALP: alkaline phosphatase, PTH: Parathyroid hormone.

37
Table 3.9: Correlation between BMD and other variables in female group
Variables
BMD lumbar spine (L1-L4) BMD neck femur
Pearson
correlation P value
Pearson
correlation P value
Age ( years) -0.157 0.216 -0.124 0.369
Weight (kg) 0.053 0.215 0.360 0.007**
Height (cm) 0.143 0.125 0.204 0.136
BMI (kg/m2) -0.027 0.695 0.237 0.082
ALP (U/L) -0.186 0.163 -0.048 0.729
s-Calcium
(mmol/L) -0.244 0.024* -0.234 0.086
PTH (pmol/L) 0.064 0.770 -0.048 0.727
25-(OH)D
(nmol/L) -0.029 0.746 -0.085 0.536
Asterisk indicates statistical significance at:* P < 0.05, ** P <0.01
ALP: alkaline phosphatase, PTH: Parathyroid hormone.

38
3.7 Analysis of the rs1801725 SNP in the CASR gene
PCR technique was used to amplify the region that contains rs1801725 SNP
for all the collected samples (n=113). The amplified fragment showed a size of 218bp.
In restriction enzyme SacI the normal (AA) genotype produced one band of
size 218bp. The heterozygous (AS) genotype produced three fragments of size 218, 198
and 20bp. The homozygous (SS) genotype produced two band of size 198bp and 20bp
(Figure 3.1).
In restriction enzyme Hin6I the normal (AA) genotype produced two band of
size 195bp and 23bp. The heterozygous (AS) genotype produced three fragments of size
218, 195 and 23bp. The homozygous (SS) genotype produced one band of size 218bp
(Figure 3.1).
3.8 Genotypes and allele frequencies of rs1801725 in males and females
Genotype frequencies of calcium sensing receptor gene rs1801725 in males
showed 26% (n=13) normal (AA), and 56% (n=28) heterozygous (AS) and 18% (n=9)
homozygous (SS). Allele frequencies for A and S were 54% and 46% respectively. The
genotype distribution is within Hardy-Weinberg equilibrium (Goodness of fit X2= 0.80,
df =2, P =0.00001).

39
AS SS AA
1000 bp
500 bp 400bp
350bp 300bp
250bp
200 bp
Mm 1 2 3 4 5 6 7 8 9 10
Figure 3.1 Photograph of a 2% agarose gel showing the result of SacI and
Hin6I digestion. Lane M: DNA marker. Lane 1: control. Lane 2: uncut PCR
product of size 218bp. Lane 3: heterozygous (AS) genotype that shows two band
218 and 198bp in SacI. Lane 4: heterozygous (AS) genotype that shows two band
218 and 195bp in Hin6I. Lane 5: uncut PCR product of size 218bp. Lane 6:
homozygous (SS) genotype that shows one band 198 in SacI. Lane 7:
homozygous (SS) genotype that shows one band 218 in Hin6I. Lane 8: uncut
PCR product of size 218bp. Lane 9: normal (AA) genotype that shows one band
218bp in SacI. Lane 10: normal (AA) genotype that shows one band 195bp in
Hin6I.
M 1 2 3 4 5 6 7 8 9 10

40
In females, the result showed 49.21% (n= 31) normal (AA), and 36.51% (n=23)
heterozygous (AS), and 14.29% (n=9) homozygous (SS). Allele frequencies for A and S
were 67.46% and 32.54% respectively. The genotype distribution is within Hardy-
Weinberg equilibrium (Goodness of fit X2= 1.78, df= 2, P= 0.07).
Genotype and allele frequencies of the males and females are presented in (Table 3.10).
3.9 Association of CASR rs1801725 polymorphism with BMD
The result of association between rs1801725 SNP and BMD is summarized
in (Table3.11). There were no significant differences in BMD observed between the AS,
SS genotype and the AA genotype carrier.
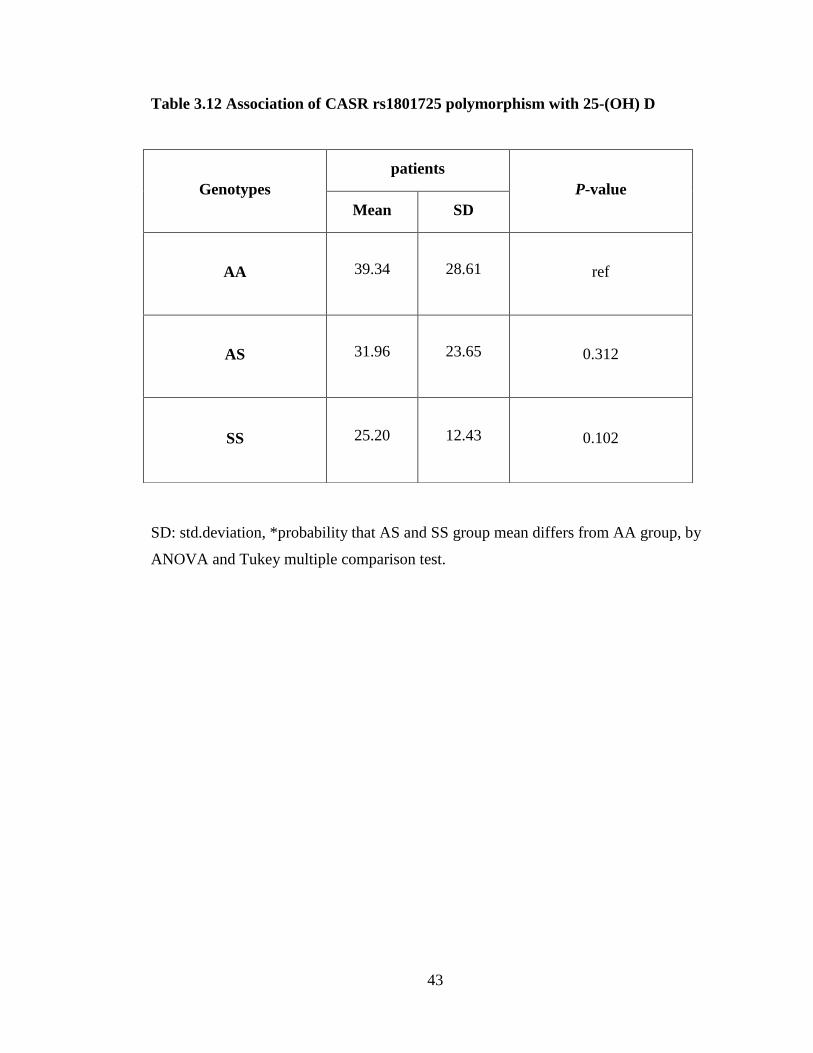
3.10 Association of CASR rs1801725 polymorphism with 25-(OH) D
The result of association between rs1801725 SNP and 25-(OH) D is
summarized in (Table3.12). There were no significant differences in 25-(OH) D
observed between the AS, SS genotype and the AA genotype carrier. The AS carriers
showed higher levels of 25-(OH) D (31.96±23.65 nmol/L) compared to the SS genotype
carriers (25.20±12.43 nmol/L).

41
Table 3.10 Genotypes and allele frequencies of rs1801725 in males and females
Calcium
polymorphism
Frequencies (%)
Male
(n=50)
Female
(n=63)
AA
26.00
(n=13)
49.21
(n=31)
AS 56.00
(n=28)
36.51
(n=23)
SS 18.00
(n=9)
14.29
(n=9)
AS+SS 74.00
(n=37)
50.79
(n=32)
Alleles
A 54.00 67.46
S 46.00 32.54

42
Table 3.11 Association of CASR rs1801725 polymorphism with BMD
Data are mean (SD), *probability that AS and SS group mean differs from AA group, by
ANOVA and Tukey multiple comparison test.
BMD
A986S genotype
P-value
AA AS SS
BMD lumbar
spine (g/cm2)
1.071 (0.18) 1.076 (0.16) 1.03 (0.15) 0.98
AS
0.78SS
BMD neck
femur (g/cm2)
0.93 (0.16) 0.96 (0.12) 0.98 (0.13) 0.72
AS
0.50SS
43
Table 3.12 Association of CASR rs1801725 polymorphism with 25-(OH) D
SD: std.deviation, *probability that AS and SS group mean differs from AA group, by
ANOVA and Tukey multiple comparison test.
Genotypes
patients
P-value
Mean SD
AA 39.34 28.61 ref
AS 31.96 23.65 0.312
SS 25.20 12.43 0.102

44
3.11 Association of CASR rs1801725 polymorphism with PTH
The result of association between rs1801725 SNP and PTH in secondary
hyperparathyroidism patients is summarized in (Table3.13). There were no significant
differences in PTH observed between the AS, SS genotype and the AA genotype carrier.

45
Table 3.13 Association of CASR rs1801725 polymorphism with PTH
SD: std.deviation, *probability that AS and SS group mean differs from AA group, by
ANOVA and Tukey multiple comparison test.
Genotypes
patients
P-value
Mean SD
AA 7.56 2.38 ref
AS 7.78 3.90 0.939
SS 7.50 2.47 0.997

CHAPTER FOUR
DISCUSSION

50
Chapter IV
Discussion
This study is the first to examine the effect of the CASR A986S
polymorphism in men worldwide.
Vitamin D deficiency in Saudi males and females is ~85% and it is
increasing due to life style along with other factors including genetics. Studies
conducted by Sadat et al. showed that the concentration of vitamin D was ≤50 nmol/l
among 28-37% of 200 randomly selected healthy men living in Alkhobar (Sadat et al.
2009). Furthermore, another low concentration of vitamin D was detected in both males
and females, even though they are exposed to sunlight and having adequate dairy
products (Elsammak et al. 2011). Vitamins D deficiency has been studied in Middle East
and turkey. Table4.1 demonstrates some of these studies in some countries. We thought
it would be interesting to look at the matter from the genotype point of view, so we
determined the frequency distribution of CASR rs1801725 A986S among adult Saudi
males and females and studied the association of the gene polymorphisms

51
Countries Title of Study 25-(OH)2D level References
Saudi Arabia
High prevalence of vitamin D
deficiency in the sunny
eastern region of Saudi
Arabia
25-(OH)2 D level were
[25.25 nmol/L in male and
24.75 nmol/L in female].
(Elsammak
et al. 2011).
Oman
Vitamin D status in healthy
Omani women of
childbearing age
Vitamin D Status in Pregnant
Omanis
25(OH)2 D level <50 nmol/L
Vitamin D deficiency was
present in 34 (33%) of
patients (25(OH)2 D <25
nmol/L), ‘at risk’ levels
were found in 67 (65%)
patients (25(OH)2 D 25–50
nmol/L); two patients (1.9%)
had values between 50 and
75 nmol/L.
(Al-Kindi,
2011).
(Al Kalbani et
al. 2011)
United Arab
Emirates
Efficacy of daily and monthly
high-dose calciferol in
vitamin D-deficient
nulliparous and lactating
women
25(OH)2 D < 50 nmol/L
(Saadi et al.
2007)
Qatar
Vitamin D status in health
care professionals in Qatar
Vitamin D concentration
was lower in females (25.8
nmol/L) than in males (34.3
nmol/L).
(Mahdy et al.
2010)
Turkey
Sunlight exposure and
vitamin D deficiency in
Turkish women
25(OH)2 D were 15.2± 12.1
nmol/L
(Alagöl et al.
2000)
Table 4.1: Vitamin D deficiency in some countries

52
with vitamin D deficiency and secondary hyperparathyroidism.
Based on these data the frequency distribution of calcium sensing receptor
gene in males showed 26% normal (AA), 56% heterozygous (AS) and 18% homozygous
(SS). Allele frequencies for A and S were 54% and 46% respectively. In females, 49.2%
normal (AA), 36.5% heterozygous (AS) and 14.29% 14.3% homozygous (SS). Allele
frequencies for A and S were 67.5% and 32.5% respectively. In comparing it to previous
works José et al. showed that the frequency distribution of calcium sensing receptor
gene was 69% for AA, 27% for AS and 4% for SS, with a prevalence of 82% for allele
A and 18% for allele S (José et al. 2006). In Hungarian postmenopausal women was
25.2% for presence S allele and 74.8% for absence of S allele (Takacs et al. 2002). We
noticed that the frequency of distribution of the normal allele is higher in both findings
than our finding which allele frequencies for A and S were 67.5% and 32.5%
respectively. Consequently, the percentage of polymorphism in Saudi population is
higher. If it’s not due to genetic effect, it could be either due to life style or age
differences since Takacs et al. and José et al. conducted their studies on postmenopausal
women. On the other hand our average age for male and female was 40 years.
We found no association of CASR rs1801725 polymorphism with BMD.
There are several studies that relate A986S polymorphism to BMD and are consistent
with our data. Takacs et al. was did not find an association between CASR A986S
polymorphism and BMD in Hungarian postmenopausal women (Takacs et al. 2002).
Young et al. assessed bone mass at baseline and after 2 years of calcium therapy in a
group of 135 postmenopausal women, observing no relationship in either case.
Furthermore, in Italian women no differences were observed (Cetani et al. 2003). In a

53
study of 1252 postmenopausal Australian women, they found no relation of the
polymorphism with bone mass and the presence of fractures due to fragility. In healthy
Chinese premenopausal women (Bollerslev et al. 2004) there were no significant
differences in the BMD or bone size of either the spine or hip between CASR
polymorphisms (Mo et al. 2004).
Same SNP of CASR was studied by Lorentzon et al. in young healthy girls
however showed contradictory result. The study was performed on subjects with S allele
who had lower BMD at the lumbar spine and total body (Lorentzon et al. 2001). They
found a correlation between CASR allele and BMD. Nevertheless Lorentzon et al.
wasn’t confident about the fact that CASR polymorphism had a direct effect on BMD.
The effect could be due to the amount of physical activity because the association
between CASR genotype and BMD disappeared after modifying the physical activity. In
this study, there were no differences between the physical activities between the groups
on the other hand, the average age was different. Up to 60-80% of age-specific variation
in BMD is due to genetic factor (Kelley et al. 1995). Therefore, the contradictory result
could be either due to life style in Saudi Arabia, smoking habits etc.
There were no significant association observed between vitamin D levels
and CASR A986S polymorphism. The AS carriers showed higher levels of vitamin D
(31.96±23.65 nmol/L) compared to the SS genotype carriers (25.20±12.43 nmol/L).

54
In this study there were no significant association observed between CASR
A986S polymorphism and PTH. Which was consistent with the finding of Miedlich et
al. and He et al. for whom have reported no correlation of PTH with CaSR A986S
variant (Miedlich et al. 2001 and He et al. 2012).
Differences in the genetic background of mixed populations may alter the
outcome of association studies. However, our study population was homogeneously of
Saudi origin. Not only the multifactorial genetics but also environmental factors have an
influence on BMD. If the genetic effect was weak, the environmental factors may have
masked the actual genetic influence of the CASR gene in our association study.
In summary, we found no evidence to support a relationship between CASR
A986S polymorphism with BMD, vitamin D and PTH in adult Saudi males and females.
There are a number of limitation associated with this study one of them is a small size of
the population studied that would have influence on the statistical power of the analysis.

REFERENCES

56
REFERENCES
1- Alagöl F., Shihadeh Y., Boztepe H., Tankol R., Yarman S., Azizlerli H. (2000) Sunlight
exposure and vitamin D deficiency in Turkish women. J Endocrinol Invest 23:173–7.
2- Al Kalbani M., Elshafie O., Rawahi M., Al Mamari A., Al Zakwani A., Woodhouse N.
(2011) Vitamin D status in pregnant Omanis: A disturbingly high proportion of patients
with low vitamin D stores. SQU Med J 11:52–5.
3- Al-Kindi M.K. (2011) Vitamin D status in healthy Omani women of childbearing age:
Study of female staff at the Royal Hospital, Muscat, Oman. SQU Med J 11:56–61.
4- Aubin J.E. (1998) Advances in the osteoblast lineage. Biochem Cell Bio 76:899–910.
5- Bollerslev J., Wilson S.G., Dick I.M., Devine A., Dhaliwal S.S., Prince R.L. (2004)
Calcium-sensing receptor gene polymorphysm A986S does not predict serum calcium
level, bone mineral density, calcaneal ultrasound indices, or fracture rate in a large cohort
of elderly women. Calcif Tissue Int 74:12–17.
6- Bone H.G., Hosking D., Devogelaer J.P., Tucci J.R., Emkey R.D., Tonino R.P.,
Rodriguez-Portales J.A., Downs R.W., Gupta J., Santora A.C., Liberman U.A. (2004)
Ten years' experience with alendronate for osteoporosis in postmenopausal women. N
Engl J Med 350:1189–99.
7- Brown E.M., Gamba G., Riccardi D., Lombardi D., Butters R.R., Kifor O., Sun A.,
Hediger M.A., Lytton J., Hebert S.C. (1993) Cloning and characterization of an
extracellular Ca2+-sensing receptor from bovine parathyroid. Nature 366:575–80.
8- Brown E.M., Hebert S.C. (1997) Calcium-receptor-regulated parathyroid and renal
function. Bone 20:303–309.
9- Brown E.M., Pollak M., Hebert S.C. (1998) The extracellular calcium-sensing receptor:
its role in health and disease. Annu Rev Med 49:15–29.

57
10- Brown E.M. (2002) The pathophysiology of primary hyperparathyroidism. J Bone Miner
Res 17(Suppl 2):N24–9.
11- Burr D. B. (2002) Targeted and nontargeted remodeling. Bone 30: 2-4.
12- Cetani F., Pardi E., Borsari S., Vignali E., Dipollina G., Berge V. Adami S., Pinchera A.
(2003) Calcium-sensing receptor gene polymorphism is not associated with bone mineral
density in Italian postmenopausal women. Eur J Endocrinol 148:603–607.
13- Chikatsu N., Fukumoto S., Takeuchi Y., Suzawa M., Obara T., Matsumoto T., Fujita T.
(2000) Cloning and characterization of two promoters for the human calcium-sensing
receptor (CaSR) and changes of CaSR expression in parathyroid adenomas. Bio Chem
275:7553–7.
14- Delmas P.D., Eastell R., Garnero P., Seibel M.J., Stepan J. (2000) The use of biochemical
markers of bone turnover in osteoporosis. Committee of Scientific Advisors of the
International Osteoporosis Foundation. Osteoporoses 11 (Suppl 6):S2-S17.
15- Dvornyk V., Peng-yuan L., Ji-rong L., Yuan-Yuan Z., Shu-feng L., Recker R., Hong-wen
D. (2005) Contribution of genotype and ethnicity to bone mineral density variation in
Caucasians and Chinese: a test for five candidates genes for bone mass. Chin Med J 118:
1235–1244.
16- Elsammak M.Y., Al-Wossaibi A.A., Al-Howeish A., Alsaeed J. (2011) High prevalence
of vitamin D deficiency in the sunny Eastern region of Saudi Arabia: a hospital-based
study. East Mediterr Health 17:317–22.
17- Fellner SK, Parker L. (2002) A Ca2þ-sensing receptor modulates shark rectal gland
function. Bio 205:1889-1897.
18- Forman J.P., Giovannucci E., Holmes M.D. Bischoff-Ferrari H.A., Tworoger
S.S., Willett W.C., Curhan G.C. (2007) Plasma 25-hydroxyvitamin D levels and risk of
incident hypertension, 49:1063–1069.
19- Fukumoto S., Chikatsu N., Okazaki R., Takeuchi Y., Tamura Y., Murakami T., Obara
T., Fujita T. (2001) Inactivating mutations of calciumsensing receptor results in
parathyroid lipohyperplasia. Diagn Mol Pathol 10:242-247.

58
20- Garrett J.E., Capuano I.V., Hammerland L.G., Hung B.C., Brown E.M., Hebert SC.,
Nemeth E.F., Fuller F. (1995) Molecular cloning and functional expression of human
parathyroid calcium receptor cDNAs. J Bio Chem 270(21):12919–25.
21- Glover S.J., Garnero P., Naylor K., Rogers A., Eastell R. (2008) Establishing a reference
range for bone turnover markers in young healthy women. Bone 42:623–630.
22- Glover S.J., Gall M., Schoenborn-Kellenberger O., Wagener M., Garnero P., Boonen S.,
Cauley J.A., Black D.M. (2009) Establishing areference interval for bone turnover
markers in 637 healthy, young, premenopausal women from the United Kingdom,
France, Belgium, and the United States, J Bone Miner Res 24: 389–397.
23- Hansen J.T., Brown E.M. (2005) The calcium-sensing receptor in normal physiology and
pathophysiology: a review, Crit. Rev. Clin. Lab. Sci 42: 35–70.
24- He Y., Han L., Li W., Shu X., Zhao C., He Y., Bi M., Li Y., Sun C. (2012) Effects of the
calcium-sensing receptor A986S polymorphism on serum calcium and parathyroid
hormone levels in healthy individuals: A meta-analysis. Gene 491, 110-115.
25- Heath III H., Odelberg S., Jackson C.E., Teh B.T., Hayward N., Larsson C., Buist
N.R., Krapcho K.J., Hung B.C., Capuano I.V., Garrett J.E., Leppert M.F. (1996)
Clustered inactivating mutations and benign polymorphisms of the calcium receptor gene
in familial benign hypocalciuric hypercalcemia suggest receptor functional domains. J.
Clin. Endocrinol. Metab 81, 1312–1317.
26- Hendy G.N., D’Souza-Li L., Yang B., Canaff L., Cole D.E. (2000) Mutations of the
calcium-sensing receptor (CASR) in familial hypocalciuric hypercalcemia, neonatal
severe hyperparathyroidism and autosomal dominant hypocalcemia. Hum Mut 16:281–
296.
27- Holt G., Smith R., Duncan K., Hutchison J.D., Reid D. (2009) Changes in population
demographics and the future incidence of hip fracture. Injury 40:722.
28- Janicic N., Soliman E., Pausova Z., Seldin M.F., Riviere M., Szpirer J., Hendy G.N.
(1995) Mapping of the calcium-sensing receptor gene (CASR) to human chromosome
3q13.3-21 by fluorescence in situ hybridization, and localization to rat chromosome 11
and mouse chromosome 16. Mamm Genome 6:798–801.

59
29- Johnell O., Kanis J.A. (2006) An estimate of the worldwide prevalence and disability
associated with osteoporotic fractures. Osteoporos Int 17:1726–33.
30- Jose N., Sanz J. L., Silva A., Justo J. S., Velasco I., E. Dueã A. (2006) Calcium-sensing
Receptor Gene A986S Polymorphism and Bone Mass in Hypertensive Women. Archives
of Medical Research 37: 607-611.
31- Kleerekoper M., Villanueva A., Stanciu R., Rao D. J., Parfitt S. (1985) The role of three
dimensional trabecular microstructure in the pathogenesis of vertebral compressive
fractures. Calcif Tissue Int 37:594–597.
32- Komuves L., Oda Y., Tu C.L., Chang W.H., Ho-Pao C.L., Mauro T., Bikle D.D. (2002)
Epidermal expression of the full-length extracellular calcium-sensing receptor is required
for normal keratinocyte differentiation. J Cell Physiol 192:45-54.
33- Lerolle N., Coulet F., Lantz B., Paillard F., Houillier P., Soubrier F., Gattegno B.,
Jeunemaitre X., Ronco P., Rondeau E. (2001) No evidence for point mutations of the
calcium-sensing receptor in familial idiopathic hypercalciuria. Nephrol Dial Transplant
16:2317-2322.
34- Li X., Staszewski L., Xu H., Durick K., Zoller M., Adler E. (2002) Human receptors for
sweet and unami taste. Proc Natl Acad Sci USA 99:4692-4696.
35- Lips P. (2001) Vitamin D deficiency and secondary hyperparathyroidism in the elderly:
consequences for bone loss and fractures and therapeutic implications. Endocrine
Reviews 22: 477–501.
36- Lips P., Natasja M., Schoor V. (2011) The effect of vitamin D on bone and osteoporosis.
Research clinical Endocrinology & amp; Metabolism 25,585-591.
37- Lorentzon M., Lorentzon R., Lerner U.H., Nordstrom P. (2001) Calcium sensing
receptor gene polymorphism, circulating calcium concentrations and bone mineral
density in healthy adolescent girls. Eur J Endocrinol 144:257–261.
38- Mahdy S., Al-Emadi S.A., Khanjar I.A., Hammoudeh M.M., Sarakbi H.A., Siam A.M.
(2010) Vitamin D status in health care professionals in Qatar. Saudi Med J 31:74–7.

60
39- Martin R.B. (2002) Is all cortical bone remodeling initiated by micro damage. Bone 30:8-
13.
40- Martin T.J., Seeman E. (2008) Bone remodelling: its local regulation and the emergence
of bone fragility. Best Pract Res, Clin Endocrinol Metab 22(5):701–22.
41- Mathias R.S., Mathews C.H., Machule C., Gao D., Li W., Denbesten P.K. (2001)
Identification of the calcium-sensing receptor in the developing tooth organ. J Bone
Miner Res 16:2238-2244.
42- Miedlich S., Lamesch P., Mueller A., Paschke R. (2001) Frequency of the calcium
sensing receptor variant A986S in patients with primary hyperparathyroidism .Eur. J.
Endocrinol 145:421–427.
43- Mo X.Y., Zang Y.Y., Lei S.F., Deng H.W. (2004) A986S polymorphism of calcium
sensing receptor gene is not related to bone mineral density or bone size in
premenopausal Chinese women. Di Yi Jun Yi Da Xue Xue Bao 24, 1097–1122.
44- Mundy G.R. (1999) Cellular andmolecular regulation of bone turnover. Bone 24:35S–8S.
45- Nelson G., Hoon M.A., Chandrashekar J., Zhang Y., Ryba N.J., Zuker C.S. (2001)
Mammalian sweet taste receptors. Cell 106:381-390.
46- Parfitt A.M. (2002) Targeted and nontargeted bone remodeling: relationship to basic
multicellular unit origination and progression. Bone 30:5–7.
47- Pearce S.H.S., Bai M., Quinn S.J., Kifor O., Brown E.M., Thakker R.V. (1996)
Functional characterization of calcium-sensing receptor mutations expressed in human
embryonic kidney cells, J. Clin. Invest 98, 1860–1866.
48- Pollack M.R., Brown E.M., Estep H.L., McLaine P.N., Kifor O., Park J., Herbert S.C.,
Seidman C.E., Seidman J.G. (1993) Mutations in the human Ca(2þ)-sensing receptor
gene cause familial hypocfalciuric hypercalcaemia and neonatal severe
hypoparathyrodism. Cell 75:1297-1303.

61
49- Potts J.T. (2005) Parathyroid hormone: past and present. J Endocrinol 187.
50- Raisz L.G. (2005) Pathogenesis of osteoporosis: concepts, conflicts, and prospects. J
Clin Invest 115:3318–25.
51- Raue F., Haag C., Schulze E., Frank-Raue K. (2006) The role of the extracellular
calciumsensing receptor in health and disease. Exp Clin Endocrinol Diabetes 114: 397–
405.
52- Roschger P., Dempster D.W., Zhou H., Paschalis E.P., Silverberg S.J., Shane E.,
Bilezikian J.P., Klaushofer K. (2007) New observations on bone quality in mild primary
hyperparathyroidism as determined by quantitative backscattered electron imaging. J
Bone Miner Res 22.
53- Saadi H.F., Dawodu A., Afandi B.O., Zayed R., Benedict S., Nagelkerke N. (2007)
Efficacy of daily and monthly high dose calciferol in vitamin D deficient nulliparous and
lactating women. Am J Clin Nutr 85:1565–71.
54- Takacs G., Speer K., Bajnok A., Tabak Z., Nagy C., Kovacs K., Lakatos P. (2002) Lack
of association between calcium-sensing receptor gene A986S polymorphism and bone
mineral density in Hungarian postmenopausal women. Bone 30: 849-852.
55- Thompson M.D., Burnham W.M., Cole D.E.C. (2005) The G protein-coupled receptors:
pharmacogenetics and disease. Crit Rev Clin Lab Sc 42: 311–92.
56- Watts N.B. (1999) Clinical utility of biochemical markers of bone remodeling. Clinic
Chem 45:1359–68.
Young R., Wu F., Van de Water N., Ames R., Gamble G., Reid I.R. (2003) Calcium sensing
receptor gene A986S polymorphism and responssiveness to calcium supplementation in
postmenopausal women. J Clin Endocrinol Metab 88: 697–700.