odour sensing by insect olfactory receptor neurons
TRANSCRIPT

ODOUR SENSING BY INSECT OLFACTORY RECEPTOR NEURONS: MEASUREMENTS OF ODOURS BASED ON ACTION POTENTIAL ANALYSIS
MATTIHUOTARI
Faculty of Technology,Department of Electrical and
Information Engineering,University of Oulu
OULU 2004


MATTI HUOTARI
ODOUR SENSING BY INSECT OLFACTORY RECEPTOR NEURONS: MEASUREMENTS OF ODOURS BASED ON ACTION POTENTIAL ANALYSIS
Academic Dissertation to be presented with the assent ofthe Faculty of Technology, University of Oulu, for publicdiscussion in the Auditorium TA105, Linnanmaa, on December 3rd, 2004, at 12 noon
OULUN YLIOPISTO, OULU 2004
Copyright © 2004University of Oulu, 2004
Supervised byProfessor Vilho Lantto
Reviewed byProfessor Uwe T. KochProfessor Jukka Lekkala
ISBN 951-42-7590-X (nid.)ISBN 951-42-7591-8 (PDF) http://herkules.oulu.fi/isbn9514275918/
ISSN 0355-3213 http://herkules.oulu.fi/issn03553213/
OULU UNIVERSITY PRESSOULU 2004

Huotari, Matti, Odour sensing by insect olfactory receptor neurons: measurements ofodours based on action potential analysis Faculty of Technology, University of Oulu, P.O.Box 4000, FIN-90014 University of Oulu, Finland,Department of Electrical and Information Engineering, University of Oulu, P.O.Box 4500, FIN-90014 University of Oulu, Finland 2004Oulu, Finland
AbstractThis thesis is a study of the odour responses of insect olfactory (or odorant) receptor neurons (ORN)of blowfly (Calliphora vicina), mosquito (Aedes communis), fruitflies (Drosophila melanogaster andD. virilis) and large pine weevil (Hylobius abietis). A power-law dependence (similar to Stevens' lawin psychophysics) was obtained for the action potential rate of ORN responses vs. odourconcentration in measurements with metal microelectrodes from blowfly ORNs and an analysissystem was developed for the extracellularily recorded action potentials (or nerve pulses).
Odour exposure sequences were used to study action potential rates quantitatively as a function ofodour concentration in air exposure. For an odour exposure sequence, a known initial amount of theodour compound in a filter paper inside a Pasteur pipette at the beginning of repeated exposurescaused a gradual dilution of the odour concentration in the exposure sequence. The concentration ateach exposure was calculated according to the discrete multiple headspace extraction and dilution(DMHED) method. The estimated odour concentration was assumed to obey in the method anexponential law with respect to the exposure number in the sequence. Despite that manyuncontrollable parameters remain for measuring quantitatively the characteristics of the ORNs, theresults obtained, e.g., sensitivity, specificity, adaptability, and the power-law realation are bothbiologically and technically very interesting.
A time-to-voltage converter (TVC) was utilized for the response analysis in determining actionpotential intervals originating from a single ORN. A precision analysis of TVC was also performed.
With the mosquito (Aedes communis), fruitflies (Drosophila melanogaster and D. virilis) andlarge pine weevil (Hylobius abietis) antennae were tested for inhibitory and excitatory effects to findout repellents and attractants. Human sweat was found to cause strong stimulus exposure in theresponses of the mosquito ORNs and Neutroil® caused inhibitory responses in pine weevil ORNs,respectively.
The power-law exponents for blowfly ORNs were about 0.19 in the case of 1-hexanol (HX), 0.065in the case of 1,4-diaminobutane (14DAB) and 0.32 in the case of butyric acid (BA). Thecorresponding Stevens' law exponent values 0.39 and 0.33 have been reported for HX and BA,respectively, by Patte et al. (1975).
Keywords: action potential, biosensing, large pine weevil, Neutroil®, odour sensing,olfactory receptor neuron, power law, time-to-voltage converter


Tuskinpa on toista tieteenhaaraa, jonka alalla on viime vuosikymmeninä tehty niin runsaasti uusia havaintoja ja
keksintöjä kuin biologian, »elämän tieteen», piirissä. Se on tästäkin syystä tiede, jonka luulisi kiinnostavan jokaista — ei ainoastaan alan ammattimiestä tai opiskelijaa vaan kaikkia,
jotka pohtivat elämän perustotuuksia ja ongelmia.
– Aarno Jalas (1941), 1. Elämän ongelmia (Biologia), Tietojen kirja, Werner Söderström osakeyhtiö, Porvoo.


Acknowledgement
The thesis is based on the experimental research work performed at the Department of Biophysics between the years 1991 and 1998, and on the analysis and modelling of the experimental results together with some test experiments performed at the Microelectronics and Materials Physics Laboratories of the Department of Electrical and Information Engineering between the years 1999 and 2004, in the University of Oulu, Finland. Four months in 1998, the author was happy to be as a research scientist in the Forestry and Forest Products Research Institute (FFPRI) of Japan in Tsukuba, Japan. From January 2000 to August 2002, the author was as a graduate student in the Infotech Oulu Graduate School.
At first, I would like to thank Professor Martti Mela for help in experimentations on insect olfactory receptor neurons. Especially, I wish to express my sincere gratitude to my supervisor Professor Vilho Lantto for his expert guidance and support and the possibility to find out the results of the experimental work. Because of his continuing interests the results of the thesis were discovered.
It is my great pleasure to thank Professor Uwe T. Koch and Professor Jukka Lekkala for reviewing the thesis and, especially, for their constructive suggestions on the thesis.
I would like also to thank Mr. Keijo Hägg in the Physics Workshop for his excellence in constructing experimental instruments at the beginning of the study. The students M. Kerttula and T. Kivelä in the Electronics Laboratory are acknowledged for their excellence in constructing the pulse-shaper instrument.
Especially, I would like to thank Dr. Kiyoshi Nakamuta and Dr. Tadakazu Nakashima for the excellent experience in the Department of Forest Entomology in the FFPRI and, in addition, I like to thank Professor Yutaka Ishigami owing to his kind introduction me to the interesting Japanese culture. I am also grateful to my colleagues in the Microelectronics and Materials Physics Laboratories for the pleasant atmosphere. I also thank Mr. Janne Rissanen for the revision of the English in the manuscript. I thank Kaisa, Pekka, Hanna, Ville, Henna, Lauri, Soili and Vesa for support and encouragement.
This work was financially supported by Jenny ja Antti Wihurin Säätiö foundation, Tauno Tönningin Säätiö foundation, and Infotech Oulu Graduate School and Yliopiston apteekin rahasto fund in the University of Oulu which are gratefully acknowledged.
Oulu, November 2004 Matti Huotari


List of Original Papers
The work is described in detail in the following publications, listed here in the order of the completion of the work:
I Huotari M, Honkala L, Ruikka V & Mela M (1996) Responses of mosquito olfactory biosensor to human sweat odours and odour chemicals. Proceedings of the 10th Nordic-Baltic Conference on Biomedical Engineering, June 9-13, Tampere, Finland, in Medical & Biological Engineering & Computing 34 (Supplement 1, Part 1):141-142.
II Huotari M & Mela M (1996) Insect olfactory biosensor for odour chemicals and human odours. Proceedings of the International Conference on Biomedical Engineering (BME’96), June 3-5, Hong Kong (Britt.), 1:108-111.
III Huotari M & Mela M (1996) Blowfly olfactory biosensor’s sensitivity and specificity. Sensors and Actuators B: Chemical 34(1-3): 240-244.
IV Huotari M & Mela M (1997) Insect olfactory biosensors for amines and human sweat odours. Proceedings of 18th Annual International Conference of the IEEE Engineering in Medicine and Biology Society, Amsterdam, The Netherlands, 1:95-96.
V Huotari M (2000) Biosensing by insect olfactory receptor neurons. Sensors and Actuators B: Chemical 71(3): 212-222.
VI Huotari M, Jaskari M, Annila E & Lantto V (2003) Responses of olfactory receptor neurons of the large pine weevil to a possible deterrent Neutroil® and two other chemicals. Silva Fennica 37(1):149-156.
In Papers I-III the measurements and the analysis of results were made by the author with the help of the students L. Honkala and V. Ruikka in counting the action potentials. For the action potential analysis, the pulse-shaper instrument was made by M. Kerttula and T. Kivelä in the Electronics Laboratory. In Papers IV-V the measurements and the analysis of results were made mainly by the author. In Paper V, Professor Vilho Lantto advised also in the analysis of the experimental results and in the preparation of the manuscript. In Paper VI, the measurements and the analysis of results were made mainly by the author together with M. Jaskari. All the insects were gathered by Professor E. Annila (in
Tuusula) and M. Jaskari (in Haukipudas). The gender of the insects was determined by Professor Annila and Professor Lantto advised in the preparation of the manuscript.
Other related work by the author
This is a summary of other work on insect olfactory biosensing done by the author together with co-workers during 1995-2003:
I Huotari M & Mela M (1995) Measurement, stimulation, signal and response analysis methods of biological odour sensor. Proceedings of the 10th World Clean Air Congress, May 28-June 2, Espoo, Finland, 2 (Atmospheric Pollution): 232-4.
II Huotari M, Jaskari M, Honkala L, Ruikka V & Mela M (1996) Responses analysis of insect olfactory biosensor. Proceedings of the 10th Nordic-Baltic Conference on Biomedical Engineering, June 9-13, Tampere, Finland, in Medical & Biological Engineering & Computing 34 (Supplement 1, Part 1): 149-150.
III Huotari M & Mela M (1996) Time-to-voltage conversion of action potential trains of an insect olfactory sensor. Proceedings of the 13th Biennial International Conference BIOSIGNAL’96, June 24-27, Brno, Czech Republic, 1:234-236.
IV Huotari M, Meyer-Rochow S & Mela M (1998) Analysis of response characteristics of insect olfactory biosensors. Proceedings of 14th Biennial International Conference BIOSIGNAL’98, June 23-25, Brno, Czech Republic, 1: 142-144.
V Huotari M (1999) Insect olfactory neurosensors. Proceedings of the 11th Nordic-Baltic Conference on Biomedical Engineering, June 6-10, Tallinn, Estonia, in Medical & Biological Engineering & Computing 37 (Supplement 1):224-225.
VI Moro SD & Huotari M (1998) Clock-spiking cells not only in the eye of the fly, but also in the antenna! Acta Neurobiol. Exp. 58: 277-281.
VII Nakamuta K, Huotari M, Usha Rani P, Torkoro M & Nakashima T (1999) Olfactory responses of a predatory beetle Trogossita japonica to monoterpenes from the host tree of its prey. Abstract Book of the 16th Annual Meeting of the International Society of Chemical Ecology, November 13-17, Marseille, France, P-90.
VIII Nakashima T, Nakamuta K, Huotari M, Ueda A, Fujita K, Uurano T & Tokoro M (1999) Predatory beetle, Trogossita japonica, is attracted to volatile from pine trees infested with prey insects. Abstract Book of the 8th European Ecological Congress (EURECO'99), September 18-23, Halkidiki, Greece, P-107.
IX Huotari M (1999) Extracellular action potential detection and analysis by a multispike detector. Proceedings of the 1999 Finnish signal processing symposium, FINSIG’99, May 1, Oulu, Finland, P-10.
X Huotari M & Lantto V (2000) Insect olfactory biosensing elements. Proceedings of Envirobiosens, New Trends in Biosensing for Environmental Applications, May 14-17, Corsica, France, p. 23.
XI Huotari M & Lantto V (2001) Action potential analysis by real time DSP hardware and software for odour exposure responses. Proceedings of the 2001 Finnish signal processing symposium, FINSIG’01, June 5, Espoo, Finland, p. 25-27.

XII Huotari M & Lantto V (2002) Action potential rate analysis in responses produced by insect olfactory receptor neurons. Abstracts of Working Group Meeting on Pheromones and Other Semiochemicals in Integrated Production, September 22-27, Sicily, Italy, p. 88-89.
XIII Huotari M & Lantto V (2003) Odours biosensing with insect olfactory receptor neurons. The 10th International Symposium on Olfaction and Electronic Nose ISOEN ’03, June 26-28, Riga, Latvia, EOP 31 Report.


List of symbols and abbreviations
α, α∗ decaying coefficient γ partition coefficient λ light wavelength c concentration cAMP cyclic adenosinemonophosphate (second messenger) cGMP cyclic guanosinemonophosphate (second messenger) e Euler's number (natural base) i integer number in a sequence, exposure number k multiplication factor (= α∗/α) m0 initial amount of matter n Stevens’ exponent, number of exposures ppb parts per billion (10-9) ppm parts per million (10-6) pps pulses per second pptr parts per trillion (10-12) ppq parts per quadrillion (10-15) 14DAB 1,4-diaminobutane 15DAP 1,5-diaminopentane AC alternating (current) signal A/D analogue to digital conversion AP action potential APR action potential rate AU arbitrary unit BA butanoic acid BioFET modified FET by coupling its gate with biological elements (Schöning
MJ & Poghossian A 2002) CNS central nervous system DC direct (current) signal DEET N,N-diethyl-3-toluamide DMHED discontinuous multiple headspace extraction and dilution DSP digital signal processor
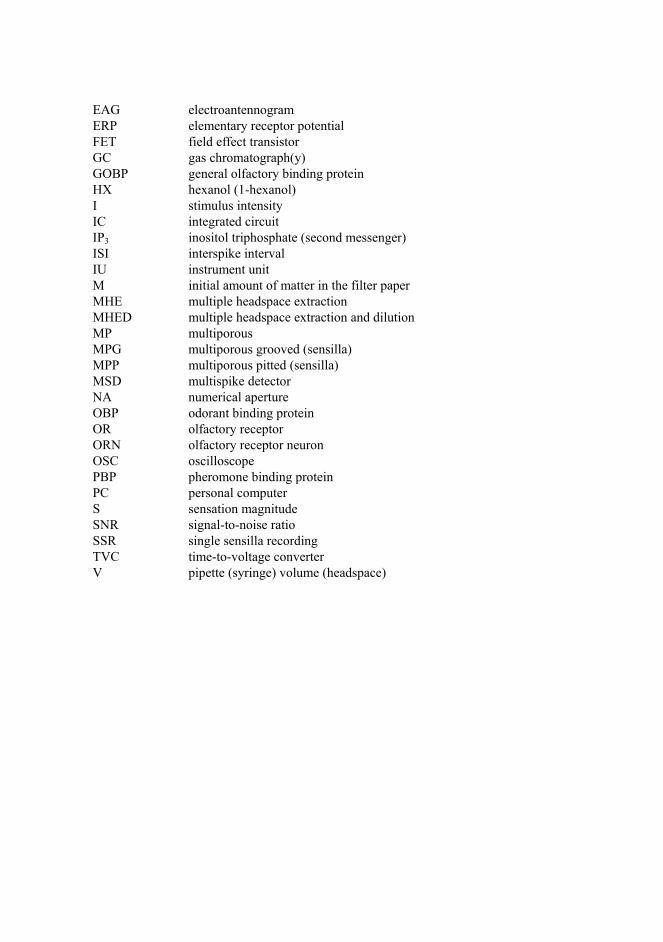
EAG electroantennogram ERP elementary receptor potential FET field effect transistor GC gas chromatograph(y) GOBP general olfactory binding protein HX hexanol (1-hexanol) I stimulus intensity IC integrated circuit IP3 inositol triphosphate (second messenger) ISI interspike interval IU instrument unit M initial amount of matter in the filter paper MHE multiple headspace extraction MHED multiple headspace extraction and dilution MP multiporous MPG multiporous grooved (sensilla) MPP multiporous pitted (sensilla) MSD multispike detector NA numerical aperture OBP odorant binding protein OR olfactory receptor ORN olfactory receptor neuron OSC oscilloscope PBP pheromone binding protein PC personal computer S sensation magnitude SNR signal-to-noise ratio SSR single sensilla recording TVC time-to-voltage converter V pipette (syringe) volume (headspace)
Contents
Abstract Acknowledgements List of original papers List of symbols and abbreviations Contents 1 Introduction ...................................................................................................................17
1.1 Searching for a biological olfactory sensor ............................................................17 1.2 The motivation of this work ...................................................................................20
2 Principles of insect olfaction .........................................................................................22 2.1 Structures of insect olfactory sensilla .....................................................................22 2.2 Insect olfactory receptor neurons............................................................................25 2.3 Single sensillum recordings....................................................................................26 2.4 Time-varying responses of insect olfactory receptor neurons.................................28 2.5 Insect olfactory coding ...........................................................................................28 2.6 Insect olfactory repellents, deterrents and attractants .............................................33 2.7 Insect olfactory behaviour ......................................................................................34
3 Olfactory receptor neurons as biological sensors ..........................................................35 3.1 Information processing in the olfactory receptor neurons ......................................37 3.2 Limitations of ORNs as true biological sensors .....................................................38 3.3 Odour exposure delivery to insect ORNs by a headspace technique......................38
4 Materials and methods...................................................................................................41 4.1 Insects .....................................................................................................................42 4.2 Electrophysiological recordings and odour exposure .............................................42 4.3 Data analysis...........................................................................................................45 4.4 Power law for action potential rate vs. odour concentration...................................49
5 Results and discussion...................................................................................................51 5.1 Hexanol sensing......................................................................................................51 5.2 Gas chromatography tests of DMHED method with hexanol ................................56 5.3 Diaminobutane sensing...........................................................................................59 5.4 Butyric acid sensing................................................................................................61 5.5 Odour amounts in exposures and power-law exponents.........................................63

5.6 Neutroil® tests with large pine weevil ORNs..........................................................66 6 Conclusions ...................................................................................................................67 References

1 Introduction
1.1 Searching for a biological olfactory sensor
Insects have a good sense of olfaction. Their olfactory organs are located in the antenna on the head and in the palps near the mouth. The insect antenna is a very special biological organ containing over a thousand olfactory receptor neurons (ORNs) which have an olfactory ability to sense odour chemicals with remarkable sensitivity and specificity and to code both chemical exposure and other external physical stimuli. The hearts of the olfactory unit are ORNs that have specialized in sensing an immense variety of odour chemicals. They identify very exactly the odorant exposure, its concentration and the exposure time, for example. Different insects have different odour chemicals for which they have specific ORNs. The ORNs may have a coding mechanism which originates from the insect genes (de Bruyne et al. 2001).
Evolution has engendered very specific and highly sensitive biosensing principles for sensing specific odours, e.g. in canines and insects. Canine olfactory sense can be utilised, for example, as evidence in court proceedings. Here, however, we are interested in the insect olfaction only, which is important to know for biosensor purposes and for controlling pest insects, for example. In the evolutionary process the insect olfactory sense has adapted to sense pheromones. A pheromone is a volatile aphrodisiac chemical which is secreted by a female insect. Different insects have different sex pheromones for which they have specific ORNs. With this chemical an insect is adjusted purely and simply to aim for procreation. For this purpose a female insect sends the gender-specific information by the pheromone to male members of the same species. According to this pheromone message a male can locate a female insect.
The pheromone message is received and transduced by the ORNs in the olfactory sensilla. The olfactory organs are covered with these olfactory sensilla which are tuned to catch pheromones, especially in moths. Inside of an olfactory sensillum there are between one and ten or more ORNs depending on an insect species. The functions of ORNs offer the olfactory ability to find food, procreate and escape enemies as a response to their specific chemicals.

18
Philosophically, it is difficult and challenging to define an odour without a measurement. We are familiar with the odours of fresh and decaying fish, coffee, wine, and meat etc., but we do not know the different compounds causing the odour. The real world is very complex and different from that which we can recognize by our human senses or by responses of insect olfactory receptor neurons. From experience we know that a definite odour is composed of molecules which have withdrawn from the odour source so that those molecules are a part of the odorous object. For a task to unify a human experience with electrophysiological measurements from ORNs, we need to be able, at least, to connect some basic odours with ORN responses to odours, like diamine (1,4-diaminobutane), alcohol (hexanol), an organic acid odour (butanoic acid), ester, ketone or aldehyde. The listing is long if complete proof.
In organic agriculture and winegrowing many pheromones are utilized for sampling insect population densities and for pest insect control. In addition, plant volatiles mixed with sex pheromones can cause mating disruption (Ochieng et al. 2002). Insecticide applications are still the main control method for pest insects. However, the pheromone method has been adopted by winegrowers and horticulturists in integrated biological control. Many pheromones can be utilized for targeting specific pest insects and limiting their population, for example, by dispersing pheromones or the pheromone analogues embedded in a carrier matrix. This technical intervention disturbs the communication systems of the pest insect and so disrupts the mating cycle in vineyards or greenhouses. In the Internet databases of chemical components identified in pheromone glands of female Lepidoptera and other chemicals attractive to a specific insect are actively updated.
Multiple exposure molecules can bind themselves to many OR molecules. For example, a certain type of an odorant molecule can bind itself to multiple Drosophila ORs (Stocker 2001). Binding of odorant molecules to ORN dendrites can cause neural activity called an elementary receptor potential (ERP), transepithelial potential and transepithelial resistance change (Pophof & Naters 2002). The ERP recordings of insect ORNs can be realized by means of glass capillary microelectrodes. These electrodes transduce the ionic current flow of ERPs into electron flow. On one hand this flow causes potentials which are generated by ion channel openings. On the other hand these openings are caused by only a single odorant molecule. Ultimately this is also the minimum of the concentration (Pophof & Naters 2002). According to Minor & Kaissling (2003), ORNs of the silk moth respond to a single odour molecule with a measurable discrete bump lasting a few milliseconds.
More pronounced neural activity in the insect ORNs can be measured by means of metal microelectrodes, such as etched tungsten wire electrodes. In ORNs the measured signals can be continuous, i.e., graded receptor potentials which compose an electroantennogram (EAG) because they are measured over the whole antenna. More distinct activity can be defined by extracellular action potential measurements. The action potentials (APs) are discrete and digital like waveforms which are spontaneously generated by an ORN. They can be measured from a single sensillum in single sensillum recordings (SSR) at the peripheral sensory level. From an analytical point of view both signals (EAG, SSR) can be utilized to yield a single value to meet a specific measurement requirement of an odorant concentration. In insect olfactory measurements there are many variables in addition to the binding of the odorant to the OR molecule. For
19
example, the sensor responses depend on the microelectrode recording site and contact with the tissue. In addition, electrode noise can interfere in the successive experiments within the measurement series.
Actually, insects do not measure their surroundings at all, but technically their ORNs can be utilized for sensitive biosensing purposes, such as odour discrimination. The sensory information can also be recorded from brain tissue in laboratories whereas EAG and SSR devices can additionally be portable (Sauer et al. 1992). A specific signal analysis system exploiting the output signal of living biosensors could give an overall view about the odour exposure in real time. The biosensor responses can correlate well with the odorant concentrations, and there are plenty of different kinds of biological sensors in the nature. For example, the sense of olfaction in fruitflies (Drosophila) is sensitive to an extraordinary number of odorants. Their sense could be utilized for many measurement purposes in agriculture, medicine, and environmental safety.
In response measurements by insect olfactory sensing there is typically low level noise. In a controlled odour exposure the ORNs transduce adequate external stimuli into action potentials. An excitatory response expresses itself by increasing the stimulated action potential rate while an inhibitory response expresses itself by decreasing the spontaneous action potential rate. In the excitatory response the action potential rate is related to the exposure concentration. Exclusively only these ORNs can be utilized in the concentration measurements. The odorants which have not an inhibitory effect on the response can be observed, respectively. After a special exposure the stimulated action potential train of an ORN can terminate according to different dynamics, such as stopping, lasting longer, or generating a termination pattern (de Bruyne et al. 2001). The third possibility is that an ORN keeps its action potential rate unchangeable but stochastic during the odour exposure time. However, this ORN can respond to another odorant as well.
The olfactory transduction is preceded inevitably by an impingement of an odorant molecule with a transducing receptor molecule. The odorant molecules are externally delivered in exposures. In each ORN cell there is a special trigger zone called an axon hillock where APs are generated. From the dendrites the information is transduced into an axon hillock where action potentials trigger. Actually ORNs discharge action potentials after a certain number of olfactory receptor molecules have bound themselves with odour molecules and the threshold has been reached. In the hillock an analogue summation is carried out for incoming negative or positive graded potentials. The action potentials follow the graded receptor potentials. These both transmit and transfer external stimuli into CNS. In the ORNs, measured signals, i.e. the action potentials, are in the time window of 2-3 ms and they have amplitude between 100 and 1000 µV in the extracellular olfactory cell membrane.
In general, insects do not stay alive in SSR or EAG measurements for over 2 hours if the tip of the antenna is cut, and often the measurements are limited to half an hour. Thus, in new measurement conditions where the insect is intact, its lifetime may be over a workday long. If extended single sensillum and EAG recordings could be made possible, the utilisation of olfactory biosensors would be practical. According to EAG measurements the insect antennal responses are species-specific. Thus, EAG could have potential utility as a sensitive olfactory biosensor to many known compounds. For example, a Quadro-probe EAG system was utilized to monitor 20 different compounds

20
(Park et al. 2002). However, its complex measurement setup composed of five different insect species, namely Drosophila melanogaster, Heliothis virescens, Helicoverpa zea, Ostrinia nubilalis and Microplitis croceipes had only a short time of functioning (Park et al. 2002). In a simple measurement system the silk moth (Bombyx mori) EAG responses to pheromones have been found to be essentially linear on the log scale of the concentration between 10-3 and 100 µg/cm3 in air. The EAG threshold is about 1x10⁷
bombykol molecules in cm3 air, compared to the behavioural threshold of about 2x10² molecules in cm3. However, it has not been exploited as an olfactory sensor.
1.2 The motivation of this work
Although insect olfaction has attracted human attention already from the ancient times, only a few laboratories now have focused their investigations on insect olfaction. The study was begun in Seewiesen, Germany, at the Max-Planck-Institute for Behavioral Physiology, where the author of this thesis had an opportunity to visit for two weeks. The studies in Seewiesen on the structure and functions of insect olfactory organs have clarified many open questions. Olfactory research is also strongly represented in other international laboratories, like at the Yale University, Department of Molecular, Cellular, and Developmental Biology, USA. In Finland, the fly visual system has been the research focus of many university laboratories (Djupsund et at. 1995). The visual system has provided useful material also for the study of the fly olfactory system (Juusola et al. 1995). In Finland, entomological research has been behavioural without exception and no electrophysiological work outside the work presented in this thesis on ORNs has been published. On the contrary, the insect physiological research on ORNs is on the leading edge in Sweden and Norway (Mustaparta 2002, Stensmyr et al. 2003).
In this thesis action potentials are defined as the response signals measured from the insect antenna where sensilla contain ORNs. These ORNs were verified to be olfactory and the action potentials were elicited by the odour exposure. The action potential rate changed simultaneously with the odour exposure. A response was also defined as a change of the action potential rate. A quantitative offline method was developed to analyse these action potential rates in the response. In this method the response signal was characterized by an instantaneous action potential rate. Action potential rates were determined for each exposure by using the time-to-voltage conversion technique. Odour response characteristics were approximately related to the concentration and the odour quantity at the exposure was evaluated according to the discontinuous multiple headspace extraction and dilution (DMHED) method (Kazakevich et al. 2000). The main results were put forward and discussed from both measurement and methodological point of view.
In this work we studied insect olfactory receptor neurons responding to diamines, hexanol, and organic acids. The response recording was established on the conventional electrophysiological technique. Immobilization techniques were also developed for different insects recorded during the research work.
The aim of this thesis work has been to research and develop methods and devices for response measurement of insect chemoreceptor cells, especially of the insect olfactory
21
sense, and to use the applications as an odour measurement system based on action potential measurements. After the development of measurement and analysis systems, the insect olfactory receptor responses were recorded using both single cell recordings and electroantennograms of a blowfly (Calliphora vicina), mosquito (Aedes communis), and fruitfly (Drosophila virilis) to find out some quantitative parameters. These parameters indicate changes in olfactory responses to different odours. The stimulative effects, which caused responses in the insect olfactory receptor system, were evaluated based on the measurements. The aim was also to study possibilities to use the insect ORNs as live state biosensors. Mainly excitatory but also inhibitory properties were found. In practical measurements, it was asked how precise these “biosensors” could be in a quantitative and specific sense. It can also be asked how the information from a group of specific ion channels is integrated across receptor cells to give an inhibitory or an excitatory response when stimulated by an adequate odour stimulus. In addition, the research plan was broadened out to contain mosquitoes and some harmful forest insect pests. Insect biosensor study was stimulated by the superb speed of response, for instance to various diamines and alcohols. Some of the parameters studied were the response time and specificity for various gases, and some inhibitory effects.
2 Principles of insect olfaction
2.1 Structures of insect olfactory sensilla
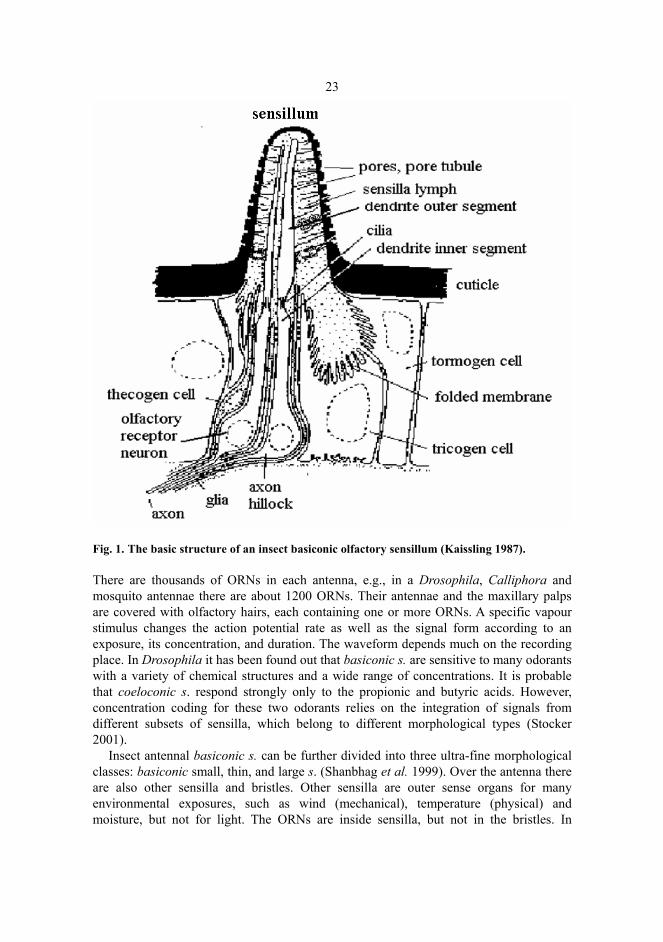
Insects have a hard cover with small hair-like structures everywhere. Almost all similar olfactory sensilla are located in the paired antennae pointing out from the forehead of an insect. The third antennal segment, which is called a funiculus, is covered by several thousands of small hairs, i.e. sensilla. The sensilla are usually hairs, pegs or various forms of plates. The funiculus is the third antennal segment which is a pure olfactory organ and densely covered with sensilla. Its sensilla can be divided into three main morphological classes: trichoidea, basiconic, and coeloconic sensilla (s.). Attempts have been made to replace the name coeloconic s. with a better one. The Latin names describe the structures. In addition to these sensilla there are intermediate sensilla which combine with a wall structure of trichoidea s. and with a dendritic branching pattern of basiconic s. Sensilla are outer sense organs for many environmental exposures. In addition to odours they monitor a wide range of physical and chemical stimuli and provide the site for neural components which have primary input to the CNS. An olfactory sensillum envelops one to several bipolar receptor neurons, such as ORNs, and auxiliary cells: thecogen, tricogen and tormogen cells, see Figure 1. These cells envelop the ORNs in each sensillum. (Shanbhag et al. 1999, 2000.)
In measurements the measuring electrode will not cause any damage to a single ORN in the measured sensillum, because the electrode is put gently to the surface contact and also the ORNs are well covered with the cuticle. The cuticle is composed of many molecular layers (Steinbrecht 1997).
23
Fig. 1. The basic structure of an insect basiconic olfactory sensillum (Kaissling 1987).
There are thousands of ORNs in each antenna, e.g., in a Drosophila, Calliphora and mosquito antennae there are about 1200 ORNs. Their antennae and the maxillary palps are covered with olfactory hairs, each containing one or more ORNs. A specific vapour stimulus changes the action potential rate as well as the signal form according to an exposure, its concentration, and duration. The waveform depends much on the recording place. In Drosophila it has been found out that basiconic s. are sensitive to many odorants with a variety of chemical structures and a wide range of concentrations. It is probable that coeloconic s. respond strongly only to the propionic and butyric acids. However, concentration coding for these two odorants relies on the integration of signals from different subsets of sensilla, which belong to different morphological types (Stocker 2001).
Insect antennal basiconic s. can be further divided into three ultra-fine morphological classes: basiconic small, thin, and large s. (Shanbhag et al. 1999). Over the antenna there are also other sensilla and bristles. Other sensilla are outer sense organs for many environmental exposures, such as wind (mechanical), temperature (physical) and moisture, but not for light. The ORNs are inside sensilla, but not in the bristles. In

24
addition to odours the ORNs monitor a wide range of physical and chemical stimuli and provide primary input to the CNS. Depending on the sensory modality of a sensillum, any stimulation can be perceived according to its structural features and cuticular apparatus. Olfactory sensilla are modifications of a basic structure that is also found in the mechanical and gustatory sensilla. Morphologically at least ten major classes of olfactory sensilla have been identified based on their highly specific functional features, to mention mechanoreceptor, chemoreceptor, and multimodal sensilla. All of these classes exhibit different ultra-structures and are positioned in a stereotyped pattern over each organ (Nicastro et al. 1998).
Unlike the gustatory receptor neurons, the ORNs are not clustered into buds but dispersed inside of olfactory sensilla over the antenna. Many insect ORNs cannot be satisfactorily grouped as sensors of any particular odour, similarly as visual receptors for example. The sense organs of insects are typically classified on morphological and anatomical basis. There appears to be no strict control of the spacing between neighbouring sensilla. On blowfly antennae, there are three morphologically distinct types of olfactory sensilla arranged on the surface of the distal antennal segment called funiculus, which is a slender third distal part of the antenna. On the base of the funiculus there is a long larger hair called an arista. In the olfactory sensilla there are many pores in the wall, whereas in the gustatory sensilla there is only one opening in the tip. All the ORNs from the third antennal segment project directly to the olfactory lobe in the brain of the blowfly (Kaib 1974).
Antennal sensilla, which are located in the funiculus, are multiporous and have electronmicroscopical holes of 10 to 50 nm in diameter in their cuticle (Steinbrecht 1997). They are common also on the palps and known in the ovipositor of some groups (e.g. Musca autumnalis). They all are often modified into a variety of forms in different insect groups. According to micromorphological features they may be single-walled with hole tubules, or double-walled with spoke canals. Their surface can be pitted, for example, or it can be grooved longitudinally. Most of the multiporous sensilla (MP) can easily be identified as one type or another on this basis (i.e. multiporous pitted – MPP, or multiporous grooved - MPG). The MPP cuticles have many round holes or slits at the surface in common. These sensilla are sometimes innervated by many ORNs (exceeding 10), but usually only by 2 or 3 neurons. The dendrites are typically branched terminally and the branches ramify in close proximity to the sensillum cuticle (Zacharuk 1985). The MPP sensilla are considered to be purely olfactory. MPG sensilla are usually also olfactory, but they are not numerous in most insects and are located primarily on the funiculus. In the measurement of the activity of ORNs, the reliability of recorded action potentials by the extracellular technique is limited by their surroundings such as other sensilla or by an arista.
Since the olfactory sensilla are an integral part of the recording circuit, any cellular changes contribute uncontrolled variability in the recorded signals. ORNs have the cuticular process with multiple holes in the wall. The distal dendrites are multiply branched and communicate with the pores in specific arrangements. The ultrastructural details are still unclear and need to be interpreted. The holes of the olfactory sensilla contain uncertainties in electron microscope pictures and also unknown material that may offer facilitation to specific excitory compounds or resistance to the entry of inhibitory molecules (Steinbrecht 1997).
25
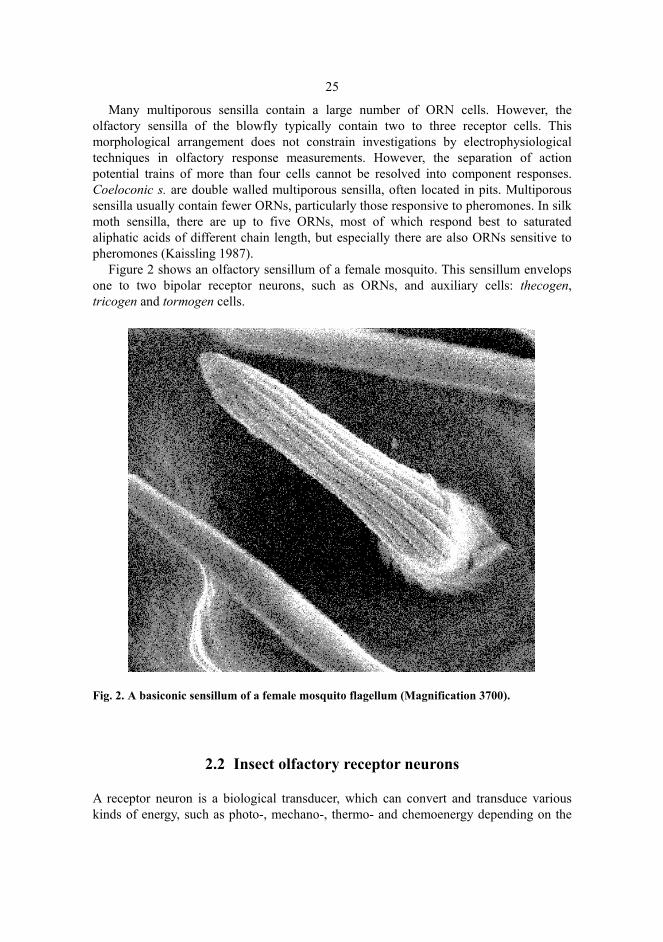
Many multiporous sensilla contain a large number of ORN cells. However, the olfactory sensilla of the blowfly typically contain two to three receptor cells. This morphological arrangement does not constrain investigations by electrophysiological techniques in olfactory response measurements. However, the separation of action potential trains of more than four cells cannot be resolved into component responses. Coeloconic s. are double walled multiporous sensilla, often located in pits. Multiporous sensilla usually contain fewer ORNs, particularly those responsive to pheromones. In silk moth sensilla, there are up to five ORNs, most of which respond best to saturated aliphatic acids of different chain length, but especially there are also ORNs sensitive to pheromones (Kaissling 1987).
Figure 2 shows an olfactory sensillum of a female mosquito. This sensillum envelops one to two bipolar receptor neurons, such as ORNs, and auxiliary cells: thecogen, tricogen and tormogen cells.
Fig. 2. A basiconic sensillum of a female mosquito flagellum (Magnification 3700).
2.2 Insect olfactory receptor neurons
A receptor neuron is a biological transducer, which can convert and transduce various kinds of energy, such as photo-, mechano-, thermo- and chemoenergy depending on the

26
neuron type. A neuron receives the energy from the external or internal environment and transforms this energy into action potentials. Steady-state or tonic receptor neurons, for example, generate APs as long as a particular stimulus, such as temperature, remains constant. Changing-state or phasic receptor neurons, on the other hand, respond to the variation in the intensity, concentration or position of the exposure. Receptor neurons are also classified according to stimulus location as exteroceptors, interoceptors and proprioceptors. Interoceptors report the state of the internal organs, such as the alimentary canal or blood pressure. Proprioceptors report the position and movements of the insect antennae and its position in space.
The antennae of insects possess many different ORNs probably apart from gustatory and mechanoreceptor neurons. Mechanoreceptor neurons can be distinguished among them, because their responses are caused by air flow and are closely related to the olfactory response. Wind is one of the carriers of odour molecules, and it is a mechanical stimulus to which a significant role of controlling the orientation towards the source of scent is attributed. (Kaissling & Kramer 1990, Mankin & Hagstrum 1995). Antennal receptor neurons reacting to the flow of clean air have been found in the deutocerebrum and protocerebrum in many insects. Each insect antenna possesses a large variety of ORNs for olfaction and other receptor neurons for other modalities. Mechanical activity of the antennae is also related to gustatory and olfactory perception. It is characteristic of both vertebrates and invertebrates, including insects. Active olfaction may either interrupt a continuous effect of the exposure or increase air circulation around the sensitive organ facilitating transport of odour molecules to and from the surface structures of ORNs. So far the role of antennal movements has not been fully elucidated (Gleesson et al. 1993). However, experiments on a decapod crustacean allow us to assume that the evaluation of stimulus parameters might depend both on the physiological properties of the insect receptor system and on the activity of the insect. Insect ORNs can be classified based on single sensillum recordings that are discussed in the following.
2.3 Single sensillum recordings
A single ORN measurement will not cause any damage in the measured sensillum, because the electrode is on the surface contact and action potentials can be obtained through a tiny microelectrode inserted near the base surface of the sensillum not in mechanical contact with the olfactory receptor neuron (measurement electrode in Figure 3). The sensillum can be verified an olfactory one by an odour exposure. Single sensillum recordings (SSR) show directly the responsiveness of the ORNs. Because the placement of a microelectrode tip is uncertain, it presumably is placed in the receptor lymph cavity or at the base of an olfactory sensillum. Recordings of action potentials from a single ORN usually contain action potentials from nearby cells in the same sensillum and noise spikes, too. The reference electrode (in Figure 3) is on the antenna tip. The action potentials generated near the reference electrode also appear in the recorded signal but have smaller amplitudes and the opposite phase. When analysis is done by a time-to-voltage converter, it causes an error in the action potential rate, and the SSRs must be

27
edited to obtain error-free results. Editing of action potential rates should not distort the results of the action potential analysis.
In a SSR the same ORN could respond to some odours by excitation and to others by inhibition. The excitatory and inhibitory response types cannot be associated with specific odours nor the ORNs. Nevertheless, the excitatory response type could be predominated in peripheral odour responses, each ORN being strongly excited by certain odours. The ORN response spectra are usually poorly selective to different odours in a group of similar odours (Kafka 1970). Among the ORNs many of them could be excited by several odours and some of them even excited by over ten odorants. Thus, finding a very sensitive and specific insect ORN needs searching for a sufficiently long time. However, in other animals all ORNs are not relatively accessible, such as on insects which have the ORNs very near the cuticular surface (Figure 3). The measurement microelectrode is inserted into the sensilla forest randomly. Based on the measured signal it is possible to decide the actual location.
Fig. 3. The measurement setup for single sensillum recordings in a blowfly antenna. The electrode 1 is the measurement electrode and electrode 2 the reference electrode, AC is for alternating signal (action potentials) and DC for direct signal (EAG) (Kaib 1974).
Intracellular recording from insect ORNs has not been achieved due to the small size of chemoreceptor neurons. The other limitation in measurements is that the ORNs are clustered together in variable numbers below a rigid cuticular formation. Thus, the recordings of olfactory responses have been exceptionally extracellular. Because the microelectrode may vary in position from one preparation to another, one must be careful in interpreting successful recordings. Resolving individual unit activity from the

28
recording containing mixed multiple cell activity is difficult, if not even possible, when the number of cells exceeds four.
From a measurement point of view the interface between the olfactory sensillum and metal microelectrode is very critical and problematic, because of the cell’s inherent sensitivity to any mechanical or chemical stimuli. It becomes an even larger problem when longer periods are recorded because the micromanipulators could drift or an animal can move with respect to the recording electrode. This drift does not concern the reference microelectrode which is inserted deep into the olfactory organ tissue. However, there can also be active ORNs near the reference electrode. In actual measurement the odour sensation is translated into the language of action potentials in insect ORNs during odour exposure at the site of the recording electrode. Because an insect antenna holds over one thousand ORNs less than one micrometre in diameter, the SSRs are very difficult to be transacted for intracellular electrophysiological measurements (Stocker 2001).
2.4 Time-varying responses of insect olfactory receptor neurons
There appear some interesting fast and also long-lasting time-varying phenomena in insect olfactory responses. The fast responses have been classified as excitatory (positive) and suppressive (negative) responses based on changes in the action potential rate. They typically last the exposure time. Also nil (no change at all) responses appear. The other time-varying responses are long-lasting, such as in mosquito ORNs to human sweat odour and blowfly ORN responses to decaying meat odour. In addition to temporally complex rate patterns, ORNs show variation in responses to the same repeated odour exposure. ORNs can respond to different odours with different modes of termination kinetics. Different rate patterns can also appear, but they have been studied very little. Some of the variability may originate from several sources which may be intrinsic properties of the ORNs, changes in odour exposure conditions, but also inexactness in the measurement place, and changes in the organ physiology as a result of prior odorant exposures. In an actual measurement, it could be ascertained which odours can be received by the insect and what kind of responses appear: excitation, inhibition or no change because of odour exposures.
2.5 Insect olfactory coding
According to the steric model of odour sensing each airborne molecule is detected and also sensed when it fits into a certain complimentary receptor site on the dendrite of the ORN. This "lock and key" coding at a molecular level is analogous to enzyme kinetics. Amoore (1970) has proposed that there are such primary odours as ethereal, camphoraceous, musky, floral, minty, pungent, and putrid. The molecular volume and shape similarity of these various odour chemicals were compared by making molecular models, by measuring the volume and by creating silhouette patterns. There were no computer programmes for molecular modelling available at that time. The steric theory is

29
well-suited to the idea that the odorant receptor proteins accept only certain odorants at a specific receptor site. The receptor is then activated by conformation change and it couples to the G-protein. After that the olfactory signal transduction cascade starts.
The characteristics of the receptor coding mechanisms are closely attached to the stochastic character of the action potential rate. No information can be coded into a flow of completely regularly time-spaced action potentials. It is well known, how variable an instantaneous action potential rate can really be, but little is known about the relation between the variability and the receptor nerve coding (Rieke et al. 1997). The variability of an instantaneous action potential rate around its mean value is an appropriate variable to encode time-varying stimulus parameters. For this research, traditionally a variety of tools for presenting action potential timing have been available. An inter-spike interval histogram (ISI) is a relevant way to present action potential data. It gives information on the integrative mechanisms underlying an action potential rate of ORNs. The precise pattern of each action potential series is of importance in the olfactory receptor information. However, only a little is known about odorant-olfactory receptor’s (OR) binding and recognition mechanisms. The genetic basis of general olfactory binding proteins (GOBPs) is known in each sensillum type. They can act as a ‘pre-receptor’ selection mechanism and limit the number of odorants which can interact with an ORN. Thus, odorant-binding proteins effect the odorant specificity of the ORNs (Vogt et al. 1999).
In ORNs the membrane potential can be instable. This instability appears in fluctuating spontaneous activity which causes variable instantaneous action potential intervals all the time. Almost every ORN is never silent for a longer period except during a specific odour stimulus, which quiets down action potentials of the target ORNs. Changes in action potential rate are caused by a change in the cell membrane potential. These changes are caused by the stimulants, in turn. In this way the ORNs inform the central nervous system about changes in the environment. Both excitatory and inhibitory properties of an ORN which are known to be intrinsic make it possible for an ORN to transduce and respond as a bioelectrical signal, i.e. a neural action potential to a adequate vapour or gas stimulus. These properties of the ORNs are a key point in the olfactory coding. The coding probably begins at the trigger level of an action potential. Then the action potential train is timed to a certain interval containing the transferred message. This message is transmitted along sensory neuron pathways to the CNS (Getz & Lutz 1999).
Olfactory sensation requires that the transduction of chemical exposure is transferred into action potentials. Action potentials are further coded so that they can transmit the chemical information. In literature, numerous coding models have been presented that predict the instantaneous action potential rate of an ORN in response to the quality and concentration of an odour exposure. These models explain the biophysical and biochemical kinetics of ligand–receptor binding and activation processes, and implicitly the initiation of second messenger cascades that lead to depolarisation and/or hyperpolarisation of the ORN membrane (Martin et al. 2002). Both of these polarizing processes are included in the most general form of the model, as well as a process that restores the voltage to its negative resting state. The action potential rate is assumed to be linearly dependent on the depolarisation voltage above a critical voltage value (de Bruyne et al. 2001).

30
The message of an odour exposure is transmitted through the insect olfactory organs by the label line principle. Different compounds have specific receptor molecules on the surface of ORNs, which send the odour exposure information into its line. Each line is in a convergent coupling with the olfactory centre. This label line principle may be significant in mosquito orientation and their searching behaviour (Davis 1984). The blowfly ORNs, which can be excited by diaminobutane and are inhibited by hexanol or butyric acid, may follow the label line principle (Mustaparta 1996). Similarly, some other ORNs can be excited by hexanol or butyric acid, but not inhibited by diaminobutane. Thus, the same single odorant can excite an excitatory response on one and an inhibitory response on another ORN. Such diversity of odour responses suggest that there may be more than one receptor molecule type for each odorant or that a specific receptor molecule could be involved in the transduction pathway of the ORNs. In the study of biological olfactory sensors, the electrophysiological response characteristics of the peripheral olfactory system have been examined on blowflies, especially its diamine ORNs, which have been neglected in the earlier studies (Kaib 1975). Diamines are very good attractants for blowflies, whereas hexanol and butyric acid are repellents. Only little is known about the coding of these odours in blowfly.
In insect olfactory sense, odorants have to travel through pores in the cuticle of the olfactory sensilla. Then they diffuse and are carried by an odorant binding protein (OBP) across the liquid environment of the receptor space, as well as bound with OBPs embedded in the dendritic membranes of the ORN. The details of each step or even their number are not known. OBPs have been found in pheromone ORNs in moths, among with other enzymes and they could be involved in metabolising of ‘once used’ odorants. Cofactors may also restore the OBPs from their oxidized state to their reduced state. Many odorants are received by insect olfactory sensillum and perceived by the ORNs inside them. The transport mechanism inside the sensilla is conducted by unknown transmitters. “Wick hypothesis” has been presented for the pore-tubule structure of the sensilla lymph. The ORN dendrites are surrounded by the sensillar lymph filling the internal cavity of an olfactory sensillum. The proteins binding the pheromones or the odours are highly concentrated in the sensilla lymph. Insect OBPs are supposed to carry a type of odorant molecule by which they signal of the presence of a food object. These OBPs can show up to 95% sequence identity between species. In contrast, the higher specificity of PBPs (pheromone binding protein) towards pheromones is related to a lower degree of sequence similarity. PBPs and OBPs share about 30% amino-acid identity. There are some arguments in favour of an active role of the OBPs and PBPs in ligand discrimination since specific pheromones have been associated with a specific PBP. The ability to detect the ligands gives the first role to the OBPs/PBPs in odour discrimination (Kaissling 1987, Getz 1999).
The Drosophila olfactory system has been researched intensively and there is up-to-date knowledge about the receptor mechanisms of olfaction on its genetic level. By an electron microscope a large proportion of fruitfly olfactory sensilla parallel with long-term and large-scale electrophysiological recordings has been studied and mapped. The classification of the odour response spectra of a complete set of sensilla (Stocker 2001, de Bruyne et al. 2001) has been made possible by the identification and expression patterns of candidate odorant receptors in the ORNs. In the central projections of neurons there are expressions of a given odorant receptor and an improved glomerular map of the

31
olfactory centre. The above studies found surprising parallels between the olfactory systems of flies and mammals. Both in Drosophila and in mammals, odorant receptor neurons appear to express only one type of receptor. Neurons expressing a given receptor are scattered in the olfactory tissues but their afferent ramifications converge to a few target glomeruli. The major difference between mammals and fruitflies refers to the number of receptors, neurons, and glomeruli which are largely reduced in the latter, and particularly in larvae. When activated in a combinatorial fashion, even a small set of olfactory sensor elements can accurately discriminate a vast array of odorants.
Both excitatory and inhibitory responses are produced by different odours, which can originate from different second messenger systems linked to the ion channel. The basic concept of chemosensitivity signifies that an ORN contains a molecule or a part of a molecule that is sensitive to a specific exposure molecule. These OBPs and PBPs are considered to be involved in the transport and inactivation of odour chemicals. Chemosensitive molecules of a second messenger system have been identified in the insect ORNs. Second messengers (cAMP, cGMP) and olfactory binding proteins (OBP, PBP) modulate the ion channels. They transmit a message between one place and another in an ORN where they open ion channels and initiate action potentials. Chemosensitive molecules have been identified on the olfactory receptor cell membrane, but the exact role of each molecular cascade in the process of chemotransduction is not known yet.
The roles of OBPs and PBPs have been researched in insect olfaction (Vogt et al. 1999). One proposed role is that they bind to lipophilic odorants in the aqueous/lipid mucous. They probably increase the odorant concentration and facilitate the transportation through the first sensillum pore layer to the receptor proteins in the olfactory membrane. In structures called pore tubules the odour molecules have access to the inside of olfactory sensillum. These tubular structures of the outer lipid layer of the sensillum traverse the procuticle, which mainly consists of chitin and protein.
In blowfly the biogenic amines such as putrescine (14DAB) and cadaverine (15DAP) are effective odorants. They are the breakdown products of some of the amino acids found in animals and in humans, too. There is clear evidence that blowflies seek for oviposition sites by orientating according to putrescine and cadaverine odours emanating from decaying meat. Olfactory cues are detected through an intricate pathway. The detection begins in basiconic sensillum on the funiculus surface. These sensilla detect also other different odorants.
Among biogenic amines cadaverine and putrescine are formed by microbial activity owing to the degradation of proteins and amino acids during decaying, and they are regarded as chemical indicators for spoilage and quality. Biogenic amines are also produced in small amounts as by-products in ethanol fermentation. These amines, especially diamines, evaporate and can also be detected by human sense of smell. Insect olfactory sensors can detect diamines in very low concentrations.
Dog nose and insect antennal sensilla represent extremely attractive sensors for the detection of vapours since they are specifically evolved to perceive biologically relevant compounds. These biological sensors are not linear and they are adapted to sense dynamically transient rather than long-lasting exposures. The olfactory receptor system has been evaluated with an adult male Spodoptera littoralis (Lepidoptera: Noctuidae) stimulated by the conspecific female sex pheromone. The results indicate that both the

32
sensitivity and the reliability of the biological sensors can be improved by exact olfactory exposures and action potential measurements (Kanzaki & Shibuya 1992).
In dogs, several molecules can be exposed in the olfactory mucosa. From the mucosa ORNs transmit information to the olfactory bulb as bursts of electrical activity, simply as action potentials. After a complex and selective neural classification, these signals are conducted to the brain. The olfactory sensitivity and specificity vary according to the breed of dog or to meteorological factors. However, a direct response measurement is impossible, although the olfactory ability of dogs has been utilized much (Hirano et al. 2000).
The direct response measurements of the insect olfactory biosensors can be used in the determination of odorant samples with a customized but simple and economic instrumentation. The biosensor technology is especially challenged by the insect biological sensors because of their unique specificity and sensitivity (Schütz et al. 1996, Park et al. 2002). The action potential responses reflect the specificity of each receptor molecule in the receptor membrane. The detection of action potentials of ORNs is a technical challenge that is a prerequisite for studying many functions of ORNs, especially stimulus response properties. The possible technological utilization of the canine olfactory sense is completely different from the case of the insects in the view of preventing cruel treatment of animals.
Prior to reaching the space above the ORN in the insect antenna, an odorant molecule must be blown over the sensillar area of the olfactory organ. In order to reach ORNs, the odorant molecules need to be attached on the sensillar surface and diffuse into the olfactory pores on the surface of the sensillum. The odorant molecules access the ORNs in a very rapid manner in less than one millisecond, and this access will not cause the peripheral mechanisms of olfactory discrimination (Kaissling 1987). Once the odorant molecule reaches the ORN, transduction occurs. In the insect olfactory system one class of receptor neurons is maximally excited or inhibited by some odorant, or not at all by others. Although selective sensitivity can be demonstrated, in odour experiments each cell responds to a particular group of odorants and only very few cells respond to the same compound group. It is concluded that each ORN senses the world of odorants in its own particular manner and in this way the total firing pattern of action potential train across all the ORNs encode odour information.
The basic classification of insect ORNs exists in the antennal olfactory system. However, the sites of these chemical characteristics of insect ORNs are not clear, but there are theoretical and experimental grounds for assuming that most of them are proteins. The main question is: are there as many ORNs as there are pure stimulus compounds? The ORNs are not tuned only to one stimulus compound, but basically to a group of compounds. It is believed that pure compounds are coded according to the labelled line pattern, however, mixtures are coded according to the across-fibre pattern. In insects each receptor neuron of a glomerulus corresponds to a distinctive receptor ending. However, the exact wiring of an olfactory system from the ORNs to the CNS is not yet clear in any insect. The sensitivity and the specificity of the insect olfactory system may be such a unique one that it is impossible to gain as such by technical means. Insect olfactory responses could be used in designing natural insecticides, forest pest control strategies, and mosquito repellents, which are much needed in forestry and tropical areas.

33
2.6 Insect olfactory repellents, deterrents and attractants
Insect can cause much harm and discomfort. Many techniques and methods have been developed to control these. There is ample evidence that host seeking in insects, like in mosquitoes, is mediated by semiochemicals emanating from the host’s sweat odour. Olfactory cues are detected through an intricate pathway, beginning in the sensilla located on the antennae, which detect different odour molecules, and also through palp sensilla, which detect carbon dioxide. The age and the physiological state of a mosquito determine whether the detection of olfactory cues results in a behavioural response. However, it is difficult to estimate the attractiveness of the chemical in the laboratory where the conditions differ from flying behaviour.
All the insects, such as mosquitoes, are very sensitive to mechanical, chemical, and visual exposures. Mosquitoes are attracted to a host in a complex manner. Mosquitoes use visual, thermal, and chemical exposures as means to locate a host. Visual exposures seem to be important for in-flight orientation, particularly over long ranges. The movement of the host and wearing of dark clothing may initiate the orientation of mosquitoes. However, chemical cues are most significant at longer distances. Carbon dioxide and lactic acid are the two most-studied mosquito attractants. Carbon dioxide is released mainly from breath but also from skin and it serves as a long-range airborne attractant and can be detected by mosquitoes at distances of up to tens of metres. Lactic acid blended with carbon dioxide is also a strong attractant, because mosquitoes have special ORNs on their antennae that are excited by this mixture. These same receptors may be masked by N,N-diethyl-3-toluamide (DEET)-based insect repellents. This compound is used in the commercial insect repellent OFF®.
Because many insects possess highly specialized ORNs located on their antennae, the ORNs of insects have inspired many biosensor researchers. Electrophysiological studies have revealed that odour stimuli cause olfactory nerve action potentials rates which are related to olfactory exposure concentration and duration. These action potentials are accompanied by a slow olfactory potential called the electroantennogram or EAG. The amplitude of the EAG correlates with the intensity and duration of the olfactory stimulus. The high sensitivity and selectivity of insect olfactory sensors are the main interests of biosensor research. The antennae of the Colorado potato beetle (Leptinotarsa decemlineata) are very sensitive biosensors for green-leaf odours like (cis)-2-hexen-1-ol or (trans)-3-hexen-1-ol but also for some terpenes like limonene (Schütz et al. 1996).
Investigations of EAG have been focused on insect pheromones and plant odorants. EAG can also be applied to detect general odorants including malodorous compounds and atmospheric environmental standard components. In measurements the EAG parameters are peak amplitude, rise of a negative phase and recovery after exposure. The effects of concentrations and types of odorants on these parameters have been investigated to discriminate different odorants. The peak amplitude decreases usually linearly when the antenna is cut while other parameters remain stable.

34
2.7 Insect olfactory behaviour
There are plenty of mosquitoes for tests and research during the summer time, especially in northern Finland. Their behaviour is easy to experiment in practice, but the tests must be verified either by EAG or single cell measurements. Unfortunately, the measurements are corrupted by unwanted effects, i.e. organ movements caused by incomplete immobilization condition and the electrode noise. An insect behaviour is mainly composed of direct responses to endogenous and exogenous stimuli. In the electrophysiological experiment the exogenous stimuli can be controlled, but endogenous stimuli and their possible responses exist completely. The exogenous stimuli are conducted via specific receptor neurons to the CNS. These response results can be put in use when developing biochemical sensors.
The main links between insect ORNs and the behaviour have not been studied enough. The studies performed at behavioural level are rather easily experimented, but the responses of single ORNs cannot be identified at all. Several experiments on the moth show that the exposure and the behaviour are related via the olfactory receptor system and suggest that the insect brain appears to control the behaviour by determining which of the various built-in activity patterns will appear in a given situation. Because insects have to cope with the complex environmental structure, the process of natural selection has endowed insects with unique biological characteristics and abilities. Genetically stored information characterizes both the individual and the species. Searching behaviour is probably controlled by a combination of factors mediated from both the internal and external environment. Searching behaviour can be defined as an active movement by which insects seek for resources such as food, mates, oviposition sites, nesting sites, and refuges. Insects search for the host according to a set of basic rules of scanning and locomotion. A saltatory search also affects the electrophysiological recordings. The periodic or aperiodic movement of olfactory organs causes noisy signals in recordings (Nakamuta 1985).
The biology and the pest status of Hylobius abietis are important to know. In Finland, H. abietis is the major pest of established forestry causing large-scale damage annually. The lack of knowledge of the processes involved in adult Hylobius odour dispersal and longevity are the main concerns. Field experiments and electrophysiological tests would give new data on the biology and behaviour of adult weevils and their larval stages. The feeding tendency of the adult weevils drawn by chemicals is directed to pine seedlings. The possibility of using deterrents as a pest management strategy could save established seedlings. However, the amount of insecticide increases in the ecosystem all the time causing a risk of poisoning.
In insect behaviour the avoidance response to repellent odorants in Drosophila melanogaster, has been studied as a model phenomenon. This response is essential for the survival of Drosophila in the nature and it provides an advantageous model. Also the Drosophila genome facilitates to determine the correlation between gene expression and behaviour in olfactorily blind flies. The odour-guided behaviour in natural Drosophila populations will advance much understanding of the genetic basis of chemosensory behaviour. (Anholt & Mackay 2001.)

3 Olfactory receptor neurons as biological sensors
Research in the field of biosensors has enormously increased over the recent years. The development of the recording systems for the insect olfactory receptor neurons has begun in the field of insect sensory neurophysiology. These sensors were seldom called a biological sensor. For example, BioFET sensors were developed based on insect antennal responses, namely EAGs. The BioFETs belong to the efforts which have been invested to create a functional hybrid ‘Beetle-chip’ between the insect antenna and recording electronics. In this FET structure an electrolyte on the gate is in a direct contact with the insect antenna. The current in the channel is measured as a response (Schöning & Poghossian 2002).
Attempts have been made to utilize the structures and functions of molecular biological sensing elements in parallel in physical and biochemical sensing purposes (Göpel 1998). On one hand, biochemically constructed sensing elements have been integrated on the surface cover of physical sensors such as acoustical, mechanical, optical, electrochemical, piezoelectric, thermal and magnetic sensors. Biochemical sensor constructions have been designed and realized for many purposes such as clinical, environmental, and food analysis. They can produce a response signal as a function of an analyte concentration or the quality of a specific substance. On the other hand, the output signal of a complete biological receptor neuron such as an ORN could be connected to an electronic amplifier. This biosensor system can yield a very specific response signal also as a function of an analyte concentration of a substance or a group of substances as a whole. A whole animal or its olfactory organ functions are used in current biological sensors. The results obtained attest the advantages of insect olfactory organs as sensor parts of a biologically sensitive FET transistor. In chemosensors of more than one million insect species there is considerable potential based on the evolution. The spectrum of applications ranges already from detection of plant damages in greenhouses, insect pests in field farming to fire alarms in a shoulder nest. (Schütz et al. 1996, Park et al. 2002.)
In actual chemical analysis an olfactory biological sensor can directly determine the level of an extremely low dose of a substance. It is imaginary to believe in live insect sense organs as useful sensors in practice because their living state is impossible to conserve for a longer time, especially for recording purposes. However, in a fly the first recording of individual cell responses of the chemoreceptor neurons was done by
36
Hodgson and his co-workers in mid-50s (Hodgson et al. 1955). At that time the insect orientation to host plants, propagation, the selection of oviposition sites, and mating were open questions in physiological research. Now, it is well known that these involve chemoreceptor clues. Still, the ultimate critical details are lacking in our understanding of the mechanisms of ORNs. It has not been discovered yet what kind of coding techniques these cells use for detecting chemicals and classifying the information that is actually furnished to CNS. The frequency and rate codes have been mentioned as candidates.
Notwithstanding the incomplete picture of the insect olfaction the main goal of sensor research on insect biosensors is to understand more about specific properties in terms of chemoreceptor responses and to associate receptor properties of neural circuit activity to the physical and chemical properties of the applied odour stimulus. This work focuses on a single ORN recording technique in recording and analysing the responses of ORNs associated with various types of olfactory sensilla. The ability to process data faster could help us overcome the problem of the inherent variability in insect chemoreceptor responses. The large amount of data is one of the main problems of online recordings and it has been long impeding our understanding of the function of insect chemoreceptors, i.e., ORNs.
A biochemical olfactory sensor might be based on the structure and the mechanisms of the insect ORNs. However, biological sensors are very sophisticated and complex compared with the electronic ones, like the e-nose or the e-eye, for example. The recognition molecules in the biological sensors are not necessarily highly specific but the signal transduction via the OPBs is sophisticated. The specificity comes from processing the collected data and recognizing the pattern via a continuous transduction process. This mode of operation could be utilized in technical applications, for example, by using the data from multiple biosensors. The increasing capability of microprocessors will provide fast computing power which enables the exploitation of this operation model. For processing of information an olfactory sensor could be connected to a neural network, which then organizes the action potentials into patterns. These patterns might enable detection, identification, and recollection of distinct odours.
A technical application for odour or volatile compound identification can mimic biology and be constructed of an array of sensors. In the array each sensor is designed to respond to a specific odour chemical in the same way as in insect olfactory sense. With this approach, the number of unique sensors must be at least as great as the number of chemicals being monitored. The e-nose is a technical match for physiologically based construction of sensors for chemical analysis. Both the insect olfactory system and the e-nose structures consist of an array of olfactory receptor elements and a character recognition system. Physiological approaches to automated chemical analysis with e-noses are interesting solutions in many cases, such as in pharmaceutical screening, environmental monitoring, and toxin detection. The conventional and complex chemical analysis of data collected by sensor arrays can be performed automatically by a neural network. This approach can utilize sensors that have a broader response and discriminate different chemicals. An insect olfactory system can be incorporated to an electronic nose for reducing the number of sensors.
Insect ORNs can determine the odour chemical concentration very quickly and accurately in the air at the range of ppb. Odour concentration measurements can be based on action potential counting. The action potentials from the insect ORNs can be measured

37
extracellularly and their intervals are determined before, during and after the odorant exposure. Action potentials of antennal ORNs in blowfly, Calliphora vicina, fruitfly, Drosophila virilis, and mosquitoes, Aedis communis, are alike and recurrent according to many studies.
Morphologically biological olfactory sensors such as olfactory sensilla are parts of living organisms. Biological sensors are difficult to connect with any electronic device without disturbing their function. The aim of the biosensor experiments is to find a way to utilize the function of these sensors.
3.1 Information processing in the olfactory receptor neurons
In the olfactory receptor pathways the possibly ensemble encoding as follows: Receptor molecules of each receptor cell are for a short time weakly bound to a specific chemical stimulus. Some receptor neurons require only an extraordinarily small amount of chemical stimulus to be activated. In the transduction and conduction processes there exists a monosynaptic connection between the ORNs and the CNS. The ORNs go straight to the CNS. Nevertheless, the olfactory system is less organized than the gustatory system which is even more specific and sensitive (Gomez et al. 1994).
A moth pheromone consists of a blend of different compounds. The ratio of each component in the pheromone differs from one species to another. Each receptor neuron is tuned to specific components. Therefore, the labelled line coding seems to be involved. Several studies have been carried out to identify different types of sensilla whose threshold and response to particular pheromone components differ from each other. Each glomerulus receives input from only a single class of ORNs, and thus the spatial pattern of activated glomerulae encodes the chemical information of the odorants being sensed by the specific ORNs. This labelled line organization requires considerable coordination to ensure a correct response pattern of cellular networks. (Renou & Lucas 1994.)
On the antennae of Trichoplusia ni, two types of sensilla has been found. The sensilla have been revealed to be distinguishable both electrophysiologically and morphologically (Grant et al.1985). Each sensillum has two receptor neurons whose action potential amplitude and the rate of spontaneous firing are different. These neurons are sensitive to different components of a pheromone and are also excited by low levels of other components.
Many electroantennographic recording techniques have been developed for insect olfactory sensors to monitor the depolarisation of antennal receptor cells of an olfactory organ when exposed to varying quantities of stimulative chemicals. Pest insects can respond to small quantities of volatile compounds such as ethanol, verbenone, allomones, and kairomones which are released from cut-down trees. With its olfactory sense Hylobius abietis orientates to these trees for colonization. Trees can control the orientation to some extent by adverse biocompounds, but the insect’s orientation capacity overcomes the resistance of the trees. The pest insect, Hylobius abietis, can cause severe mortalities of, e.g., pines for several decades in many forested countries. Similarly, birches are damaged by a pest fly, Phytobia betulae.

38
3.2 Limitations of ORNs as true biological sensors
The function of ORNs can be explained mainly with the terms excitation, inhibition, and adaptation. The terms may have different meanings depending on the general scope and the accuracy of the diverse context. A chemical stimulus causes excitation in certain ORNs as a consequence of alterations in the receptor neuron, which finally lead to the increase of action potential rate compared with the spontaneous rate. Typically, the term excitation is used for the increase of the action potential rate. Decrease of the action potential rate of a receptor neuron means inhibition or repression of the olfactory response. In electrophysiology a decrease or depolarisation of the cell membrane potential causes an increase of the action potential rate, and an increase or hyperpolarisation causes a decrease, respectively.
Measurement reproducibility depends on the scattering and drift values of the results in a series of observations. Reproducibility may also vary considerably depending on the operational conditions, i.e. on the continuous/discontinuous contact with the substrate containing atmosphere, substrate concentration, temperature, pH, presence of organic volatiles, and the sample matrix (Göpel 1998). For a biological sensor, a general lower limit for the compound concentration has been determined. The lower limit is about the same for a biological sensor as for any analytical device: However, the operational stability of a biological sensor response may vary considerably depending on the sensor geometry, the method of preparation, as well as on the applied sensillum, receptor and transducer. Furthermore it is strongly dependent on the limiting factor of the response rate, i.e. substrate external/inner diffusion or biological recognition reaction.
3.3 Odour exposure delivery to insect ORNs by a headspace technique
Gas chromatography and odorant exposure to ORNs need a calibration method. Headspace technique has been applied to calibrate a typical gas chromatograph (Ezquerro et al. 2004) and study, for example, the geometric parameters of porous silica using gas chromatography (Kazakevich et al. 2000). However, the same approach has to be modified for the insect olfactory study. Discontinuous multiple headspace extraction and dilution (DMHED) is also a modified quantitative method used by Kazakevich et al. (2000). The DMHED methodology used in this work for the determination of odorant concentrations is also an approximate approach in the study of insect ORNs. In principle it is a dynamic gas evaporation, carried out stepwise at fixed time intervals for odour evaporation in a fixed air volume (headspace). It is also assumed that main part of the solvent exits during the first exposure. The concentration of the solute odour in the headspace, e.g. inside of a Pasteur pipette, decreases exponentially in repeated exposures in a sequence provided that the evaporation rate of the odorant molecules (∆m) during the fixed time (∆t) is proportional to the amount of odorant left for evaporation, e.g. in a filter paper inside the headspace m(t)): )texp(m)t(mt)t(mm 0 ⋅β−=⇒∆⋅⋅β−=∆ , where β is an exponential decaying coefficient. Thus, by a proper mathematical fitting the action

39
potential number is a function of the solute concentration in the exposure. This makes it possible to evaluate the odour concentration in the micro atmosphere around the insect antenna during exposures by recording some exposure series starting with different amounts of solute odours in the filter paper. A prerequisite for that it that the responsiveness of the ORN under study is not altered during experiments. In addition, the evaporation of the odorant should be so strong that after a low number of stimuli in the exposure series, the stimulus strength is significantly reduced. Inaccuracies relate to the use of the DMHED method also from the adsorption of odorant on the pipette walls, especially at low odorant concentrations, and from the expanding volume of the exposure pulse in open air between the Pasteur pipette and insect antenna.
The DMHED method is applied here for biosensing research. DMHED is a simplified model with regard to the multiple headspace extraction (MHE) as a step-by-step procedure (Kolb & Ettre 1997). Based on simple calculations the DMHED procedure results are useful in evaluating the concentration in a single exposure. Many limitations of the DMHED method are also appraised above to point out how the analytically defined parameters may need improvements for more accurate determination of the concentration in odour exposure experiments with ORNs.
An initial amount of stimulus compound in the filter paper m0 causes a concentration c
1 in the pipette volume V during evaporation of a fixed time. In a repeated exposure
sequence the concentration ci = mi /V in the ith exposure follows according to the DMHED method an exponential expression
)1i(1i ecc −⋅β−= , i = 1,2,3, … (1)
where c1 = m1 /V is the concentration of a stimulus compound in the first (i = 1) exposure, m
i the amount of stimulus matter extracted in the ith exposure and β the exponential
decaying coefficient (a symbol α* was used for β in Paper V). It is possible to obtain an expression for the initial amount m0 by applying the sum rule for the geometric series (1):
β−−⋅β−
∞
=
∞
=
∞
= −==== ∑∑∑ e1
cVecVcVmm 1)1i(
1i1
1ii
1ii0 (2)
This gives an equation for c1:
)e1(Vm
Vmc 01
1β−−== (3)
The factor e-β means now the partition fraction of the stimulus compound between the filter paper and air in the exposure. A fitting procedure for the exposure concentrations based on a power-law dependence of the action potential rates on the odorant concentration was used to calculate values for the decaying coefficient β. However, it is not clear if one single type of mathematical dependence can be valid for all types of odorants (Sarkar et al. 2003).

40
The DMHED method has been further developed in gas chromatography (Chai & Zhu 1998, Kazakevich et al. 2000, Chai et al. 2002). For quantitative analyses, it is important to know the actual odorant concentration in the sensilla microatmosphere. This microatmosphere is changing as a function of gas flow around the insect antenna. Headspace gas analysis can be applied as a first approximation to calculate the concentration of an odour exposure pulse directed to insect sensilla with ORNs.
The olfactory information on the exposure odorant and its concentration is coded in the rate of the action potentials in the activated cell. In other cells the same odour stimulus may cause a decrease of the action potential rate depending on its chemical structure or the properties of the cells. When selecting the exposure system, one must take the insect anatomy into consideration. How many odorant molecules will hit depends on the insect antenna structure. However, the variety of estimates between the minimum and maximum number of the stimulus molecules coding to odour sensations is very large, being between 2000 and 1018, approximately. Such a large scale calls for a logarithmic dependence.
The odour exposure can also be given by a syringe-olfactometer (Kafka 1970). It was calibrated both by a gas chromatograph and a radiometric method, and 370 odour compounds at very low concentrations were tested by Kafka (1970). By this syringe-olfactometer method it was possible to deliver down to 10 molecules hitting the sensillum in a single odour exposure.
There are at least three types of noise: sensory, environmental and channel noise. Sensory noise is present in every sensor system as a result of the thermal motion of molecules. It is reduced by means of averaging a sufficiently large number of molecules and for a sufficiently long time. Channel noise originates from the fluctuations in the signal and it is random noise. In general every channel has noise in the absence of a signal. Environmental noise caused by the presence of other stimuli such as unclean carrier air limits the detection of the exposure concentration. When a signal of interest is small and it overlaps with other signals, the perceptivity is usually measured as a signal-to-noise ratio (SNR). Sensitivity may be limited by the receptor noise. Detection limits for different odorants vary very much among ORNs. The same ORNs also have variability on different insect preparations.

4 Materials and methods
The block diagram of the measurement and analysis procedure is schematically shown in Figure 4. In this practical procedure, firstly an odour exposure sequence was produced that elicited action potentials in insect ORNs. The action potential response was then measured and analysed by a time-to-voltage converter connected to a digital signal analyser. From the results of the digital signal analyser a graph was drawn after some fitting procedures to describe the action potential rate vs odour concentration in a log-log co-ordinate system for each odour exposure sequence.
Fig. 4. Schematic block diagram of the measurement and response analysis procedure for SSR (single sensillum recording) and EAG (electroantennogram) in an insect antenna. The odour responses were analysed based on the DMHED (discrete multiple headspace extraction and dilution) method.

42
4.1 Insects
The recordings of the set up studies were made from single olfactory sensilla of female blowflies (Calliphora vicina) obtained from the fly family of the Department of Biology, University of Oulu (Papers II-V), those of the mosquito study from small olfactory sensilla of female mosquitoes (Aedes communis) (Paper I) caught in a forest (in the municipality Haukipudas near the city Oulu at the location 65o10'35" N and 25o21'15" E), and the recordings of the forest pest study from single olfactory sensilla of pine weevils (Hylobius abietis) caught in a forest in the municipality Tuusula near the capital Helsinki at the location 60°25'15" N and 25°01'49" E) and also from a timber mill neighbourhood at Haukipudas in northern Finland (Paper VI).
Each Paper describes the setup for the insect. The blowflies were immobilized in an insect holder with beeswax. Mosquitoes were immobilized with double-sided tape around the base of each antenna and other insects were attached with beeswax on the same custom-built holder. The fruitflies were immobilized at the end of a Pasteur pipette into which the insect moved with the guidance of light until the head was immobilized. The pine weevils were immobilized in the same way and in addition its body was immobilized with an iron hook. After that treatment the insect antenna was immobilized with beeswax.
4.2 Electrophysiological recordings and odour exposure
For the electrophysiological experiments the microelectrodes were electrolytically etched from 5 cm long tungsten wires (diameter 0.2 mm) in 30% KOH with 10-20 mA ac-current. The etched electrode wires were on a rotary frame. The etching process was monitored through a stereo microscope (Olympus). Under the inspection with a compound microscope (Olympus) a suitable electrode was straight-etched to a tip diameter 1-2 µm. With tungsten microelectrodes the recordings were made from single olfactory sensilla of each male or female insect. Insect gender was identified afterwards.
The entire insect holder was placed beneath a long-working-distance objective of the compound microscope. The microscope rolled on an x-y stage on a stone table. The microscope was fitted with 20x, 50x, and 80x objectives and 20x oculars. The antenna under research was epi-illuminated with a fibre-optic cold light source (Schott Mainz). It enabled the visualization of olfactory sensilla. The resolution of a light microscope is λ/(2NA), where λ is the wavelength of light and NA the numerical aperture of the lens. Thus, for a long-working-distance objective the resolution is about 500 nm, corresponding to about one third of the diameter of blowfly sensilla. The blowfly sensilla from which recordings were gathered contained an ORN for the diamine, hexanol, or butyric acid. These sensilla are situated on the distal part of the antenna. They are small antennal sensilla with a diameter of 1-2 µm and length of 5-10 µm. In the female blowfly, each diamine sensitive sensillum is known to be innervated by 1-2 ORNs.
In the recording setup, the reference microelectrode was inserted in the tip of the antenna in the case of a blowfly, whereas in the case of a mosquito and large pine weevil it was in the base of the antenna. The recording microelectrode was placed near the base
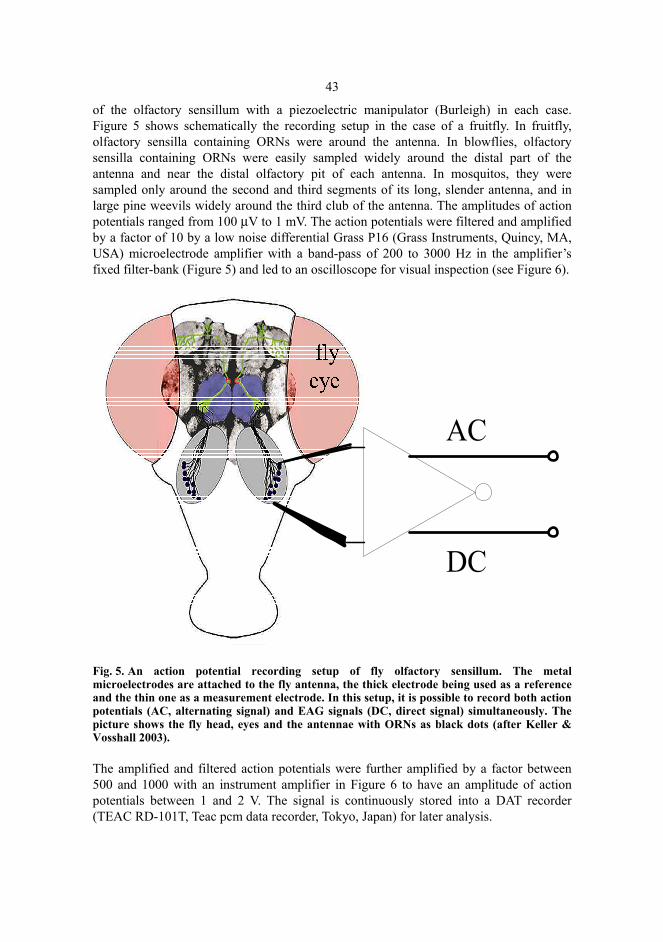
43
of the olfactory sensillum with a piezoelectric manipulator (Burleigh) in each case. Figure 5 shows schematically the recording setup in the case of a fruitfly. In fruitfly, olfactory sensilla containing ORNs were around the antenna. In blowflies, olfactory sensilla containing ORNs were easily sampled widely around the distal part of the antenna and near the distal olfactory pit of each antenna. In mosquitos, they were sampled only around the second and third segments of its long, slender antenna, and in large pine weevils widely around the third club of the antenna. The amplitudes of action potentials ranged from 100 µV to 1 mV. The action potentials were filtered and amplified by a factor of 10 by a low noise differential Grass P16 (Grass Instruments, Quincy, MA, USA) microelectrode amplifier with a band-pass of 200 to 3000 Hz in the amplifier’s fixed filter-bank (Figure 5) and led to an oscilloscope for visual inspection (see Figure 6).
Fig. 5. An action potential recording setup of fly olfactory sensillum. The metal microelectrodes are attached to the fly antenna, the thick electrode being used as a reference and the thin one as a measurement electrode. In this setup, it is possible to record both action potentials (AC, alternating signal) and EAG signals (DC, direct signal) simultaneously. The picture shows the fly head, eyes and the antennae with ORNs as black dots (after Keller & Vosshall 2003).
The amplified and filtered action potentials were further amplified by a factor between 500 and 1000 with an instrument amplifier in Figure 6 to have an amplitude of action potentials between 1 and 2 V. The signal is continuously stored into a DAT recorder (TEAC RD-101T, Teac pcm data recorder, Tokyo, Japan) for later analysis.

44
Olfactory electrophysiological measurements were always made by immobilizing an individual blowfly inside a small plastic holder with its head sticking out of the holder surface. The head was immobilized by beeswax so that the measured antenna was seen in the microscope image. Metal microelectrodes were attached to the specific olfactory sensillum, and then the selected odour chemicals were passed in a waft of odour over the antenna.
Clean air flow from a teflon tubing (internal diameter 2 mm) and odour exposure air blown through the Pasteur pipette (id 1 mm) at a distance of 2 cm from the antenna were directed from opposite sides to the antenna under study, Figure 6. It was not possible to use the same air flow for clean air and odour exposures in this setup. The clean air flow was directed from the opposite site to withdraw odorants from previous exposures and to prevent those molecules from hitting the antenna which escape from the open outlet of the Pasteur pipette during the 2 min evaporating interval. The filtered clean air flow (from the air network of the Laboratory) streamed continuously over the antenna at approximately 180-200 ml/min, except during the odour exposures. Clean air was directed as shown in Figure 6. The exposure flow was directed to the antenna by looking through the Pasteur pipette and by seeing the antenna for the exposure sequence. The exposure odour air flow was opened by a magnetic valve for 1.0 s at 2 min intervals which caused a flow rate of 3 ml/s measured by a rotameter, Figure 6. The actual odour exposures were delivered by passing the clean air pulse through the Pasteur pipette containing a 1 cm2 Whatman n:o 1 filter paper embedded with 1 to 5 µl of diluted odorant hexane or odorant water mixture.
The exposure odour air flow outlet was at the distance of about 2 cm from the measured antenna. The air volume originating from the Pasteur pipette with an outlet diameter of 1 mm was 3 ml. This volume was injected in a time of one second. Then, the air speed against the antenna was about 380 cm/s assuming the air jet is not widened and retarded by contact with the outside still air. When the Pasteur pipette was at the distance of 2 cm from the antenna, the molecule flight time was about 5.2 ms.
Responses from the three olfactory sensilla groups of female blowflies were recorded for blowfly ORN analysis. The amount of the odour vapour emanating inside a headspace, i.e. the Pasteur pipette, was an exponentially decaying function of the exposure number in the sequence according to the DMHED theory. The exposure number relates, in fact, to time in the sequence. Each odour pulse is expanding in open air outside the Pasteur pipette to some extent, which means a dilution of the odour hitting the exposed antenna. The concentration also depends on the amount of the odorant evaporation and possible adsorption on the pipette walls. A part of evaporated odorant also diffuses out of the pipette through the open outlet during the evaporation period between exposures. Hexanol is a good example of a highly evaporating odorant. 1,4-diaminobutane also evaporates, but butyric acid evaporates and adsorbs more strongly.
Typically, the entire antenna was exposed to the odour pulse, because it is difficult to restrict the exposure to a specific part of the antenna. However, the odour outlet was centred to the middle of the antenna.

45
I II
Fig. 6. Schematic drawing of the odour exposure measurement system for large pine weevil ORNs. Recording (1) and reference (2) microelectrodes, microelectrode amplifier (3), audio amplifier (4), loudspeaker (5), instrument amplifier (6), oscilloscope (7), DAT recorder (8), electronic exposure control unit (9), rotameter (10), magnetic valve (11), filter paper in the Pasteur pipette (12), large pine weevil antenna (13) and clean air flush flow (14). (The measurement areas on the antenna are marked by I and II, from Paper VI).
4.3 Data analysis
The recorded action potentials were analysed by a time-to-voltage converter (TVC501, Tektronix, Florida, USA) connected with a dynamic digital signal analyzer (Hewlett Packard 35665A). Figure 7 shows schematically the analysis setup of the TVC. The TVC method is a rather new concept in the analysis of action potential rates.
In time-to-voltage conversion there is no smoothing of an instantaneous action potential rate and all the action potentials in each sequence are retained. The output of the time-to-voltage is needed for counting the action potential rate by a digital signal analyser. Owing to some problems inherent to the action potential sorting process, the action potentials were selected on the basis of the amplitude level triggering to count each

46
pulse. The time-to-voltage converter TVC 501 has also been used in the works of Damay (1997) and also Morio (1996) for time-to-distance conversion.
Fig. 7. The setup for signal and response analysis of the action potential trains, containing a DAT recorder (1), oscilloscope (2), amplifier (3), pulse shaper (4), time-to-voltage converter (5), and digital signal analyser (6). AP stands for action potentials and Exp for exposure time marks.
In Figure 7, the setup for the signal and response analysis of the action potential trains contains a DAT recorder, an oscilloscope, an amplifier, a pulse shaper, a time-to-voltage converter, and a digital signal analyser. The pulse shaper is based on a high-speed analogue comparator circuit which is commercially available. The layout of the electronics is shown in Figure 8(a) and a photograph of the device is seen in Figure 8(b). There are two IC circuits in the layout, IC1 and IC2, and the IC1 is the high-speed analogue comparator circuit. The pulse shaper was constructed by two electronic engineering students (M. Kerttula and T. Kivelä) as an exercise in the Laboratory of Electronics, Department of Electrical and Information Engineering, University of Oulu. The rise time of the output pulse of the pulse shaper was only a few nanoseconds, which is necessary for the time-to-voltage converter in these applications. The shaped sharp-edged and constant amplitude (rectangular) pulses were further fed into the action

47
potential rate measurement system. Duration of these pulses was selected by the potentiometer P2 in Figure 8(a) between 100 and 200 ns.
The employed action potential rate analysis uses a time-to-voltage conversion to find out the instantaneous action potential rate as a function of time. The time-to-voltage conversion is a very new method in biological signal analysis. It makes possible a real time conversion of inter spike time interval measurements into voltage levels ready for further processing and analysis. Actually, an analysis instrument connected to the time-to-voltage converter displays the inter spike interval or spike rate on the vertical axis and on the horizontal axis it is time.
The time-to-voltage converter measures pulse width, pulse period or delay between two independent action potentials. The TVC 501 has four major functional blocks: the input panel, the microprocessor board, the counter clock board, and the output section. The input panel has the user interfaces for the input signals, such as pulse-shaped action potentials. The input signals are connected with the proper switches (DC or AC).
The triggered inputs are sent as outputs to the amplifier circuits. In parallel, the trigger comparator sends output to the monitor output and to the counter board. The microprocessor board handles the digital data and general instrument control operations such as time resolution per division, sampling rate, and auto setup state. A variety of the test signals are installed in the TVC for the input/output control. The action of keyboard encoder data control values are set to the microprocessor board containing the status and the display controller which are displayed by the front panel LEDs.
The microprocessor board generates the triggers for the corresponding input signals as action potential intervals in this case. The counter board convert this time interval into voltage level based on the duration of the action potential interval. The counter board contains a clock generator circuit, pulse and synchronizing circuits, dual counter, digital to analogue converter circuits and shift registers. This board actually realizes the time to analogue conversion which is scaled at the output stage as follows. When the triggers are generated in the input stage corresponding an action potential pulse interval to be measured, this action potential interval is sent to the clock generator and the time pulse marker is activated, in parallel with clock pulses which are also logically added with the trigger to form a marker sequence. This marker sequence is sent to the dual counter circuit as long as the consequential trigger lasts. The counted marker sequence is then sent into the digital to analogue converter (DAC) which converts the counted marker sequence time into the corresponding current signal. A current to voltage converter amplifier connected to the DAC then sends an output voltage corresponding the DAC current signal. Finally, the produced voltage level is the time to voltage conversion. The TVC output is so the resulting signal that is further connected to the digital signal analyzer for a calculation process. For the time-to-voltage conversion the precision corresponds to the total measurement error, E, determined empirically according to the formula (TVC 501 Operator’s Guide 1990)
%interval timeMeasured
20 -division per Resolution Dynamic7E
⋅±=
For example, if a measured inter spike interval is between 10 and 100 ms, which are typical time intervals in spontaneous and stimulated activity for sequences of the insect
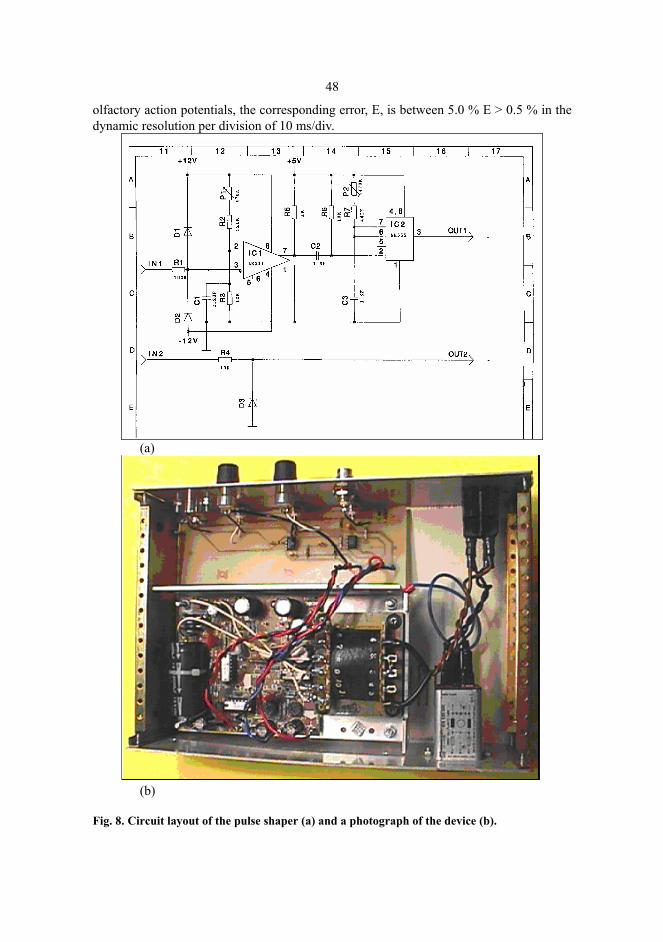
48
olfactory action potentials, the corresponding error, E, is between 5.0 % E > 0.5 % in the dynamic resolution per division of 10 ms/div.
(a)
(b)
Fig. 8. Circuit layout of the pulse shaper (a) and a photograph of the device (b).
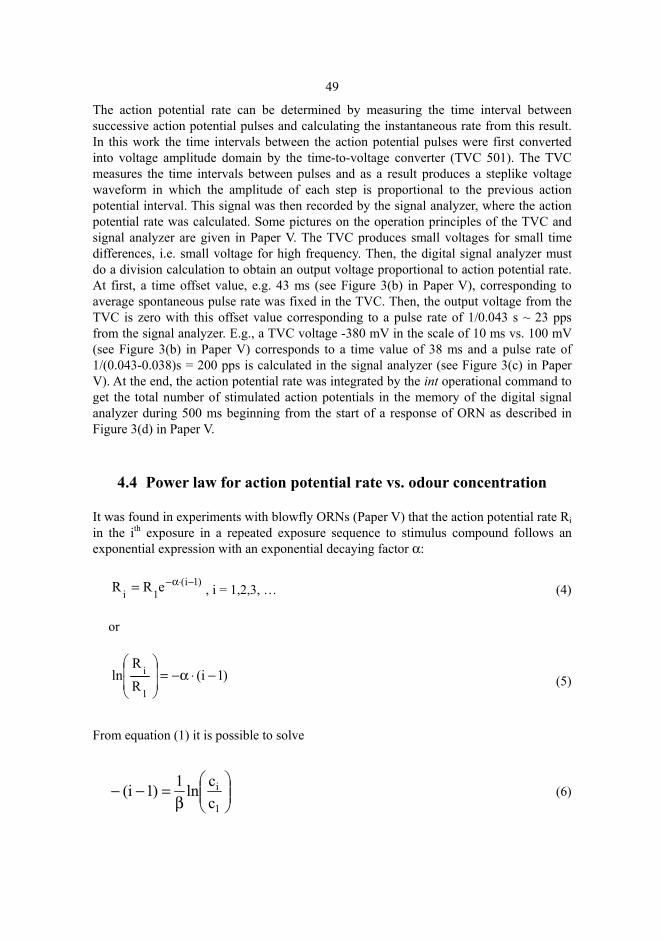
49
The action potential rate can be determined by measuring the time interval between successive action potential pulses and calculating the instantaneous rate from this result. In this work the time intervals between the action potential pulses were first converted into voltage amplitude domain by the time-to-voltage converter (TVC 501). The TVC measures the time intervals between pulses and as a result produces a steplike voltage waveform in which the amplitude of each step is proportional to the previous action potential interval. This signal was then recorded by the signal analyzer, where the action potential rate was calculated. Some pictures on the operation principles of the TVC and signal analyzer are given in Paper V. The TVC produces small voltages for small time differences, i.e. small voltage for high frequency. Then, the digital signal analyzer must do a division calculation to obtain an output voltage proportional to action potential rate. At first, a time offset value, e.g. 43 ms (see Figure 3(b) in Paper V), corresponding to average spontaneous pulse rate was fixed in the TVC. Then, the output voltage from the TVC is zero with this offset value corresponding to a pulse rate of 1/0.043 s ~ 23 pps from the signal analyzer. E.g., a TVC voltage -380 mV in the scale of 10 ms vs. 100 mV (see Figure 3(b) in Paper V) corresponds to a time value of 38 ms and a pulse rate of 1/(0.043-0.038)s = 200 pps is calculated in the signal analyzer (see Figure 3(c) in Paper V). At the end, the action potential rate was integrated by the int operational command to get the total number of stimulated action potentials in the memory of the digital signal analyzer during 500 ms beginning from the start of a response of ORN as described in Figure 3(d) in Paper V.
4.4 Power law for action potential rate vs. odour concentration
It was found in experiments with blowfly ORNs (Paper V) that the action potential rate Ri in the ith exposure in a repeated exposure sequence to stimulus compound follows an exponential expression with an exponential decaying factor α:
)1i(1i eRR −⋅α−= , i = 1,2,3, … (4)
or
)1i(RR
ln1
i −⋅α−=
(5)
From equation (1) it is possible to solve
β
=−−1
i
ccln1)1i( (6)
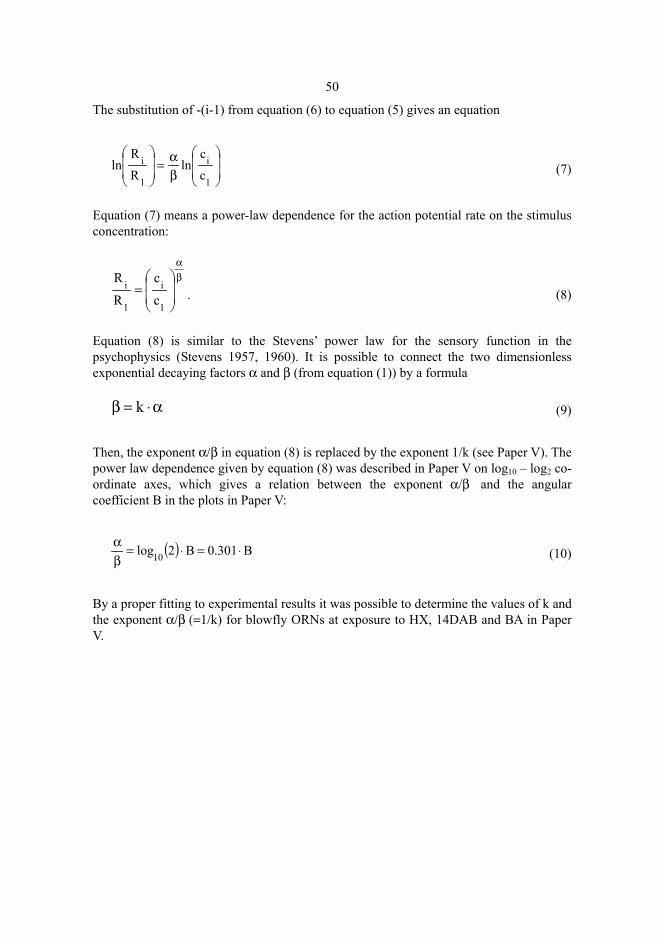
50
The substitution of -(i-1) from equation (6) to equation (5) gives an equation
βα=
1
i
1
icc
lnRR
ln (7)
Equation (7) means a power-law dependence for the action potential rate on the stimulus concentration:
βα
=
1
i
1
icc
RR
. (8)
Equation (8) is similar to the Stevens’ power law for the sensory function in the psychophysics (Stevens 1957, 1960). It is possible to connect the two dimensionless exponential decaying factors α and β (from equation (1)) by a formula
α⋅=β k (9)
Then, the exponent α/β in equation (8) is replaced by the exponent 1/k (see Paper V). The power law dependence given by equation (8) was described in Paper V on log10 – log2 co-ordinate axes, which gives a relation between the exponent α/β and the angular coefficient B in the plots in Paper V:
( ) B301.0B2log10 ⋅=⋅=βα
(10)
By a proper fitting to experimental results it was possible to determine the values of k and the exponent α/β (=1/k) for blowfly ORNs at exposure to HX, 14DAB and BA in Paper V.

5 Results and discussion
Some examples of different sensing results obtained in this work by the insect olfactory receptor neurons are described. The results are presented in detail in Papers I-VI. Before getting the response results described here, it is necessary to record the stimulated action potential trains and convert the trains into action potential rates as shown in Figure 7. The examples here relate to the sensing of HX, 14DAB and BA by ORNs of different insects. In addition, responses of ORNs of the large pine weevil tested at exposure to Neutroil® in Paper VI are shortly discussed.
5.1 Hexanol sensing
The results of HX sensing by blowfly ORNs are described in Paper V. Figure 9 shows the action potential rate of a blowfly ORN as a function of the exposure number to HX (initially 50000 ng in the filter paper) of repeated exposures 2-10 in the sequence. From this fitting the first exposure is left off, since the evaporation time in the pipette headspace was different from the constant evaporation time period in the sequence. The installation of the filter paper inside the pipette is the reason for this difference. The exponential decrease of the action potential rate as a function of the exposure number in the exposure sequence is in agreement with equation (4). The exponential decaying factor α in equation (4) was calculated from the exponent α’ obtained from the linear fitting in Figure 9 by the formula: α = α’ ln2.
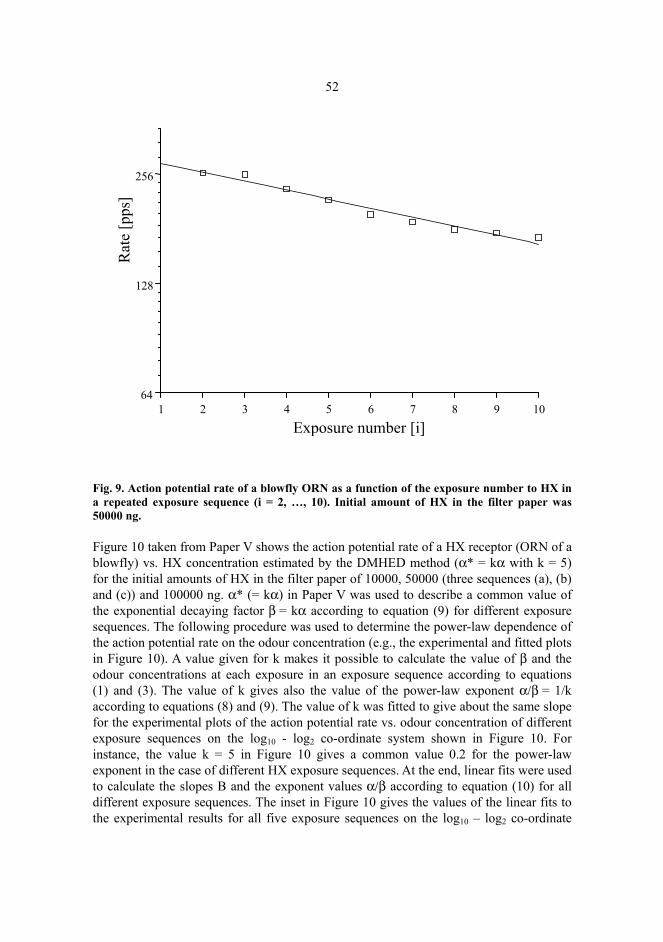
52
Fig. 9. Action potential rate of a blowfly ORN as a function of the exposure number to HX in a repeated exposure sequence (i = 2, …, 10). Initial amount of HX in the filter paper was 50000 ng.
Figure 10 taken from Paper V shows the action potential rate of a HX receptor (ORN of a blowfly) vs. HX concentration estimated by the DMHED method (α* = kα with k = 5) for the initial amounts of HX in the filter paper of 10000, 50000 (three sequences (a), (b) and (c)) and 100000 ng. α* (= kα) in Paper V was used to describe a common value of the exponential decaying factor β = kα according to equation (9) for different exposure sequences. The following procedure was used to determine the power-law dependence of the action potential rate on the odour concentration (e.g., the experimental and fitted plots in Figure 10). A value given for k makes it possible to calculate the value of β and the odour concentrations at each exposure in an exposure sequence according to equations (1) and (3). The value of k gives also the value of the power-law exponent α/β = 1/k according to equations (8) and (9). The value of k was fitted to give about the same slope for the experimental plots of the action potential rate vs. odour concentration of different exposure sequences on the log10 - log2 co-ordinate system shown in Figure 10. For instance, the value k = 5 in Figure 10 gives a common value 0.2 for the power-law exponent in the case of different HX exposure sequences. At the end, linear fits were used to calculate the slopes B and the exponent values α/β according to equation (10) for all different exposure sequences. The inset in Figure 10 gives the values of the linear fits to the experimental results for all five exposure sequences on the log10 – log2 co-ordinate
1 2 3 4 5 6 7 8 9 10 64
128
256
Rat
e [p
ps]
Exposure number [i]
53
system. B values relate to values of the power-law exponent in equation (8) through equation (10). The values of the exponent α/β in equation (8) are given for four exposure sequences (10000 ng and 50000 ng (a), (b) and (c) in Figure 10) in Table 1 on page 65. The values are close to the approximate common value 1/k = 0.2. Large amounts of an odour were found to cause a saturation of ORN responses, as show in the case of 100000 ng of HX in Figure 10. All response results in Figure 10 were measured with the same blowfly ORN. The results especially from the two exposure sequences (b) and (c) with the same initial amount of 50000 ng HX in the filter paper are in a close agreement in Figure 10. This is an indication for the fact that the decaying action potential rates at repeated exposures in the sequences relate to decreasing HX concentrations and are not caused by a simultaneous decaying responsiveness of the preparation. This blowfly ORN did not respond to the 14DAB odour. Many different ORNs in various blowflies were tested with HX exposures. Most of them had no response to HX exposures, whereas those, which were active to HX, had action potential rates at about the same level at exposures to HX. It was also necessary to have a loudspeaker in the measurement system in Figure 6 for the recognition of the active ORNs.
ppm]c [100 101 102 103
26
27
28
100 101 102 103
64
128
256
Linear Fit for Data1_C on log10 vs. log2 scales. yscale(Y) = A + B* xscale(X)
m (ng) A Error B Error R N 104 6.264 0.102 0.645 0.046 0.983 9 (solid line) 5x10⁴ (a) 6.413 0.055 0.646 0.026 0.994 9 (dash) 5x10⁴ (b) 6.557 0.081 0.601 0.062 0.965 9 (dot) 5x10⁴ (c) 6.359 0.159 0.674 0.068 0.970 8 (dash dot) 105 6.440 0.942 0.674 0.408 0.559 8 (short dot)
10000 ng HX 50000 ng (a) 50000 ng (b) 50000 ng (c) 100000 ng
α *=k α;
Rat
e [p
ps] k=5
Fig. 10. Action potential rates of a blowfly ORN vs. concentration of HX estimated by the DMHED method (α* = kα with k = 5) for the initial amounts of HX in the filter paper of 10000, 50000 (three sequences (a), (b) and (c)) and 100000 ng together with linear fits to the experimental values in the inset (from Paper V).

54
In addition to blowfly ORNs, HX responses were also found by ORNs of fruitfly and large pine weevil, as shown in Figure 11 for fruitfly. However, only blowfly ORNs of the ORNs of these insects responded to the 14DAB and BA odours. Figure 11 shows action potential responses of a fruitfly ORN to four different amounts of HX (0.1, 1, 10 and 100 µg) in the filter paper together with results from a blank exposure (zero amount of HX). The given action potential rates are averages of four first recordings in repeated exposure sequences for all four HX amounts.
Fig. 11. Four overlapping graphs (averages of four first recordings in repeated exposure sequences) of action potential rates vs. time when a fruitfly ORN was exposed by 100 µg (dashed brown line), 10 µg (continuous green line), 1 µg (dashed violet line), and 0.1 µg (continuous violet line) as an initial amount of HX in the filter paper. In addition, results of a blank exposure (dashed green line) and exposure time marked with arrows are shown.
Figures 12 and 13 show, on the other hand, inhibition effects at exposure to HX in blowfly and fruitfly ORN responses, respectively. In Figure 12, there is a mixed response where both HX and 14DAB were simultaneously exposed to a blowfly ORN. This blowfly ORN was sensitive to 14DAB and was exposed to 90 µg 14DAB (excitatory compound) mixed with 1 µg HX (inhibitory compound) in the filter paper. HX odour caused a partial inhibition during the exposure time, as shown in Fig. 12. In this response, the inhibitory effect of HX stopped about at the end of the exposure causing a decrease in the action potential rate. At the beginning, the response was almost 350 pps and it continued for many seconds at about 140 pps after the end of the exposure. The 14DAB blowfly ORN did not respond to the HX odour.
In Figure 13, there is a response where HX is exposed to a fruitfly ORN. In this exposure, HX behaved as an inhibitory compound and caused an absolute inhibition. The silent period is about 1.1 s and, therefore, the processed pulse rate is 0.9 = 1/1.1 pps instead of real zero pps. The spontaneous action potential rate of this ORN was about 20 pps before and after the HX odour exposure. The action potential rate is about 20 pps
100 µg
10
1
0.1
blank
300
0
Rat
e [p
ps]
2.0 s0.0
150
time (s)1.0

55
before the exposure, about 1 pps (in fact zero) during the response, and approximately 24 pps after the response in Figure 13.
Fig. 12. An inhibition effect of HX to the response of a blowfly ORN (1st exposure) to a mixture of 1 µg HX and 90 µg 14DAB in the filter paper. This exposure contains both HX and 14DAB simultaneusly evaporated from the same filter paper. The arrows show the exposure time as in Figure 11. After the end of the exposure, the response (from the 14DAB) continues for a long period of time.
Fig. 13. An inhibition effect caused by a HX exposure in a fruitfly ORN. The arrows show the exposure time as in Figure 11.
Rat
e [p
ps]
4.0 s 0.0 time (s)
350
0
175
2.0
Rat
e [p
ps]
time (s) 0 2.01.0 3.0
20
40
0 5.0 4.0
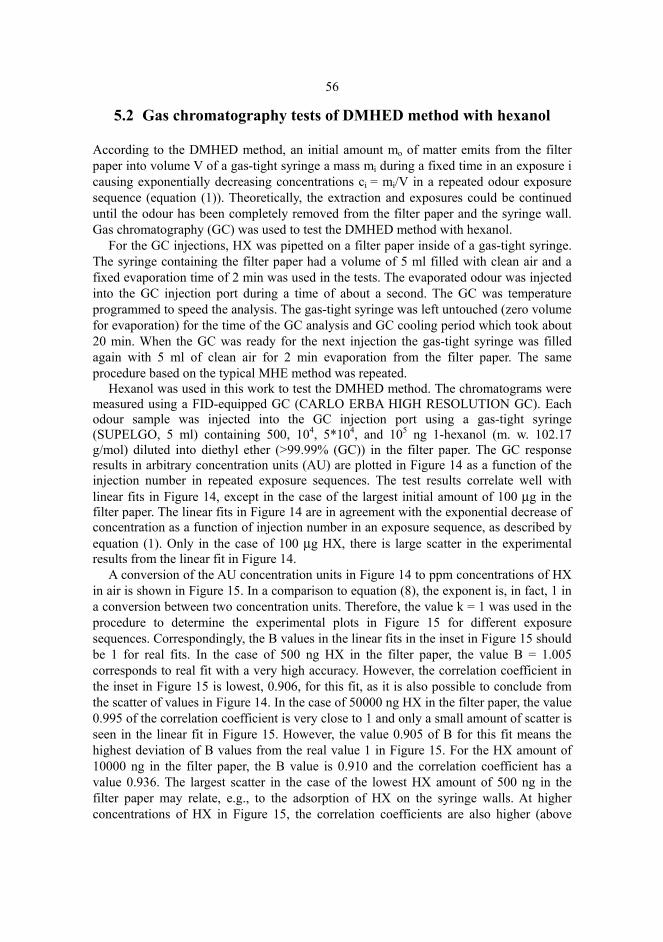
56
5.2 Gas chromatography tests of DMHED method with hexanol
According to the DMHED method, an initial amount mo of matter emits from the filter paper into volume V of a gas-tight syringe a mass mi during a fixed time in an exposure i causing exponentially decreasing concentrations ci = mi/V in a repeated odour exposure sequence (equation (1)). Theoretically, the extraction and exposures could be continued until the odour has been completely removed from the filter paper and the syringe wall. Gas chromatography (GC) was used to test the DMHED method with hexanol.
For the GC injections, HX was pipetted on a filter paper inside of a gas-tight syringe. The syringe containing the filter paper had a volume of 5 ml filled with clean air and a fixed evaporation time of 2 min was used in the tests. The evaporated odour was injected into the GC injection port during a time of about a second. The GC was temperature programmed to speed the analysis. The gas-tight syringe was left untouched (zero volume for evaporation) for the time of the GC analysis and GC cooling period which took about 20 min. When the GC was ready for the next injection the gas-tight syringe was filled again with 5 ml of clean air for 2 min evaporation from the filter paper. The same procedure based on the typical MHE method was repeated.
Hexanol was used in this work to test the DMHED method. The chromatograms were measured using a FID-equipped GC (CARLO ERBA HIGH RESOLUTION GC). Each odour sample was injected into the GC injection port using a gas-tight syringe (SUPELGO, 5 ml) containing 500, 104, 5*104, and 105 ng 1-hexanol (m. w. 102.17 g/mol) diluted into diethyl ether (>99.99% (GC)) in the filter paper. The GC response results in arbitrary concentration units (AU) are plotted in Figure 14 as a function of the injection number in repeated exposure sequences. The test results correlate well with linear fits in Figure 14, except in the case of the largest initial amount of 100 µg in the filter paper. The linear fits in Figure 14 are in agreement with the exponential decrease of concentration as a function of injection number in an exposure sequence, as described by equation (1). Only in the case of 100 µg HX, there is large scatter in the experimental results from the linear fit in Figure 14.
A conversion of the AU concentration units in Figure 14 to ppm concentrations of HX in air is shown in Figure 15. In a comparison to equation (8), the exponent is, in fact, 1 in a conversion between two concentration units. Therefore, the value k = 1 was used in the procedure to determine the experimental plots in Figure 15 for different exposure sequences. Correspondingly, the B values in the linear fits in the inset in Figure 15 should be 1 for real fits. In the case of 500 ng HX in the filter paper, the value B = 1.005 corresponds to real fit with a very high accuracy. However, the correlation coefficient in the inset in Figure 15 is lowest, 0.906, for this fit, as it is also possible to conclude from the scatter of values in Figure 14. In the case of 50000 ng HX in the filter paper, the value 0.995 of the correlation coefficient is very close to 1 and only a small amount of scatter is seen in the linear fit in Figure 15. However, the value 0.905 of B for this fit means the highest deviation of B values from the real value 1 in Figure 15. For the HX amount of 10000 ng in the filter paper, the B value is 0.910 and the correlation coefficient has a value 0.936. The largest scatter in the case of the lowest HX amount of 500 ng in the filter paper may relate, e.g., to the adsorption of HX on the syringe walls. At higher concentrations of HX in Figure 15, the correlation coefficients are also higher (above
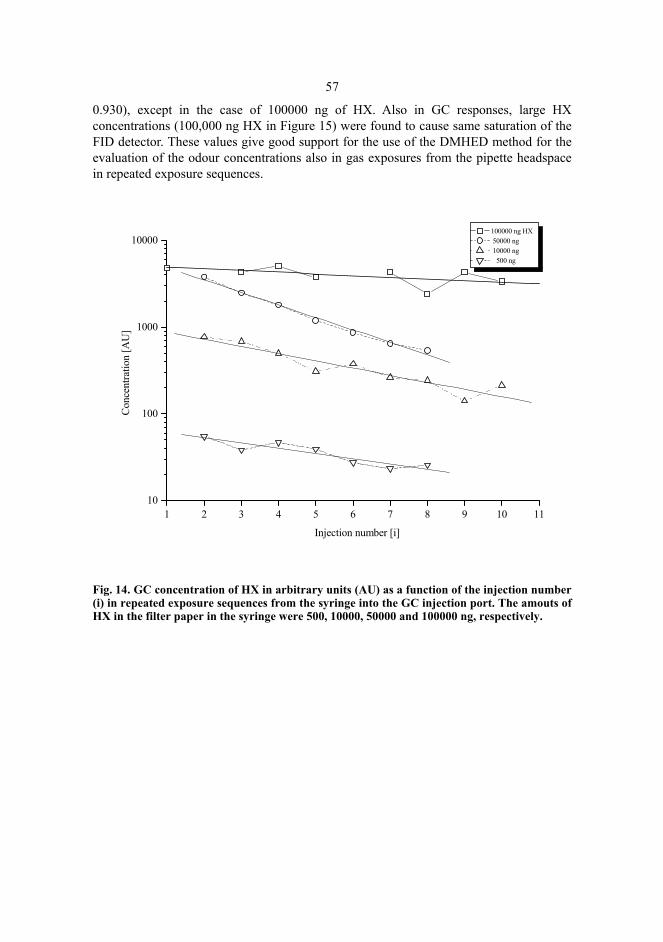
57
0.930), except in the case of 100000 ng of HX. Also in GC responses, large HX concentrations (100,000 ng HX in Figure 15) were found to cause same saturation of the FID detector. These values give good support for the use of the DMHED method for the evaluation of the odour concentrations also in gas exposures from the pipette headspace in repeated exposure sequences.
1 2 3 4 5 6 7 8 9 10 1110
100
1000
10000 100000 ng HX 50000 ng 10000 ng 500 ng
Conc
entra
tion
[AU
]
Injection number [i]
Fig. 14. GC concentration of HX in arbitrary units (AU) as a function of the injection number (i) in repeated exposure sequences from the syringe into the GC injection port. The amouts of HX in the filter paper in the syringe were 500, 10000, 50000 and 100000 ng, respectively.
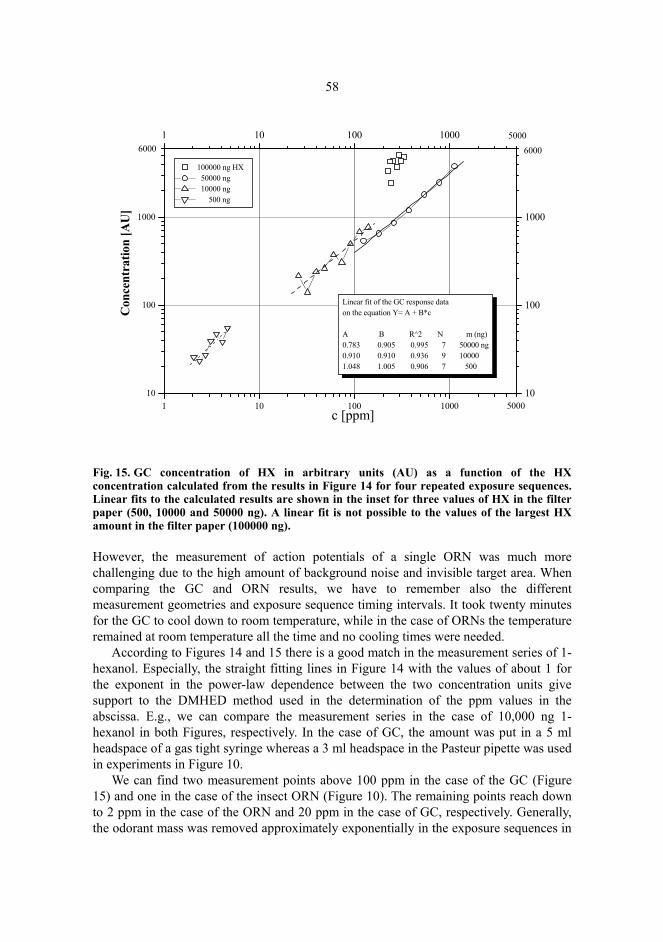
58
1 10 100 100010
100
1000
1 10 100 1000
10
100
1000
50006000
Linear fit of the GC response data on the equation Y= A + B*c
A B R^2 N m (ng)0.783 0.905 0.995 7 50000 ng0.910 0.910 0.936 9 100001.048 1.005 0.906 7 500
6000
5000
100000 ng HX 50000 ng 10000 ng 500 ng
Con
cent
ratio
n [A
U]
c [ppm]
Fig. 15. GC concentration of HX in arbitrary units (AU) as a function of the HX concentration calculated from the results in Figure 14 for four repeated exposure sequences. Linear fits to the calculated results are shown in the inset for three values of HX in the filter paper (500, 10000 and 50000 ng). A linear fit is not possible to the values of the largest HX amount in the filter paper (100000 ng).
However, the measurement of action potentials of a single ORN was much more challenging due to the high amount of background noise and invisible target area. When comparing the GC and ORN results, we have to remember also the different measurement geometries and exposure sequence timing intervals. It took twenty minutes for the GC to cool down to room temperature, while in the case of ORNs the temperature remained at room temperature all the time and no cooling times were needed.
According to Figures 14 and 15 there is a good match in the measurement series of 1-hexanol. Especially, the straight fitting lines in Figure 14 with the values of about 1 for the exponent in the power-law dependence between the two concentration units give support to the DMHED method used in the determination of the ppm values in the abscissa. E.g., we can compare the measurement series in the case of 10,000 ng 1-hexanol in both Figures, respectively. In the case of GC, the amount was put in a 5 ml headspace of a gas tight syringe whereas a 3 ml headspace in the Pasteur pipette was used in experiments in Figure 10.
We can find two measurement points above 100 ppm in the case of the GC (Figure 15) and one in the case of the insect ORN (Figure 10). The remaining points reach down to 2 ppm in the case of the ORN and 20 ppm in the case of GC, respectively. Generally, the odorant mass was removed approximately exponentially in the exposure sequences in

59
Figure 14 in agreement with equation (1). The ppm unit is useful because its numerical value is unaffected by the temperature or pressure changes (Seinfeld & Pandis 1998).
5.3 Diaminobutane sensing
An example of the 1,4-diaminobutane (14DAB) sensing by blowfly ORNs is shown in Figure 16 where an action potential response of an ORN is shown at exposure to an initial amount of 10 ng 14DAB in the filter paper (1st exposure). The increase in the action potential rate starts at about 200 ms after the start of the exposure and continues slowly decreasing about a second after the end of the exposure. The average response rate is about 200 pps during the last 500 ms of the exposure.
In Paper V, more results of the 14DAB sensing by blowfly ORNs are described. Some results of the 14DAB sensing from Paper V are shown in Figure 17. It was found also in this case that the action potential rate as a function of the exposure number in a repeated exposure sequence follows the exponential equation (4) (compare with Figure 10 for HX). Then, the assumption of the power-law relation according to equation (8) made it possible to calculate the results shown in Figure 17 on the basis of equation (1) from the DMHED method. The same procedure as in the case of HX in Figure 10 was used to determine both the experimental and fitted plots in Figure 17. A value k = 15 was used to calculate the value of β in equation (1) and the odour concentrations at each exposure in the exposure sequence according to equations (1) and (3). The value k = 15 gives a common value 1/15 = 0.067 for the power-law exponent in the case of different 14DAB exposure sequences. An odour pulse sequence in the DMHED method was composed of up to ten single exposure pulses produced by 1 s air flows at 2 min intervals and directed to the insect ORN. In experimentation, almost all action potential rates followed power-law fits provided that the initial odour amount in the filter paper was small enough. The B values in the inset of Figure 17 are about the same, except for a case of 10 ng of 14DAB in the filter paper where the low number of points (5) limits the accuracy of the fit. The B values and also the values of the power-law exponents from equation (10) are much smaller as compared with those of HX exposure, as shown in Table 2 on page 65. The exponent values, especially those related to the amount of 5000 and 10000 ng, in Table 2 are close to the approximate common value of 0.067. The highest value of the correlation coefficient of 0.987 relates to a case of 5000 ng of 14DAB in the filter paper, whereas the lowest value of 0.836 relates to the highest 14DAB concentration of 10000 ng in the filter paper (see inset in Figure 17). The blowfly ORN in Figure 17 is very sensitive to small 14DAB concentrations down to 1 ppb.
All response results in Figure 17 were measured with the same blowfly ORN. The results from the two exposure sequences with the same initial amount of 5000 ng of 14DAB in the filter paper are in a close agreement in Figure 17. This is also now an indication for the fact that the decaying action potential rates at repeated exposures in the sequences relate to decreasing 14DAB concentrations and are not caused by simultaneous decaying responsiveness of the preparation.
The same blowfly ORN responded also to both 14DAB (putrescine) and to 1,5-diaminopentane (cadaverine) (Paper V). Butyric acid and hexanol exposures did not

60
cause at all a response in this ORN. Thus, this ORN had some specificity for diamine sensing.
time (s)
250
125
0
Rat
e [p
ps]
2.0 s 0.0 s 1.0
Fig. 16. A blowfly ORN response to an initial amount of 10 ng 14DAB in the filter paper (1st exposure). The arrows show the exposure time as in Figure 11.
Fig. 17. Action potential rates of a blowfly ORN vs. concentration of 14DAB estimated by the DMHED method on the basis of equation (8) (α* = kα with k = 15) from the initial amounts of 14DAB in the filter paper of 10 ng (two sequences), 5000 ng (two sequences), and 10000 ng together with linear fits to the experimental values in the inset (from Paper V).

61
5.4 Butyric acid sensing
The BA responses were typically long-lasting, similar to the responses in the case of the 14DAB exposure, and BA was never found to cause inhibitory responses (silent periods), such as those in the case of HX sensing in Figure 13. Figure 18 shows an action potential response of a blowfly ORN to 50 µg BA as an initial amount in the filter paper (1st exposure). The action potential rate is shown by the continuous line and its integral by the dotted line in Figure 18. The integration of the stimulated action potential rate gave a value of 187 pps between 2.2 and 3.0 s in Figure 18. The spontaneous action potential rate was around 35 pps based on the same integration results in Figure 18 between 0.0 and 2.2 s.
Fig. 18. Action potential rate of a blowfly ORN response (continuous line) to 50 µg BA in the filter paper (1st exposure). The exposure caused a peak response of 330 pps at the start of the BA exposure, lasting around 200 pps during the exposure. The average action potential rate from the integration was 187 pps between 2.2 and 3.0 s. The spontaneous action potential rate was about 35 pps. The integral of the action potential rate between 0.0 and 3.0 s is also shown (dotted line). The arrow shows the start of the exposure.
The results of the BA sensing by blowfly ORNs are described in Paper V. Some results are also shown in Figure 19. In this case, excitatory ORN responses were used for butyric acid odour sensing. It was found also for the case of BA responses that the action potential rate as a function of the exposure number in a repeated exposure sequence
time (s)
0,0 0,5 1,0 1,5 2,0 2,5 3,0 0
50
100
150
200
250
300
350 50 µg BA
Pulse rate (pps) Integral of pulse rate
Rat
e [p
ps]

62
follows the exponential equation (4). Also now the assumption of the power-law relation according to equation (8) made it possible to calculate the results shown in Figure 19 on the basis of equation (1) from the DMHED method. The same procedure as in the case of HX in Figure 10 with the value k = 3 was used to determine both the experimental and fitted plots in Figure 19. The value k = 3 gives a common value 1/3 = 0.33 for the power-law exponent in the case of the two BA exposure sequences in Figure 19. The B values in the inset in Figure 19 are about the same 1.063 and 1.082 for the amounts of 5000 ng and 50000 ng of BA in the filter paper, respectively. These B values together with the power-law exponents from equation (10) are larger than the corresponding values for HX and 14DAB. The values of the power-law exponent for the two exposure sequences in Figure 19 are given in Table 2 on page 65. Both exponent values 0.320 and 0.326 are close to the approximate common value of 0.33. The lower value 0.907 of the correlation coefficient in the inset in Figure 19 relates to the case of the lower BA concentration in the filter paper. Both response sequences in Figure 19 were measured with the same blowfly ORN.
The shape of the action potentials usually changes during an odour exposure. This does not lead to variable results when a single cell response is concerned, because the analysis of the action potential rates is based on the single trigger level. However, when we have two or even three cell responses on the same record, the action potentials originating from a neighbouring cell can cause extra peaks in the action potential rate during the free-running period.
Many computer-based devices have considerably increased the speed of analysing the data of insect ORN measurements. In the near future, virtual reality technology could also be used in many areas of biosensor research, such as in quantifying and analysing odorant exposure data. Thus, an improvement of the quality of the research will minimize the amount of microelectrodes needed.

63
Fig. 19. Action potential rates of a blowfly ORN vs. concentration of butyric acid (BA) estimated by the DMHED method on the basis of equation (8) (α* = kα with k = 3) for the initial amounts of BA in the filter paper of 5000 ng and 50000 ng together with linear fits to the experimental values in the inset (from Paper V).
5.5 Odour amounts in exposures and power-law exponents
The amounts of HX, 14DAB and BA odours have been calculated for all odour exposures shown in Figures 10, 17 and 19. The concentration value (in ppm units) of each exposure in Figures 10, 17 and 19 is used to calculate the odour amount in the volume 3 ml of the pipette headspace, whereas the volume 5 ml of the syringe headspace is used for the amount calculations of exposures in Figure 15. The calculations are based on the molecular weights of 102.17, 88.15, and 88.11 g/mol for HX, 14DAB, and BA, respectively, and on the conversion formula 1 ppm = 4.17 ng/ml for HX at 25
oC and 760
mmHg. The odour amounts of the 2nd (highest exposure concentration in Figures 10, 15, 17 and 19) and last exposure together with the total amount of odour in all exposures in the repeated exposure sequence are given in Tables 1-3 for four HX exposure sequences in Figure 10, for three HX exposure sequences in Figure 15, for four 14DAB exposure sequences in Figure 17, and for two BA exposure sequences in Figure 19. The total odour amounts in the sequences are given also in terms of percentage of the nominal value of the odour in the filter paper in Tables 1-3. In addition, the values of the power-law exponent in equation (8) are given for all exposure sequences in Tables 1-3. The values are calculated from the B values in the insets in Figures 10, 15, 17 and 19 according to equation (10).
64
The total odour amounts in the exposure sequences in Tables 1-3 in the case of ORN sensing are between 26 and 48 % of the initial odour amounts in the filter paper. The absence of the 1st exposures in the sequences is a reason for these low percentage values. A part of the odour is still in the filter paper and adsorbed on the walls of the pipette at the end of the exposure sequences. This may have an increased effect in the case of a low initial amount of odour in the filter paper, as it is possible seen in the values of the GC tests in Tables 1-3. However, all these three values are close to 100% (a value above 100%) which means that the adsorption is not a strong effect for HX exposures from the syringe into the GC injection port. The expanding volume of the exposure pulse in open air between the Pasteur pipette and insect antenna and the corresponding dilution of the odour concentration may be the main reason for the low total percentage amounts of odour in the case of ORN exposures in Tables 1-3, as compared to the corresponding total percentage amounts of HX odour in the GC tests in Table 1. In addition, the diffusion of odour out of the pipette headspace through the open end of the pipette during the evaporation period is a reason for the low percentage values in the case of ORN sensing in Tables 1-3.
The power-law exponents in Tables 1-3 are about 0.19, 0.065 and 0.32 for HX, 14DAB and BA, respectively. Psychophysical studies on olfaction have dealt with different aspects of odour perception: odour quality, odour threshold and the suprathreshold intensity function. The Stevens’ power law is used to relate the intensity of the perception to the stimulus concentration and to derive the psychophysical exponent (Stevens 1957). The law relates sensation magnitude S to stimulus intensity (concentration in the case of olfaction) I by a formula
nIaS ⋅= (11)
or
( ) ( ) ( ) 'A)Ilog(nalogIlognSlog +⋅=+⋅= (12)
When plotted on log-log axes, the power law plots as a straight line with the slope of the exponent. The values determined for the exponent n in the case of olfaction are of similar size as the power-law exponents in Tables 1–3. For instance, Patte et al. (1975) reported the values 0.39 and 0.33 of the exponent n for HX and BA, respectively. The values of the exponent n determined by Martin et al. (2004) for 13 sulphur compounds (4 sulphides and 9 S-methyl thioesters) ranged from 0.83 (dimethyltrisulphide) to 1.42 (S-methyl thioisobutanoate). In the investigation (Martin et al. 2004), the evolution of odour intensity according to the concentration of the sulphur compounds was assessed by a procedure of olfactory matching (ASTM 1975). Isoamyl acetate was chosen as the reference odorant. A value 0.25 of n was given to isoamyl acetate by Patte et al. (1975). It is possible to find more information on the values of power-law exponents n in a book by Devos et al. (2002).
The results obtained here for the dependence of the action potential rate on odour concentration (equation (8)) may relate to the basics of the suprathreshold intensity

65
function (Stevens’ law) in psychophysics.1 This kind of basics are very necessary support against the criticism subjected to Stevens’ law by considering this law to be a conceptual misdirection (Anderson 1975, 1992) or by questioning even the very foundation of quantitative psychology – the quantitative nature of psychological entities, including sensations (Michell 1997), see Marinov (2004).
Table 1. Odour amounts in 2nd and last exposures together with the total odour amounts in repeated exposure sequences for HX in Figures 10 (four sequences) and Figure 15 (three sequences).
HX HX amounts in exposures HX(%) exponent Figure 10
10000 2nd 1310 ng, last 28 ng, Σ = 3400 ng 34 0.194 50000 (a) 2nd 6500 ng, last 625 ng, Σ = 24250 ng 48 0.194 50000 (b) 2nd 6500 ng, last 250 ng, Σ = 19450 ng 39 0.181 50000 (c) 2nd 6250 ng, last 930 ng, Σ = 23680 ng 47 0.203
Figure 15 500 2nd 92 ng, last 41 ng, Σ = 450 ng 90 1.005 10000 2nd 2600 ng, last 450 ng, Σ = 9940 ng 99 0.910 50000 2nd 22900 ng, last 2300 ng, Σ = 58700 ng 117 0.905
The total odour amounts in the sequences are also given as percent values of the nominal amount of odour in the filter paper. The values of the power-law exponent in equation (8) are given in the last column for all exposure sequences.
Table 2. Odour amounts in 2nd and last exposures together with the total odour amounts in repeated exposure sequences for 14DAB in Figure 17 (four sequences).
14DAB in Figure 17 14DAB amounts in exposures 14DAB(%) exponent 10000 2nd 1310 ng, last 75 ng, Σ = 4130 ng 36 0.066 a) 5000 2nd 625 ng, last 5 ng, Σ = 1680 ng 30 0.064 b) 5000 2nd 625 ng, last 25 ng, Σ = 1490 ng 26 0.063 10 2nd 2.5 ng, last 0,02 ng, Σ = 4.4 ng 40 0.082 The total odour amounts in the sequences are also given as percent values of the nominal amount of odour in the filter paper. The values of the power-law exponent in equation (8) are given in the last column for all exposure sequences.
Table 3. Odour amounts in 2nd and last exposures together with the total odour amounts in repeated exposure sequences for BA in Figure 19 (two sequences).
BA in Figure 19 BA amounts in exposures BA(%) exponent 5000 2nd 375 ng, last 225 ng, Σ = 1775 ng 31 0.320 50000 2nd 2560 ng, last 1370 ng, Σ =18660 ng 32 0.326 The total odour amounts in the sequences are also given as percent values of the nominal amount of odour in the filter paper. The values of the power-law exponent in equation (8) are given in the last column for all exposure sequences.
1 of course, we do know nothing on the psychophysics of insects.
66
5.6 Neutroil® tests with large pine weevil ORNs
Pine weevil antennae were exposed to odour chemicals typical for pine trees, such as α-pinene, ethanol, and α-pinene-ethanol mixture, in addition to Neutroil® hexane mixture, and hexane exposures. Neutroil® is a commercial product from forest industry which is used as a component of printing inks and for rust preventatives, and also for some other applications. Neutroil® has also been studied with preliminary feed tests as a possible large pine weevil repellent to prevent their damage to pine seedlings (S. Lilja, personal communication). In Paper VI, the odour sensing of these odorant compounds by large pine weevil ORNs is described. These preliminary tests were performed by single cell electrophysiological methods using both the action potential rates and EAG recordings. The results of olfactory responses of the large pine weevil during exposure to Neutroil® and to the other compounds were documented. The effects of the Neutroil® odour were the main concern in the study. Electrophysiological tests exposing the large pine weevil ORNs to Neutroil® have not been reported previously in the literature.
Typically, the ORNs of the pine weevil sent out action potentials randomly, similarly as other studied insects, and the rate increased at exposure to α-pinene, ethanol and α-pinene-ethanol mixture, while the exposure to Neutroil®-hexane mixture odour typically caused a decrease of the rate or even an absolute inhibition of the action potentials (silent periods). The average values of the silent periods and their standard deviations at exposure to diluted Neutroil® did not differ significantly between genders. In the future, it would be possible to use this kind of chemical exposure tests to find possible repellents for both genders of the large pine weevil. Before large-scale field tests on repellents, it may be useful to have knowledge on their effects on the action potential response of the olfactory receptor neurons of a specific insect.
6 Conclusions
Insect olfaction (sense of smell) comprises extraordinarily sensitive ORNs for the detection and discrimination of odorant molecules (Stevens 1960). In technology, many gas microsensors based, e.g., on silicon and semiconductor oxides have also been developed for odour sensing (Gardner 1996). Also, the human olfactory sense is still an important method for the evaluation and control of odours which are detectable for human olfaction. However, the human odour sensing has in many cases poor selectivity and low sensitivity, similarly as electronic chemical sensors. Biological sensing based on insect olfactory receptor neurons has better specificity and higher sensitivity for many odours. Some specificity was found also in this study, e.g., in responses of blowfly ORNs to HX, BA, and some diamines like 14DAB. However, selectivity in its proper sense needs still to be evaluated with appropriate sets of test odours (compare with Paper III).
A low value of the power-law exponent usually means high sensitivity and low threshold concentration. This is the case for HX, 14DAB and BA in Figures 10, 17 and 19, respectively. The highest sensitivity relates to 14DAB with the lowest exponent value of about 0.065. At the concentration of 1 ppb in Figure 17 the action potential rate is still about 100 pps in a case of 10 ng 14 DAB in the filter paper. If we take the value 0.065 for the exponent n in equation (12) and calculate A’ in the same equation as an average from four uppermost A values in the inset of Figure 17, the action potential rate 35 pps is reached with the 14DAB concentration of about 10-2 ppq. The rate value 35 pps is still higher than the average spontaneous rate value (~25 pps). It is not possible to measure the low 14DAB concentrations much below 1 ppb directly with either GC or GC-MS. Similar calculations for HX and BA in Figures 10 and 19, respectively, give concentration values of about 10-2 ppm and 2 ppm at the rate value of 35 pps, respectively. With GC and GC-MS it is possible to reach detection limit concentrations between 10 ppb and 1 ppm in air depending very much on the odour compound and the detector in GC. Of course, it is possible to detect concentrations much below 10 ppb in air for some organics, e.g., using modifications of commercial mass spectrometers. An example is given by Nikolaev et al. (2004) where a corona discharge ion source operating at atmospheric pressure in the point-to-plane configuration was constructed by reconfiguring the ion source of a commercial electrospray ionization (ESI) quadrupole mass spectrometer. For the chemical warfare agent simulants methyl salicylate and dimethyl methylphosphonate
68
obtained limits of detection were 60 pptr in the negative-ion mode and 0.8 ppb in the positive-ion mode for methyl salicylate and 0.8 ppb in the negative-ion mode and 3.6 ppb in the positive-ion mode for dimethyl methylphosphonate. Some results of direct analysis with low limits of detection of semivolatile organic compounds in air by commercial atmospheric pressure chemical ionization MS are given by Charles et al. (2001). Both single-stage MS and tandem MS/MS was used in the study. The use of membrane introduction mass spectrometry (MIMS) makes it also possible to measure very low concentrations of both volatile and semi-volatile organic compounds down to pptr level, e.g., in environmental applications (Ketola et al. 2002).
In this work, it was impossible to distinguish between the three sensillum types (basiconic, tricoidea and coeloconic) according to the measurement results. However, it was possible to record both action potentials and the EAG signal simultaneously. It is more reliable to place the reference microelectrode into the antenna instead of the insect eye or other organ parts. The EAG recordings were not as specific as action potentials. Thus, in this work action potential recordings were mainly concerned. The TVC device with an adjusted trigger level can select action potentials for pulse rate determination.
The blowfly ORNs were exposed to HX, BA, and 14DAB. The reported response results are in each case from a single ORN. The action potential rate vs. odour concentration was found to follow a power law similar to the Stevens’ power law for the sensory function in the psychophysics (Stevens 1957, 1960). The same procedure was used for all three odours to determine the action potential rate as a function of the odour concentration. In the case of HX, GC was used, in addition, to test the odour concentrations in the DMHED method. In earlier studies in the literature, the diamines are lacking. By conventional means, the amines concentrations can be determined by liquid chromatography, but they are difficult to analyse by conventional means of GC.
14DAB is a polyamine which is present in all cells. The ORNs are the excitable cells which might be modulated, e.g., with polyamines. The polyamines can control the excitability threshold in ORNs as well as in muscle cells (Williams, 1997). BA is an organic acid evaporating from any decaying meat source. It could be an indicator of spoilage also for the blowfly. HX is a floral alcohol. It evaporates from flowering plants over which blow flies buzz.
The presented results of the insect ORNs as biological olfactory sensors are just the beginning for our understanding on the possibility to use insect olfactory sense for this purpose. The action potential responses of ORNs introduce many challenges to overcome and also the phenomena behind the olfactory coding is challenging and intriguing for researchers. There are numerous features of response functions that are unclear and should be unveiled. In the future, we might be able to understand how the time-varying inherent properties of ORNs depend on one another. However, the exact quantification of an inhibitory olfactory biosensor could be only a behavioural description. Large amounts of an odour (over 100,000 ng HX in the filter paper) were found to cause saturation of ORN responses.
In addition to odour exposure, in experiments there is also a mechanical exposure which depends on external physical parameters while the odour exposure additionally depends on the modulation of the internal environment, i.e., the physiological state of the animal. Most ORNs are likely to respond to one or more odorants that will alter their intrinsic state. That is why responses of ORNs could be described by the temporal
69
dynamics of a defined ORN and its environment together. The time-varying response dynamics depends on many factors, such as odour sequestering. In this process, some odours are not hydrolysed enzymatically as fast as others. Thus, the great challenge is to define the response dynamics for ORNs which differs from their intrinsic properties.
One of the main subjects of this thesis has been to study the action potential response as a function of odour concentration. Insect olfactory receptor systems and their molecular and cellular components were also briefly introduced. The results gained by the time-to-voltage converter connected with the digital dynamic signal analyser were presented and their relevance for the analysis of olfactory receptor data and the development of possibilities for different receptor responses were discussed. These signals are easily analysed by the time-to-voltage converter. The discontinuous multiple headspace extraction and dilution (DMHED) method was used for the determination of odour concentrations in this work.
The following conclusions can be drawn on the basis of the present study:
1. Action potentials and their analysis have features that are not available by some other neurophysiological sensory measurement methods. E.g., electroantennogram (EAG) responses are one of the common response measurements, but the EAG analysis neglects the details of action potential analysis as a whole.
2. The location of a specific active ORN cannot be found by a simple optical microscope within a coordinate system, because the resolution is limited. Hence, an odour exposure must be used to locate a specific ORN. The devices used here need to be improved in this respect. The several improvements that have been realized already earlier with the original simple systems, however, have not helped to locate ORNs precisely enough.
3. Increasing computer power will allow the development of new action potential analysing software for the recording and analysis of long-lasting and spike-to-spike patterning responses to odour exposures. Some insect ORNs yield longer responses with special endings, such as mosquito ORNs. Despite that the overall response is not necessarily any stronger.
4. The custom-made pulse shaper together with the commercial time-to-voltage converter (TVC) made possible a proper action potential detection and rate determination together with digital signal analyzer.
5. The reproducibility of the action potential recordings made it possible to use repeated exposure sequences for recording action potentials as a function of odour concentration (the DMHED method).
6. GC was used in the case of HX to test the reliability of the DMHED method for the evaluation of odour concentrations at exposures in exposure sequences. The obtained percent values of the total odour amounts in the exposure sequences in Tables 1-3 on page 65 are about of a size to HX, 14DAB and BA.
7. It was found that the action potential rate vs. odour concentration obeys a power law similar to the Stevens’ power law for sensory function in the psychophysics. A thermodynamic entropy concept tested with low salt concentrations has given as an explanation for the Stevens’ law in the literature (Norwich 1993, 2001).
8. The power-law exponents obtained in this work from the relation between action potential rate and odour concentration are of similar size as the exponents in the

70
Stevens’ law. E.g., the values of about 0.19 and 0.32 of the power-law exponent obtained in this work for HX and BA, respectively, (Table 1 and 3) are close to the values 0.39 and 0.33 reported for HX and BA, respectively, in the Stevens’ law (Patte et al. 1975).
Real “biosensor” research is still in its infancy, and many measurement systems are just being developed to their third generation after Clark’s oxygen sensor (Clark & Lyons 1962). An example of the latest approaches based on olfactory responses of intact insect antennae is given by Schütz et al. (1999). New opportunities will open up in the forthcoming years allowing bioanalytics to make the measurements instantly on the spot and from completely new horizons, especially, in the analysing of both patients, veterinary subjects, and environmental samples. In the mosquito antennae, there are excitatory and inhibitory olfactory receptor neurons to lactic acid evaporated from humans (Davis & Bowen 1994). When searching for a human target, the mosquito ORNs become very sensitive to lactic acid and after a human blood meal the same ORNs will be desensitised or even inhibited. In the blowfly antennae, it was found only excitatory ORNs to butyric acid. Inhibitory and excitatory responses were observed at exposure to hexanol odour of blowfly ORNs which were sensitive to 14DAB. In the fortuitous repeated experiments the responding sensilla were found by tests and the same sensilla were used for the exposure series with the compound. The recordings described here are only from a blowfly for HX, from another for 14DAB and still from another for BA and the results relate to only one ORN in each case. A reason for the lack of statistical treatment is that only in a few experiments an ORN of an insect produced a comprehensive response series in repeated exposure sequences. The long time needed to find a responding ORN is the other reason for the lack of statistical treatment, since the blowfly population was living in artificial conditions, and the biological degeneration of the population was suspected to cause many failed experiments. It took about 2-3 hours to find a responding ORN to an odour. For instance, it was necessary in nearly all experiments to exchange the recording electrode during finding a responding ORN. This is, of course, a very important point for possible practical applications of ORNs as biosensors. Therefore, for practical purposes it is necessary to develop a new fast method to find a responding ORN. In the case of pine weevil the statistical treatment with over 80 insects was possible to be made, since the insects were collected from nature.
The Stevens’ power law has been applied for many human sensory studies. In this study, the power-law exponent ranges from about 0.065 (for 14DAB) to 0.32 (for BA), depending on the odorant. For an odorant like 14DAB with the exponent equal to 0.065, a 10-fold increase in odour concentration increases the action potential rate by a factor 1.16, whereas for an odorant like BA with the exponent equal to 0.32, a 10-fold increase in odour concentration increases the action potential rate by a factor 2.09.
References
Amoore JE (1970) Molecular Basis of Odor. C.C. Thomas Pub., Springfield, USA. Anderson NH (1975) On the role of context effects in psychophysical judgement. Psychological
Review 82: 462-482. Anderson NH (1992) Intergration psychophysics and cognition. In Algom D (Ed) Psychophysical
approaches to cognition, North-Holland, Amsterdam, pp. 13-113. Anholt RRH & Mackay TFC (2001) The genetic architecture of odor-guided behavior in
Drosophila melanogaster. Behavior Genetics 31 (1): 17-27. ASTM Standard E-544-75 (1975). Standard recommended practices for referencing suprathreshold
odor intensity. Philadelphia, Pennsylvania, USA. de Bruyne M, Foster K & Carlson JR (2001) Odor coding in the Drosophila antenna. Neuron 30:
537-552. Chai XS & Zhu JY (1998) Simultaneous measurements of solute concentration and Henry's
constant using multiple headspace extraction gas chromatography. Analytical Chemistry 70(16): 3481-3487.
Chai XS, Luo Q & Zhu JY (2002) Multiple headspace extraction–gas chromatographic method for the study of process kinetics. Journal of Chromatography A 946: 177–183.
Charles L, Riter LS & Cooks RG (2001) Direct analysis of semivolatile organic compounds in air by atmospheric pressure chemical ionization mass spectrometry. Analytical Chemistry 73 (21): 5061-5065.
Clark LC & Lyons C (1962) Electrode systems for continuous monitoring in vascular surgery. Annals of New York Academy of Science 102: 29-45.
Damay E (1997) Rheology of blood cells in sickle cell disease. Master of science thesis in University of Florida.
Davis EE (1984) Development of lactic acid receptor sensitivity and host-seeking behavior in newly emerged female Aedes aegypti mosquitoes. Journal of Insect Physiology 30(3): 211-215.
Davis EE & Bowen MF (1994) Sensory physiological basis for attraction in mosquitoes. Journal of American Mosquito Control Association 10(2): 316-325.
Devos M, Rouault J & Laffort P (2002) Standardized olfactory power law exponents. EUD Sciences, Dijon, France.
Djupsund K, Kouvalainen E, Järvilehto M & Weckström M (1995) A digital feedback controller application for studying photoreceptor adaptation by ‘voltage clamp by light’. Journal of Neuroscience Methods 62: 29-36.

72
Ezquerro Ó, Ortiz G, Pons B & Tena MT (2004) Determination of benzene, toluene, ethylbenzene and xylenes in soils by multiple headspace solid-phase microextraction. Journal of Chromatography A: 1035: 17-22.
Gardner JW (1996) Microsensors, Principles and applications. John Wiley & Sons, Chichester, England.
Getz WM (1999) A kinetic model of the transient phase in the response of olfactory receptor neurons. Chemical Senses 24: 497-508.
Getz WM & Lutz A (1999) A neural network model of general olfactory coding in the insect antennal lobe. Chemical Senses 24: 351-372.
Gleesson R, Carr WES & Trapido-Rosenthal HG (1993) Morphological characteristics facilitating stimulus access and removal in the olfactory organ of the spiny lobster, Panulirus argus: insight from the design. Chemical Senses 18: 67-75.
Gomez G, Voigt R & Atema J (1994) Frequency filter properties of lobster chemoreceptor neurons determined with high-resolution stimulus measurement. Journal of Comparative Physiology 174A: 803-811.
Göpel W (1998) Chemical imaging. I Concepts visions for electronic and bioelectronic noses. Sensors & Actuators B 52: 125¯142.
Grass Model P16 AC/DC microelectrode amplifier with probe (1968) User manual, Grass Instruments, Quincy, Mass., USA.
Hirano Y, Oosawa T & Tonosaki K (2000) Electroencephalographic olfactometry (EEGO) analysis of odour responses in dogs. Research in Veterinary Science 69: 263-265.
Hodgson ES, Lettvin JY & Roeder KD (1955) Physiology of a primary chemoreceptor unit. Science 122: 417-418.
Juusola M, Uusitalo RO & Weckström M (1995) Transfer of Graded Potentials at the Photoreceptor-Interneuron Synapse. Journal of General Physiology 105: 117-148.
Kafka WA (1970) Molekulare Wechselwirkungen bei der Erregung einzelner Riechzellen. Zeitschrift für vergleichende Physiologie 70: 105-143.
Kaib M (1974) Die Fleisch- und Blumenduftrezeptoren auf der Antenne der Schmeissfliege Calliphora vicina. Journal of Comparative Physiology 95: 105-121.
Kaissling KE (1987) R.H. Wright Lectures on Insect Olfaction. K.Colbow (ed.) Burnaby B.C., Canada: S.Fraser Univ.
Kanzaki R & Shibuya T (1992a) Long-lasting excitation of protocerebral bilateral neurons in the pheromone-processing pathways in the male moth Bombyx mori. Brain Research 587: 211-215.
Kanzaki R & Shibuya T (1992b) Personal computer-based processing technique for analyzing insect mating behavior to sex pheromone odor. Sensors and Materials 4:1-9.
Kazakevich YV, LoBrutto R, Markelov M & McNair HM (2000) Discontinuous headspace desorption method for characterization of adsorbents. Journal of Physical Chemistry B 104: 554-563.
Keller A & Vosshall LB (2003) Decoding olfaction in Drosophila. Current Opinion in Neurobiology 13: 103-110.
Ketola RA, Kotiaho T, Cisper ME & Allen TM (2002) Environmental applications of membrane introduction mass spectrometry. Journal of Mass Spectrometry 37: 457-476.
Kolb B & Ettre L (1997) Static Headspace-Gas chromatography: Theory and Practice. Wiley-VCH, Winheim, Germany.
Mankin RW & Hagstrum DW (1995) Three-dimensional orientation of male Cadra cautella (Lepidoptera: Pyralidae) flying to calling females in a windless environment. Environmental Entomology 24 (Dec.) 1616-26.
Marinov SA (2004) Rerversed dimensional analysis in psychophysics. Perception & Psychophysics 66(1): 23-37.
73
Martin F, Kim MS, Hovemann B & Alcorta E (2002) Factor analysis of olfactory responses in Drosophila melanogaster enhancer-trap lines as a method for ascertaining common reception components for different odorants. Behavior Genetics 32 (1): 79-88.
Martin N, Neelz V & Spinnler HE (2004) Suprathreshold intensity and odour quality of sulphides and thioesters. Food Quality and Preference 15: 247-257.
Michell J (1997) Quantitative science and the definition of measurement in psychology. British Journal of Psychology 88: 355-383.
Minor AV & Kaissling KE (2003) Cell responses to single pheromone molecules may reflect the activation kinetics of olfactory receptor molecules. Journal of Comparative Physiology A 189: 221-230.
Morio DG (1996) Effect of deoxygenation in sickle cell anemia. Master of science thesis in University of Florida.
Mustaparta H (1996) Coding mechanisms in insect olfaction, in Bock GR & Cardew G (eds.) Symposium on Olfaction in Mosquito-Host Interactions, Ciba Foundation Symposia 200: 149-157.
Mustaparta H (2002) Encoding of plant odour information in insects: peripheral and central mechanisms. Entomologia Experimentalis et Applicata 104: 1-13.
Nicastro D, Melzer RR, Hruschka H & Smola U (1998) Evolution of small sense organs: sensilla on the larval antennae traced back to the origin of the diptera. Naturwissenschaften 85: 501-505.
Nakamuta K (1985) Mechanism of the switchover from extensive to area-concentrated search behaviour of the ladybird beetle Coccinella septempunctata Bruckii. Journal of Insect Physiology 31: 849-856.
Nikolaev E, Riter LS, Laughlin BC, Handberg E & Cooks RG (2004) Trace analysis of organics in air by corona discharge atmospheric pressure ionization using an electrospray ionization interface. European Journal of Mass Spectrometry 10 (2): 197-204.
Norwich KH (1993) Information, Sensation, and Perception. Academic Press; New York, USA. Norwich KH (2001) Determination of saltiness from the laws of thermodynamics – Estimating the
gas constant from psychophysical experiments. Chemical Senses 26: 1015-1022. Ochieng SA, Park KC & Baker TC (2002) Host volatiles synergize responses of sex pheromone-
specific receptor neurons in male Helicoverpa zea. Journal of Comparative Physiology A 188: 325-333.
Park KC, Ochieng SA, Zhu J & Baker TC (2002) Odor discrimination using insect electroantennogram responses from an insect antennal array. Chemical Senses 27: 343-352.
Patte F, Etcheto M & Laffort P (1975) Selected and standardized values of suprathreshold odor intensities for 110 substances. Chemical Senses and Flavor 1: 283-305.
Pophof B & van der Goes van Naters W (2002) Activation and inhibition of transduction process in silkmoth olfactory receptor neurons. Chemical Senses 27: 435-443.
Renou M & Lucas P (1994) Sex pheromone reception in Mamestra brassicae L. (Lepidoptera): Responses of olfactory receptor neurons to minor components of the pheromone blend. Journal of Insect Physiology 40 (1): 75-85.
Rieke F, Warland D, de Ruyter van Steveninck R & Bialek W (1997) Spikes: Exploring the Neural Code. A Bradford Book, London, England.
Sarkar U, Philip J, Longhurst PJ & Hobbs SE (2003) Community modelling: a tool for correlating estimates of exposure with perception of odour from municipal solid waste (MSW) landfills. Journal of Environmental Management 68: 133-140.
Sauer AE, Karg G, Koch UT & De Kramer JJ (1992) A portable EAG system for the measurement of pheromone concentration in the field. Chemical Senses 17: 543-553.
Schöning MJ & Poghossian A (2002) Recent advances in biologically sensitive field-effect transistors (BioFETs) Analyst 127: 1137–1151.

74
Schütz S, Weißbecker B & Hummel HE (1996) Biosensor for volatiles released by damaged plants. Biosensors & Bioelectronics 11: 427-433.
Schütz S, Weißbecker B, Koch UT & Hummel HE (1999) Detection of volatiles released by diseased potato tubers using a biosensor on the basis of intact insect antennae. Biosensors & Bioelectronics 14: 221-228.
Seinfeld JH & Pandis SN (1998) Atmospheric chemistry and physics. From air pollution to climate change. John Wiley & Sons, Inc. New York, USA.
Shanbhag SR, Mûller B & Steinbrecht RA (1999) Atlas of olfactory organs of Drosophila melanogaster. 1. Types, external organization, innervation and distribution of olfactory sensilla. Arthropod Structure & Development 28: 377-397.
Shanbhag SR, Mûller B & Steinbrecht RA (2000) Atlas of olfactory organs of Drosophila melanogaster. 2. Internal organization and cellular architecture of olfactory sensilla. Arthropod Structure & Development 29: 211-229.
Steinbrecht RA (1997) Pore structures in insect olfactory sensilla: A review of data and concepts. International Journal of Insect Morphology & Embryology 26: 229-247.
Stensmyr MC, Giordano E, Balloi A, Angioy AM, Hansson BS (2003) Novel natural ligands for Drosophila olfactory receptor neurons. Journal of Experimental Biology 206(4): 715-724.
Stevens SS (1957) On the psychophysical law. The psychological Review 64: 153-181. Stevens SS (1960) The psychophysics of sensory function. American Scientist 48(2): 226-253. Stocker RF (2001) Drosophila as a focus in olfactory research: Mapping of olfactory sensilla by
fine structure, odor specificity, odorant receptor expression, and central connectivity. Microscopy Research and Technique 55: 284-296.
Teac RD-101T/RD-111T pcm data recorder instruction manual (1990), Teac corporation, Tokyo, Japan.
Time to Voltage Converter (TVC 501) Operator’s Guide (1990) Tektronix®, Inc.,USA. Vogt RG, Callahan FE, Rogers ME & Dickens JC (1999) Odorant binding protein diversity and
distribution among the insect orders, as indicated by LAP, an OBP-related protein of the true bug Lygus lineolaris (Hemiptera, Heteroptera). Chemical Senses 24: 481-495.
Williams K (1997) Interactions of polyamines with ion channels. Biochemical Journal 325: 289-297.