chapter charitablegivingeconweb.ucsd.edu/~jandreon/publications/handbook of public 2013 ch... ·...
TRANSCRIPT

CHAPTER11Charitable GivingJames Andreoni* and A. Abigail Payne†∗University of California, San Diego, USA†McMaster University, Hamilton, Ontario, Canada
Contents
1. Introduction 22. Background: Facts and Figures on Charitable Giving 53. Approach 1: Individuals 11
3.1. Preferences for Giving 113.2. Analysis of Data on Individual Givers 123.3. Households as Decision Makers 143.4. Experiments on Individual Givers: Price 163.5. Experiments on Individual Givers: Leadership Gifts 193.6. Experiments on Individual Givers: Give more Tomorrow 213.7. The Salience of Incentives to Give 22
4. Approach 2: The Charitable Sector as a Market 224.1. Theories of Charity from the Supply Side 234.2. Econometric Evidence 244.3. Evidence from Field Experiments 274.4. Further Evidence from Experiments 28
5. Approach 3: Giving as a Social Act 315.1. Audience Effects 325.2. The Power of the Ask 335.3. Diversity and the Socio-economics of Giving 34
6. Approach 4: The Giver’s Mind 356.1. Social Costs of Social Pressure 376.2. Avoiding the Ask 386.3. Is Fundraising Bad for Society? 39
7. Fundraising and the Giver’s Mind 407.1. Charity Auctions 407.2. Motivational Crowding 417.3. Peer Pressure 427.4. The Giving Habit 427.5. Giving to Disasters 437.6. Giving Bundled with Consuming 44
8. Conclusion 44References 46
Handbook of Public Economics, Volume 5 © 2013 Elsevier B.V.ISSN 1573-4420, http://dx.doi.org/10.1016/B978-0-444-53759-1.00001-7 All rights reserved. 1
2 James Andreoni and A. Abigail Payne
1. INTRODUCTION
Charitable giving has remained an active and important area within Public Economicssince researchers like Martin Feldstein and coauthors published some of the first policystudies on the topic in the 1970s.1 Today, our knowledge on charitable giving drawsfrom important research in applied econometrics, economic theory, game theory, andexperimental and behavioral economics.
The applied econometrician,looking either at individual tax returns,survey data,or taxreturns of the charities themselves, is interested in how economic variables influence orare correlated with giving. Do givers respond to tax incentives? How does giving changewith income? How do receipts of charities vary with dollars spent on fundraising? Dogovernment grants to charities affect the dollars raised by charities and through whatmechanism?
The economic theorist is confronted with the issue of what form preferences take.Since charities have primary properties that are similar to public goods, a natural modelof charities is as a privately provided public good. However, free riding provides a strongincentive in these models, leading to predictions of very little giving. But most householdsgive something to charity each year, and in many countries average giving is a significantfraction of income—nearly 2% in the US, for instance. This would indicate that motivesother than a pure interest in charitable output itself are involved in the decision to give.Unfortunately, these other motives are difficult to detect in survey or tax return data.
With this quandary as a backdrop, much of the recent theoretical, experimental, andbehavioral research on giving has focused on identifying the underlying motives. Carefulthinking on the theoretical side is necessary to generate hypotheses that can be confrontedwith data. Since naturally occurring data often lacks the specificity to test theories, datamust at times be collected under some experimental control, either in the laboratory orin the field.This branch of the literature on charitable giving is the source of some of thegreatest insights and the greatest promise and, in recent years, greatest growth in research.
Once one has a better handle on the underlying preferences for giving, the theoristcan begin to tackle broader issues regarding policy toward charitable giving. How doesthe charitable sector overcome the free rider problem? What are the strategic responsesin the market for giving among all the players? Does competition among charities sparkefficient innovation or wasteful fundraising?What is the optimal tax policy toward char-itable giving, and how can it take advantage of these naturally occurring preferences andinstitutions to maximize efficiency?
The importance and popularity of research on charitable giving is evidenced by a num-ber of recent review articles. Andreoni (2006b) provides a lengthy summary of researchfrom the prior 25 years of study. List (2011) gives a cogent account of innovations inthe study of charity markets since 2006, and in between numerous other chapters and
1 See Feldstein and Clotfelter (1976), Feldstein and Taylor (1976), and the important book by Clotfelter (1985).

Charitable Giving 3
reviews have also appeared.2 Given the availability of other summaries of findings in theliterature, this Handbook chapter will be more thematic, programmatic, and prescriptivethan what is common for chapters of its type. Certainly we will highlight the main con-tributions since 2006, but we will use these to construct a lattice for how we think futurework in the area would be most informative and productive, highlighting unpublished aswell as published works. We hope to provide the new reader with a perspective on thecurrent state of the literature, and for the experienced reader, we hope to point to newand important questions that remain unanswered.
The next section will give a brief summary of the overall facts about charitable giving,in the US and internationally.This will lay out the main facts to be explained or capturedin the research.We will then discuss four main approaches one could take to research oncharitable giving, highlighting the primary questions and limitations of each approach.Of course, all approaches have value and none in isolation can answer every question.
The first approach is to look at giving as a simple individual economic decision, wherea quantity of gifts to supply is determined by maximizing a utility function subject toa budget constraint. This is a natural place to begin and allows an easy framework forapproaching simple survey data from individuals,and for identifying simple and importantpolicy goals.
The second approach is to think of giving as a strategic interaction, with many actorsinvolved. This market view of giving suggests that donors are choosing gifts, charitiesare choosing fundraising efforts and mechanisms, and if the government is involved it ischoosing grants to charities and subsidies to donors.3 A fourth player may also be at work:charitable foundations. Foundations are a kind of charitable intermediary. They collectcontributions, often qualifying the donor for a tax benefit, and only later spend thesedollars on the“end producer”of the charitable goods and services. All four of these typesof participants can be acting in response to the choices of the others.We will discuss newtheoretical and empirical studies that take account of these interdependencies.
Recently scholars have added a third and potentially very fruitful approach based ongiving as a social exchange. In particular, a charitable contribution is rarely made in theabsence of an overt request to give. The request may come from a friend, a co-worker, adoor-to-door solicitor, a phone call from a fund drive, an on-air campaign from publicbroadcasting, a television commercial with an emotional appeal, or even from a newsreport during a time of a disaster. Moreover, when giving is to some degree visible byothers, it complicates the social interaction with a league of new influences. What, forexample, will someone watching infer about a giver’s character? The important thing
2 See, for example,Vesterlund (2006), Andreoni (2001), Andreoni, Harbaugh, and Vesterlund (2008), Bekkers (2008),Bekkers and Wiepking (2011),Wiepking and Bekkers (2012), or the special issue of the Journal of Public Economics,edited by Andreoni and List (2011).
3 The idea of charities as markets was first introduced in Andreoni and Payne (2003) and later developed in Andreoni(2006b) and List (2011).

4 James Andreoni and A. Abigail Payne
about social interactions is that they are likely to be central to understanding changes ingiving. While once one becomes a giver, simply answering annual appeals may be a wayof “planning” responsible degrees of altruism, if we are to discuss what affects a change ingiving, we will need to address the question, “What makes one become a giver in thefirst place?”The inherent sociality of giving, we conjecture, will be a part of this answer.
This leads naturally to the fourth and newest approach: giving as a response to con-scious, or perhaps even unconscious, empathic, moral, or cultural urges. These are the kindsof urges that psychologists, biologists, and anthropologists tell us distinguish humans frommost other animals. We tend to have heightened senses of empathy, we are governedmore by internal—yet socially agreed upon—notions of justice, and we are concernedwith the moral impressions we leave with neighbors and acquaintances.These are all trueeven though,as a species,we are far removed from the environments that likely implantedthese values in our psyche: competing for survival in small communities of clan and kin.Understanding how these pressures are presented today, we conjecture, will be key to thenext generation of research on altruism, giving, fundraising, and markets for charity.
How does all this research feed into prescriptions for policy? Historically, there havebeen two main policy questions regarding charity:What is the price elasticity of giving,and do government grants crowd out private donations? While these questions remainrelevant today,recent work has broadened the kinds of policy issues economists face. Mostcentral to these are issues related to fundraising and institutional design. For instance,scientific research can be supported through government taxation and grants to scientistsby institutions like the National Science Foundation, or through private foundationsthat mimic the NSF but are funded through tax-deductable donations. One requiresdistortionary taxes to fund, while the other may create deadweight loss through thecosts of fundraising. The incidence of the two is also quite different—those with highdemand pay more under private provision, but their preferences are also more heavilyweighted than low demanders. The more we understand these social and financial costsof fundraising, the more we can say about how best to organize society to provide neededsocial goods.
A related pedagogical issue arises about fundraising. Many studies and experimentshelp us to understand why people give and what triggers a gift. While this helps usunderstand foundational economic questions, such as the psychic costs of saying “no” toa fundraiser, it also often yields information that can help fundraisers increase donations.There are two delicate issues here that economic research has yet to debate. First, onemust resist the inference that anything that increases donations is good for society. Therole of the public economist has always been to find the greatest good for the greatestnumber, and fundraising for charity is just one of many institutional forms for supportingthese goods that are available to society. Second, do we as economists have an obligationor even an interest in uncovering new methods that help charities raise more dollars?Wedon’t study how for-profits could improve revenues, so if the objective of a study is to

Charitable Giving 5
find better fundraising methods for non-profits then it is incumbent upon the scientistto argue that it is in the social interest to do so.
2. BACKGROUND: FACTS AND FIGURES ON CHARITABLE GIVING
Here we summarize the within and between country differences in charitable giving.Thisseemingly straightforward task is, unfortunately, difficult to accomplish, as data sourcesvary in the frequency and methods of their collection, and in the fidelity of the reports.Nonetheless we make our best attempt to characterize the general facts about giving.4
Looking at giving as a percent of GDP in 2005, Charities Aid Foundation (2006)ranked the US highest (1.67%), followed by the UK (0.73%), Canada (0.72%),Australia(0.69%), and South Africa (0.64%).5 At the lower end of the scale were France (0.14%),Germany (0.22%), and Turkey (0.23%). These numbers, however, are based on values ofreported donations by individuals. This is but a partial picture of philanthropy. Philan-thropy also encompasses donating time, helping a stranger, participating in a communityevent, and even helping one’s family members. Creating measures that compare givingacross countries is difficult if countries and/or cultures value these types of giving differ-ently. Depending on the method used to measure giving,which country is more generouswill vary. For example, consider theWorld Giving Index developed by the UK CharitiesAid Foundation (CAF) using world survey data collected by the Gallup organization.Theindex is based on surveys of 150,000 individuals from 153 countries.The following threequestions formed the basis of the index:In the month prior to the survey being complete6:(i) Have you donated money to a charity? (ii) Have you volunteered your time to an orga-nization? (iii) Have you helped a stranger or someone you did not know who needed help?
Based on the responses to these questions, CAF assigned to each country a numberto reflect their level of giving behavior for 2010 and 2011. As with any survey, however,there are many possible avenues for inaccuracies, and indeed there is a great variation inthe index across these 2 years. For example, in 2010 the US ranked fifth in overall giving;in 2011, the US ranked first. The top countries for giving money include Thailand, theUK, Ireland, the Netherlands, Hong Kong, Indonesia, Morocco, Australia, Iceland, andMalta (the US in 2011 was tied for tenth place). Georgia, Russia, Madagascar, and Coted’Ivoire are at the bottom.The top countries for volunteering areTurkmenistan, Liberia,Sri Lanka,Tajikistan, the US (fifth place), Guinea, Nigeria, Philippines, Uzbekistan, andMyanmar. Greece, Serbia, Croatia, and China are at the bottom. And the top countriesfor helping a stranger include Liberia, the US (2nd), Ghana, Sierra Leone, Nigeria, Sene-gal, Sudan, New Zealand, Qatar, and Australia. Madagascar, Rwanda, Burundi, Albania,Indonesia, and Japan are at the bottom.
4 Bekkers (2012) provides additional information on regional differences in philanthropy.5 International comparisons of charitable giving, November 2006, Charities Aid Foundation briefing paper.6 World Giving Index 2011:A global view of giving trends, Charities Aid Foundation, 2011.

6 James Andreoni and A. Abigail Payne
These statistics illustrate that giving and perceptions about giving vary across the world.They also illustrate that there is no single measure that fully captures generosity or giving.
Next we ask, how has giving changed over time? Let us start by looking at data forthe United States. Our numbers are drawn from the annual publication, Giving USA2012. The analysts for this publication draw their data from several sources and thenapply an econometric model to estimate how the general population behaves. This isnecessary because there is no single source for identifying either individual donations tocharity or the recipients of the donations. For example, reported giving on tax returnsonly identifies the giving of those with taxable income who itemize. Charity tax returnsare only required by organizations that meet a minimum threshold for income and arenot religious. Given there is no single source that allows us to measure giving and thecharity recipients of the gifts in the US, the figures in the Giving USA 2012 publicationrepresent the best guesses of trained analysts.
In 2010, total contributions to charity by individuals, corporations, foundations, andthrough bequests were estimated at nearly $296 billion in the US, an increase of approx-imately 2% over the previous year after adjusting for inflation.The increase in 2010 over2009, however, came after a 2-year decline in giving. Over the last four decades (1970–2010) the biggest increase in real growth occurred in the late 1990s and again around2007. These patterns are shown in Figure 1. Giving by individuals as a share of theirdisposable income has varied over the period but for the most part has hovered around2% (minimum of 1.7% in the early 1990s; maximum of 2.4% in the mid-2000s). Whilea high percentage of individuals give to charity today, there is great variance in the levels
$0.0
$50.0
$100.0
$150.0
$200.0
$250.0
$300.0
$350.0
$400.0
1971 1975 1980 1985 1990 1995 2000 2005 2010
Figure 1 Annual giving by private sources, 1970–2010 $ billions (real, base year 2011). (Source: GivingUSA 2012: The annual report on Philanthropy, giving USA.)

Charitable Giving 7
0%
10%
20%
30%
40%
50%
60%
70%
80%
90%
100%
1971 1975 1980 1985 1990 1995 2000 2005 2010
Individual Giving Giving Through Bequests Giving by Foundations Corporate Giving
Figure 2 Share of private giving, by type of donor, 1970–2010. (Source: Giving USA 2012: The annualreport on Philanthropy, giving USA.)
of giving. Many people give a small amount and a few people give a large amount.Thereis also variation in the types of charities to which individuals give. For example, as willbe shown below, the largest recipient of charitable donations are religious organizations.These gifts come largely from lower income individuals. If one studies individuals that gavemore than $1 million,their gifts go mostly to education and health-related organizations.7
In Figure 2,we show the share of private giving by type across four groups: individualgiving,giving through bequests,giving by foundations,and corporate giving.The strikingphenomenon is that the share of giving from private individuals has declined and the shareof giving by foundations has increased over time.While the data currently available makeit difficult to understand this trend, there is a sense that the growth in foundation givingmay be attributable to a growth in giving by higher wealth individuals who choose tofirst direct their giving to a foundation and then to use the foundation as a vehicle forgiving to charities.
The above figures are similar to those observed in other countries, especially Canadaand the UK. Using tax returns filed in Canada by individuals that reside in urban areas,
7 In addition to there being differences in giving based on measures of family income,other observed differences include:donors that believe the most in the afterlife are less sensitive to changes in economic conditions;women are more likelyto donate than men, and, conditioning on income, will give more; higher wealth families are less sensitive than lowerwealth families to economic conditions in their giving; the decline in giving through a bequest is mostly attributableto a decline in giving by those estates valued at less than $2 million. See Giving USA 2011 and 2012 for details onthese findings.

8 James Andreoni and A. Abigail Payne
0
0.5
1
1.5
2
2.5
3
3.5
1991 1992 1993 1994 1995 1996 1997 1998 1999 2000 2001 2002 2003 2004 2005 2006 2007 2008 2009 2010
$ B
illio
ns (B
ase
Year
: 200
0)
Total Donations, Bottom Income Tercile
Total Donations, Middle Income Tercile
Total Donations, Top Income Tercile
Figure 3 Reported tax receipted gifts in Canada by neighborhood income grouping. (Source: Dataat neighborhood level for reported giving on individual tax returns, statistics Canada, as modified bypublic economics data analysis laboratory, McMaster University, 2012.)
we can depict the level of giving across neighborhood types defined by the averagehousehold income for the neighborhood (defining a neighborhood as a postal code areathat covers approximately 5000–8000 households). Figure 3 depicts the total reportedcharitable giving by individuals for neighborhoods broken down into income terciles.Giving by those living in higher income neighborhoods has grown much faster in the1990s and early 2000s than for the other two groups.
Notice that Figures 2 and 3 are pointing to an interesting pattern. Giving is becomingincreasingly concentrated with the wealthy, either through individual giving or fromfoundations. In the US, the number of foundations increased by 54% between 1999and 2009, to over 120,000 (National Center for Charitable Statistics, 2011, NonprofitSector in Brief: Public Charities, Giving, and Volunteering). In Canada, foundations grew by74% between 1992 and 2008, from 5400 to 9400. This raises interesting questions aboutthe influence of foundations on giving by others and in promoting the stability of thecharitable sector.
While tax laws impose some requirements around the distribution of funding, foun-dations are able to harbor their endowments well into the future. They have flexibilityin how they use their funds intertemporally, and in how they target funding to support
Charitable Giving 9
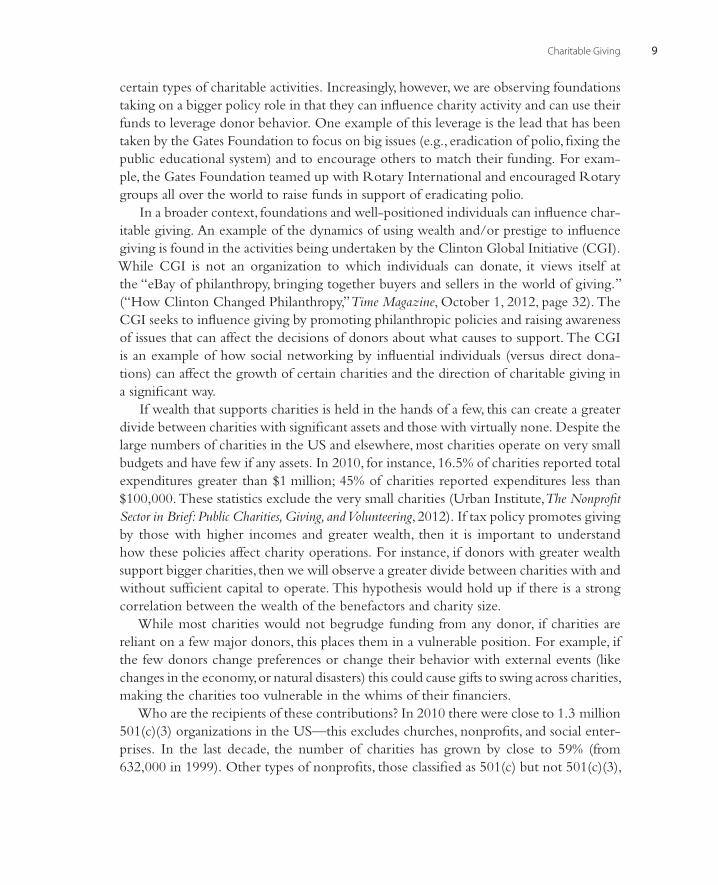
certain types of charitable activities. Increasingly, however, we are observing foundationstaking on a bigger policy role in that they can influence charity activity and can use theirfunds to leverage donor behavior. One example of this leverage is the lead that has beentaken by the Gates Foundation to focus on big issues (e.g., eradication of polio, fixing thepublic educational system) and to encourage others to match their funding. For exam-ple, the Gates Foundation teamed up with Rotary International and encouraged Rotarygroups all over the world to raise funds in support of eradicating polio.
In a broader context, foundations and well-positioned individuals can influence char-itable giving. An example of the dynamics of using wealth and/or prestige to influencegiving is found in the activities being undertaken by the Clinton Global Initiative (CGI).While CGI is not an organization to which individuals can donate, it views itself atthe “eBay of philanthropy, bringing together buyers and sellers in the world of giving.”(“How Clinton Changed Philanthropy,”Time Magazine, October 1, 2012, page 32). TheCGI seeks to influence giving by promoting philanthropic policies and raising awarenessof issues that can affect the decisions of donors about what causes to support. The CGIis an example of how social networking by influential individuals (versus direct dona-tions) can affect the growth of certain charities and the direction of charitable giving ina significant way.
If wealth that supports charities is held in the hands of a few, this can create a greaterdivide between charities with significant assets and those with virtually none. Despite thelarge numbers of charities in the US and elsewhere, most charities operate on very smallbudgets and have few if any assets. In 2010, for instance, 16.5% of charities reported totalexpenditures greater than $1 million; 45% of charities reported expenditures less than$100,000. These statistics exclude the very small charities (Urban Institute,The NonprofitSector in Brief:Public Charities,Giving, andVolunteering, 2012). If tax policy promotes givingby those with higher incomes and greater wealth, then it is important to understandhow these policies affect charity operations. For instance, if donors with greater wealthsupport bigger charities, then we will observe a greater divide between charities with andwithout sufficient capital to operate. This hypothesis would hold up if there is a strongcorrelation between the wealth of the benefactors and charity size.
While most charities would not begrudge funding from any donor, if charities arereliant on a few major donors, this places them in a vulnerable position. For example, ifthe few donors change preferences or change their behavior with external events (likechanges in the economy,or natural disasters) this could cause gifts to swing across charities,making the charities too vulnerable in the whims of their financiers.
Who are the recipients of these contributions? In 2010 there were close to 1.3 million501(c)(3) organizations in the US—this excludes churches, nonprofits, and social enter-prises. In the last decade, the number of charities has grown by close to 59% (from632,000 in 1999). Other types of nonprofits, those classified as 501(c) but not 501(c)(3),

10 James Andreoni and A. Abigail Payne
$0.0
$20.0
$40.0
$60.0
$80.0
$100.0
1971 1975 1980 1985 1990 1995 2000 2005 2010
Religion Education FoundationsHuman Services Health Public Society BenefitArts International Environment
Figure 4 Total private giving by charity classification, $ billions (2011 base year). (Source: Giving USA2012: The annual report on Philanthropy, giving USA.)
experienced very little growth (approximately 3%).8 The types of nonprofits that benefitthe most from private giving are those in the area of religion, which accounts for 35% ofthe total contributions. Educational organizations are the second biggest recipient (14%),followed by foundations (11%), human services (9%), health (8%), and public-society(8%). Contributions to other types of charities (arts, international affairs, environment,and animal-related organizations) accounted for less than 5% of private giving. Figure 4illustrates these differences and the growth in giving by charity type for US charitiesbetween 1970 and 2010.
Figure 4 illustrates that religious giving dominates other forms and, perhaps, shouldbe analyzed separately from other types of giving. For example, do individual donationsto churches respond to tax incentives the same as other forms of giving? The figure alsoillustrates difference in the contributions and growth (or lack thereof ) in contributionsacross sectors, demonstrating that one might want to explore these sectors separatelywhen studying the impacts of tax and other policies. Second is the growth foundationgiving. In 1980 this was the smallest of the categories, but by 2010 it was the third largestcategory, just below gifts to education-based charities.9 We will return to these and otherissues throughout the discussion below.
8 Examples of other 501(c) nonprofits include civic leagues, business leagues, fraternal societies, social clubs, and agri-cultural organizations.
9 One might also add a third observation: the languishing of giving to the arts.

Charitable Giving 11
3. APPROACH 1: INDIVIDUALS
We begin this section by briefly reviewing what we have learned through controlledexperiments and how this helps to better frame a characterization of preferences. Wethen turn to econometric applications of this approach to data on individuals.
3.1. Preferences for GivingConsider an individual i with post-tax income mi who consumes a composite privatenumeraire good xi and gives gi dollars to charity. With n individuals, let G = ∑n
i=1 gi bethe total contributions to the charity. If individuals gain utility from only the final outputof the charity, sometimes called pure altruism (Andreoni 1989), then G is a public good.The natural first model, therefore, is to assume preferences Ui = ui(xi, G). As shown byBergstrom, Blume, andVarian (1986) and Andreoni (1988), such a model leads to manyabsurd conclusions, including that only a sliver of the population should be contributorsto the charity. Hence, any model that is going to capture the empirical findings is likelygoing to require that individuals, through some means, experience greater utility fromtheir own contributions than those of others, that is, Ui = ui(xi, G, gi), where utilityis increasing in the third argument.10 This impure altruism was (somewhat pejoratively)dubbed warm-glow giving by Andreoni (1989, 1990).11
Evidence for a warm-glow has come from many quarters. Laboratory experimentsfind responses to manipulations that most often support a basic “joy of giving” explana-tion. A laboratory experiment by Crumpler and Grossman (2008) showed that 57% ofsubjects made a contribution to charity, even though the contribution had no impact onthe dollars received by the charity, but only on the composition of the dollars given—the subjects’ contributions completely displaced the experimenter’s contribution. Thisstrongly supports a warm-glow.Tonin andVlassopoulos (2010) look for a warm-glow ina real-effort field experiment on pro-social behavior. Using a manipulation similar to thatof Crumpler and Grossman, these authors tell subjects that a charity will get £15 regard-less of the subject’s actions, but that the more effort the subject chooses the more of this£15 will be credited to the subject.They find that this manipulation creates a significantincrease in effort. Many other laboratory tests find similar patterns in which own andothers’ contributions are not perfect substitutes, as the warm-glow hypothesis requires.12
Konow (2010) develops a model of warm-glow that is founded on affective (emotional)states. He shows in theory and experiments that not all giving is the same—those gifts
10 Also see Ribar andWilhelm (2002) for a limit result arguing that for large n, only the warm-glow component of utilityis going to have any significant influence on the margin of any person’s decision.
11 See also Cornes and Sandler (1984) and Steinberg (1987). The pejorative nature of the term is deliberate, and meantto remind the reader that the notion of a warm-glow is something of a black box. That is, there are many notions—sympathy, guilt, norm adherence, social approval—that could fall under the umbrella of impure altruism, the essentialfeature is that, once the model is reduced to its barest form, own and others’ contributions.
12 See Andreoni (1993), Bolton and Katok (1998), Konow (2010), Eckel, Grossman, and Johnson (2005), Palfrey andPrisbey (1997), Goeree, Holt, and Laury (2002), and Andreoni and Miller (2002).

12 James Andreoni and A. Abigail Payne
connected with a greater sense of need or deservingness also create more warm feelings.In a theme we will return to when discussing the fourth approach, giving and the utilityof the warm-glow depends critically on the context, the need, and the impact of one’sdonation.That is, the utility of the warm-glow is not separate from the altruistic concernone has for the recipient.
Perhaps the most convincing and provocative evidence for warm-glow comes fromthe neuroeconomics experiments done by Harbaugh, Mayr, and Burghart, published inScience in 2007. Subjects were told that some of their payment fee of $100 would bedonated to charity involuntarily in some cases, as in the case for taxation, or only ifthey approved in other cases. Even though the outcome for the charity was the samein both scenarios, the subjects’ brains reflected significantly greater pleasure when thechoice was made voluntarily.The effect was shown within subjects. A surprising finding,however, is that subjects preferred larger donations to smaller ones, even when they weremade involuntarily.That is, people enjoy giving through taxation or voluntarily, but theyenjoy the latter the most. This is precisely the foundational assumption of the model ofwarm-glow giving.
3.2. Analysis of Data on Individual GiversOne way of encouraging giving is to lower its price. Many countries provide some formof an income tax credit or deduction for giving. In the United States,for example,tax filerswho itemize deductions may claim charitable donations as a deduction against taxableincome. With a marginal tax rate of t, this creates a price of 1−t, that is, a gift g onlycosts the giver (1−t)g out-of-pocket. This has led to a surfeit of research measuring thecompensated elasticity of giving, effectively asking the question, if there is a 1% change inprice, 1−t, how responsive is giving, g. Bakija and Heim (2011) summarize this researchand provide the most recent estimates of the price elasticity using a panel data set ofindividual tax returns spanning the period 1979–2006. Much of the research they reportsuggests the elasticity of giving, ε, is close to −1. A few find an inelastic response, |ε| <1,and Bakija and Heim suggest giving may most likely be elastic, |ε| >1.
There is more to understanding how tax policies affect giving than simply tryingto measure a price elasticity for giving. Across countries, there are a variety of schemesin place to provide individuals incentives to donate. In some countries (e.g., Denmark,Finland, Germany, Italy, Switzerland) some or all individuals are obligated to donate asthe laws require a fixed percentage of individual taxes be allocated to churches or othercharities.13 With respect to voluntary donations, some countries provide direct incentivesto all taxpayers (e.g., the US,Canada, the UK,Germany,Australia, India, Indonesia),othersonly to those with high incomes or high levels of donations, some strictly limit how much
13 The US International Grantmaking website, http://www.usig.org/index.asp,provides details on differential treatmentsof donations across countries.
Charitable Giving 13
one can offset tax liability with her donation (e.g., Argentina [limited to 5% of taxablebase], China [up to 30% of taxable income], Czech Republic [limit of 10% of income ifat least 2% is donated], France [limit of 20% of taxable income], Russia [limit of 25% oftaxable income], South Africa [limit of 10% of taxable income]), and others provide noincentives (e.g.,Afghanistan, Brazil, Croatia, Israel [incentives given only for donations topublic institutions]).
In recent decades, many of the changes in tax policies related to charitable givingprovide greater incentives for wealthier individuals to donate. For example, in Australiadonations of more than $5000 (AUD) receive a more advantageous tax treatment thandonations of lesser amounts. In Germany,while donations are limited to 20% of income,an individual can deduct up to $1 million Euros if the donation is for the endowment ofa foundation. In the US and Canada, donations of publicly traded securities and otherproperty such as ecologically sensitive land have a lower effective price of giving than acash donation of the same value. The reason for this is that the donor is allowed to takea charitable deduction against taxable earned income for the fair market value and notincur any capital gains on the difference between the fair market value and the basis ofthe securities or property.These changes may help to explain the growth in donations tofoundations and faster growth in giving by individuals in higher income tax brackets. InCanada, for instance, a high proportion of foundations report receiving gifts of publiclytraded securities. An extremely low proportion of registered charities, by contrast, reportgifts of publicly traded securities.Very little work, however, has been done to explore theimpacts of these policies on the price elasticity of giving, on the substitution betweendonations of cash and publicly traded securities, or the growing divergences in givingbetween higher and lower income individuals.
What if tax policy did not benefit the taxpayer but benefited the charity? For mosttaxpayers this is exactly what happens in the United Kingdom.Taxpayers receive neither atax credit nor a deduction,unless they are high earners. Instead a system called“Gift Aid”is used.When an individual donates to a charity and identifies herself as a UK taxpayer, thecharity can receive from the UK government the equivalent of the credit that the taxpayerwould receive. For every pound donated, a charity can claim from the UK government amatch that is based on the lowest tax rate for individuals (20%). Effectively this means thatthe charity can receive £1.25 for every £1 donated (tax price is £0.80). The exceptionto this system is for high income taxpayers. If they complete a form, they can receivea tax credit for their donations. Effectively this means that for every pound donated bya high rate taxpayer the price is £0.60. Scharf and Smith (2010) explore whether highrate taxpayers giving differs across the scheme whereby the charity receives an amountequivalent to the credit and the scheme whereby the taxpayer receives the credit. Ifindividuals understand the relationship, the government disbursement of revenues (in thesystem where charities receive the credit) is equivalent to receiving a tax credit on areported donation to the government, then both systems should yield the same results.

14 James Andreoni and A. Abigail Payne
In the context of a survey of known high rate taxpayers that are donors, they randomlyassigned questions about an increase in tax incentives (in the form of gift aid or in theform of a direct tax credit) to the donors. They find, despite the equivalence financially,that donors are likely to respond more positively to an increase in the gift aid amountthan to an increase in the direct tax credit.
3.3. Households as Decision MakersThe analysis to this point has made the simplifying assumption that charitable decisionsare made by individuals. In many cases, however, giving will be made by households. Ifmen and women have different tastes about giving—or about the opportunity costs ofgiving—this presents a more complex and interesting question about how householdsresolve this conflict.
One could imagine a number of scenarios about how couples treat giving differentlythan individuals. For instance, if the couple shares the same tastes, then charitable givingcould be seen as an enjoyable joint activity that couples do together. This could makecouples give more to charity than individuals, and do so together. However, supposethat the couple disagrees either about the size or type of gifts. For example, one wantsto support the homeless while the other prefers the opera. This might result in thecouples bargaining with each other but making donation decisions jointly that effectivelymonitors or reins in each other’s spending.Another alternative is that one spouse may havestronger feelings about charity, better information, stronger social reasons (like giving atwork), or lower transactions costs (like payroll deductions) that lead spouses to a delegategiving to one spouse. Finally, imagine a household where spouses keep separate finances.These spouses are likely to make independent decisions on giving.14
Two papers have explored these questions and come to many similar, but severalimportantly different conclusions. Andreoni, Brown, and Richall (2003) use a questionon the 1992 and 1994 Survey of Giving and Volunteering (SGV) in the United Statesthat asked, “Who in your household is considered most involved in deciding whichcharities your household will give to?”The answers could be the respondent, spouse, orboth. Yörük (2010) replicates this study, instead using the 2002 wave of the Center onPhilanthropy Panel Study (COPPS), the Philanthropy Module of the PSID. This surveyasks, “Who in your family was involved in decisions about how much support to giveindividual charities in 2002?”The answer could be the husband, wife, decide together,or decide separately. Thus the category, “both” from the SGV is more finely separatedinto“decide together” and“decide separately.” The two surveys differ in other important
14 Besides having differing tastes about charity, spouses have another reason to bargain. As noted in a recent paperby Jackson andYariv (unpublished), if spouses have differing discount rates, then the tastes of the spouse who is mostimpatient will be dominant in the decisions made about the present.The more impatient spouse will trade consumptionin the future for preferred consumption today, and the more patient spouse will agree. The studies we discuss hereare purely cross-sectional so they cannot address relative discounting, but this part of the bargaining process could beinteresting if data on discount rates could be combined with data on choices of giving.

Charitable Giving 15
ways.While respondents have similar mean ages, the COPPS survey was taken 8–10 yearslater than the SGV survey, thus shifting the mix of marital cohorts.This shows up in otherareas.The COPPS respondents have more education; there are about 7.7% points greaterlikelihood of being a college graduate among men, and about 6% points among women.Perhaps the biggest difference is that in the SGV data the likelihood that the husband isthe primary earner is about 90%, while in the COPPS data the partnerships show moreparity,with only about 60% of households having male as primary earners. If householdsare bargaining, therefore, one would expect more equal bargaining power in the COPPSthan the SGV. This is exactly what is observed.
Adjusting for observables, both studies show little to no differences in amounts givenby single males and females, but both show significant differences in the number ofcauses supported. Women appear to prefer giving less to more causes, while men preferto specialize in one or two causes. Male deciders were also more sensitive to price in bothdata sets, especially when the price was low.15 In the SGV data,when both spouses decide(which could include both deciding together and independently), the analysis shows thathouseholds give about 6% less than had they each decided unilaterally and, moreover,the husband was estimated to have the dominant bargaining power, with his preferencesgetting more than twice the weight given to hers.16 COPPS data, by contrast, showedthat couples deciding jointly (but not independently) actually gave 7% more than onewould predict if they acted unilaterally. Moreover, bargaining power was nearly identicalbetween spouses, with the wives estimated to actually have a bit more leverage than theirhusbands.
The degree of similarity between the two studies of Andreoni, Brown, and Rischall(2003) and Yörük (2010) tends to make the differences between the two all the morefascinating.17 Could it be that the differences in household bargaining could be dueto cohort effects as more progressive values are represented in the newer data, and thatthese households are more likely to have female earners with good salaries and thusgreater bargaining power? If so, does this parity among spouses actually create a moreharmonious attitude toward giving, making it an enjoyable shared activity rather than acontentious case of spousal monitoring?These and other questions remain fascinating andimportant areas for understanding not simply charitable giving, but also for uncoveringhow households make decisions in general.
15 This mimics lab data from dictator games in which male subjects showed greater price elasticity. See Andreoni andVesterlund (2001).
16 More detailed analysis revealed that the strong presence of religious giving, which men prefer to specialize in, waslargely responsible for the strong male bargaining power. Separating religious from other giving,males and females hadmuch more equal bargaining power, although still showed more “conflict” than inYörük’s (2010) analysis.
17 Contributing to the intrigue,Wiepking & Bekkers (2010) examine data on couples in the Netherlands and find thatthe household choices depend heavily on the “marital capital” and commitment, for which the Dutch collect morespecific data (they code for cohabitants, committed couples who live apart, and married couples who live together).For instance, males were more likely to decide in heavily religious households, and relative education, not relativeincome was the more powerful determinant of bargaining power.

16 James Andreoni and A. Abigail Payne
3.4. Experiments on Individual Givers: PriceAn individual with consumption c, giving g, income y, and a marginal tax rate t, faces abudget constraint of c + g = y − t(y − g), or
c + (1 − t)g = (1 − t)y [tax subsidy] (1)
Letting p1 = 1− t then we see that the tax deduction lowers the price of giving, resultingin an out-of-pocket donation of d = (1 − t)g. A difficulty with estimating the effects ofp1 and y on g is that t and y are determined jointly. One way to break the link betweenprice and income is to look for an unanticipated change in the relationship, such as froma tax reform.Another way to get identification is through laboratory or field experimentsthat independently vary p or y.
A popular avenue for manipulating price both in actual fundraising and in experimentsis from matching contributions. Suppose a rich philanthropist offers to match every dollardonated,d,with m dollars of his own.An out-of-pocket donation of d results in the charityreceiving a gift of g = d(1 + m). Then when the charity receives g dollars, it only coststhe giver 1/(1 + m), that is p2 = 1/(1 + m). For instance, under a 2-for-1 match it coststhe donor $1 to give $3, so p = 0.33. This results in a budget
c + [1/(1 + m)] g = (1 − t)y [matching gift] (2)
Notice that Eqs. (1) and (2) are quite similar. If m = t/(1 − t) then the two are the same.A significant side issue is that, in practice,matching contributions typically have a limit.
For instance, a philanthropist may pledge to match the first $100,000 donated. Then ifdonations exceed $100,000, the philanthropist’s “match” becomes equivalent to a directcontribution to the charity—no individual is being subsidized on the margin. If the limitis likely to be exceeded or, equivalently, the philanthropist cannot credibly commit to notgiving the full limit pledged even if the match limit is not reached, then it is rational forgivers to treat the match as simply a single unconditional grant. If this is the case, then the“matching grant”could in theory be expected to reduce individual donations d through anincome effect. Since most matches do have limits that are exceeded,18 there is a question ofwhether donors suffer from a“matching illusion,” that is,whether they perceive that theircontributions will actually result in more donations from the rich philanthropist, resultingin a substitution effect (encouraging giving) and an income effect (discouraging giving),or whether there is no matching illusion and a match results in only the income effect on d.
A second manipulation on price may be to offer a rebate. Suppose an individual givesg to the charity, and then shortly thereafter receives a rebate of r per dollar donated.The rebate could come from the government, a philanthropist, or the experimenter.Thisrebate now means that to give an additional dollar to the charity costs only p3 = 1 − r to
18 If the matching grant is not fully utilized on one fund drive, it is often the case that the remainder will be recycledand used as a match for later fundraising campaigns. That is, in practice most “matching grants” are equivalent tounconditional cash gifts.

Charitable Giving 17
the donor,that is a gift g to the charity costs d = (1−r)g out-of-pocket.Thus the budget is
c + (1 − r)g = (1 − t)y [rebate] (3)
Equations (1) and (3) are identical as long as r = t. In fact, this point makes it clear thatthe tax deduction is in fact a rebate—only when one’s taxes are finally reconciled is thebenefit of the deduction realized in a higher tax refund or lower tax bill. Looking at (1)–(3), modulo the “matching illusion” problem, if r = t = m/(1 + m) then the predictionfrom simple economic theory would be that the outcomes are the same.
Experimental research on rebates and matches began with a provocative of experimentby Eckel and Grossman (2003). Endowing laboratory subjects with cash, they allowedsubjects to give some of the money to a favored charity at set rebate rates r of 0, 0.2, 0.25,and 0.5. Another group of subjects faced the equivalent tasks but framed as a match,withm of 0,0.25,0.33,and 1.They found matching significantly dominated subsidies,with thecharity receiving 27–88% more with matching. They also found an interesting patternthat we will return to later. Under the matching scheme, the out-of-pocket cost to thesubject, that is d = p2 g = g/(1 + m), is a nearly identical fraction of the endowment onaverage for every value of p2,ranging only between 47 and 52%. In other words,when onelooks at the out-of-pocket donation d = g/(1+m), subjects allocated about the same d asfraction of their endowment to the charity,regardless of m.This could lead one to infer thatthe match does not matter. However, when looked at as the gift received, g = (1 + m)d,it would lead one to infer that matches are hugely influential. In fact, if utility depends onthe gift g, then the match has an income effect that should suppress d: a 1-to-1 match canreach the same g at half the d.But it also creates a substitution effect that should increase d.Thus,only if g is elastic with respect to p,ε ≤ −1,will d not fall in response to an increasedmatch. Eckel and Grossman confirm this by estimating an elasticity of g with respect top of about −1.1. If instead they had looked at the effects of m on d, the inference wouldhave been that, after accounting for the endowment, m and d are virtually unrelated.19
A series of field experiments on matching grants finds results that in many waysparallel the laboratory studies. Karlan and List (2007) team with an actual nonprofit tosend fundraising letters to over 50,000 potential donors, one third of whom acted as acontrol group.The letters to those treated varied in ways that are intended to capture theissues raised above. Letters included either no match, a 1-to-1, 2-to-1, or 3-to-1 match,that is, p = 1, 0.5, 0.33, or 0.25, respectively.They also addressed the “matching illusion”by claiming in the letter that matches would go up to $25,000, $50,000, or $100,000,thus increasing the likelihood that a giver would feel their contribution would truly besubsidized (assuming they see any unmatched portion of the limit as credibly not given).
The mailing received a response rate of 2%, which is not atypical for charitable solici-tations of this type. Of the 50,083 mailings, they received 300 control responses, and 735
19 Begin with the measurement ln (g) = −1.1 ln (p). Substitute to find ln (d(1 + m)) = −1.1 ln (1/(1 + m)). Rearrangeto see ln (d) = 0.1 ln (1 + m), which indicates an elasticity of d with respect to m of virtually zero.

18 James Andreoni and A. Abigail Payne
treatment responses (roughly 245 per match level). While individual characteristics ofthe donors were not observable, the authors could control for census-level characteristicsbased on the zip codes of potential donors. Note also, there is no way to know that theenvelopes were opened and, thus, who was treated. The authors would ideally wish tocontrol who was treated and examine the effect of the treatment on the treated. Sincethis is impossible, the authors’ analysis uses either all 50,000 mailings as observations, orsimply the 1035 who responded.20
The presence of any match had a significant impact on the likelihood of giving (0.018for the control and 0.022 for the treatment), increasing the propensity by 22% (that is,0.022/0.18–1). It also increased the donation d per solicitation by 19%, from $0.81 to$0.97. However, as the match increased from 1 to 2 to 3-to-1, out-of-pocket donations dper mailing remained flat at $0.94,$1.03,and $0.94, respectively,which is not a significantdifference. However, if one looks at the total gift including the match, g = (1+m)d, onewould conclude the match greatly increases generosity, going from $1.87 in the 1-to-1match up to $3.75 per mailing in the 3:1 match.21
Interestingly, Karlan and List found no effect of the ceiling on the dollars to bematched. This would indicate that either donors did not suffer from a matching illusion,other than to perhaps change the timing of donations to fall under the period of thematch, or that they all suffered similarly from marginal-illusion and the elasticity of gis roughly ε ≈ −1, which implies a constant d. Harkening back to the parallels withthe laboratory study of Eckel and Grossman, who also found d independent of m, thereis something yet to be understood about how individuals see a match as affecting theprice.22 We return to this in the next section when we discuss leadership giving.
3.5. Experiments on Individual Givers: Leadership GiftsA rule of thumb that fundraisers use when launching a fundraising campaign is that aboutone third of the announced goal should be committed prior to the announcement ofthe public campaign. That is, pledges made from a small group of donors to provide
20 If the propensity to open envelopes is independent of the vulnerability to matching, then this will lead to unbiasedestimates of the effect of matching, conditional on self-selecting into being treated. If opening the envelopes is itself auncorrelated with a willingness to give, once treated, then the estimates will be unbiased measures of the effect of thetreatment on the treated. Later sections on self-selection into treatment suggest that this assumption may not be met.Theauthors are interested in the more practical issue of the effect of mailings on giving, and thus welcome the influences ofself-selection into treatment.The point of this footnote is to alert the reader to be cautious in generalizing these results.
21 The experiment used a left-wing political organization and ran the experiment shortly after the election of GeorgeW.Bush as President in 2004. Further analysis on voter trends found the effects of the match were only significant in coun-ties that one would expect to have felt most bitter about the tightly contested election, such as those living in a Repub-lican leaning county or state.This feature diminishes the generalizability of the results to other charitable organizations.
22 In an effort to shed more light on this issue,Karlan,List, and Shafir (2011) conducted a field experiment on 20,000 priordonors to a particular charity, looking at 1-to-1 and 3-to-1 matches. The sample includes both recent and “lapsed”donors who may not have given for over a decade.This experiment found a small positive effect of the match m on d,but only for those donors who are active givers.
Charitable Giving 19
seed money—called “leadership gifts” by fundraisers—are seen as an essential part offundraising.23
Andreoni (1998) presented a theory of seed money based on the charity having fixedcosts (or equivalently, a range of increasing returns) associated with its operations. Theconsequence of the fixed costs is that even if there is an equilibrium that would allowthe charity to reach its goal, there will also be an equilibrium in which no donations arereceived as long as the fixed costs exceed what any donor is willing to pay alone. Theway the charity can eliminate the undesirable equilibrium is to get enough pledges to(almost) fully cover the fixed costs.24 Vesterlund (2003) and Andreoni (2006a) providealternative explanations of seed money as conveying information. In both models thereis a first mover (or movers) who are given or endogenously acquire superior informationabout the quality of the charity. Only by making large gifts can these informed playerscredibly convey that the charity is worth supporting at a high level.25
Bracha, Menietti, andVesterlund (2011) provide a direct test of the fixed-costs modelin a laboratory setting.The experiment has an elegant 2×2 design. Groups play a publicgoods game where giving is either simultaneous (no lead giver) or sequential (a designatedlead giver), interacted with the presence or absence of a fixed cost. In the presence offixed costs that are binding on subjects (that is, they exceed the equilibrium with no fixedcosts) the combination of high fixed costs and sequential play significantly increases thelevel of donations and the likelihood that the threshold is met. The experiment neatlysupports the model’s predictions.
List and Lucking-Reiley (2002) provide a direct test of the effect of seed moneyin a field study. They contact donors to give to small public goods ($2000 computerwork stations) with varying degrees of seed money provided. As in the laboratory, thosesolicitations that included the highest seed money gained the greatest likelihood of givingand the largest donations.
A recent field study by Huck and Rasul (2011) combines the reasoning about lead-ership givers with that of matching grants described above. They note that the veryexistence of a matching contribution is itself meaningful in the same way that a leader-ship gift can provide credibility that a fundraising goal will be met. Huck and Rasul testthese ideas in a field experiment to raise money for disadvantaged families in Germany.The fund drive was sponsored by the Bavarian State Opera House, whose patrons servedas the subjects in the field experiment.
23 See Greenfield,The Nonprofit Handbook: Fundraising (2001) as well as the discussion in Andreoni (1998) on the supportfor this observation.
24 The technical condition is that leadership gifts must be large enough that best replies by other givers will cover thefixed costs, thus eliminating the inferior equilibrium.
25 The problem for the lead givers is that they are better off if they can convince others that the quality of the charity ishigher than it truly is. The reason is that this will counteract the free riding problem, get more donations, and makethe lead giver better off. Thus the lead gift must be large enough that the leader would only make such a large gift ifthe charity truly had high quality.
20 James Andreoni and A. Abigail Payne
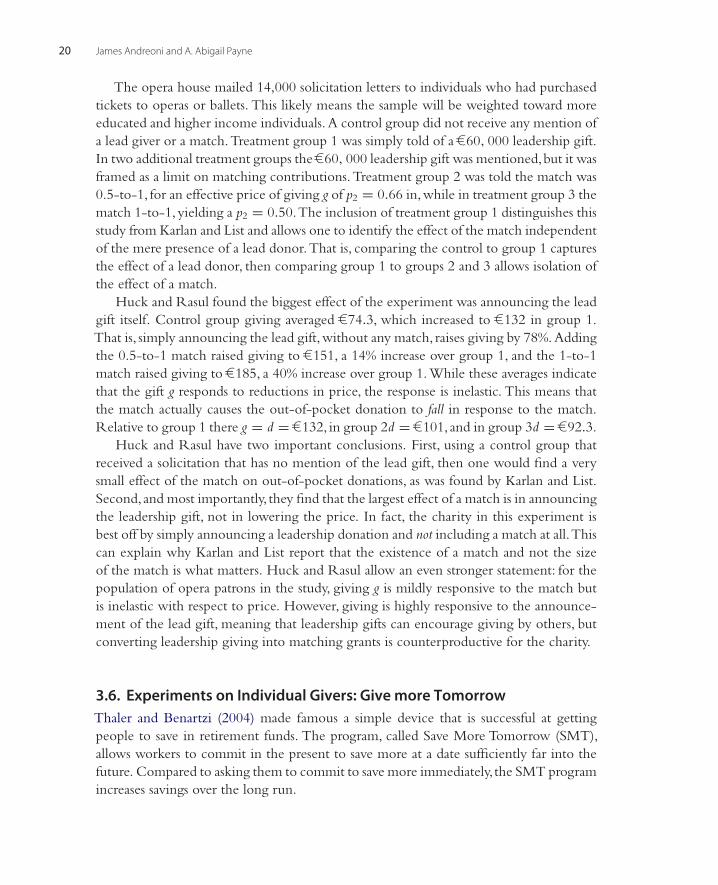
The opera house mailed 14,000 solicitation letters to individuals who had purchasedtickets to operas or ballets. This likely means the sample will be weighted toward moreeducated and higher income individuals. A control group did not receive any mention ofa lead giver or a match.Treatment group 1 was simply told of a C=60, 000 leadership gift.In two additional treatment groups the C=60, 000 leadership gift was mentioned,but it wasframed as a limit on matching contributions. Treatment group 2 was told the match was0.5-to-1, for an effective price of giving g of p2 = 0.66 in,while in treatment group 3 thematch 1-to-1, yielding a p2 = 0.50.The inclusion of treatment group 1 distinguishes thisstudy from Karlan and List and allows one to identify the effect of the match independentof the mere presence of a lead donor.That is, comparing the control to group 1 capturesthe effect of a lead donor, then comparing group 1 to groups 2 and 3 allows isolation ofthe effect of a match.
Huck and Rasul found the biggest effect of the experiment was announcing the leadgift itself. Control group giving averaged C=74.3, which increased to C=132 in group 1.That is, simply announcing the lead gift,without any match, raises giving by 78%. Addingthe 0.5-to-1 match raised giving to C=151, a 14% increase over group 1, and the 1-to-1match raised giving to C=185, a 40% increase over group 1. While these averages indicatethat the gift g responds to reductions in price, the response is inelastic. This means thatthe match actually causes the out-of-pocket donation to fall in response to the match.Relative to group 1 there g = d = C=132, in group 2d = C=101, and in group 3d = C=92.3.
Huck and Rasul have two important conclusions. First, using a control group thatreceived a solicitation that has no mention of the lead gift, then one would find a verysmall effect of the match on out-of-pocket donations, as was found by Karlan and List.Second,and most importantly, they find that the largest effect of a match is in announcingthe leadership gift, not in lowering the price. In fact, the charity in this experiment isbest off by simply announcing a leadership donation and not including a match at all.Thiscan explain why Karlan and List report that the existence of a match and not the sizeof the match is what matters. Huck and Rasul allow an even stronger statement: for thepopulation of opera patrons in the study, giving g is mildly responsive to the match butis inelastic with respect to price. However, giving is highly responsive to the announce-ment of the lead gift, meaning that leadership gifts can encourage giving by others, butconverting leadership giving into matching grants is counterproductive for the charity.
3.6. Experiments on Individual Givers: Give more TomorrowThaler and Benartzi (2004) made famous a simple device that is successful at gettingpeople to save in retirement funds. The program, called Save More Tomorrow (SMT),allows workers to commit in the present to save more at a date sufficiently far into thefuture. Compared to asking them to commit to save more immediately, the SMT programincreases savings over the long run.

Charitable Giving 21
Breman (2011) uses the same logic to motivate an intervention she calls Give MoreTomorrow (GMT). She works with a charity in Sweden that allows donors to sign upfor automated monthly donations that are made electronically. In the control group, thecharity calls donors with a request to increase their monthly donation starting at thenext billing date, as is typical for charity operations. In two treatment groups, an identicalscript is used by the solicitor, except that they offer to begin the increased donation in1 month or 2 months past the next billing date. She finds that a delay of 2 months,but not1 month, had a significant positive effect on the increase in donations. Moreover, a yearafter the intervention, individuals who were treated with GMT continued to have higherdonations and, compared to asking people to give more today, GMT increases the totalreceipts of the charity.This effect could be due to present-bias or planning constraints, orsimply because it is harder to say “no” to requests for obligations far off into the future.26
3.7. The Salience of Incentives to GiveAll of this analysis of the effect of tax incentives, matching grants, on individuals is, ofcourse, built on the assumption that individuals understand the financial consequences oftheir donations on both themselves and the charities.A recent paper on the salience of “taxexpenditures” by Goldin and Listokin (2012) uses a survey of US taxpayers to show that,while 72% of all tax filers correctly identify their eligibility to benefit from a charitablededuction, people systematically underestimate the value of the deduction. For instance,only 18% of those with a marginal tax rate of 0.28 correctly identified the subsidy ongiving as“20–40%,”and 78% stated that the subsidy was below“20%.”As other findings ofa lack of awareness of sales taxes and EITC benefits have led to a discussion of the impactand incidence of these policies (Chetty and Saez, 2013; Chetty, Looney, and Kroft, 2009),the lack of salience about the charitable deduction could generate similar conversationsamong academics and policy makers. Moreover, some of the differences discussed abovecould be explained through salience. For instance,do matching grants during fundraisingcampaigns make the consequences and costs of a gift more salient, and that is why theycan be more effective? Are men more aware of marginal tax rates, and could this explainwhy households in which men decide on giving are more price sensitive?These and othereffects of salience are, it would appear, promising and important areas of future research.
4. APPROACH 2: THE CHARITABLE SECTOR AS AMARKET
The machine of charitable giving has many moving parts. Charities receive grants fromthe government, gifts from foundations, donations from individuals, and raise moneythrough ordinary appeals like mailings, phone banks, and advertising, but also throughfundraising events, like galas,walkathons,charity auctions, sponsorships, and in some cases
26 This technique is well known, and is often applied by editors of Handbooks to encourage authors to agree to preparechapters with distant due dates.

22 James Andreoni and A. Abigail Payne
by charging fees for services.The use, intensity, and effectiveness of each channel is likelyaffected by the use, intensity,and effectiveness of the other channels.This interdependenceis clearly important and, obviously, presents a tremendous challenge for researchers.Withcharities as demanders of funds,donors as suppliers, and the government providing policyinterventions that are dependent on choices made by donors and charities, identifyingthe “equilibrium” in this market becomes a delicate and difficult issue.This section looksat new theoretical and econometric studies that try to understand charitable giving fromthis more holistic approach.
4.1. Theories of Charity from the Supply SideEarly thinkers in the area of nonprofits, such as Weisbroad (1991) and Rose-Ackerman(1996),deserve credit for identifying and advocating a broad approach to charitable giving,and since then the research that takes both demand and supply aspects into accounthas grown tremendously. Most recently, an elegant theoretical model by Correa andYildirim (2013) combines and generalizes models by Rose-Ackerman (1982),Andreoni(1998),Andreoni and McGuire (1993), and Andreoni and Payne (2003) to describe theequilibrium among donors and fundraisers, and to explore the impacts of governmentpolicies. In the model, fundraising is costly, individuals give only if they are solicitedby the charity, each potential “target” donor has a different propensity to give based onheterogeneity across givers.27 Correa andYildirim provide a solution in which the charitydetermines the set of potential donors for whom the “profits” are the highest, that is, forwhom the marginal donation most greatly exceeds the margin cost of solicitation. Sincethe charity chooses the set of donors, and commits to a total fundraising cost C, it forcesthe donors into a subgame with fixed costs. In this subgame the set of donors who aresolicited must contribute at least C or the charity will provide no net services.This non-convexity effectively creates a threshold, which in turn creates an equilibrium at givingzero (Andreoni, 1998). Correa andYildirim show that if there also exists an equilibriumamong some set of donors where this equilibrium at zero can be overcome, then a clevercharity can select the set of donors that guarantee it will be overcome and the charitywill have a successful fundraising campaign.
The Correa-Yildirim model also has interesting and important policy predictions.Foremost among these is the prediction about crowding out of private donations bygovernment grants to charities.The classic model of charity coming from purely altruisticmotives indicates that individuals should be indifferent to giving directly or throughtheir taxes, thus grants should crowd out donations dollar-for-dollar. Since crowding outis often measured as incomplete, one reason could be that preferences are not purely
27 The model attributes heterogeneity to income alone, for ease of analysis. However, it is also possible to interpretheterogeneity to preferences as well as incomes. The main aspect is to identify the best reply function of each donor,and to apply the Andreoni and McGuire (1993) algorithm for identifying donors for a given level of fundraising effort.Any heterogeneity can be subsumed into this solution, regardless of its source.

Charitable Giving 23
altruistic but include a warm-glow, as discussed in the prior section. This is a supply sideexplanation. The Correa-Yildirim model, maintaining altruistic preferences, provides ademand side explanation instead (while the proofs are provided under an assumption ofpure altruism, the results are made only stronger by including a warm-glow). Becauseof the strategically active charity, and the endogeneity of the set of donors throughfundraising, the model prediction is that grants will only be partially crowded out, andthat some of this crowding out will be attributable to reductions in fundraising efforts bythe charity in addition to classic direct crowding out of donors. As we see below, this isfully in line with the results from recent econometric analyses of charitable organizations.
4.2. Econometric EvidenceThe most natural policy question applying the market approach to charities is crowdingout. Testing theories of crowding out, however, has been a challenge. For instance, howdoes one pair private giving to public funding for the same type of good, and should theanalysis constrain coefficients that measure crowding out to be the same across differenttypes of charitable goods? What about donors who may give to multiple goods—cangovernment grants to one charity affect giving to another? And could the governmentactually crowd in giving by providing a signal of quality, and should this vary dependingon how easily quality can be publicly verified?
What is the best methodology for pairing private and public funding?28 Kingma (1989)was the first to match private giving and public funding directly by focusing on giving tolocal public radio stations.29 Schiff andWeisbrod (1991) gathered measures of private giv-ing from non-profit tax returns but then matched these measures to aggregated measuresof government funding. Hungerman (2005) and Gruber and Hungerman (2007) matchchurch spending on charitable goods with aggregate measures of government spending.Khanna, Posnett, and Sandler (1995) and Payne (1998) were among the first to matchboth private and public giving to specific charities and for a large sample of charities.Another approach, taken by Andreoni and Payne (2011a), is to look at crowding out bydifferent categories of donations, that is, tax receipted versus non-tax receipted giving byindividuals, and transfers from foundations and from other charities.
An underlying econometric issue when seeking to measure the relationship betweenprivate and public funding is how best to control for dynamic changes in giving. Primaryestimation issues revolve around concerns of heterogeneity in the charities due to size,scope, mission, and location. One means to help control for this heterogeneity is in theuse of panel data (e.g., Khanna, Posnett and Sandler, 1995; Payne 1998, 2001; Gruber
28 The first studies relied on individual tax return data and/or survey data for measures of individual giving. However, it isdifficult to identify the types of charitable goods to which the individuals are giving and the locations of the charitiesthat are receiving these donations,making this accurate pairing impossible. See, e.g.,Abrams and Schmitz (1978, 1984),and Schiff (1985).
29 Although, see Manzoor and Straub (2005) for a challenge to Kingma’s results.

24 James Andreoni and A. Abigail Payne
and Hungerman, 2007; Hungerman, 2005; Okten and Weisbrod, 2000; Ribar and Wil-helm, 2002;Andreoni and Payne 2003, 2011a, 2011b). With panel data, one can includeorganizational fixed effects to help control for time-invariant differences across charities.
A second key concern in estimation is the potential omitted variable bias due to time-varying events that could drive both the government and private donors to simultaneouslychange giving. For example, a natural disaster (Haiti earthquake, Hurricanes Katrina andSandy) is likely to increase both private and public funding. Failing to control for thesepositive correlations in demands will lead to a biased understatement of the degree ofcrowding out, and could erroneously even suggest crowding in.
There is likely a similar downward bias associated with the endogeneity in publicfunding, the third main concern. As pointed out by Payne (1998), donors are also voters.If voters’ preferences are reflected in both public policy and in private donations, itwill create a biased impression that crowding out is low. Hence, even with panel dataestimation, one must be concerned about the exogeneity of government funding in aspecification that has private giving as a dependent variable.
Estimations of crowding out, thus, should control for the heterogeneity among chari-ties and take into account potential omitted variable and endogeneity biases.This suggeststhat unless one has conducted a field experiment or has a strong natural experiment, anOLS type of regression will underestimate (bias toward a more positive coefficient) theeffect of government funding on private donations. Most of the current research hasrelied on two-stage least squares (“2SLS”) framework to address issues of endogene-ity and omitted variable bias. This requires that one find measures that directly explainvariations in government funding but only indirectly (through the government fundingchannel) explain private giving. Although 2SLS is a popular and useful technique, it hasits limitations.The biggest concern is weak instruments (see, Bound et al., 1995; Choa &Swanson,2005;Cruz & Moreira, 2005). If one uses instruments that only weakly identifythe level of government funding, the estimates of crowd out will still be biased. In any2SLS estimation, therefore, the researcher should ensure that the instruments work, thatthere is a good story to explain how the instruments affect government funding, and thatthe instruments do not directly explain private giving.
The literature that employs a 2SLS technique,generally finds that government fundingcrowds out private giving. Hungerman (2005) suggests that public social welfare fundingcrowds out revenues by faith-based organizations on the order of 67 cents for every dollarof public funding. Andreoni and Payne (2011a) find an overall crowd out of 70 cents forevery dollar of government grants when studying charities involved in the provision ofgoods related to social welfare and community development. These use data from theUnited States. Andreoni and Payne (2011b) use data on Canadian charities and measurecrowding out at close to dollar-for-dollar.
Is the measure of crowding out usually the same across different types of charities?While crowding out seems large for social welfare organizations, there is no evidence of

Charitable Giving 25
crowd out for health organizations or for overseas and relief organizations.30 Borgonovi(2006) studies the effects of changes in government funding on private giving toAmericannon-profit theaters. He presents evidence to suggest that small levels of governmentfunding crowd in private donations but large levels of funding crowd out donations.However, Borgnovi only studies a small sample of charities. In the context of education,the analysis of both Connolly (1997) and Payne (2001) suggests that donors may not be asinformed about the goods and services provided by universities, potentially allowing thegovernment grants to serve as a signal of quality to private donors, especially when thesignal relates to grants associated with research activity. Both empirical analyses supportthis conjecture. Recent work by Blume-Kohout (2012) also suggests that governmentresearch grants provide a signal of quality to private donors.
Overall, however,while there are numerous studies that explore crowd out as it relatesto the provision of social services, there are too few studies that examine crowding outin other charity sectors, such as environmental, health, education, and the arts.
If crowding out ranges from 70 cents to 1 dollar, is this mostly attributable to a changein donor behavior? There are several things to consider in answering this. First, donorsmay be latent givers, that is, they must be encouraged to give through fundraising andmarketing campaigns. Second,charities are likely more concerned about service provisionthan revenue growth.That is, as non-profits, charities may not be net revenue maximizersand instead may view fundraising as a “necessary evil.” Third, it is important to controlheterogeneity among charities when analyzing the interaction between private and publicfunding. In short, it is important, yet delicate, to treat charities as active players when itcomes to the collection of private donations.
Andreoni and Payne (2003, 2011a) shed light in the role of charity fundraising oncrowding out using US data. In 2003 they demonstrate that for both arts and social wel-fare charities, increases in government funding to an organization significantly decreasefundraising efforts by the organization. In 2011 they study a panel of more than 8000 char-ities operating in the United States.They measure an overall level of crowding out on theorder of 75%.This crowding out can be decomposed into the portion that is attributableto donors independently changing their contributions and the portion attributable to achange in fundraising behavior. Their research suggests the bulk of the crowding out isdue to a change in charity fundraising. Depending on the specification, in fact, donorsmay be slightly crowded in by government grants. The maximum level of crowd outattributable to a direct change in donors’ giving is 30%. Thus, the portion of crowdingout attributable to a change in the charity’s behavior ranges between 70% and 100%.
Andreoni and Payne (2011b) expand upon these findings with a rich data set of morethan 13,000 charities involved in the provision of social welfare and community services
30 For both of these types of organizations the effects are imprecisely measured. Health organizations can be difficult tostudy because these organizations exist in the private, public, and charitable sectors, making it difficult to understandthe incentives and the organizational structures of the institutions that qualify as a charity. Relief organizations can alsobe difficult to study because in many cases the funds collected in one community are used in another community.

26 James Andreoni and A. Abigail Payne
in Canada over more than 15 years. For overall private giving, they measure crowdingout of close to 100%. Similar to the US data, approximately 77% of this crowding outis attributable to change in charity fundraising. Unlike the US data, however,Andreoniand Payne can examine whether crowding out is similar across different types of privategivers to the charity: individuals that give directly, individuals that give through partici-pation in fundraising events (such as gala dinners or other non-tax receipted revenues),and donations from other charities and charitable foundations.The analysis suggests thatindividuals that give directly do not reduce their giving when the charity receives agovernment grant – instead they increase their giving, suggesting a crowding in effectas would occur if individuals use government funding as a signal. The crowding out isattributable to a decline in revenues from fundraising events (likely because the chari-ties reduce their fundraising efforts) and a decline in revenues from other charities andfoundations. These other charities and foundations are likely better informed about theactivities of the charities under study and, thus,more likely to change their funding levelswhen the charity receives government funding.
Despite the great attention to crowding out, there remain many open questions.Crowding out clearly differs across the types charitable good or service being provided,and it differs across each source of private revenue, in ways that are not yet understood.Moreover, if giving is crowded out, where does the giving go? Do donors give it toanother cause or use it for private consumption. Conversely, if a fundraiser succeeds inattracting a new donor, is that money simply moved from another charity, or is the newdonor also giving new dollars to the charitable sector.31 One thing that is clear, however,is that viewing organizations as active players in the market for donations has brought richnew insights to questions of crowding out and the effectiveness of government policy.
4.3. Evidence from Field ExperimentsThe main models of fundraising discussed above are built on the assumption that thereare some latent transaction costs to giving. Contacting donors with a request to give,perhaps providing a return envelope and information about the organization, can lowerthe transaction costs and hence trigger a gift. We start this section by discussing a paperby Huck and Rasul (2010) that attempts to measure the selection into giving based on amodel of transaction costs.
Notice that if an individual faces random transaction costs—one’s day could be partic-ularly busy or unusually slow—this effect cannot be captured in a single request to give.Thus,one needs at least two requests to identify a model of selection into the set of donors.Huck and Rasul conduct a study using the same fund drive described above. Potentialdonors received a detailed solicitation letter that varied across donors with respect to
31 Reinstein (2011) discusses a framework for thinking about displaced giving, while Rose-Ackerman (1982) discussesthe potential for fundraising to only reallocate givers without actually raising more funds for the charitable sector as awhole. Both papers raise important issues that seem worthy of additional research.

Charitable Giving 27
whether a leadership gift was mentioned and potential matching rates for donations. Sixweeks later these donors received a brief reminder of the earlier mailing but carried nonew information. Let r1 be the response rate on the first mailing and r2 be the responserate on the second mailing. Let s stand for the share of donors who would like to give iftransaction costs were sufficiently low and let t be the probability that an individual drawsa transaction cost that is at or below the threshold at which they will find the time toconsider the solicitation and mail a check. Assuming s and t are the same across solicita-tions (the authors provide cogent arguments about why the data support this assumption),then with two mailings the response rates would be defined as r1 = st, and r2 = s(1− t)t.These two equations can be solved for s and t. The authors do this for both a controlgroup that was not told of a lead giver, and for a treatment group that was. Solving forthe control group, s is 0.069 and t is 0.54,while for the treatment group, s is 0.061 and t is0.57.The fact that these numbers are so similar, despite the fact that the treatment groupgives higher amounts at both the initial and reminder solicitations, is supportive evidencefor an underlying model of fundraising built on notions of transaction costs of givers.32
An important implication and lesson of field experiments using mailings that is worthemphasizing is clarified in this multiple-solicitation technique.The reminder letter men-tioned nothing about the leadership gift or matching rates.Yet, those who gave after thesecond solicitation but had gotten letters mentioning the lead gift in the first solicitationgave more.This leads one to ask whether the differential propensity to be treated—that is,opening the envelope on the first solicitation—is interacting with the willingness to givein the second mailing. Backing up one more stage, one could also imagine that thosewilling to open envelopes from charities in the first mailing are also hopeful to havesomething to support, which in turn may select themselves into being treated based onan openness to being influenced by, say, a leadership giver. This self-selection into beingtreated,along with the low response rates,means that these experiments are not informingus about a general population,but a self-selected and potentially extreme subset of poten-tial givers. Charities that offer matches over a telephone solicitation, radio advertising, orusing a social network, for instance, may find entirely different patterns of responses.
4.4. Further Evidence from ExperimentsHere we discuss other laboratory and field experiments that consider charities as par-ticipants in a complex strategic game among several players. We highlight two issues:crowding out and sequential giving.
32 Huck and Rasul (2010) argue convincingly that other explanations of choice cannot explain the data. For instance,the fact that the second mailing gets any response is evidence that either preferences or transaction costs of giving havesome random element. A random utility model, however, is contradicted by the fact that response rates fall by half inthe reminder.This leaves randomness in transaction costs as a likely explanation.The simple two equation approach is,obviously and necessarily overly simple—it is the most one can do with two solicitations.

28 James Andreoni and A. Abigail Payne
Early experiments on crowding out focused on abstract public goods provided in thelaboratory (Andreoni (1993); Bolton and Katok (1998); Chan, Godby, Mestelman, andMuller, 2002). These found incomplete crowding out, suggesting that subjects’ prefer-ences included some imperfect willingness to substitute own giving for forced givingthrough “taxation.” The strength of this approach is that it clearly identifies the role ofpreferences apart from any context brought into the experiment from the real world, orany value placed on being a“donor,” either through conscience, identity, audience effects,or other elements that may account for the warm-glow. However, this narrowness is alsoa weakness.What if context (that is,giving to an actual public good in the world) interactswith warm-glow to change its impact?
In a simple and clever manipulation by Eckel, Grossman, and Johnson (2005), labora-tory subjects play a dictator game33 with an actual charity.34 Using the setup of Boltonand Katok (1998), both the individual and the charity were endowed with an initial splitof $20, either $18 for the subject and $2 for the charity, or $15 for the subject and $5 forthe charity. Subjects could then “top up” the small forced donation. The hypothesis ofcomplete crowding out is the final allocation should be independent of this initial alloca-tion.The interesting twist here was a further manipulation in how the initial endowmentwas framed. If it was stated simply as a starting allocation, crowding out was seen asessentially zero—giving did not depend on the starting allocation. However, if subjectswere told that they had $20 to start with and that $2 (or $5) had been “taxed” away fromthem, this tax was incorporated into the contribution leading to 100% crowding out.
What accounts for this difference in framing? Obviously it cannot be that subjects haveutility functions over the final provision of the charitable good, since otherwise givingwould have been zero in all conditions.35 Instead, it is likely that the frame affects howsubjects perceive themselves or how they feel they are perceived by others. It would appearthat publicly framing the initial allocation as a tax served to create the mutual knowledge
33 People often ask about the validity of an experimental dictator game to explain behavior outside the laboratory,pointingto potential experimenter demand effects as a possible confound (List, 2007; Bardsley, 2008). Recently, Franzen andPointner (2013) correlate behavior in the laboratory with real choices made many weeks later with a real solicitationfor a charity, and found laboratory and field choices were significantly correlated. One way to reconcile the intuitionof demand effects with this result is that in the field there are“fundraiser demand effects” that are similar to those in thelaboratory, and affect similar people. This would then turn the argument upside down—dictator games are excellentgames for studying giving in the field precisely because they contain demand effects.
34 The authors offer each subject a choice from a menu of charities.The idea is to increase the likelihood that subjects arepaired with a charity they support. One could imagine, however, using this selection as a commitment device: choosea charity that one dislikes so as to make it easier to say no in the giving stage.While the authors found no evidence ofthe strategic use of choice, the hypothesis was not given a clear test; all charities offered were likely to be supported bysome degree by all subjects.
35 A closely related paper by Crumpler and Grossman (2008), discussed earlier, makes this point clearly. In a similar setup, lab subjects can play a dictator game with a charity. However, the experimenter has already guaranteed the charitya large donation. Any gifts from subjects will be deducted from the experimenter’s guarantee. Thus, subjects’ gifts willhave no marginal effect on total giving,but will have a compositional effect of including more money from the subject.Despite the strong incentives to give zero, the authors find 57% of subjects donate, and about 20% of endowments goto charity. This is striking evidence in favor of a warm-glow motive.

Charitable Giving 29
that subjects would get credit for this contribution.36 Li, Eckel, Grossman, and Brown(2011) show this must be the case. In another “real donation” setup, subjects can give toprivate charities, or to government agencies that would appear to be providing a near-perfect substitute (such as disaster relief,or cancer research). Individuals made similar levelsof donations to the government or private sector provider, although the 22% going tothe government was smaller than the 27% going to the private alternative.37 Nonetheless,this study shows that people are not opposed to taxation, but will voluntarily pay a tax,as long as it is clear to all sides, and perhaps especially the subject herself, that the “gift”includes the dollars going to the government.
Next we turn to sequential giving. Much of the intuition for markets for giving isbased on static models in which all givers move simultaneously. In life, as has alreadybeen noted in the discussion of leadership giving, giving is often sequential. Often these“leadership gifts” will come from a small set of large donors. It is believed, however, thatthis way of organizing donations is the best way to guarantee the success of the funddrive.38 Several theoretical papers have suggested that the leadership giver may have anincentive to become better informed than other donors, thus the lead gift conveys usefulinformation (Andreoni, 2006a;Vesterlund, 2003). Another hypothesis is that leadershipgivers are instrumentally giving to promote reciprocal gift exchange.A clever experimentby Potters, Sefton, andVesterlund (2007) shows that when leadership givers reveal privateinformation using a credible signal, leadership giving is effective.This supports the modelof signaling over reciprocity.
Another feature of real-world giving is that it unravels slowly over time. In an impor-tant paper by Marx and Matthews (2000), giving is modeled as an iterative mechanism.Building off of Schelling’s (1960) intuition, giving little-by-little can help solve the freerider problem since each giver only risks a small amount of money and reveals only asmall bit of information about his willingness to pay. Marx and Matthews show formally,however, that for this to be true there must be a discontinuous “completion benefit.” Ifthere is, and if players are sufficiently patient, iterative giving can have the effect suggestedby Schelling. Duffy,Ochs, andVesterlund (2007) find iterative giving is indeed more suc-cessful but, in contrast to the formal model, the success does not depend on the existenceof a discontinuous completion bonus.
A final way sequential giving could be important in the real world is that it helps giversform beliefs about what size gift is “appropriate.” Giving, as we have argued, has many
36 It is amusing how this also mirrors the political debates. Those who favor smaller government tend to discuss thegovernment in terms of “your taxes,” while those wanting a larger presence for government discuss policy in terms of“your schools” or “your highways.”
37 This set of results is also striking in line with the results of a neuro-economics study by Harbaugh, Mayr, and Burghart(2007), which showed that people enjoyed giving to charity, even if it was a forced versus a voluntary gift, but the joyof voluntary giving (as measured by neural activity in the pleasure centers of the brain) was higher than for involuntarygiving.
38 See Andreoni (1998) for a discussion of these practices and a theory of seed money as signals for charitable giving, andsee List and Lucking-Reiley (2002) for a field experiment supporting this model.

30 James Andreoni and A. Abigail Payne
components of a purely social good, such as audience effects, identity, and status, and assuch how much a person wants to give could be a positive function of what others give.Sequential giving allows people to learn from those who came before. In an experimentusing public radio donors, Shang and Croson (2009) manipulated information given todonors calling into a station to make a pledge.When they announced the largest of recentdonations, this indeed had a positive effect on giving.
5. APPROACH 3: GIVING AS A SOCIAL ACT
Markets, as economists have idealized them,are impersonal. Supply meets demand.Thereis no courtship,no flattery,no salesmanship—just exchange.Thinking of charity as existingin a market with many players is a necessary step toward understanding how the differentparticipants respond to each other. But the extremely personal nature of charitable giving,the fundamentally human aspect of giving and helping,suggests that perhaps this idealizedanalog of a market is missing some fundamental aspects of the giving dynamic that couldbe critical to understanding why people give, and why we rely on charity to provide somany social goods and services. Understanding giving as a social act will allow us to askwhether this structure is efficient or whether, as is often the case in textbook markets,the exchanges are fraught with “market” imperfections.
To make the point starkly, as researchers in the area of giving and altruism will surelyaffirm, a perennial question asked of us is,“Why do people give?”Why is this questionasked in the first place? Do labor economists get asked, “Why do people work?” Donewspapers print headlines asking,“Why do people buy food?”Giving, altruism, charita-ble feelings, and behaviors are as common to everyone’s personal experience as getting ajob or eating a meal, yet charitable behavior remains something that has escaped an easyexplanation and remains a topic of great fascination, both in and out of academia.
One reason economists have, perhaps, struggled to provide a simple answer to thequestion is that the answer goes beyond the borders of mainstream economics. Sociologyand psychology may be needed as well. Scientists from these areas will tell us that givingtypically involves at least two steps. First is an intellectual recognition of a need. But thisis clearly in itself not enough. For nearly everyone on the planet there is someone theyknow (or know of ) who is in much greater need than themselves, or is aware that thereare causes whose social benefit greatly exceeds one’s own private benefit of the last dollarof consumption. Awareness is not enough. So what else is needed to move awarenessinto action?
This section will explore several answers to what could be part of that “what else.”Allof these will revolve around the inherent sociality of giving.
Begin with the trivial observation: giving requires a recipient. Giving is rarely anony-mous and even more rarely is it unnoticed or unknown. That is, someone is typicallywatching and the fact of an audience may influence giving. But even when no one truly

Charitable Giving 31
knows about a gift, the giver herself knows.39 Are we, as Adam Smith wrote inTheTheoryof Moral Sentiments, our own audience?
Another feature common in the giving exchange is a request to give. It is a fair approx-imation to say that virtually all giving is accompanied by a direct request, a fundraisingsolicitation, a phone number or web address on a television screen, or an extended hand.Rarely does a donor get “hungry” for more giving, instead the recipient tends to comeseeking the donor. People may be more or less willing to put themselves on life paths todo good deeds, such as the person who becomes an overworked and underpaid teacher ornurse rather than an accountant or statistician. On a day-to-day scale, a willingness to givewill often be correlated with a willingness to let oneself be asked.And when being asked istruly exogenous, a willingness to give may be correlated with a weakness of will to say no.
If asking is so powerful, this leads us to imagine what hold asking has on people.Why does asking work? Economists are just beginning to examine these questions, butthe answer, we will conjecture, lies in another key ingredient to the chain of mentalstates that leads to giving. In particular, once one intellectually acknowledges the needsof another, an emotional experience of those needs is most often present in those whogive. That is, humans feel great empathy.
5.1. Audience EffectsPublic Broadcasting fundraisers read names aloud on the air, the symphony lists donorsin the program, and after class reunions the names of those who gave will be printed inthe annual college newsletters.
These tactics apparently work to increase donations, but why? One hypothesis is that,for whatever accident of evolution—biological or cultural—individuals form judgmentsabout others and,more to the point,people care that they themselves are judged positively.Two papers published in the same year discussed the importance of such audience effects,Ariely,Bracha, and Mier (2009) and Andreoni and Bernheim (2009). Here we discuss thesecond of these, though each had a similar intent.
The paper by Andreoni and Bernheim uses a simple dictator game in which thedictator has $20 to share with a recipient. It seems obvious that most people will agreethat the socially acceptable—some would say normative—choice in this dictator gameis a 50-50 split. People, however, may have heterogeneous values for how much theypersonally care about adhering to this 50-50 norm.The key innovation in this analysis isto assume that in addition to caring about others and about adhering to the norm,peoplealso care their“social image.”That is,people care that others perceive that they are altruistic.
39 Adam Smith famously discussed this self-monitoring in the Theory of Moral Sentiments as the notion that inside ourminds is an“impartial spectator”who evaluates the moral value of our choices, and whose opinion of us matters greatly.Smith did not speculate as to whether this spectator, while impartial, was also naïve. That is, are we capable of hidingour true intentions from the impartial spectator? Stated differently, do we benefit from signaling our true types to thespectator (or perhaps hiding our true types by pooling),or is the spectator,who, after all lives in the same neighborhoodas our consciousness, smart enough to know our true types, but simply judges us by our choices.

32 James Andreoni and A. Abigail Payne
Suppose that with no audience Alice would most prefer to give Bob a 45% shareof the pie, keeping 55% for herself. Notice, that with an audience it will cost just 5%more of the pie for Alice can appear just as generous as those who care infinitely aboutconforming to the 50-50 norm. By giving 45%, conversely, she reveals her true type.Here the audience makes her behave more generously.
Instead, suppose Alice would, without an audience, be willing to give Bob 2% of thepie. With an audience Alice will be seen almost as poorly as those others who are takingeverything.To gain an extra 2% of the pie Alice relinquishes almost nothing in her socialimage and,depending on the distribution of the preferences for conforming to the norm,could find the trade-off makes her better off.That is, an audience makes her behave moreselfishly.
Combining these two effects, the audience can create a“double pooling equilibrium,”and this outcome exactly captures the specific data from experiments.
Andreoni and Bernheim follow this theory with a new experiment. They do this byadding noise to a Dictator Game choice. For instance, regardless of what the dictatorchooses, there could be a 50% chance that her choice will be substituted with “givenothing.”Thus, when a recipient gets nothing it is unclear whether the dictator or theexperimenter is responsible.The theory neatly shows, as this likelihood of being“forced”to be selfish grows, the pool at giving 50:50 should shrink and the pool at “give nothing”should grow. This is precisely what happens in the experiment.40
The model and experiment of Andreoni and Bernheim, while not about charitablegiving per se (although Ariely et al. do contain elements of charitable giving), providesa structure and a backing for understanding the social aspects of an audience that maybring richness to future studies of giving.
5.2. The Power of the AskFundraisers are fond of saying that there are two kinds of mistakes to make in a funddrive: asking for too little and asking for too much. Ask for too much, they say, and youget nothing. Ask for too little and you get what you asked for. A recent experiment byAndreoni and Rao (2011) illustrates this wisdom, but with a twist about how giving isactivated.
Again, a laboratory Dictator Game is the backdrop. In a baseline game there wasno communication between dictators and recipients. In the Ask condition, recipientscould make a request of dictators, including a short written statement. In the Explaincondition, the dictators could include a short explanation along with their choice. Bothof these allow only one-way communication. InAsk-Explain and Explain-Ask conditions,communication goes two ways, but who speaks first is switched in the two conditions.
40 In a complementary condition, the random device instead forced dictators to “give 1”. Even though no subjects evergave just one in the first condition, as the likelihood of this forced choice grew, the pool at give 1 did as well.

Charitable Giving 33
As is common, the baseline resulted in about 16% given. Asking improved this. Mostrecipients asked for 50%, said something about fairness, and this boosted giving to 24%.With explaining came the first big surprise: giving dropped to 6% and dictators mostcommonly said,“I’m sorry.” However, combining asking and explaining does not resultin an averaging of the result. Recipients again ask for a 50-50 split, but now both dicta-tors and recipients tend to mention fairness, regardless of which player moved first, andgiving surges to almost 29%, with significantly more 50-50 splits—the highest among allconditions.
Andreoni and Rao added one more manipulation. They re-ran the two one-waycommunication conditions, but before subjects made their choices they actively engagedin imagining themselves in the other’s shoes. That is, they engaged in empathic think-ing about the other player. The result was that one-way communication with inducedempathic thinking looked indistinguishable from that in two-way communication.
What does this teach us? While the mental processes are not measured, the behav-ior is consistent with a simple story that linguists, sociologists, and language specialistswould tend to support. Communication—a fundamental feature of any social inter-action such as giving—requires empathic reasoning. Without communication we canmaintain an intellectual awareness of a need yet still maintain a “willful indifference”to the emotions that an “empathic awareness” might then ignite. Perhaps, it is conjec-tured, asking is powerful because it forces people beyond an intellectual awareness intoan empathic awareness, and it is the latter that is necessary for an altruist to become agiver.41
5.3. Diversity and the Socio-economics of GivingIn urban centers across NorthAmerica and Europe,neighborhood diversity is increasinglycommon.This diversity is often lauded as a virtue in and of itself. From a public economicsperspective, however, public good provision often decreases in the presence of diversity.The observed decrease in public goods includes spending less on schools, roads, andhospitals (Alesina et al., 1999, 2004; Poterba, 1997; Goldin & Katz, 1999). What is lessclear is how diversity affects the support for privately provided public goods such ascharities. Standard economic models suggest the predictive effect of diversity on privatelyprovided public goods is unclear. If individuals sort into groups that are distinct based oncharacteristics such as ethnicity, religion, or income, then increased diversity may fostergreater participation in organizations that allow for this sorting, resulting in an increasein giving to these types of groups. But if charities are perceived to benefit individualsthat are outside of one’s group, then we might observe a decrease in giving.
41 Recent neurological studies back this up. Jack,Dawson,Begany,Leckie,Barry,Ciccia, and Snyder (2013) show that thecool intellectual aspects of reasoning suppress the impulsive empathic parts of the brain, and vice versa.This suggests aphysiological reason to avoid a fundraiser—an awareness that being asked will stimulate your emphathy and thus makeit harder to engage your intellect when making a giving decision.

34 James Andreoni and A. Abigail Payne
Andreoni, Payne, Smith, and Karp (2011), using data from Canadian tax-filers, beginto shed light on this issue. Their data is at a neighborhood level (approximately 5000households per neighborhood) spanning up to four censuses (15 years) and using over17,000 neighborhood-year observations. They use an empirical methodology adaptedfrom Vigdor (2002, 2004). By using shares of the population as a measure for groupaffiliation, one can develop a Fragmentation Index to measure the level of diversity inthe neighborhood. This index is widely used in the literature and is easily interpretedas the probability that any two randomly selected individuals in the community belongto different groups. The authors observe that while the average adult donates approx-imately $200/year, an increase of 10% points in the Fragmentation Index for ethnicdiversity implies a decrease in giving of $27, approximately a 14% reduction.The declineis attributable to the intensive (amount of giving) and not on the extensive (number ofgivers) margin. That is, increased diversity appears to make givers give less.
The research suggests that different ethnic groups respond differently to diversity. Fora 10% point increase in the share of the identified group, giving by whites is higher by$92, by blacks is higher by $390, by east Asians is lower by $111. Moreover, there arestrong effects of diversity based on the educational background of the neighborhoods.For a 10% point increase in the share of the identified religious grouping, Catholics’donations increase by $69 but there is no statistically significant change in the level ofgiving by those affiliated with other religious groups.
Other work has also found that race and religion matter to givers. Hungerman (2008)found that charitable spending by all-white church congregations is more sensitive toincreases in the shares of blacks in the county than more diverse congregations. He didnot find a similar sensitivity, however, to changes in shares of other races (e.g., Hispanics).Hungerman (2009) also provides evidence to suggest that the effect of changes in gov-ernment spending on church spending varies across communities that is tied to measuresof racial diversity. Experimental work by Fong and Luttmer (2009, 2011) shows thatracial composition affects perceptions about giving.This literature suggests there is moreto understand about the impacts of diversity on charitable giving and the provision ofcharitable goods. If governments are looking to transfer more of their services to charities,then we should consider more how diversity affects charity operations and how theseeffects could affect the delivery of public goods by charities and other private groups.
6. APPROACH 4: THE GIVER’S MIND
Recently, decision scientists and economists have conducted experiments that have hadan eye-opening effect on the study of giving. Dana,Cain, and Dawes (2006) showed that,rather than enter a $10 dictator game with an anonymous partner, many people wouldaccept $9 and be allowed to leave with the potential recipient not being made aware ofthe choice to exit.This would seem to violate revealed preference—entering and taking

Charitable Giving 35
$10 is optimal for a selfish person, and entering and giving $1 and keeping $9 wouldseem to be preferred by an altruist. So why would people prefer to exit? A second study,with Dana,Weber, and Kuang (2007), hid from people the consequences of their ownactions on another subject—a maximizing choice for oneself either harmed or helpedanother. Subjects could find out whether their interests were aligned or opposed simplyby clicking a box on the computer screen before making their choices. A surprising frac-tion refused the free information and made the choice that maximized their own payoff,willfully remaining ignorant of the consequences. Subjects were, the authors argue, pre-serving “moral wiggle room” that allowed them to escape the guilt of creating a negativeexternality by preserving a belief that maybe the externality was actually positive.42
This led people to ask, do people actually dislike giving? Are fundraisers, by puttingpeople in the social situation that creates an expectation of meeting some norm orstandard of generosity, actually making people worse off ? Should we care about this froma public policy perspective?
These observations and arguments are reminiscent of a recent but important questionraised about the efficient subsidies to the provision of public goods through privatecharities. Most notably, Diamond (2006) asked whether the warm-glow of giving issomething that those concerned with social welfare should take into account. Andreoni(2006b) summarizes and amplifies these arguments.While the institutions themselves maymanipulate warm-glow as an impulse or incentive to give, these authors argue that it isthe final allocations of actual public good that should be what enters the welfare calculus.In contrast to this question, there is no debate about whether we should change welfarecalculus to include the delight one might feel at getting a new sweater at a bargain price,nor the remorse one feels buying the sweater the day before the price was discounted.Thereis common agreement that welfare should depend on the allocation of sweaters and pricespaid.What makes markets for giving different? Should social welfare calculations considerthe means to an end in charity markets? Obviously, if the state has a compelling interest inthe institutions per se then institution itself becomes a public good whose utility shouldbe counted, but this is not the argument being made.This line of reasoning suggests thatthe answer to the question of how to calculate costs and benefits of giving—physical andsocial—should not lie solely in uncovering what is in the minds or hearts of donors, butinclude the consequences for the set of public goods that are provided by them and thedeadweight cost of acquiring them. Moreover, the calculation must depend on the valuerelative to the next best alternative, which would appear to be government provision.
There is also a further question about what one can infer from an individual who showsreluctance to give,or a desire to avoid a solicitation. Obviously,one cannot and should notgive on all occasions, just like one cannot and should not eat whenever food is available.A resistance to give may not indicate a lack of altruism, but could be a sign of discipline,
42 See also Lazear, Malmendier, and Weber, R. (2012).

36 James Andreoni and A. Abigail Payne
restraint, and adherence to careful spending plans. What about an unwillingness to evenbe asked to give? Just as the smell of freshly baked cookies may make it difficult to bedisciplined when on a diet,being asked to give may trigger psychologically uncomfortablefeelings—feelings that exist in our minds because of natural instincts to be benevolentwhen it is helpful and when we can afford it—and avoiding temptation helps maintainour self-discipline.
In the next two subsections we summarize two recent papers that examine,in differentcontexts, the willingness of individuals to be solicited to give. Both provide evidence ofindividuals who appear to be very aware, perhaps at a subconscious level, of the need toexert control over how intensely they are solicited to give.
6.1. Social Costs of Social PressureDellaVigna et al. (2012) present an ambitious and important study on the“social pressure”costs of fundraising.43 They conducted a door-to-door fundraising field experiment thatvisited over 7600 homes in 2009. The baseline experiment was a standard cold call,where the fundraiser arrives at the door unexpectedly. A second condition announcedthe potential visit by leaving a flier on the front door of the home, indicating that afundraiser would visit the home the next day at a specified time. A third condition usedthe fliers again, but this time the resident could check a box on the flier asking not tobe disturbed. Finally, in a separate manipulation to estimate the opportunity cost of time,the fundraiser offered to pay the resident a small fee to take a short survey, with rates ofpay and lengths of the survey varying. The study explored two key questions. First, dopeople avoid fundraisers, yet give because of some social pressure? Second, what is thesocial cost of fundraising, including the cost of social pressure?
Key to their analysis is the structural estimation of the utility equation
U = wi − gij + aij ln (�j + gij) − Sj ∗ I(gij < $10),
where wi is income, gij is the gift to the charity, aij is a utility parameter for the warm-glow of giving, �j is a utility shift parameter, Sj is an estimated parameter for the socialpressure cost, and I(·) is a function equal to 1 if the gift was under $10, that is, the authorsassume that social cost is felt most severely when giving nominal amounts. Notice, theaij and Sj parameters are identified from the random assignment to the “do not disturb”conditions, from the willingness to accept payment for answering a short survey, that is,to be inconvenienced in the service of a good cause, and by assuming the aij are normallydistributed across individuals.44
43 See also Meer (2011) who shows the additional effect of peer pressure over and above any social pressure.When a collegeroommate calls to ask for a donation to the alma mater, both the likelihood and amount of giving rise significantly.Fong and Luttmer (2011) show as well that similarity among potential recipients and the donors also matters.
44 While the “i” dimension refers to individuals, the “j” dimension refers to the fact that there were two charities underconsideration in this field experiment. One was local and well known, and the other was conspicuously not local andlikely unfamiliar.

Charitable Giving 37
Estimating this utility function through iterated method of moments, the authors areable to estimate the desire to avoid and,by estimating the aij and Sj , gain a sense of the netsocial pressure cost of fundraising. They are able to find evidence for both warm-glowaltruism and social pressure. About half of donors they sample would prefer not to becontacted by the fundraiser. Moreover, the parameter estimates suggest refusing a requestfor a $1 donation has a social pressure cost of around $4, indicating that, in this study, thesocial costs of door-to-door fundraising are likely negative at the individual (althoughnot necessarily societal) level.45
6.2. Avoiding the AskThe second study complements the DellaVigna et al., results by approaching a differentvenue. Andreoni, Rao, andTrachtman (2012) teamed with the Salvation Army for 4 daysin December 2009 to perform a natural field experiment at a suburban Boston super-market.The supermarket was chosen to be typical in that it faced a large parking lot andhad two main entrances facing the lot. In a 2×2 design, college aged women stood inSalvation Army aprons and rang bells at one door or both doors, and either simply rangor rang and said,“Merry Christmas, please give today.”Thus, a quarter of the patrons hadan indirect ask that was easy to avoid (one door, just ringing), another quarter had anindirect ask that was difficult to avoid (both doors covered), a third quarter had direct asksthat were easy to avoid (one door and “please give”), while a final quarter were directlyasked to give and were difficult to avoid (two doors of “please give”).
The four conditions were randomized into 16 blocks over four consecutive days, the“kettles” were swapped out 64 times to count donations, helpers counted the number ofpassings through each door, and the number of givers. In all, over 17,000 entrances andexits were counted.The randomization allowed the authors to account for those wishingto avoid, those seeking an opportunity to give, the gifts of those opting to pass by thebell ringer and to forecast the lost contributions of those who avoided the bell ringer.
Notice the experimental manipulations here were very minor, as were the costs toavoid—a person may need to spend 45 s walking farther through the parking lot to avoida simple “please give today.”
The findings were that shoppers did almost nothing to avoid the simple bell ringing.However,when the ringing was accompanied by a direct ask, about 30% of shoppers usedan alternative entrance when they could. Only about 1.5% actively sought an opportunityto give. Surprisingly, however, those who were captured by the coverage of two doorsgave, on average, just as frequently and just as much as those shoppers who did not avoidbeing asked, a result similar to that found in field data (Meer & Rosen, 2010). In otherwords,there appeared to be virtually no sorting on the magnitude or propensity to donate.
45 When the charity was the unfamiliar out-of-state charity, the cost appeared far higher–$37 cost of declining a $1request. In other words, the benefit to society would need to be 37 times the value of the $1 to the individual in orderto make the request a net positive for the world.

38 James Andreoni and A. Abigail Payne
People, it seemed, were not avoiding giving a small amount or saying “no,” but insteadappeared to be avoiding saying“yes.”Much like the self-control or present-bias literature,people appeared to be using the tactic of avoiding being asked as a means to control theirimpulse to give when directly asked by a human to give to a worthy cause.
6.3. Is Fundraising Bad for Society?The last two sections indicate that many, if not most, people dislike being asked to give.Does that mean that fundraising is bad for society? The only way to answer this is withanother question: compared to what? There are many ways to organize a society toachieve certain social goals, and each leads to a different set of burdens and distortions.For instance, most people dislike paying taxes but like a rich set of public services. Theirefforts at avoiding taxes are what we call deadweight loss of taxation,and the consequenceof taxes on the distribution of consumption is what we call the incidence of taxation. Ifinstead of mandated giving through taxes we opt for voluntary giving through charities,we create another type of distortion and incidence. One distortion is that people musttolerate saying“no”or avoid saying“yes” to many worthy causes. A question of incidenceis that the “tax” of charitable fundraising falls disproportionately on those who are themost “charitable,” that is, those who are most willing to give. Moreover, compared togovernment provision, where preferences are represented by votes, with private givingthe preferences of people are expressed by their donations. Hence, the distribution ofgoods provided through giving is likely to focus more on goods enjoyed by the wealthy,such as operas, art museums, and elite colleges, rather than on goods favored by the poor,such as parks, crime prevention, and primary education.
The question of whether fundraising is bad, therefore, relies on how one feels aboutthe efficiency and incidence of different systems of providing social goods. For instance,how costly is it for givers to decline requests to give? Is the cost ephemeral and easilyforgotten, or long lasting? Can givers adopt cognitive strategies that make dealing withfundraisers less stressful, such as planning annual giving budgets and sticking to them?Or is asking the donor with the big heart for a gift like asking the chronic overeaterif he would like to see the desert menu—is it cruelly preying on the vulnerable? Is itinequitable for a society to let those with the greatest wealth also have the greatest sayin what kinds of goods are provided, or is it efficiency enhancing to let wealthy donorsbuild self-named monuments (think of Andrew Carnegie) for their own and society’sbenefit?
These questions about how to organize institutions, examining the distortions andincidence of each institutional framework,are deep,difficult, important,and largely unex-plored within economics.46 Breaking the issue down,starting with attempting an estimate
46 Samuel Bowles (1998) argues for similar interactions between preferences, institutions, and welfare in a wide-rangingsurvey article including, among other things, institutions that shape social preferences.
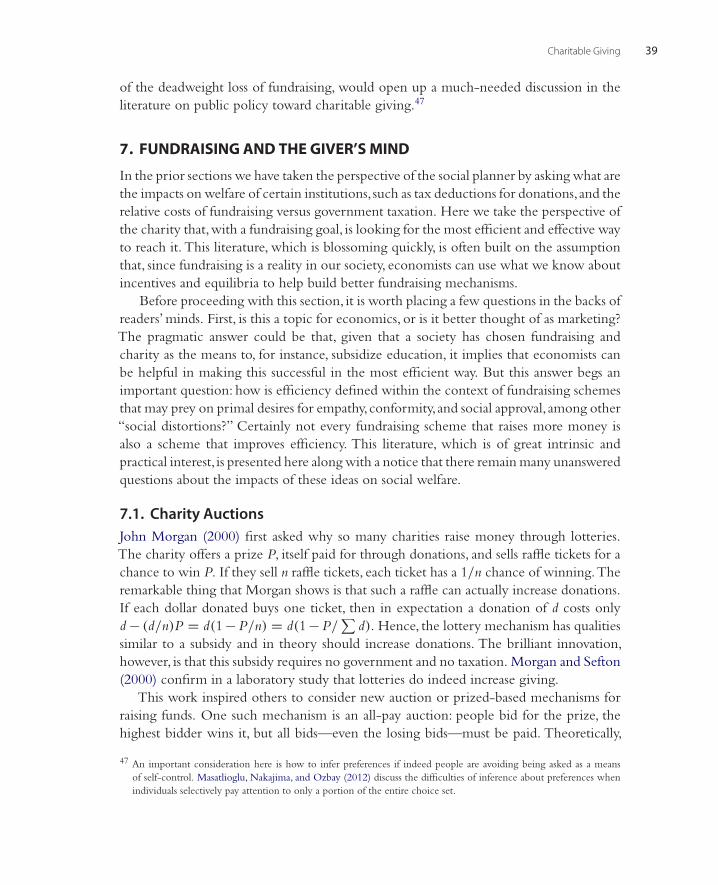
Charitable Giving 39
of the deadweight loss of fundraising, would open up a much-needed discussion in theliterature on public policy toward charitable giving.47
7. FUNDRAISING AND THE GIVER’S MIND
In the prior sections we have taken the perspective of the social planner by asking what arethe impacts on welfare of certain institutions, such as tax deductions for donations,and therelative costs of fundraising versus government taxation. Here we take the perspective ofthe charity that,with a fundraising goal, is looking for the most efficient and effective wayto reach it. This literature, which is blossoming quickly, is often built on the assumptionthat, since fundraising is a reality in our society, economists can use what we know aboutincentives and equilibria to help build better fundraising mechanisms.
Before proceeding with this section, it is worth placing a few questions in the backs ofreaders’ minds. First, is this a topic for economics, or is it better thought of as marketing?The pragmatic answer could be that, given that a society has chosen fundraising andcharity as the means to, for instance, subsidize education, it implies that economists canbe helpful in making this successful in the most efficient way. But this answer begs animportant question: how is efficiency defined within the context of fundraising schemesthat may prey on primal desires for empathy,conformity,and social approval, among other“social distortions?” Certainly not every fundraising scheme that raises more money isalso a scheme that improves efficiency. This literature, which is of great intrinsic andpractical interest, is presented here along with a notice that there remain many unansweredquestions about the impacts of these ideas on social welfare.
7.1. Charity AuctionsJohn Morgan (2000) first asked why so many charities raise money through lotteries.The charity offers a prize P, itself paid for through donations, and sells raffle tickets for achance to win P. If they sell n raffle tickets, each ticket has a 1/n chance of winning.Theremarkable thing that Morgan shows is that such a raffle can actually increase donations.If each dollar donated buys one ticket, then in expectation a donation of d costs onlyd − (d/n)P = d(1 − P/n) = d(1 − P/
∑d). Hence, the lottery mechanism has qualities
similar to a subsidy and in theory should increase donations. The brilliant innovation,however, is that this subsidy requires no government and no taxation. Morgan and Sefton(2000) confirm in a laboratory study that lotteries do indeed increase giving.
This work inspired others to consider new auction or prized-based mechanisms forraising funds. One such mechanism is an all-pay auction: people bid for the prize, thehighest bidder wins it, but all bids—even the losing bids—must be paid. Theoretically,
47 An important consideration here is how to infer preferences if indeed people are avoiding being asked as a meansof self-control. Masatlioglu, Nakajima, and Ozbay (2012) discuss the difficulties of inference about preferences whenindividuals selectively pay attention to only a portion of the entire choice set.

40 James Andreoni and A. Abigail Payne
the all-pay auction should be superior to an auction in which just the winner pays. Thereason is intuitive. Without the donation aspect of bids, all-pay and winner-pay shouldyield identical revenue. Now add in that profits go to charity and imagine the secondhighest bidder in a winner-pays auction. By becoming the top bidder the person gainsthe object, but loses the other person’s donation to the public good, making winning lesssweet.The incentive in the charity auction, therefore, is to bid less aggressively.This sameeffect is not present in all-pay auctions, since all bids are paid, win or lose.48
Despite the clear theoretical predictions, evidence on the relative performance oflotteries,winner-pay,and all-pay auctions is mixed. Schram and Onderstal (2009) confirmthe prediction,while Corazzini, Faravelli, and Stanca (2009) show that all-pay fares worsethan the other two. An important field experiment by Carpenter,Holmes, and Matthews(2008) again shows that all-pay auctions fare relatively poorly, but because of the settingthey are able to offer an additional concern about all-pay auctions: people appear not tolike them–many people in the field experiment chose not to participate in the auction.
Carpenter, Holmes, and Matthews (2010, 2011) recently add a variation to all-paythat shares elements of the giving little-by-little mechanisms presented earlier. They callit a bucket auction. Imagine donors sitting in a circle. One donor begins by placing adollar in a bucket and passing it left. The next donor puts in another dollar then passesthe bucket left, and so on. If a donor passes the bucket without adding a dollar, the donorloses all prior contributions and any chance at winning the prize.The winner of the prizeis the last one to contribute. Carpenter et al. show that the bucket auction raises moremoney than any prize-based fundraising device considered. Why? One can think of thebucket auction as a modification of a Dutch clock auction.These are known to be easy toexplain, easy to understand, and to extract great surplus from bidders. So, even though italso has elements in common with all-pay auctions, the bucket auction is both successfuland, apparently, revealed preferred by the donors in the authors’ field experiments.
7.2. Motivational CrowdingIn a famous study by Titmus (1970), he argued that paying for blood donations mightactually make people less likely to supply blood than if it is accepted as a pure donation.The reason, he conjectured, is that by paying for blood one is denying the individualthe joy of acting unselfishly. In modern terms, reducing the cost of giving blood in turndiminishes the (possibly self-) signaling value of being a blood donor,“crowding out” thisincentive to give.
AlthoughTitmus’ book was heavily scrutinized and often dismissed by scholars, therehave been mounds of evidence that all manner of moral choices are subject to such“motivational crowding out.”49 Recently Mellstrom and Johannesson (2008), using a
48 See Goeree et al. (2005), and Engers and McManus (2007). Extending this to endogenous participation, see Carpenteret al. (2009).
49 See Bowles and Hwang (2008) for an application to giving.
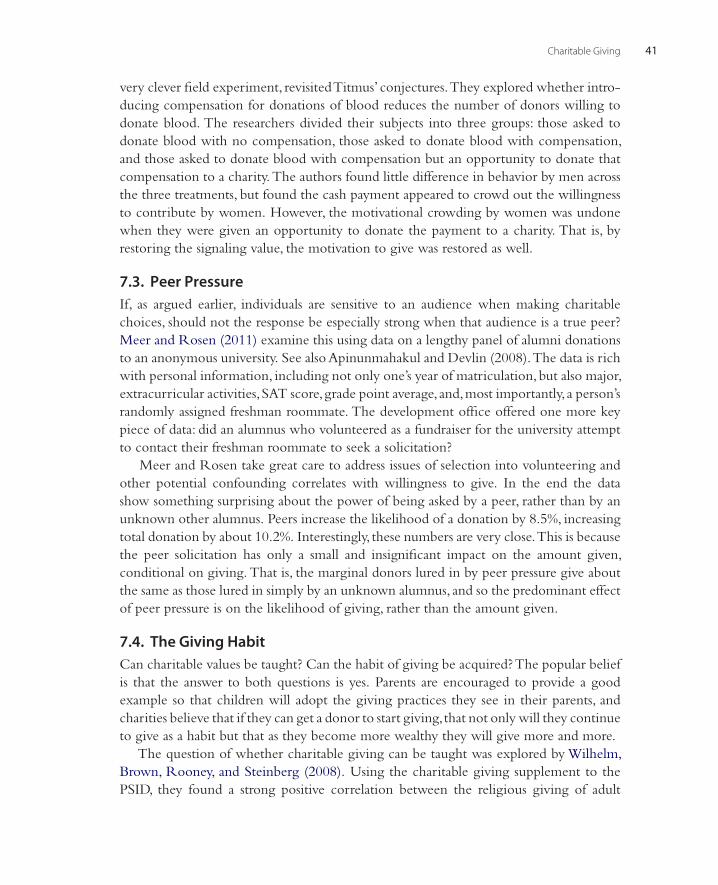
Charitable Giving 41
very clever field experiment, revisitedTitmus’ conjectures.They explored whether intro-ducing compensation for donations of blood reduces the number of donors willing todonate blood. The researchers divided their subjects into three groups: those asked todonate blood with no compensation, those asked to donate blood with compensation,and those asked to donate blood with compensation but an opportunity to donate thatcompensation to a charity.The authors found little difference in behavior by men acrossthe three treatments, but found the cash payment appeared to crowd out the willingnessto contribute by women. However, the motivational crowding by women was undonewhen they were given an opportunity to donate the payment to a charity. That is, byrestoring the signaling value, the motivation to give was restored as well.
7.3. Peer PressureIf, as argued earlier, individuals are sensitive to an audience when making charitablechoices, should not the response be especially strong when that audience is a true peer?Meer and Rosen (2011) examine this using data on a lengthy panel of alumni donationsto an anonymous university. See also Apinunmahakul and Devlin (2008).The data is richwith personal information, including not only one’s year of matriculation, but also major,extracurricular activities,SAT score,grade point average,and,most importantly, a person’srandomly assigned freshman roommate. The development office offered one more keypiece of data: did an alumnus who volunteered as a fundraiser for the university attemptto contact their freshman roommate to seek a solicitation?
Meer and Rosen take great care to address issues of selection into volunteering andother potential confounding correlates with willingness to give. In the end the datashow something surprising about the power of being asked by a peer, rather than by anunknown other alumnus. Peers increase the likelihood of a donation by 8.5%, increasingtotal donation by about 10.2%. Interestingly, these numbers are very close.This is becausethe peer solicitation has only a small and insignificant impact on the amount given,conditional on giving. That is, the marginal donors lured in by peer pressure give aboutthe same as those lured in simply by an unknown alumnus, and so the predominant effectof peer pressure is on the likelihood of giving, rather than the amount given.
7.4. The Giving HabitCan charitable values be taught? Can the habit of giving be acquired?The popular beliefis that the answer to both questions is yes. Parents are encouraged to provide a goodexample so that children will adopt the giving practices they see in their parents, andcharities believe that if they can get a donor to start giving,that not only will they continueto give as a habit but that as they become more wealthy they will give more and more.
The question of whether charitable giving can be taught was explored by Wilhelm,Brown, Rooney, and Steinberg (2008). Using the charitable giving supplement to thePSID, they found a strong positive correlation between the religious giving of adult
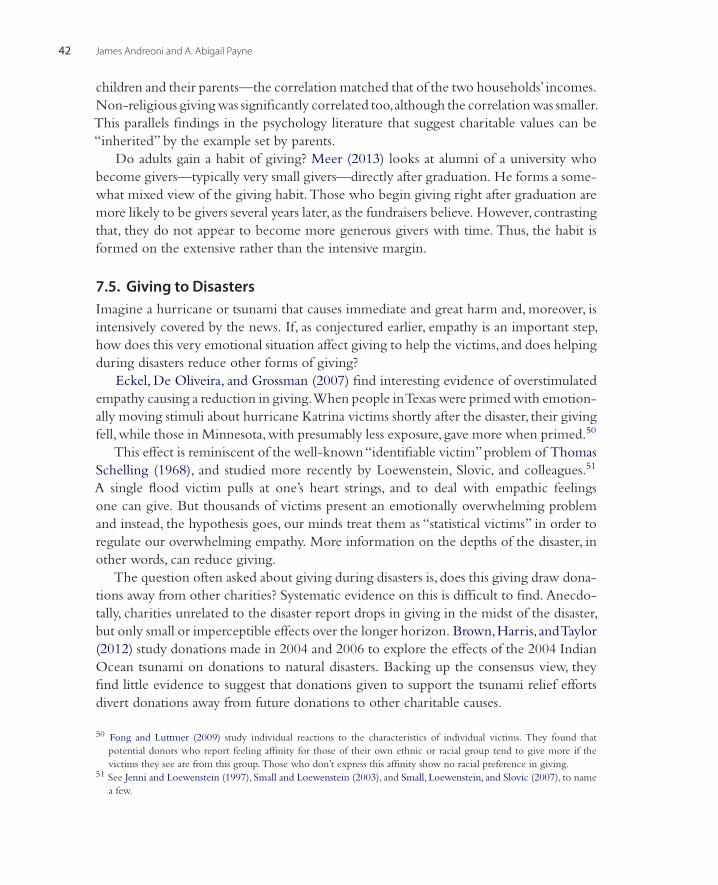
42 James Andreoni and A. Abigail Payne
children and their parents—the correlation matched that of the two households’ incomes.Non-religious giving was significantly correlated too,although the correlation was smaller.This parallels findings in the psychology literature that suggest charitable values can be“inherited” by the example set by parents.
Do adults gain a habit of giving? Meer (2013) looks at alumni of a university whobecome givers—typically very small givers—directly after graduation. He forms a some-what mixed view of the giving habit.Those who begin giving right after graduation aremore likely to be givers several years later, as the fundraisers believe. However, contrastingthat, they do not appear to become more generous givers with time. Thus, the habit isformed on the extensive rather than the intensive margin.
7.5. Giving to DisastersImagine a hurricane or tsunami that causes immediate and great harm and, moreover, isintensively covered by the news. If, as conjectured earlier, empathy is an important step,how does this very emotional situation affect giving to help the victims, and does helpingduring disasters reduce other forms of giving?
Eckel, De Oliveira, and Grossman (2007) find interesting evidence of overstimulatedempathy causing a reduction in giving.When people inTexas were primed with emotion-ally moving stimuli about hurricane Katrina victims shortly after the disaster, their givingfell,while those in Minnesota,with presumably less exposure, gave more when primed.50
This effect is reminiscent of the well-known“identifiable victim”problem of ThomasSchelling (1968), and studied more recently by Loewenstein, Slovic, and colleagues.51
A single flood victim pulls at one’s heart strings, and to deal with empathic feelingsone can give. But thousands of victims present an emotionally overwhelming problemand instead, the hypothesis goes, our minds treat them as “statistical victims” in order toregulate our overwhelming empathy. More information on the depths of the disaster, inother words, can reduce giving.
The question often asked about giving during disasters is, does this giving draw dona-tions away from other charities? Systematic evidence on this is difficult to find. Anecdo-tally, charities unrelated to the disaster report drops in giving in the midst of the disaster,but only small or imperceptible effects over the longer horizon. Brown,Harris, andTaylor(2012) study donations made in 2004 and 2006 to explore the effects of the 2004 IndianOcean tsunami on donations to natural disasters. Backing up the consensus view, theyfind little evidence to suggest that donations given to support the tsunami relief effortsdivert donations away from future donations to other charitable causes.
50 Fong and Luttmer (2009) study individual reactions to the characteristics of individual victims. They found thatpotential donors who report feeling affinity for those of their own ethnic or racial group tend to give more if thevictims they see are from this group. Those who don’t express this affinity show no racial preference in giving.
51 See Jenni and Loewenstein (1997), Small and Loewenstein (2003), and Small, Loewenstein, and Slovic (2007), to namea few.

Charitable Giving 43
7.6. Giving Bundled with ConsumingWhen a for-profit company promises to give a share of its sales or profits to a charitablecause, is it because the firm has a heart? Perhaps, but it also has keen business senseaccording to McManus and Bennet (2011). In a field experiment run in collaborationwith an online store, they found that shoppers paid little attention to the details of thisbundled donation and consumption, but instead showed particularly strong preferencesfor the bundled good versus a good without the bundled donation,even though providinga donation directly to the charity and purchasing the good separately would have savedthe consumer considerable sums.
Gneezy, Gneezy, Nelson, and Brown (2010) ran a field experiment showing furtherthe large effect bundling a good with a charitable donation has on the willingness topay for the bundle. Subjects were told that they could pay any price they wished tofor a good, and that half the price would go to charity. Compared to a posted price,this “pay-what-you-want” pricing strategy created greater revenue and higher profits forthe firm, despite the fact that the posted price was available for consumers to choose inpay-what-you-want.
These results show how savvy marketers can exploit the giver’s weakness for theirown profit and, arguably, for society’s gain as well.
8. CONCLUSION
This chapter’s goals were to summarize and integrate the main contributions since thelast large survey written in 2006 and to present and discuss the themes and questions thatwe think will carry the field forward.
A fresh look at the data revealed several interesting trends in giving. First,while givinghas remained high in the US, the composition of those gifts is shifting. Individuals, whomade up about 80% of the giving dollars from 1970 to 1990, now only comprise about72%. Bequests, which were about 12% in 1970, had fallen to 8% by 2010. Corporategiving was constant at about 2% of all giving. Foundations, however, grew from about6% of all giving in the 1970s and 1980s to about 14% of donations by 2010. Part of thisshift to foundations could be for tax reasons—reductions in estate taxes may have ledpeople to give while alive in order to take deductions against income. Another reasoncould be the rapid concentration of wealth in the US over the past 20 years. This meansthat both the demographics of who gives, and the means by which they give,has changedin ways economists have yet to adequately study.
These changes are reflected in the data when it is broken down by the average house-hold giving in the postal code. Since 1990 the gap in dollars given by those in the topincome tercile and those in the low and middle terciles has exploded. This confirmsthat high income and high wealth donors are taking a larger role in the charitable sec-tor. Giving by this economic class has been difficult for economists to study, largely

44 James Andreoni and A. Abigail Payne
because of data restrictions, but should be an increasingly important focus for policyanalysis.
In addition to, or perhaps because of, the shift in the economic class of donors, thecomposition of donations has changed too. Religious giving in some countries (suchas the US) has grown far faster than most other types of giving, followed by giving toeducational institutions. Economists are only just beginning to take seriously the fact thatreligious giving may respond differently to taxation and fundraising incentives, and nowthat its dominance has become so much greater, the urgency and interest in understandingthe special nature of religious giving has grown too.
A number of other themes have become apparent in preparing this survey. First is thatinterest in fundraising has reached a fever pitch.While we see this as a healthy recognitionof reality and a powerful way for economists to use their tools of experimental analysis,econometric rigor,and theory of mechanism design in a purposeful way,we also think thattime has come to step back and ask what purpose we are serving.As public economists,ourfirst concern is to ask what does the greatest good for the greatest number. Selecting aninstitution of private philanthropy and fundraising rather than, for instance, governmentprovision and taxation, is to swap one social aggregator with its incumbent distortionsfor another. Private provision means people vote with their dollars rather than theirballots, and pay the distortionary costs of avoiding fundraisers and saying no rather thanthe distortionary costs of avoiding taxation. Explicit recognition that each institutionalform offers its own costs, benefits, and incidence is,we think, essential to moving forwardto understanding how to improve the world we inhabit. Moreover, economists shouldavoid the automatic assumption that just because a charity raises money it also raiseswelfare or affects social equity. There are many poorly understood costs and benefits ofthe charitable sector that need to be accounted for when thinking of charitable givingfrom the standpoint of welfare.
Another main lesson of this review is that asking for donations is essential to under-standing the strategic relationship between a charity and its donors, and understandingthis relationship more clearly will help both fundraisers and policy makers.
Another key next step in understanding the strategic forces in charity markets is tolook at how charities compete with each other. Here there are a number of open areas forresearch. First, when one charity gains a new donation, does another charity lose one?That is, is fundraising socially wasteful by simply moving donations among charities?Second, do the competitive forces among charities lead to innovations in fundraisingwhich rise or fall under competitive pressures? Just as competition brought us technicalinnovations with private goods,does it bring us better charitable goods,better fundraisingmechanisms, and more efficient private provision of charitable goods?
The next area that seems ripe for investigation is the effect of the Internet on therelationship between donors and the charity. Reducing donations to a few quick clicks isa dramatic reduction in transaction costs, which should increase giving, but also a severe

Charitable Giving 45
depersonalization of donation experience, which undercuts some of the key motivatorsof giving. Which effect dominates? Is Internet fundraising better for society?
A closely related topic is the role of social networks in giving. We learned that beingasked by a friend is even more powerful than being asked by a stranger, even if it is adistant friend.With the pervasiveness of social media websites, are there new frontiers forfundraising as well, or new perils?
Finally, collecting charity is just one side of the social welfare equation, and the otherside has gone virtually unstudied.That is, what is the effect of a charity on the recipientsof that charity? Does receiving food, shelter, education, a cure for cancer, comfort andrefuge, esthetic beauty, or a safe place for children to play make for a stronger, moresympathetic, and more tolerant society? Or does giving donations to private schools thatbenefit one’s own children, or to churches, synagogues, mosques that benefit one’s ownfaith, or to operas and museums that benefit one’s own class create a more segregatedworld, isolated from the needs of others, and thus tearing at the fabric of society?
We have presented a number of important and valuable findings about charity andhave issued a number of challenges as well. All is meant in the spirit of inspiring researchand encouraging a broader view of the kinds of questions economists can and should askabout giving, fundraising, and consuming charitable goods and services.
REFERENCESAbrams,B.A.,& Schmitz,M.A. (1978).The crowding out effect of government transfers on private charitable
contributions. Public Choice, 33, 29–39.Abrams,B.A.,& Schmitz,M.A. (1984).The crowding out effect of government transfers on private charitable
contributions: Cross sectional evidence. NationalTax Journal, 37, 563–568.Alesina, A., Baqir, R., & Easterly, W. (1999). Public goods and ethnic divisions. The Quarterly Journal of
Economics, 114(4), 1243–1284.Alesina, Alberto,Baqir,R.,& Hoxby,C. (2004). Political jurisdictions in heterogeneous communities. Journal
of Political Economy, 112, 348–396.Andreoni, J. (1988). Privately provided public goods in a large economy: the limits of altruism. Journal of
Public Economics, 35(1), 57–73.Andreoni, J. (1989). Giving with impure altruism: Applications to charity and Ricardian equivalence. The
Journal of Political Economy, 97(6), 1447–1458.Andreoni, J. (1990). Impure altruism and donations to public goods: A theory of warm-glow giving. The
Economic Journal, 100(401), 464–477.Andreoni, J. (1993). An experimental test of the public-goods crowding-out hypothesis. American Economic
Review, 83, 1317–1327.Andreoni, J. (1998). Toward a theory of charitable fundraising. Journal of Political Economy, 106, 1186–1213
[December].Andreoni, J. (2006a). Leadership giving in charitable fund-raising. Journal of Public EconomicTheory, 8, 1–22.Andreoni, J. (2006b). Philanthropy. In Kolm, S.-C., MercierYthier, J. (Eds.), Handbook of Giving, Reciprocity
and Altruism (pp. 1201–1269). Amsterdam: North Holland.Andreoni, J. & Bernheim, B.D. (2009). Social Image and the 50-50 Norm:ATheoretical and Experimental
Analysis of Audience Effects. Econometrica, 77(5), 1607–1636.

46 James Andreoni and A. Abigail Payne
Andreoni, J. & List, J. A. (2011). Special issue on charitable giving and fundraising, Journal of Public Economics,95.
Andreoni, J.,& McGuire,M. C. (1993). Identifying the free riders:A simple algorithm for determining whowill contribute to a public good. Journal of Public Economics, 51, 447–454.
Andreoni, J., & Miller, J. H. (2002). Giving according to GARP:An experimental test of the consistency ofpreferences for altruism, Econometrica, 70(2), 737–753.
Andreoni, J.,& Payne,A. A. (2003). Do government grants to private charities crowd out giving or fundrais-ing? American Economic Review, 93, 792–812.
Andreoni, J., & Payne,A. A. (2011a). Is crowding out due entirely to fundraising? Evidence from a panel ofcharities. Journal of Public Economics, 95(5–6), 334–343.
Andreoni, J., & Payne, A. A. (2011b). Crowding-out charitable contributions in Canada: New knowledgefrom the north. No. w17635. National Bureau of Economic Research. Cambridge, MA.
Andreoni, J., & Rao. J. (2011). The power of asking: How communication affects selfishness, empathy, andaltruism. Journal of Public Economics, 95, 513–520.
Andreoni, J., Brown, E., & Rischall, I. (2003). Charitable giving by married couples:Who decides and whydoes it matter? Journal of Human Resources, 38, 111–133.
Andreoni, Harbaugh, & Vesterlund (2008). Altruism in experiments in the new palgrave dictionary of economics(2nd ed.).
Andreoni, J., Payne,A., Smith, J. D., & Karp, D. (2011). Diversity and donations:The effect of religious andethnic diversity on charitable giving. No.w17618. National Bureau of Economic Research. Cambridge,MA.
Andreoni, J., Rao, J. M. &Trachtman, H. (2012). Avoiding the ask:A field experiment on altruism, empathy,and charitable giving. No. w17648. National Bureau of Economic Research. Cambridge, MA.
Andreoni, J., &Vesterlund, L. (2001). Which is the fair sex? Gender difference in altruism. Quarterly Journalof Economics, 116(1), 293–312.
Apinunmahakul, A., & Devlin, R. A. (2008). Social networks and private philanthropy. Journal of PublicEconomics, 92(1), 309–328.
Ariely, D., Bracha, A., & Meier S. (2009). Doing good or doing well? Image motivation and monetaryincentives in behaving prosocially. American Economic Review, 99(1), 544–555.
Bakija, J., & Heim, B. T. (2011). How does charitable giving respond to incentives and income? Newestimates from panel data. NationalTax Journal, 64(2), 615–650.
Bardsley, N. (2008). Dictator game giving:Altruism or artefact? Experimental Economics, 11(2), 122–133.Bekkers,R. H. F. P. (2008).Volunteerism. InW. A. Darity Jr (Ed.), International encyclopedia of the social sciences
(2nd ed.) (pp. 641–643). Detroit: Macmillan Reference USA.Bekkers, R., & Wiepking, P. (2011). A literature review of empirical studies of philanthropy. Nonprofit and
Voluntary Sector Quarterly, 40(5), 924–973.Bergstrom,T., Blume, L., & Varian, H. (1986). On the private provision of public goods. Journal of Public
Economics, 29(1), 25–49.Blume-Kohout,M. E. (2012). Does targeted, disease-specific public research funding influence pharmaceu-
tical innovation? Journal of Policy Analysis and Management, 31, 641–660.Bolton, G. E., & Katok, E. (1998). An experimental test of the crowding out hypothesis: The nature of
beneficent behavior. Journal of Economic Behavior and Organization, 37(3), 315–331.Borgonovi, F. (2006). Do public grants to American theatres crowd-out private donations? Public Choice,
126(3), 429–451.Bound, J., Jaeger, D. A., & Baker, R. M. (1995). Problems with instrumental variables estimation when the
correlation between the instruments and the endogenous explanatory variable is weak. Journal of theAmerican Statistical Association, 90(430), 443–450.
Bowles, S. (1998). Endogenous preferences: The cultural consequences of markets and other economicinstitutions. Journal of Economic Literature, 36(1), 75–111.
Bowles,S.,& Hwang,S.-H. (2008). Social preferences and public economics:Mechanism design when socialpreferences depend on incentives. Journal of Public Economics, 92(8–9), 1811–1820.
Bracha, A., Menietti, M., & Vesterlund, L. (2011). Seeds to succeed?: Sequential giving to public projects.Journal of Public Economics, 95(5), 416–427.

Charitable Giving 47
Breman, A. (2011). Give more tomorrow: Two field experiments on altruism and intertemporal choice.Journal of Public Economics, 95(11), 1349–1357.
Brown,S.,Harris,M. N.,&Taylor,K. (2012). Modelling charitable donations to an unexpected natural disas-ter:Evidence from the US panel study of income dynamics. Journal of Economic Behavior and Organization,84(1), 97–110.
Carpenter, J., Holmes, J., & Matthews, P. (2008). Charity auctions:A field experiment. Economic Journal, 118,92–113.
Carpenter, J., Holmes, J., & Matthews, P. H. (2010). Endogenous participation in charity auctions. Journal ofPublic Economics, 94(11–12), 921–935.
Carpenter, J., Holmes, J., & Matthews, P. H. (2011). Jumping and sniping at the silents: Does it matter forcharities? Journal of Public Economics, 95(5–6), 395–402.
Chan,K. S.,Godby,R.,Mestelman,S.,& Andrew Muller,R. (2002). Crowding-out voluntary contributionsto public goods. Journal of Economic Behavior and Organization, 48(3), 305–317.
Chao, J. C., & Swanson, N. R. (2005). Consistent estimation with a large number of weak instruments.Econometrica, 73(5), 1673–1692.
Chetty,R. (2009). Bounds on elasticities with optimization frictions:A synthesis of micro and macro evidenceon labor supply. No. w15616. National Bureau of Economic Research. Cambridge, MA.
Chetty, R., Looney,A. & Kroft, K. (2009). Salience and taxation:Theory and evidence. American EconomicReview, 99(4), 1145–1177.
Chetty, R. & Saez, E. (2013). Teaching the tax code: Earnings responses to an experiment with EITCrecipients,American Economic Journal:Applied Economics, 5(1), 1–31.
Connolly, (1997). Does external funding of academic research crowd out institutional support? Journal ofPublic Economics, 64(3), 390–406.
Corazzini, L., Faravelli, M., & Stanca, L. (2009). Royal economic society. The Economic Journal, 120(547),544–555.
Cornes,R.,& Sandler,T. (1984). The theory of public goods:non-Nash behaviour. Journal of Public Economics,23(3), 367–379.
Correa, A., & Yildirim, H. (2013). A theory of charitable fundraising with costly solicitations. AmericanEconomic Review, 103(2), 1091–1107.
Crumpler,H.,& Grossman,P. J. (2008).An experimental test of warm glow giving. Journal of Public Economics,92, 1011–1021.
Cruz, L. M., & Moreira, M. J. (2005). On the validity of econometric techniques with weak instrumentsinference on returns to education using compulsory school attendance laws. Journal of Human Resources,40(2), 393–410.
Dana, J., Cain, D. M., & Dawes, R. M. (2006).What you don’t know won’t hurt me: Costly (but quiet) exitin dictator games. Organizational Behavior and Human Decision Processes, 100(2), 193–201.
Dana, J.,Weber, R. A., & Kuang, J. X. (2007). Exploiting moral wiggle room: Experiments demonstratingan illusory preference for fairness. EconomicTheory, 33(1), 67–80.
DellaVigna, S. List, J. A., & Malmendier, U. (2012). Testing for altruism, and social pressure in charitablegiving. Quarterly Journal of Economics, 127(1), 1–56.
Diamond, P. (2006). Optimal tax treatment for private contribution for public goods with and withoutwarm glow preferences. Journal of Public Economics, 90(4–5), 897–919.
Duffy, J., Ochs, J., & Vesterlund, L. (2007). Giving little by little: Dynamic voluntary contribution games.Journal of Public Economics, 91(9), 1708–1730.
Eckel, C. C., & Grossman, P. J. (2003). Rebate versus matching: Does how we subsidize charitable contri-butions matter? Journal of Public Economics, 87(3), 681–701.
Eckel,C. C.,Grossman,P. J.,& Johnston,R. M. (2005).An experimental test of the crowding out hypothesis.Journal of Public Economics, 89(8), 1543–1560.
Eckel,C.,De Oliveira,A.,& Grossman,P. (2007). Is more information always better? An experimental studyof charitable giving and Hurricane Katrina. Southern Economic Journal, 74(2).
Engers, M., & McManus, B. (2007). Charity auctions. International Economic Review, 48(3), 953–994.Feldstein, M. S., & Clotfelter, C. (1976). Tax incentives and charitable contributions in the United States:A
microeconometric analysis. Journal of Public Economics, 5(1–2), 1–26.
48 James Andreoni and A. Abigail Payne
Feldstein, M. S., & Taylor, A. (1976). The income tax and charitable contributions. Econometrica, 44(6),1201–1222.
Fong, C. M., & Luttmer, E. F. (2009).What determines giving to Hurricane Katrina victims? Experimentalevidence on racial group loyalty. American Economic Journal:Applied Economics, 1(2), 64–87.
Fong, C. M., & Luttmer, E. F. (2011). Do fairness and race matter in generosity? Evidence from a nationallyrepresentative charity experiment. Journal of Public Economics, 95(5), 372–394.
Franzen,A., & Pointner, S. (2013). The external validity of giving in the dictator game:A field experimentusing the misdirected letter technique. Experiment Economics, 16(2), 155–169.
Gneezy,A., Gneezy, U., Nelson, L. D., & Brown,A. (2010). Shared social responsibility:A field experimentin pay-what-you-want pricing and charitable giving. Science, 329(5989), 325–327.
Goeree, J.,Holt,C.,& Gomez,R. (2002). Private costs and public benefits:Unraveling the effects of altruismand noisy behavior. Journal of Public Economics, 83(2), 257–278.
Goeree, J. K., Maasland, E., Onderstal, S., & Turner V, J. L. (2005). How (not) to raise money. Journal ofPolitical Economy, 113(4), 897–926.
Goldin C & Katz, L.F. (1999). The Shaping of higher education:The formative years in the United States,1890–1940. Journal of Economic Perspectives,American Economic Association, 13(1), 37–62 [Winter].
Goldin, J., & Listokin,Y., (2012),Tax expenditure salience. In 7th annual conference on empirical legal studiespaper.
Gruber, J., & Hungerman, D.M., (2007). Faith-based charity and crowd-out during the great depression.Journal of Public Economics, 91(5), 1043–1069.
Harbaugh,W. T., Mayr, U., & Burghart, D. R. (2007). Neural responses to taxation and voluntary givingreveal motives for charitable donations. Science, 316(5831), 1622–1625.
Huck, S., & Rasul, I. (2010). Transactions costs in charitable giving: Evidence from two field experiments.The BE Journal of Economic Analysis and Policy, 10(1),Article 1.
Huck,S.,& Rasul, I. (2011). Matched fundraising:Evidence from a natural field experiment. Journal of PublicEconomics, 95(5), 351–362.
Hungerman,D. M. (2005). Are church and state substitutes? Evidence from the 1996 welfare reform. Journalof Public Economics, 89(11), 2245–2267.
Hungerman, D. M. (2008). Race and charitable church activity. Economic Inquiry, 46, 380–400.Hungerman, D. M. (2009). Crowd-out and diversity. Journal of Public Economics, 93(5), 729–740.Jackson &Yariv (unpublished). Collective dynamic choice: The necessity of time inconsistency. unpublished.Jack, A. I., Dawson, A. J., Begany, K. L., Leckie, R. L., Barry, K. P., Ciccia, A. H., & Snyder, A. Z.
(2013). fMRI reveals reciprocal inhibition between social and physical cognitive domains. Neurolmage,66, 385–401.
Jenni, K. E., & Loewenstein, G. (1997). Explaining the ”identifiable victim effect.” Journal of Risk andUncertainty, 14(3), 235–257.
Karlan, D., & List, J. A. (2007). Does price matter in charitable giving? Evidence from a large-scale naturalfield experiment.The American Economic Review, 97(5), 1774–1793.
Karlan, D., List, J. A., & Shafir, E. (2011). Small matches and charitable giving: Evidence from a natural fieldexperiment. Journal of Public Economics, 95(5–6), 344–350.
Khanna, J., Posnett, J., & Sandler,T. (1995). Charity donations in the UK: New evidence based on paneldata. Journal of Public Economics, 56, 257–272.
Kingma, B. R. (1989). An accurate measurement of the crowd-out effect, income effect, and price effect forcharitable contributions. Journal of Political Economy, 97, 1197–1207.
Konow, J. (2010). Mixed feelings: Theories of and evidence on giving. Journal of Public Economics, 94(3),279–297.
Lazear,E.,Malmendier,U.,&Weber,R. (2012). Sorting in experiments with application to social preferences.American Economic Journal:Applied Economics, 4(1), 136–163.
Li, S. X., Eckel, C. C., Grossman, P. J., & Brown,T. L. (2011). Giving to government: Voluntary taxation inthe lab. Journal of Public Economics, 95(9), 1190–1201.
List, J. A. (2007). On the interpretation of giving in dictator games. Journal of Political Economy,115, 482–493.List, J. A. (2011). The market for charitable giving.The Journal of Economic Perspectives, 25(2), 157–180.List, J. A., & Lucking-Reiley, D. (2002).The effects of seed money and refunds on charitable giving: Exper-
imental evidence from a university capital campaign. Journal of Political Economy, 110(1), 215–233.

Charitable Giving 49
Manzoor, S. H.,& Straub, J. D. (2005).The robustness of Kingma’s crowd-out evidence:Evidence from newdata on contributions to public radio. Public Choice, 123, 463–476.
Marx,L. M.,& Matthews,S. (2000). Dynamic voluntary contribution to a public project. Review of EconomicStudies, 67(2), 327–358.
Masatlioglu,Y., Nakajima, D., & Ozbay, E. Y. (2012). Revealed attention. The American Economic Review,102(5), 2183–2205.
McManus, B., & Bennet, R. (2011). The demand for products linked to public goods: Evidence from anonline field experiment. Journal of Public Economics, 95(5), 403–415.
Meer, J. (2011). Brother, can you spare a dime? Peer pressure in charitable solicitation. Journal of PublicEconomics, 95(7), 926–941.
Meer, Jonathan (2013). The habit of giving, economic inquiry. http://dx.doi.org/10.1111/ecin.12010.Meer, J., & Rosen, H. S. (2010). Family bonding with universities. Research in Higher Education, 51(7),
641–658.Meer, J., & Rosen, H. S. (2011). The ABCs of charitable solicitation. Journal of Public Economics, 95(5),
363–371.Mellström, C., & Johannesson, M. (2008). Crowding out in blood donation:Was Titmuss right? Journal of
the European Economic Association, 6(4), 845–863.Morgan, J. (2000). Financing public goods by means of lotteries. Review of Economic Studies, 67(4), 761–784.Morgan, J., & Sefton, M. (2000). Funding public goods with lotteries: Experimental evidence. The Review
of Economic Studies, 67(4), 785–810.Okten, C., & Weisbrod, B. A. (2000). Determinants of donations in private nonprofit markets. Journal of
Public Economics, 75, 255–272.Palfrey,T. R., & Prisbrey, J. E. (1997). Anomalous behavior in public goods experiments: How much and
why? American Economic Review, 87(5), 829-846.Payne,A. A. (1998). Does the government crowd-out private donations? New evidence from a sample of
non-profit firms. Journal of Public Economics, 69, 323–345.Payne, A. A. (2001). Measuring the effect of federal research funding on private donations at research
universities: is federal research funding more than a substitute for private donations? InternationalTax andPublic Finance, 8, 731–751.
Poterba, J. (1997).The estate tax and after-tax investment returns. No.w6337. National Bureau of EconomicResearch. Cambridge, MA.
Potters, J., Sefton, M., &Vesterlund, L. (2007). Leading-by-example and signaling in voluntary contributiongames:An experimental study. EconomicTheory, 33(1), 169–182.
Ribar, D. C., & Wilhelm, M. O. (2002). Altruistic and joy-of-giving motivations in charitable behavior.Journal of Political Economy, 110, 425–457.
Rose-Ackerman, S. (1982). Charitable giving and excessive fund-raising. Quarterly Journal of Economics, 97,193–212.
Rose-Ackerman, S. (1996). Altruism, nonprofits, and economic theory. Journal of Economic Literature, 34(2),701–728.
Scharf, K., & Smith, S. (2010). The price elasticity of charitable giving: Does the form of tax relief matter?IFS Working Papers W10/07. Institute for Fiscal Studies.
Schelling,T. C. (1960).The strategy of conflict. Cambridge Massachusetts: Harvard University Press.Schelling, T. C. (1968). The life you save may be your own. Problems in Public Expenditure Analysis, 127,
129–30.Schiff, J. (1985). Does government spending crowd out charitable contributions? National Tax Journal, 38,
535–546.Schiff, J., & Weisbrod, B. A. (1991). Competition between for-profit and nonprofit organizations in com-
mercial markets. Annals of Public and Cooperative Economics, 62(4), 619–40.Schram,A. J., & Onderstal, S. (2009). Bidding to give:An experimental comparison of auctions for charity.
International Economic Review, 50(2), 431–457.Shang, J., & Croson, R. (2009). A field experiment in charitable contribution: The impact of social infor-
mation on the voluntary provision of public goods.The Economic Journal, 119(540), 1422–1439.Small, D., & Loewenstein, G. (2003). Helping a victim or helping the victim: Altruism and identifiability.
Journal of Risk and Uncertainty, 26(1), 5–16.

50 James Andreoni and A. Abigail Payne
Small, D., Loewenstein, G., & Slovic, P. (2007). Sympathy and callousness: The impact of deliberativethought on donations to identifiable and statistical victims. Organizational Behavior and Human Deci-sion Process, 102(2), 143–153.
Steinberg, R. (1987). Voluntary donations and public expenditures in a federal system. American EconomicReview, 77(1), 24–36.
Thaler, R.H., & Benartzi, S. (2004). Save more tomorrowTM: Using behavioral economics to increaseemployee saving. Journal of political Economy, 112(S1), S164–S187.
Titmuss, R. (1970).The gift relationship: From human blood to social policy. London:Allen & Unwin.Tonin, M., & Vlassopoulos, M. (2010). Disentangling the sources of pro-socially motivated effort: A field
experiment. Journal of Public Economics, 94(11), 1086–1092.Vesterlund, L. D. (2003). The informational value of sequential fund-raising. Journal of Public Economics, 87,
627–657.Vesterlund, L. (2006). Why do people give? In R. Steinberg & W. W. Powell (Eds.),The nonprofit sector (2nd
ed.).Yale Press.Vigdor, J.L. (2002). Locations, outcomes, and selective migration. Review of Economics and Statistics, 84(4),
751–755.Vigdor, J. L. (2004). Community composition and collective action:Analyzing initial mail response to the
2000 census. Review of Economics and Statistics, 86(1), 303–312.Weisbrod, B.A. (1991).The nonprofit economy. Cambridge Massachusetts: Harvard University Press.Wiepking, P., & Bekkers, R. (2010). Does who decides really matter? Causes and consequences of personal
financial management in the case of larger and structural charitable donations. Voluntas: InternationalJournal ofVoluntary and Nonprofit Organizations, 21(2), 240–263.
Wiepking,P.,& Bekkers,R. H. F. P. (2012).Who gives? A literature review of predictors of charitable giving.Part two: Gender, marital status, income, and wealth.Voluntary Sector Review, 3(2), 217–245.
Wilhelm, M. O., Brown, E., Rooney, P. M., & Steinberg, R. (2008). The intergenerational transmission ofgenerosity. Journal of Public Economics, 92(10), 2146–2156.
Yörük, B. K. (2010). Charitable giving by married couples revisited. Journal of Human Resources, 45(2),497–516.