chapter 8: the general circulation of the atmosphere · 5. summary 6. take home message ... global...
TRANSCRIPT

GEF 1100 – Klimasystemet
Chapter 8: The general circulation of the atmosphere
1
GEF1100–Autumn 2016 04.10.2016
Prof. Dr. Kirstin Krüger (MetOs, UiO)

1. Motivation
2. Observed circulation* 2.1 The tropical Hadley circulation 2.2 The Intertropical Convergence Zone (ITCZ)* 2.3 The monsoon circulation
3. Mechanistic view of the circulation 3.1 The tropical Hadley circulation 3.2 The extratropical circulation
4. Large-scale atmospheric energy and momentum budget
5. Summary
6. Take home message
Lect
ure
Ou
tlin
e –
Ch
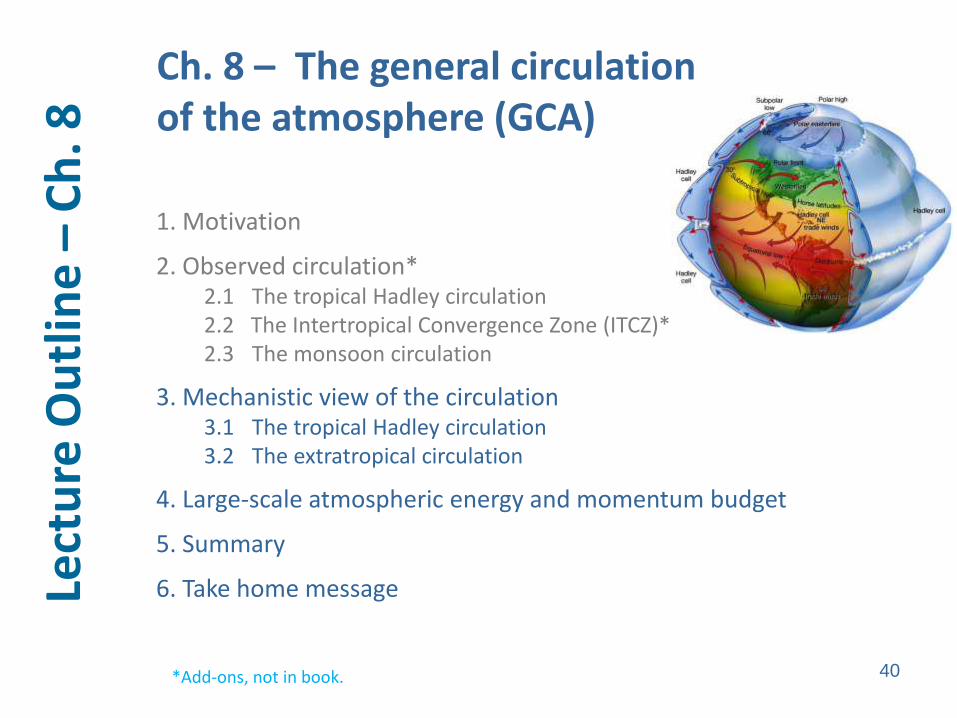
. 8 Ch. 8 – The general circulation
of the atmosphere (GCA)
2 *Add-ons, not in book.

Motivation 1. Motivation
Marshall and Plumb (2008) 3
• Early days: Discovery of the earth (with sailing boats) • Understanding of the GCA (see photo) • Application of Chapters 5-7
Ch. 5-7
Fram vessel

4 Marshall and Plumb (2008)
x x Oslo
1. Motivation

5
Marshall and Plumb (2008)
x x Oslo
Sea level pressure
(SLP) [mb]
Zonal wind
[m/s]
Meridional wind
[m/s]
1. Motivation

The general circulation of the atmosphere
The general circulation describes the total of all large-scale air movements on earth.
General circulation = horizontal + vertical circulation circulation
6
2. Observed circulation

Atmospheric circulation – scales
Microscale • Size: meters • Time: seconds
Mesoscale • Size: kilometres • Time: minutes to hours
Macroscale Synoptic • Size: 100s to 1000s kilometres • Time: days
Global (planetary) • Size: Global • Time: Days to weeks
7
2. Observed circulation
Super typhoon Chaba 04.10.16

Recap Chapter 5
Surplus of radiation balance in the tropics and deficit in the polar regions!
1.
2.
Poleward energy transport
3. 4.
Horizontal temperature gradient > by hydrostatic balance > horizontal pressure gradient “P” balanced by Coriolis force “C” > geostrophic balance> westerly wind (U>0) Marshall and Plumb (2008) 8
~6 PW are missing

Kinetic energy of the atmosphere – general circulation
The horizontal difference in temperature between the tropical heat- excessive areas and the polar heat-deficient areas are directly or indirectly responsible for 98% of the atmospheric kinetic energy.
The horizontal wind field of the synoptic disturbances and the eddies contain the largest part of this kinetic energy.
The air movements triggered by convective activity (Chapter 4) supply the remaining share of the atmospheric energy (2%).
9
2. Observed circulation

Energy and angular momentum budget
Marshall and Plumb (2008) 10
2. Observed circulation

11

2. Observed circulation
Marshall and Plumb (2008) 12
General circulation of the atmosphere (GCA)

GCA – horizontal and vertical flow
13
Arctic katabatic winds
quasi-meridional circulation
(Ferrel cell)
northern
Hadley cell
southern
Hadley cell
quasi-meridional circulation
Antarctic katabatic winds
Polar High
circumpolar easterlies
Polar High
circumpolar easterlies
subpolar low pressure channel
subpolar low pressure channel
Polar front
Westerly wind drift
Polar front
Westerly wind drift
subtropical high pressure
zone
subtropical high pressure
zone
northeastern trades
southeastern trades
intertropical convergence
equatorial counter flow
2. Observed circulation
T:= Low pressure; High pressure

www.enso.info
14
GCA: vertical-meridional flow
2. Observed circulation

Thermal direct circulation
Thermally direct circulation: a circulation, in which warm air rises and cold air sinks, with available potential energy transforming into kinetic energy. Thermally indirect circulation: opposite case.
Note: The Hadley circulation in the tropics is thermally direct. The Ferrel circulation (middle latitudes) is thermally indirect.
thermally direct thermally indirect
15
warm warm cold cold
2. Observed circulation

Hadley circulation - summary
History: Hadley suggested one meridional cell with rising in the tropics and descend over the Pole, the Hadley Cell, in 1735. - Circulation symmetrical to the equator, - meridional overturning circulation in the tropics, - zonal components (easterlies in the lower troposphere, westerlies in the upper troposphere) due to the earth’s rotation, - large regionally and seasonally variations.
16
Recap see also Ch. 5

Hadley cell’s seasonal cycle (see also Fig. 5.21)
Roedel, 1997 17
Northern winter/
Southern summer
Northern spring
(Mar-May)
Recap see also Ch. 5

18
ITCZ: InterTropical Convergence Zone
ITCZ:
Intertropical Convergence Zone
2. Observed circulation

The area of the ITCZ lies in a band of warm sea water and the equatorial dry zone, a narrow band where cold upwelling water from deeper layers in the ocean reaches the surface.
Land masses on the respective summer hemisphere are warmer than the adjacent oceans. In winter the land masses are colder than the ocean.
The climatological precipitation and vertical movements in the atmosphere are closely linked.
On average over a longer time period air rises over moisture areas and sinks over dry areas.
Circulation patterns in the tropics are in the mean characterized by ascending warm air and descending cold air, which means it is primarily a thermally driven circulation.
Development of the ITCZ thermally induced in the tropics
19
2. Observed circulation

20
ITCZ
cold
dry cold
dry
thermally direct cell
warm cold
warm
moist
High
Low
Tropopause
2. Observed circulation
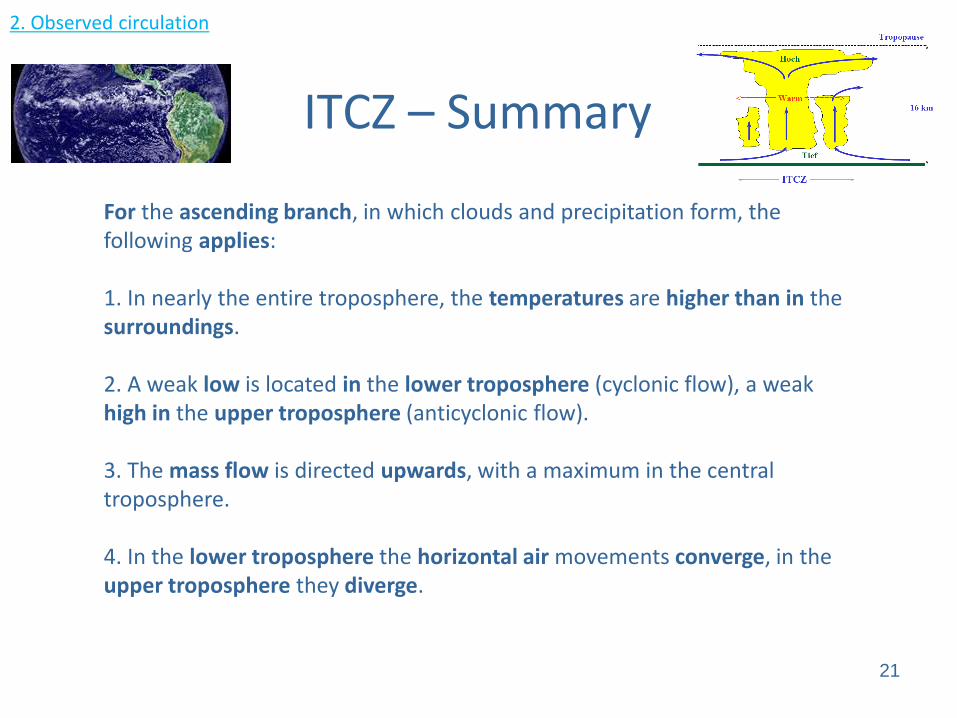
For the ascending branch, in which clouds and precipitation form, the following applies: 1. In nearly the entire troposphere, the temperatures are higher than in the surroundings. 2. A weak low is located in the lower troposphere (cyclonic flow), a weak high in the upper troposphere (anticyclonic flow). 3. The mass flow is directed upwards, with a maximum in the central troposphere. 4. In the lower troposphere the horizontal air movements converge, in the upper troposphere they diverge.
ITCZ – Summary
21
2. Observed circulation

2. Observed circulation
22
www.yr.no/satellitt
ITCZ: October 04, 2016, 07:00 CEST
CEST: Central European Summer Time
Equator

TransBrom SONNE cruise Oct 2009
Cruise and tropical cyclones tracks
Krüger and Quack, 2013 ACP
Melor

TransBrom SONNE cruise Oct 2009
Average surface wind speed and direction
Krüger and Quack, 2013 ACP
Tomakomai/Japan Townsville/ Australia

TransBrom SONNE cruise Oct 2009
In the tropical West Pacific a double ITCZ was observed.
25
20
5
30
0
Alt
itu
de
(km
)
10
15 (%)
__ Cold Point Tropopause
--- Lapse Rate Tropopause
Cirrus detected by COBALD
Relative Humidity (%)
Tomakomai/Japan Townsville/ Australia

29
ITCZ – Atmosphere-Ocean Interactions
Schneider et al (Nature, 2014)
Atmospheric circulation
(Hadley circulation)
Energy flux (poleward)
Surface Easterly winds
Ocean circulation (warm/cold)
Equatorial oceanic upwelling
connected with the ITCZ.
2. Observed circulation

Upper figure: 1985–2004 Global Precipitation Climatology Project (Hwang and Frierson, 2013). Lower figure: Tropical Rainfall Measuring Mission Multisatellite Precipitation Analysis for 1998–2012; and surface wind are for ERA-I, position of the ITCZ (Schneider et al 2014).
ITCZ and precipitation: annual mean 2. Observed circulation

Annual mean precipitation, 1985–2004 from (A) the Global Precipitation Climatology Project
(GPCP), version 2.1, (C) Shortwave cloud radiative forcing from satellite observations [Cloud
and the Earth’s Radiant Energy System (CERES)], 2001–2010.
Hwang, and Frierson (PNAS 2013)
ITCZ – precipitation – radiation
2. Observed circulation
Precipitation Short wave cloud radiative forcing

Seasonal course of ITCZ
Roedel, 1997
Northern summer Northern winter
32
2. Observed circulation
Figure: Surface winds and position of the ITCZ (after Lamb (1972) and Gross (1972)).
0̊ E
EQ
0̊ E

33 Schneider et al (Nature, 2014)
2. Observed circulation
Seasonal migration of the ITCZ
Pacific(160 ̊ E–100 ̊ W)
Precipitation ITCZ Surface winds
Indian Ocean (65 ̊ E–95 ̊ E)

Monsoon circulation arabic ‘mawsim’ = season
Ruddiman, 2001
34
Summer
Winter
2. Observed circulation

Monsoon systems
www.meted.ucar.edu 35
OLR: Outgoing longwave radiation

Indian monsoon circulation
Seasonal variations and horizontal asymmetries
36
2. Observed circulation

• Energy and momentum budgets demands on the General Circulation of the Atmosphere.
• Observed atmospheric winds and major climate zones reveal distinct temporal and horizontal variations
(i.e., Hadley cell, ITCZ, monsoon circulation).
Take home message
38

GEF 1100 – Klimasystemet
Chapter 8: The general circulation of the atmosphere
39
GEF1100–Autumn 2016 06.10.2016
Prof. Dr. Kirstin Krüger (MetOs, UiO)
1. Motivation
2. Observed circulation* 2.1 The tropical Hadley circulation 2.2 The Intertropical Convergence Zone (ITCZ)* 2.3 The monsoon circulation
3. Mechanistic view of the circulation 3.1 The tropical Hadley circulation 3.2 The extratropical circulation
4. Large-scale atmospheric energy and momentum budget
5. Summary
6. Take home message
Lect
ure
Ou
tlin
e –
Ch
. 8 Ch. 8 – The general circulation
of the atmosphere (GCA)
40 *Add-ons, not in book.
3. Mechanistic view of the circulation
41
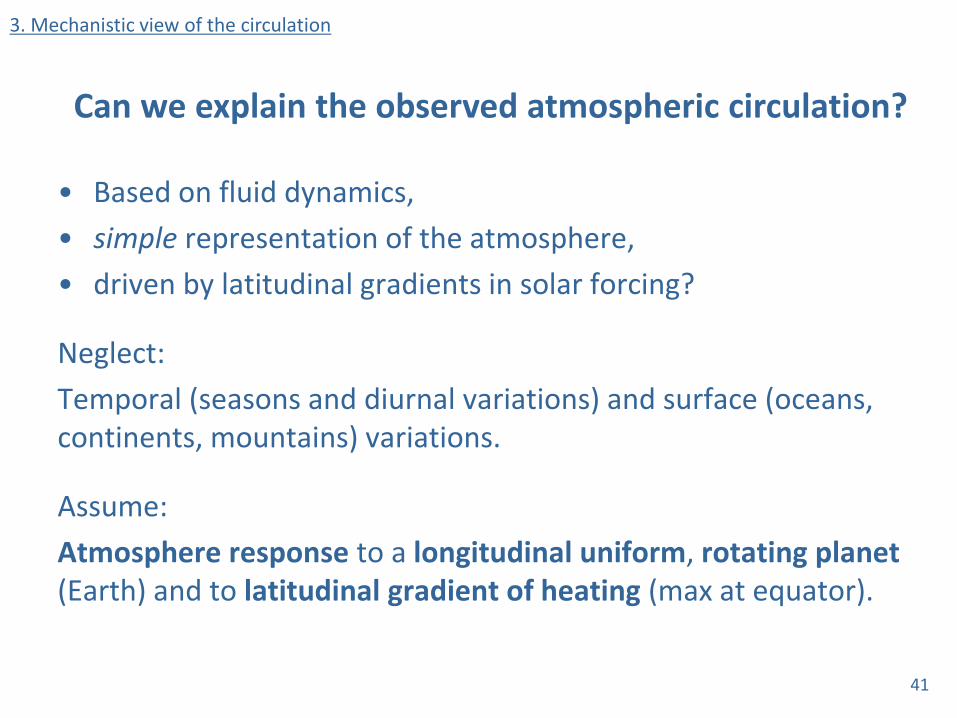
Can we explain the observed atmospheric circulation?
• Based on fluid dynamics,
• simple representation of the atmosphere,
• driven by latitudinal gradients in solar forcing?
Neglect:
Temporal (seasons and diurnal variations) and surface (oceans, continents, mountains) variations.
Assume:
Atmosphere response to a longitudinal uniform, rotating planet (Earth) and to latitudinal gradient of heating (max at equator).

Effect of the rotating earth
• If the earth didn’t rotate, we would have a single-cell circulation in each hemisphere.
• But because in reality earth follows a movement on a
rotating sphere, a three cell circulation in each hemisphere
develops:
- Polar cell
- Ferrel cell
- Hadley cell
42
3. Mechanistic view of the circulation

3. Mechanistic view of the circulation
Marshall and Plumb (2008) 43

• develops because of the conservation of angular momentum
Subtropical jet
44
3. Mechanistic view of the circulation

3. Mechanistic view of the circulation
Marshall and Plumb (2008)
Hadley circulation - NH
45

46
Marshall and Plumb, 2007
Hadley circulation schematic
3. Mechanistic view of the circulation

3. Mechanistic view of the circulation
Extratropical circulation – Baroclinic instability
47
• Strong horizontal temperature gradient in mid-latitudes implies:
- westerly wind increase with height (thermal wind balance Eq. 7-24)
- pressure horizontal gradients and by geostrophic balance > weak
meridional circulation.
But:
• Poleward heat transport required to balance energy budget, but how if Hadley Cell transport heat only up to subtropics?
• Daily observations tell us strong zonal asymmetries (low and high pressure systems)
⟶Thus the axisymmetric model can only partly be correct.
⟶Mid-latitudes is full of eddies (weather systems).

3. Mechanistic view of the circulation
Extratropical circulation – Baroclinic instability Break-down of thermal wind by baroclinic* instabilities:
•Due to the faster rotation rate (greater f) in mid-latitudes eddies (wave like structures) develop.
Marshall and Plumb (2008) 48 Baroclinic flow: 𝜌=𝜌(p,T)
Barotropic flow: 𝜌=𝜌(p)

3. Mechanistic view of the circulation
Extratropical circulation – baroclinic instability
Mid-latitude weather systems:
• Eddies “stir” the atmosphere.
• Eddies carry cold/warm air equatorward/ poleward > meridional heat transport.
49 Marshall and Plumb (2008)

50
Bjerknes and Solberg (1922)
Jacob Bjerknes
1897-1975
3. Mechanistic view of the circulation
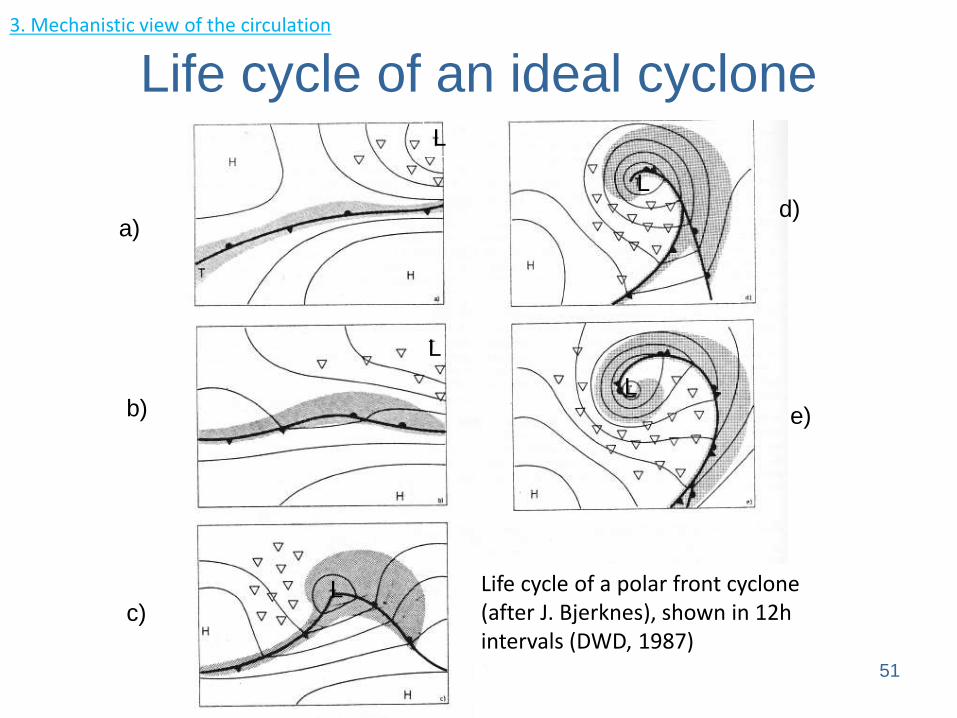
Life cycle of an ideal cyclone
51
a)
b)
c)
d)
e)
L
L
L
L
L
Life cycle of a polar front cyclone (after J. Bjerknes), shown in 12h intervals (DWD, 1987)
3. Mechanistic view of the circulation
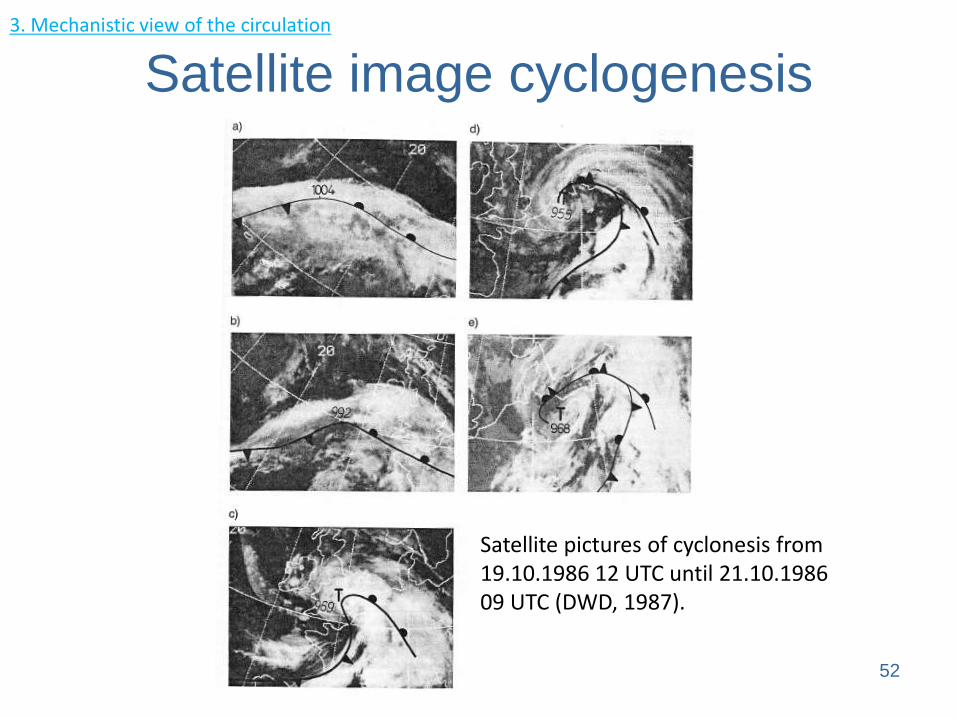
Satellite image cyclogenesis
52
Satellite pictures of cyclonesis from 19.10.1986 12 UTC until 21.10.1986 09 UTC (DWD, 1987).
3. Mechanistic view of the circulation

Polar jet and polar front
53
Dotted isotachs marked every 10 ms-1 (from 10 to 80 ms-1) show the jet in thermal wind balance with the temperature field. Dashed lines are isotherms marked every 10ºC (from 10 to -70ºC). (Palmén and Newton, 1969)
N S
polar front
polar jet
3. Mechanistic view of the circulation

54
Polar jet
3. Mechanistic view of the circulation

55
Add-ons
Today’s sea level pressure (hPa)
ECMWF model: Thursday 06.10.2016 00 UTC (02 LT)
• Oslo
www.wetteronline.de

56
Today’s polar jet: wind (kn) and Geopotential (gpdm) at 300 hPa
ECMWF model: Thursday 06.10.2016 00 UTC (02 LT)
L
H
L
L
H
www.wetteronline.de
Quiz: Where is the polar jet located over Europe/North Atlantic?
• Oslo

57
Quiz: Which wind is observed over Oslo today?
Today‘s weather map (14:00 LT): Norway and Europe
www.yr.no
www.dwd.de

4. Large-scale atmospheric energy and momentum budget
Large-scale atmospheric energy budget
Energy transport:
1. Conversion of potential energy (from solar heating) into kinetic energy > upward heat transport
2. Poleward transport of heat from low to high latitudes > balancing the radiative budget
Marshall and Plumb (2008) 59
y
z

Energy transport
60
4. Large-scale atmospheric energy and momentum budget
dry static energy
latent heat
kinetic energy density
moist static energy
Northward energy flux?
Consider northward energy E at latitude 𝜑, across atmospheric area dA with height dz and longitudinal width d𝜆 (dA= a cos𝜑d𝜆 dz).
• 𝐸 = 𝑐𝑝𝑇 + g𝑧 + 𝐿𝑞 + 1
2𝒖 ∙ 𝒖 (Eq. 8-14)
• Net northward energy flux for dA is: ℋ 𝑎𝑡𝑚𝑜𝑠 = 𝜌𝑣𝐸 𝑑𝐴
= 𝑎 cos𝜑 𝜌𝑣𝐸 𝑑𝑧 𝑑𝜆∞
0
2𝜋
0
=𝑎
gcos𝜑 𝑣𝐸 𝑑𝑝 𝑑𝜆
𝑝𝑠
0
2𝜋
0 (Eq. 8-15)
a: Earth radius, E: Energy, cp: specific heat at constant pressure p, T: temperature, g: gravity acceleration, L: latent heat, q: humidity, u: velocity, v: meridional velocity, ℋ𝑎𝑡𝑚𝑜𝑠: net northward energy flux, ps: surface pressure
- northward mass flux: 𝜌𝑣 𝑑𝐴 - northward energy flux: 𝜌𝑣𝐸 𝑑𝐴
- replace 𝜌dz by -dp/g (hydrostatic balance)

Energy transport in tropics
61
4. Large-scale atmospheric energy and momentum budget
Marshall and Plumb (2008)
*Petawatt (PW) 1015 watts W= J/s = N∙m/s = kg m2/s3
• Kinetic energy term (<1 %) can be neglected in Eq. 8.14
• ऒ𝜆𝑡𝑟𝑜𝑝𝑖𝑐𝑠 =
2𝜋𝑎
gcos𝜑 𝑣 𝑐𝑝𝑇 + g𝑧 + 𝐿𝑞 𝑑𝑝
𝑝𝑠
0 (Eq. 8-16)
• In the net annually average, the energy flux by Hadley cell is weakly poleward.
• Ocean heat transport exceeds atmosphere in the tropics (see also Chapter 11).

Energy transport in mid-latitudes
62
4. Large-scale atmospheric energy and momentum budget
Marshall and Plumb (2008)
Transport by mid-latitude eddies:
• Northward heat flux to consider order of magnitude estimate of the net energy flux:
ऒ𝜆𝑚𝑖𝑑𝑙𝑎𝑡~2𝜋𝑎𝑐
𝑝
gcos𝜑 𝑝𝑠 𝑣 𝑇 (PP. 155)
⟹ऒ𝜆𝑚𝑖𝑑𝑙𝑎𝑡~8 PW
• Radiative imbalance: ~6 PW (Chapter 5)
a= 6371 km, cp= 1005 J kg-1 K-1, g = 9.81 ms-2, ps ≃105 Pa, [v45°] ≃ 10 m/s, [T45°] ≃ 3 K, Petawatt (PW) = 1015 Watts

4. Large-scale atmospheric energy and momentum budget
Trenberth and Caron (2001)
Northward heat transport (PW*)
*Petawatt (PW) 1015 Watts W= J/s = N∙m/s = kg m2/s3 63

Momentum transport
64
4. Large-scale atmospheric energy and momentum budget
Marshall and Plumb (2008)
by atmosphere
y
z
Eq NP

4. Large-scale atmospheric energy and momentum budget
Marshall and Plumb (2008) 65
Tropics: Net export of westerly momentum out of low latitudes must be balanced by supply of momentum into this region ⟹ surface winds must be easterly (Hadley circulation).
Mid-latitudes: Loss of momentum from the atmosphere to the surface (eq. due to drag on near surface Westerlies) must be balanced by supply of poleward transport of westerly momentum via eddies; ⟶ shift of low latitudes westerlies to mid-latitudes.
Momentum transport
circular banana-shape eddies eddies

5. Summary - simple representation of the atmosphere
Marshall and Plumb (2008) 66

Deviations from simple GCA
Seasonal variations and horizontal asymmetries:
Tropics:
e.g. Monsoon, Hadley circulation and
ITCZ vary seasonally and horizontally
Mid- and high latitudes:
e.g. storms/ jet streams maximize
during winter
67
5. Summary
Indian monsoon
Jet streams

www.wissenschaft-online.de
GCA – more complex
68
Arctic katabatic winds
quasi-meridional circulation
(Ferrel cell)
northern
Hadley cell
southern
Hadley cell
quasi-meridional circulation
Antarctic katabatic winds
Polar High
circumpolar easterlies
Polar High
circumpolar easterlies
subpolar low pressure channel
subpolar low pressure channel
Polarfront
Westwinddrift
Polarfront
Westwinddrift
subtropical high pressure
zone
subtropical high pressure
zone
northeastern trades
southeastern trades
intertropical convergence
equatorial counter flow
5. Summary

www.enso.info
69
5. Summary
GCA: vertical-meridional flow

• Energy and momentum budgets demands on the GCA.
• Observed atmospheric winds and major climate zones can be explained by dynamic atmosphere on a longitudinal uniform, rotating Earth with latitudinal gradient of solar heating.
• However, distinct deviations on temporal and horizontally variations exist (i.e., Hadley cell, ITCZ, Asian monsoon).
• Geostrophic, hydrostatic and thermal wind balances together
with conservation of angular momentum explain most of the observed wind patterns.
Take home message
70

71
Quiz
What is the polar jet? a) The maximum Westerly wind in the polar stratosphere. b) The maximum wind in the subtropical upper troposphere. c) The maximum W wind band in the upper troposphere meandering at high latitudes. d) The maximum E wind in the summer upper mesosphere.

73
Quiz: Where lies the polar jet? Where lies the ITCZ?
www.dwd.de
Today‘s satellite map - Globe
x Oslo
x

Weather forecast for tomorrow
78
www.dwd.de
Add-ons
www.yr.no

Cyclone passage - weather
79 DWD 1987
L
C C
Air pressure
Visibility: good poor moderate poor good
W
Add-ons