chapter 8: macon - dnr · chapter 8: macon community profile much of the solid waste in northem...
TRANSCRIPT

Chapter 8: Macon
COMMUNITY PROFILE
Much of the solid waste in Northem Missouri is taken to Teter's lanW in Macon, Missouri.
This lanW accepts waste from Kirksville, in Adair County (District C); Chariton, Putnam, and
Linn Counties (District B), Howard County (District H), and all the counties in the Mark Twain
Solid Waste Management District ( District G) Much of the waste sampled at this location
originated in Macon County and Adair County.
The principal industry m the area is agri-business. Tourism is important m the Mark Twain lake
area and in the City of Hannibal. K i r M e is the home of Northeast Missouri State University
and have a strong retail and service sector.
Teeters landfill is located on a county road 3 miles south of highway 36. It is 150 miles northeast
of Kansas City, 178 miles northwest of St. Louis, and 221 miles north of Springfield.
Area (sq. miles) Population (1992) Density (per sq. mile) Pop. Change since 1980 Number of households Perso~w per household High school graduates Median Family Income Percent below poverty level
Maeon County 804
15,030 19
-7.9% 6,160 2.44
70.3% $24,370
24.9%
Adair County 568
24,407 43
-1.9% 9060 2.35
74.3% $25,447
14.4%
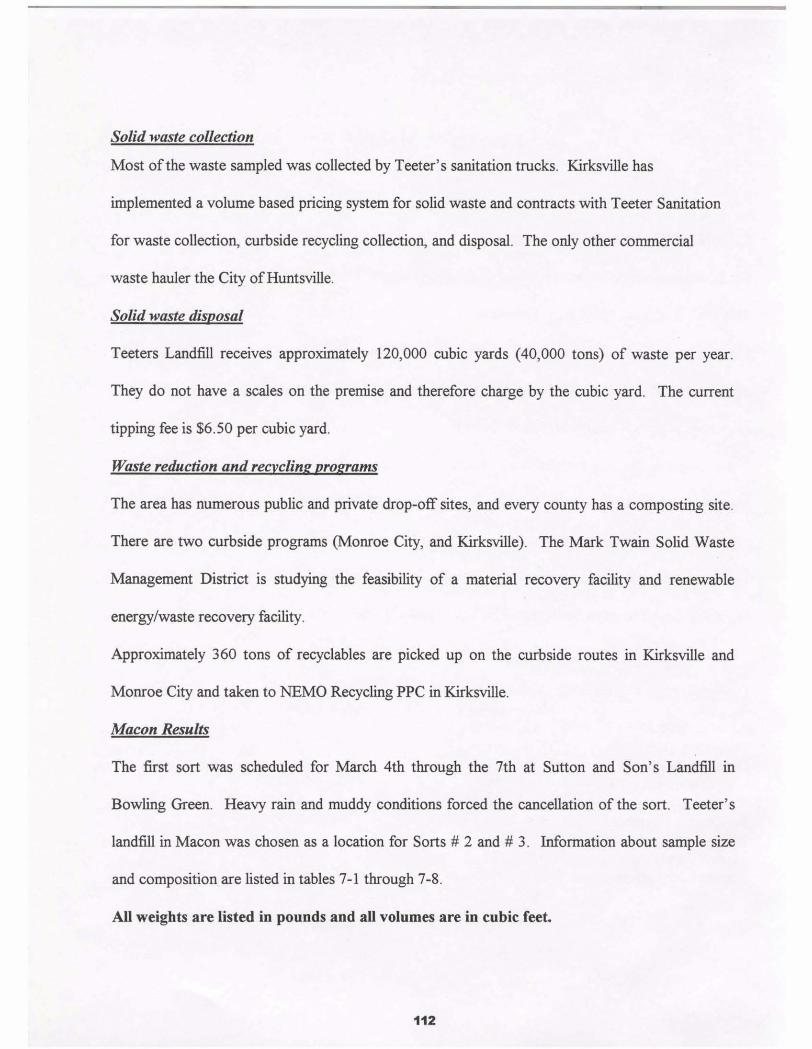
Solid waste coIlection
Most of the waste sampled was collected by Teeter's sanitation trucks. K i r M e has
implemented a volume based pricing system for solid waste and contracts with Teeter Sanitation
for waste collection, curbside recycling collection, and disposal. The only other commercial
waste hauler the City of HuntsvilIe.
solid wade disuosal
Teeters Landfill receives approximately 120,000 cubic yards (40,000 tons) of waste per year.
They do not have a scales on the premise and therefore charge by the cubic yard. The current
tipping fee is $6.50 per cubic yard.
Waste reduction andr~cyclin~ mo~ramr
The area has numerous public and private drop-off sites, and every county has a cornposting site.
There are two curbside programs (Monroe City, and Kirksville). The Mark Twain Solid Waste
Management District is studying the feasibility of a material recovery M t y and renewable
energylwaste recovery Wty.
Approximately 360 tons of recyclables are picked up on the curbside routes in Kirksville and
Monroe City and taken to NEMO RecycIing PPC in KirksviIIe.
Macon Remlis
The first sort was scheduled for March 4th through the 7th at Sutton and Son's Landill in
Bowling Green. Heavy rain and muddy conditions forced the cancewon of the sort. Teeter's
landill in Macon was chosen as a location for Sorts # 2 and # 3. Information about sample size
and composition are listed in tables 7-1 through 7-8.
All weights are listed in pounds and all volumes are in cubic feet.

SORT # 2
sort Conditions
The remaining two sorts were scheduled at Teter's Landfill in Macon. The second sort was
conducted on June 10th through the 12th. The sort facility was set up in a grassy area across
from the main administrative building. Weather conditions were misty and overcast.
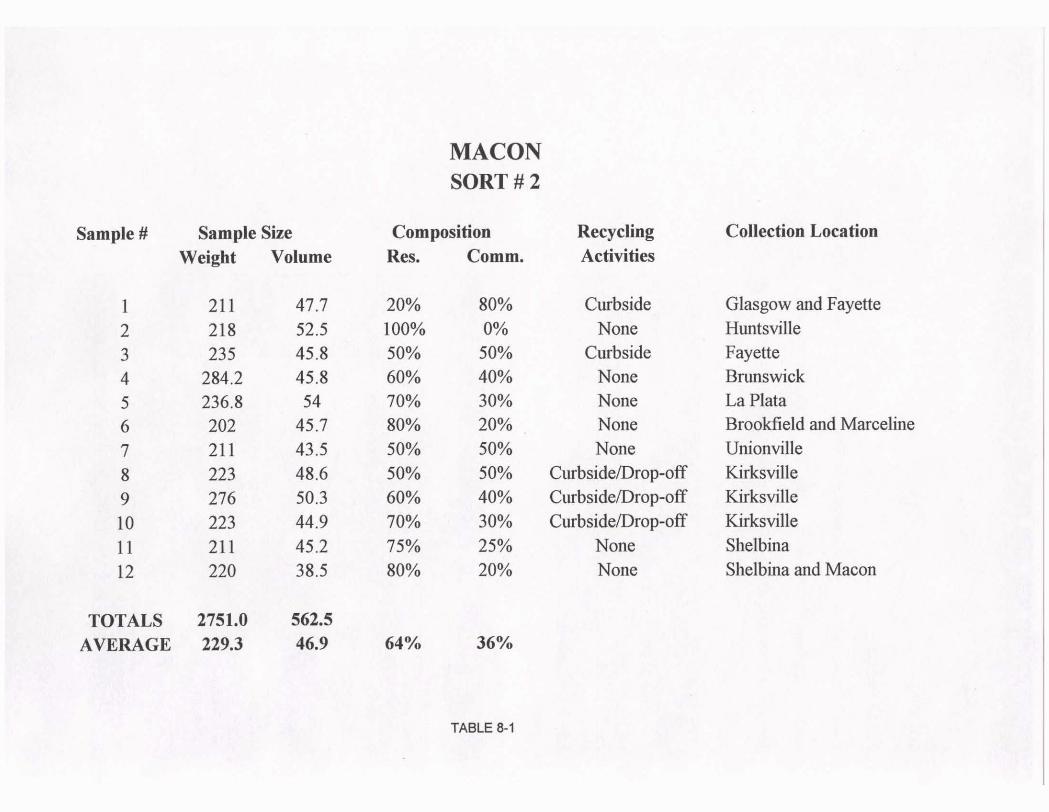
MACON SORT # 2
Sample # Sample Size Weight Volume
Composition Recycling Res. Comm. Activities
Curbside None
Curbside None None None None
CurbsideDrop-off Curbside/Drop-off CurbsideDrop-off
None None
Collection Location
Glasgow and Fayette Huntsville Fayette Brunswick La Plata Brookfield and Marceline Unionville Kirksville Kirksville Kirksville Shelbina Shelbina and Macon
TOTALS 2751.0 562.5 AVERAGE 229.3 46.9 64% 36%
TABLE 8-1

CATEGORY
Cardboard ~ews~r in t Magazines High Grade
Mixed PAPER TOTALS
Clear Brown Green Other GLASS TOTALS
Alum. Cans Other Alum Non ferrous
Food Cans Ferrous
Oil Filters METAL TOTALS
PET # 1 HDPE # 2 Film
Other Plastic PLASTIC TOTALS
Food Waste Wood Waste Textiles
Diapers
Other Organics ORGANIC TOTALS
Other Inorganics INORGANIC TOTALS
O W P TQTAL L
MACON TOTALS AVERAGE
wt . vol. wt . vol.
TABLE 8-2
SORT # 2 PERCENTAGE
Pct. by wt. Pct. by vol.

SORT # 3
Sort Conditions
The third round of sorts (second sort in Macon) was conducted on October 7th through the 8th.
The sort facility was set up in the same location as Sort # 1. Weather conditions were overcast
and cool.
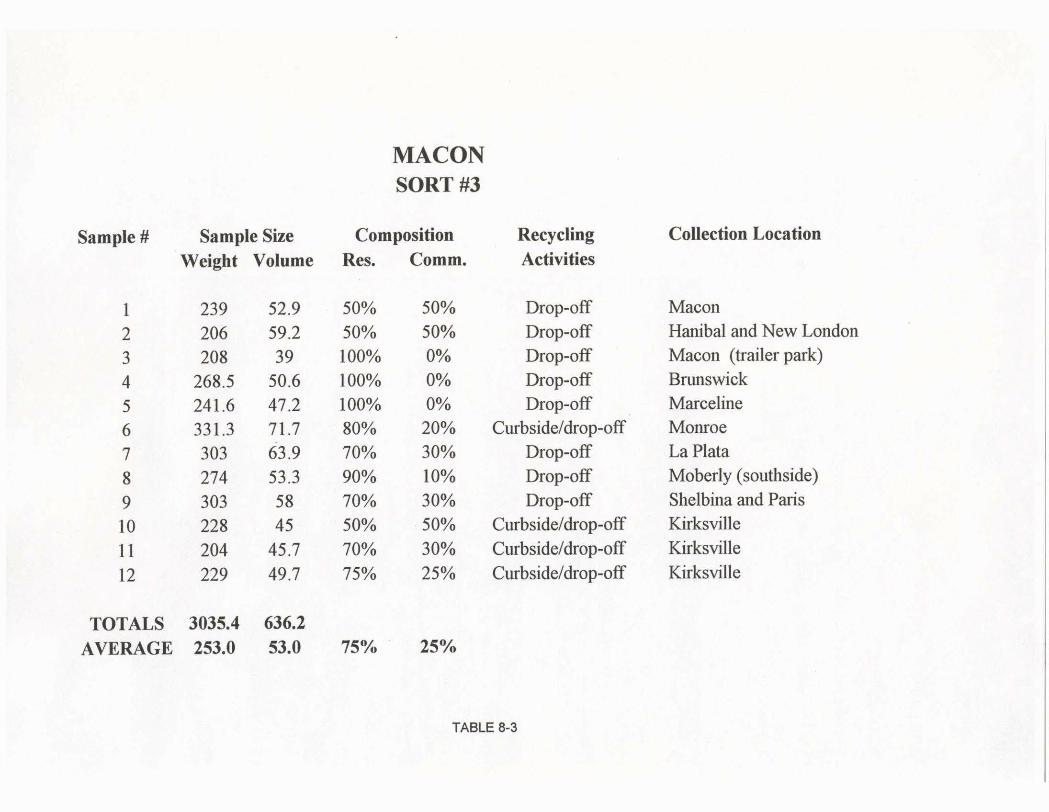
MACON SORT #3
Sample # Sample Size Weight Volume
TOTALS 3035.4 636.2 AVERAGE 253.0 53.0
Composition Recycling Res. Comm. Activities
Dropoff Drop-off Drop-off Drop-off Drop-off
Curbsideldrop-off Drop-off Drop-off Drop-off
Curbsideldrop-off Curbsideldrop-off Curbsideldrop-off
Collection Location
Macon Hanibal and New London Macon (trailer park) Bnmswick Marceline Monroe La Plata Moberly (southside) Shelbina and Paris Kirksville Kirksville Kirksville
TABLE 8-3
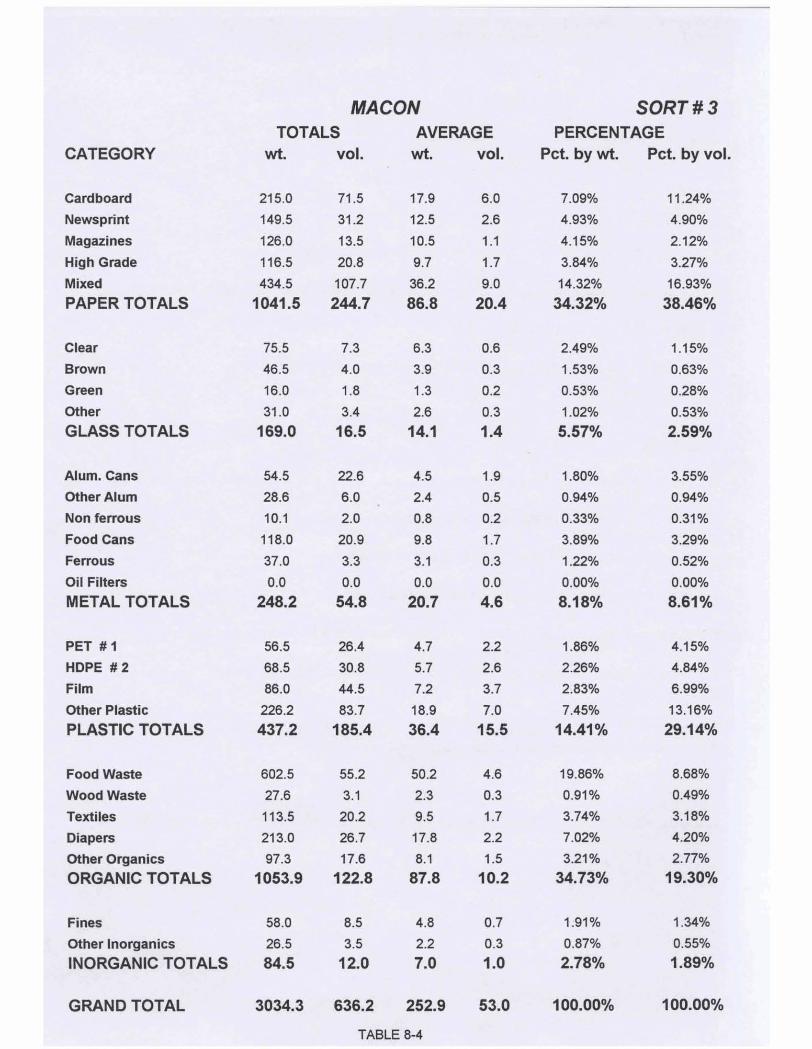
CATEGORY
Cardboard Newsprint Magazines High Grade Mixed PAPER TOTALS
Clear Brown Green Other GLASS TOTALS
Alum. Cans Other Alum Non ferrous Food Cans Ferrous Oil Filters METAL TOTALS
PET 2 1
HDPE # 2 Film Other Plastic PLASTIC TOTALS
Food Waste Wood Waste Textiles Diapem Other Olganics ORGANIC TOTALS
Fines Other Inorganics INORGANIC TOTALS
MACON TOTALS AVERAGE
w t vol. wt . vol.
SORT # 3 PERCENTAGE
Pct. by wt. Pct. by vol.
GRAND TOTAL
TABLE 8-4
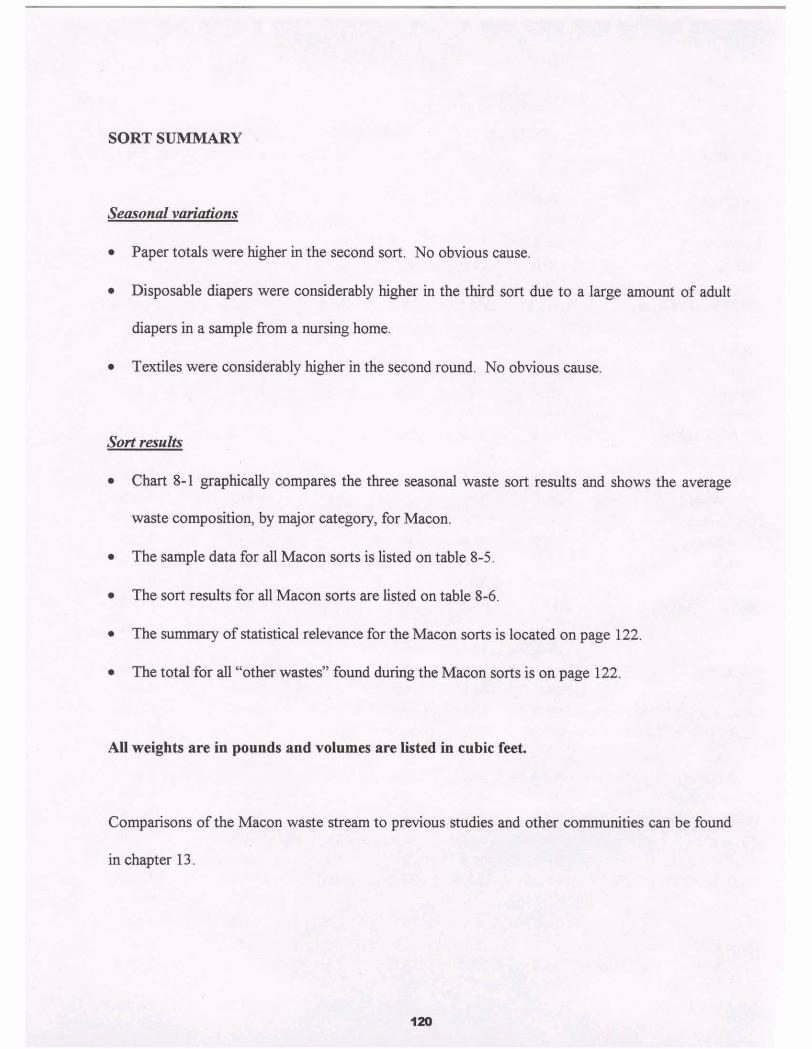
SORT SUMMARY
Seasonal vatiahns
Paper totals were higher in the second sort. No obvious cause.
Disposable diapers were considerably higher in the third sort due to a large amount of adult
diapers in a sample from a nursing home.
Textiles were considerably higher in the second round. No obvious cause.
sort results
Chart 8-1 graphically compares the three seasonal waste sort results and shows the average
waste composition, by major category, for Macon.
The sample data for al l Macon sorts is listed on table 8-5.
The sort results for all Macon sorts are listed on table 8-6.
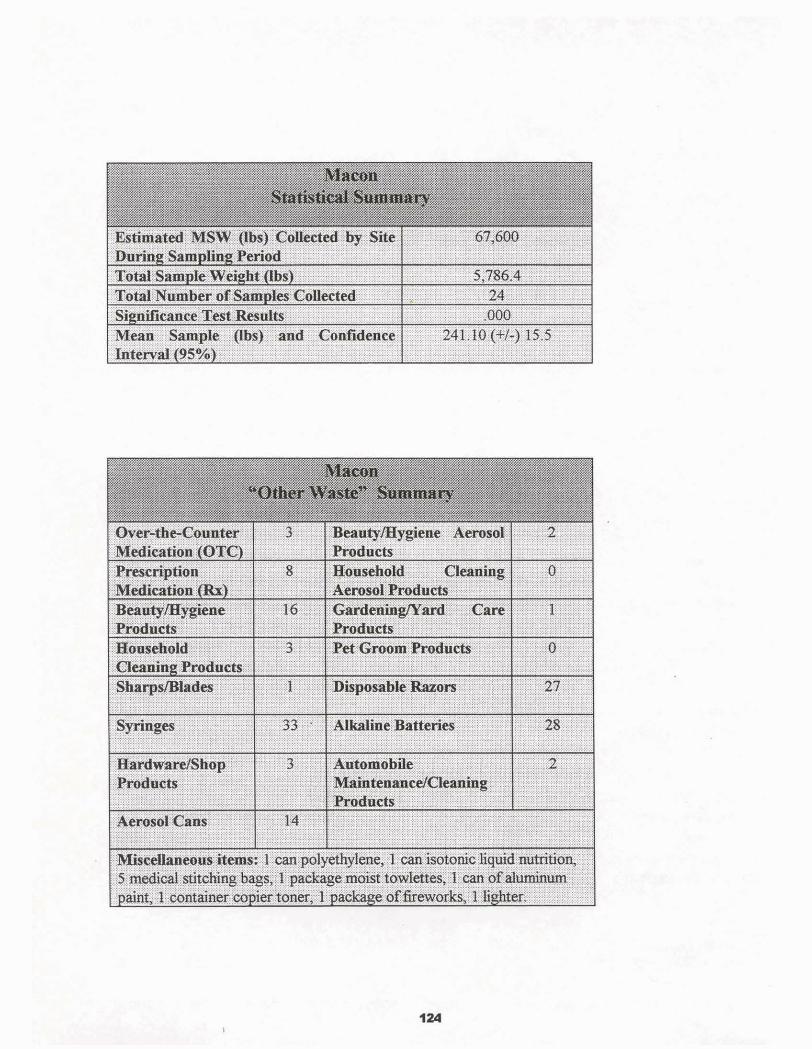
The summary of statistical relevance for the Macon sorts is located on page 122.
The total for all "other wastes" found during the Macon sorts is on page 122.
AU weights are in pounds and volumes are listed in cubic feet.
Comparisons of the Macon waste stream to previous studies and other communities can be found
in chapter 13.

MACON RESULTS BY WEIGHT
SORT #I WAS
CANCELLED
DUE TO HEAVY
RAIN AND ICE
SORT #2
INORGANICS 3%
PAPER 40%
16% METALS 5% 6%
SORT #3 SORT AVERAGE
INORGANICS INORGANICS
7%
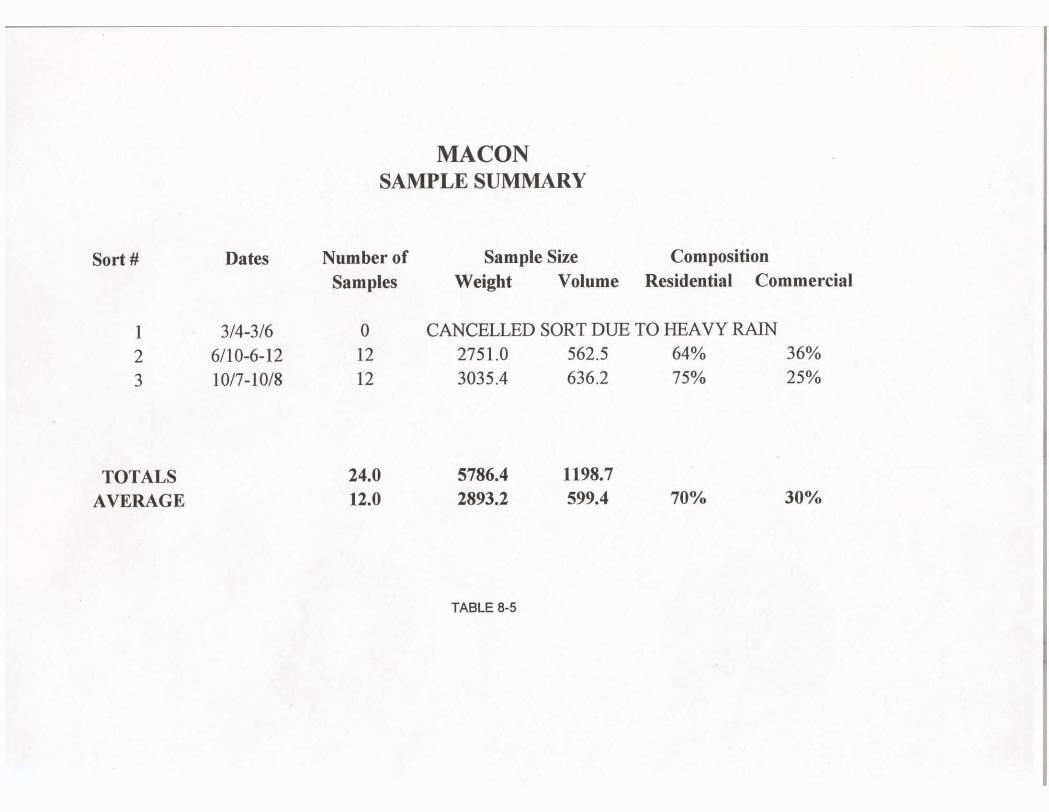
MACON SAMPLE SUMMARY
Sort # Dates Number of Sample Sue Composition Samples Weight Volume Residential Commercial
1 314-316 0 CANCELLED SORT DUE TO HEAVY RAIN 2 6110-6-12 12 2751.0 562.5 64% 36% 3 1 017- 1018 12 3035.4 636.2 75% 25%
TOTALS AVERAGE
TABLE 8-5

CATEGORY
Cardboard
Newsprint Magazines
High Grade Mixed PAPER TOTALS
Clear Brown
Green
Other GLASS TOTALS
Alum. Cans Other Alum
Non ferrous
Food Cans
Ferrous
Oil Filters METAL TOTALS
MACON SUMMARY SORT # 1 SORT # 2 SORT #3 AVERAGE
WT. VOL. WT. VOL. WT. VOL. WT. VOL.
NIA NIA 7.8% 14.1% 7.1% 11.2% 7.4% 12.6% NIA NIA 6.7% 5.2% 4.9% 4.9% 5.8% 5.0% NIA NIA 3.2% 1.9% 4.2% 2.1% 3.7% 2.0% NIA NlA 5.8% 4.8% 3.8% 3.3% 4.8% 4.0% NIA NIA 17.0% 16.8% 14.3% 16.9% 15.6% 16.8% NIA NIA 40.5% 42.7% 34.3% 38.5% 37.3% 40.5%
N/A NIA 2.7% 1.1% 2.5% 1.1% 2.6% 1.1%
NIA NIA 0.9% 0.5% 1.5% 0.6% 1.3% 0.6% NIA NIA 0.3% 0.2% 0.5% 0.3% 0.4% 0.2% NIA NIA 0.7% 0.3% 1.0% 0.5% 0.9% 0.4% NIA NIA 4.7% 2.1% 5.6% 2.6% 5.1% 2.3%
NIA NIA 1.5% 1.8% 1.8% 3.6% 1.7% 2.7% N/A NIA 0.7% 0.7% 0.9% 0.9% 0.8% 0.8% NIA NIA 0.2% 0.1% 0.3% 0.3% 0.3% 0.2% NIA NIA 2.1% 1.4% 3.9% 3.3% 3.0% 2.4% N/A NIA 1.0% 0.5% 1.2% 0.5% 1.1% 0.5% N/A NIA 0.0% 0.0% 0.0% 0.0% 0.0% 0.0% N/A NIA 5.6% 4.5% 8.2% 8.6% 7.0% 6.7%
PET # 1 NIA NIA
HDPE # 2 N/A NIA
Film N/A NIA
Other Plastic N/A NIA PLASTIC TOTALS NIA NIA
Food Waste N/A NIA
Wood Waste NIA NIA
Textiles NIA NIA
Diapers NIA NlA
Other Organics NIA NIA ORGANIC TOTALS N/A NIA
Fines NIA NIA
Other lnorganics NIA NIA INORGANIC TOTALS NIA NIA
SORT TOTALS NlA NIA
TABLE 8-6