chapter 8 food - millennium assessmentmillenniumassessment.org/documents/document.277.aspx.pdf ·...
TRANSCRIPT

Chapter 8
Food
Coordinating Lead Authors: Stanley Wood, Simeon EhuiLead Authors: Jacqueline Alder, Sam Benin, Kenneth G. Cassman, H. David Cooper, Timothy Johns, Joanne
Gaskell, Richard Grainger, Sandra Kadungure, Joachim Otte, Agnes Rola, Reg Watson, Ulf Wijkstrom,C. Devendra
Contributing Authors: Nancy Kanbar, Zahia Khan, Will Masters, Sarah Porter, Stefania Vannuccini, UlrikeWood-Sichra
Review Editors: Arsenio M. Balisacan, Peter Gardiner
Main Messages . . . . . . . . . . . . . . . . . . . . . . . . . . . . . . . . . . . . . . . . . . . . . 211
8.1 Introduction . . . . . . . . . . . . . . . . . . . . . . . . . . . . . . . . . . . . . . . . . . . 212
8.2 Magnitude, Distribution, and Structure of Food Provision . . . . . . . . . 2138.2.1 Structure and Distribution of Food Provision8.2.2 Distribution of and Trends in Domesticated and Wild Food Production
8.3 Food Provision and Biodiversity . . . . . . . . . . . . . . . . . . . . . . . . . . . . 221
8.4 Drivers of Change in Food Provision . . . . . . . . . . . . . . . . . . . . . . . . 2228.4.1 Indirect Drivers8.4.2 Direct Drivers
8.5 Food Provision and Human Well-being . . . . . . . . . . . . . . . . . . . . . . . 2298.5.1 Health and Nutrition8.5.2 Food Safety8.5.3 Household Economic Impacts8.5.4 Macroeconomic Growth8.5.5 Cultural Aspects8.5.6 Distributional Dimensions
REFERENCES . . . . . . . . . . . . . . . . . . . . . . . . . . . . . . . . . . . . . . . . . . . . . . 238
PAGE 209
209
................. 11432$ $CH8 10-11-05 14:55:23 PS
210 Ecosystems and Human Well-being: Current State and Trends
BOXES
8.1 Cropland Dynamics: The Case of Oil Crops
8.2 The Growing Use of Crops as Feed
8.3 Trophic Level
8.4 Diet and Nutrition Drivers: ‘‘The Diet Transition’’
8.5 Biofortification
FIGURES
8.1 Trends in Key Indicators of Food Provision, 1961–2002
8.2 Spatial Distribution of Value of Food Production for Crops,Livestock, and Fisheries, 2000*
8.3 Spatial Distribution of Food Production in Parts of Asia forCrops, Livestock, and Fisheries, 2000*
8.4 Aggregate Structure of Per Capita (1961–2003) and TotalFood Crop Output by Group
8.5 Aggregate Structure of Per Capita (1961–2003) and TotalLivestock Output by Group
8.6 Developing-Country Net Exports of Fish and SelectedAgricultural Commodities, 1982, 1992, and 2002
8.7 Decline in the Trophic Level of Fishery Catch, 1970–95
8.8 Trends in Selected Drivers of Food Provision Worldwide,1961–2001
*This appears in Appendix A at the end of this volume.
PAGE 210
8.9 Association between National Average Dietary EnergySupply and GDP, Per Capita
8.10 Key Linkages in the Nutrition, Health, and Economic Well-being Nexus
8.11 Dietary Energy Supply, 1961–2001
8.12 Distribution of Per Capita Dietary Energy Supply by Decade
8.13 Status and Trends of Hunger, 1990–2001
8.14 Double Burden of Undernutrition and Overnutrition amongWomen Aged 20–49 for Selected Developing Countries
TABLES
8.1 The Global Structure of Food Provision by Food Categoryand MA Ecosystem
8.2 Global and Regional Growth Rates in Crop Output
8.3 Global and Regional Growth in Livestock Output
8.4 World Fishery Production and Utilization, 1996–2001
8.5 Indirect Drivers of Food Provision
8.6 Direct Drivers of Food Provision
8.7 Global Agricultural Research Spending, 1976–95
8.8 Public–Private Breakdown of Research Expenditures, Circa1995
8.9 Regional and Global Burden of Nutrition-related Disease RiskFactors
................. 11432$ $CH8 10-11-05 14:55:23 PS

211Food
Main Messages
Despite the fact that food production per capita has been increasingglobally, major distributional inequalities exist. Global food production hasincreased by 168% over the past 42 years. The production of cereals hasincreased by about 130%, but that is now growing more slowly. Nevertheless,an estimated 852 million people were undernourished in 2000–02, up 37 mil-lion from the period 1997–99. Of this total, nearly 96% live in developingcountries. Sub-Saharan Africa, the region with the largest share of undernour-ished people, is also the region where per capita food production has laggedthe most.
Rising incomes, urbanization, and shifting consumption patterns haveincreased per capita food consumption in most areas of the world. Foodpreferences, including those arising from cultural differences, are importantdrivers of food provision. As incomes have increased in regions such as Eastand Southeast Asia, so has demand for high-value products such as livestockand fish, but cereals are likely to remain the major single component of globaldiets and to occupy the predominant share of cultivated land.
A diverse diet, with sufficient protein, oils and fats, micronutrients, andother dietary factors is as important for well-being as access to and con-sumption of sufficient calories. Average daily energy (calorific) intake hasdeclined recently in the poorest countries. Inadequate energy intake is exacer-bated by the fact that poor people tend to have low-quality diets. The world’spoorest rely on starchy staples for energy, which leads to significant protein,vitamin, and mineral deficiencies. Overconsumption is also a health problem.Nutritional status and children’s growth rates improve with consumption ofgreater food diversity, particularly of fruits and vegetables.
A global epidemic of diet-related obesity and noncommunicable diseaseis emerging as increasingly urbanized people adopt diets that are higherin energy and lower in diversity in fruits and vegetables than traditionaldiets (known as the nutrition transition). Many countries now face the doubleburden of diet-related disease: the simultaneous challenges of significant inci-dence of acute, communicable diseases in undernourished populations andincreasing incidence of chronic diseases associated with the overweight andobese.
An increasing number of people everywhere suffer from diseases causedby contaminated food. As the world eats more perishable foods such asmeat, milk, fish, and eggs, the risk of food-borne illnesses is increasing. Therelative health risks from food vary by climate, diet, income, and public infra-structure. Food of animal origin poses health risks particularly when it is im-properly prepared or inadequately refrigerated. Microbial contamination is ofspecial concern in developing countries. Non-microbial contaminants includemetals and persistent organic pollutants. Other growing health concerns re-lated to food production are diseases passed from animals to humans (zoono-ses), toxin-containing animal wastes, and overuse of antibiotics in livestockproduction that may cause allergies or render human antibiotics less effective.
Local food production is critical to eliminating hunger and promotingrural development in areas where the poor do not have the capacity topurchase food from elsewhere. The number of food-insecure people is grow-ing fastest in developing regions, where underdeveloped market infrastructuresand limited access to resources prevent food needs from being satisfied byinternational trade alone. In these areas, local food production is critical toeliminating hunger and providing insurance against rising food prices. In addi-tion, rural households gain income and employment from engaging in foodprovision enterprises. In sub-Saharan Africa, two thirds of the population relieson agriculture or agriculture-related activities for their livelihoods.
PAGE 211
Maintaining a focus on raising the productivity of food production sys-tems continues to be a priority for both global food security and environ-mental sustainability. While major cereal staples are likely to continue as thefoundation of the human food supply, some doubts are being raised about ourability to reproduce past yield growth in the future—especially with regard tosustaining rates of yield growth in high-productivity systems that are alreadyproducing near the yield potential threshold, as well as in terms of the availabil-ity of land that is suitable for sustaining expanded food output needs.
Government policies are significant drivers of food production and con-sumption patterns, both locally and globally. Investments in rural roads,irrigation, credit systems, and agricultural research and extension serve tostimulate food production. Improved access to input and export markets boostsproductivity. Opportunities to gain access to international markets are condi-tioned by international trade and food safety regulations and by a variety oftariff and non-tariff barriers. Selective production and export subsidies, includ-ing those embodied in the European Union’s Common Agricultural Policy andthe U.S. Farm Bill, stimulate overproduction of many food crops. This in turntranslates into relatively cheap food exports that benefit international consum-ers at the expense of domestic taxpayers and has often undermined the abilityof food producers in many poorer countries to enter international food markets.
The accelerating demand for livestock products is increasingly being metby intensive (industrial or so-called landless) production systems, espe-cially for chicken and pigs, and especially in Asia. These systems have contrib-uted to large increases in production: over the last decade, bovine and ovinemeat production increased by about 40%, pig meat production rose by nearly60%, and poultry meat production doubled. However, intensified livestock pro-duction poses serious waste problems and puts increased pressure on culti-vated systems to provide feed inputs, with consequent increased demand forwater and nitrogen fertilizer.
Per capita consumption of fish is increasing, but this growth is unsus-tainable with current practices. Total fish consumption has declined some-what in industrial countries, while it has doubled in the developing world since1973. Demand has increased without corresponding increases in supply pro-ductivity, leading to increases in the real prices of most fresh and frozen fishproducts at the global level. Pressure on marine ecosystems is increasing tothe point where a number of targeted stocks in all oceans are near or exceed-ing their maximum sustainable levels of exploitation, and world fish catcheshave been declining since the late 1980s due to overexploitation. Inland waterfisheries in the developing world are expanding slowly and will remain animportant source of high-quality food for many of the world’s poor, particularlyin Africa and Asia; however, habitat modifications and water abstractionthreaten the continued supply of freshwater fish. For the world as a whole,increases in the volume of fish consumed are made possible by aquaculture,which in 2002 is estimated to have contributed 27% of all fish harvested and40% of the total amount of fish products consumed as food. Future growth ofaquaculture will be constrained by development costs and by fishmeal and oilsupplies, which are increasingly scarce.
Wild foods are locally important in many developing countries, often brid-ging the hunger gap created by stresses such as droughts and civil un-rest. In addition to fish, wild plants and animals are important sources ofnutrition in some diets, and some wild foods have significant economic value.In most cases, however, wild foods are excluded from economic analysis ofnatural resource systems as well as official statistics, so the full extent of theirimportance is improperly understood. In some cases, plants and animals areunder pressure from unsustainable levels of harvesting, and there is a localneed for conservation of wild food resources to satisfy the nutritional needs ofthose who do not have access to agricultural land or resources.
................. 11432$ $CH8 10-11-05 14:55:24 PS

212 Ecosystems and Human Well-being: Current State and Trends
8.1 IntroductionThe initial use and subsequent transformation of ecosystems forthe purpose of meeting human food needs has been a vital, long-standing, and, for the most part, fruitful dimension of the humanexperience. The provision, preparation, and consumption of foodare daily activities that for most societies represent an importantpart of their identity and culture. But while human ingenuityhas transformed the specter of global famine into an unparalleledabundance of food, there are still too many people in the worldfor whom an adequate, safe, nutritious diet remains an illusion.
Before dealing squarely with the remaining inequities in fooddistribution and access, as well as the environmental damage oftenassociated with the provision of food, the first and foremost factis that our ability to provide sufficient food and to do so in in-creasingly cost-effective ways has been a major human and hu-manitarian achievement. It is all the more remarkable given thatthe past 50 years have seen the global population double, addingmore mouths to be fed than existed on the planet in 1950. Andaccording to most projections, it appears likely that growing foodneeds can be met in the foreseeable future, notwithstanding agrowing list of technological, distributional, food safety, andhealth issues that require serious attention and action (Bruinsma2003; Runge et al. 2003).
Figure 8.1 illustrates the trend in a number of key indicatorsof food provision. The most significant trend is the growth infood output from 1961 to 2003, increasing by over 160%, or 1.7%per year. As a consequence, average food production per capitaalso increased by around 25% during the period. Fueling this out-put growth in many parts of the world were long-term invest-ments in the generation and distribution of new seeds and otherfarming technologies, and in infrastructure such as irrigation sys-tems and rural roads. This allowed farm productivity to increaseand marketing margins to decrease, reducing the price of manyfoods. Figure 8.1 shows that following significant spikes in the1970s caused primarily by oil crises, there have been persistentand profound reductions in the price of food globally. It is wellestablished that past increases in food production, at progressively
Figure 8.1. Trends in Key Indicators of Food Provision, 1961–2002 (FAOSTAT 2004; IMF various; FAO 2001, 2003, 2004a; World Bank2004) Global Production, Prices, and Undernourishment, left. Food Supply in Industrial and Developing Countries, right.
PAGE 212
lower unit costs, have improved the health and well-being of bil-lions of people, particularly the poorest, who spend the largestshare of their incomes on food.
Despite rising food production and falling food prices, morethan 850 million people still suffer today from chronic under-nourishment, and the absolute number of hungry people is rising.In 1970 there were an estimated 959 million people sufferingfrom hunger, or about one quarter of the world’s population. By1998 that number had been reduced to 815 million, but progresshas been slow. And in sub-Saharan Africa, there are now manymore hungry people than there were in 1970. There have alsobeen recent declines in food security in South Asia and the transi-tion economies. In 2000–02, the total number of 852 undernour-ished people globally was up 37 million from 1997–99. Of thistotal, 815 million people were in developing countries, up byaround 38 million from the 777 million in 1997–99 (FAO 2001,2004a). In industrial countries, approximately 1.6% of childrenunder five are underweight (WHO 2004d).
This chapter provides insights into the structure and distribu-tion of food provision, with particular emphasis on the relativecontribution of various ecological systems. It examines trends inthe core food sources (crops, livestock, and fisheries), some of thekey linkages to ecosystems and ecosystem service provision, andthe drivers of those trends. Examining the drivers of change isparticularly important, since some are amenable to interventionso as to bring about improved outcomes, particularly with regardto greater provision of (or fewer trade-offs with) other ecosystemservices. Finally, the chapter addresses linkages between humanwell-being and food access and use. The chapter does not dwellon the important issue of the specific ways in which food is culti-vated or harvested, and how those ways affect ecosystem capacityand the provision of other services. These topics are the corefocus of specific systems chapters, of which cultivated systems(Chapter 26), drylands (Chapter 22), inland waters (Chapter 20),coastal (Chapter 19), and marine (Chapter 18) systems are theones most directly relevant. Key related service chapters are thoseon biodiversity (Chapter 4), fresh water (Chapter 7), and nutrientcycling (Chapter 12).
................. 11432$ $CH8 10-11-05 14:55:28 PS

213Food
8.2 Magnitude, Distribution, and Structure ofFood ProvisionThis section has two main subsections. First, a contemporary per-spective of the structure of food provision is presented, focusingboth on major food groups and on a breakdown of food provisionby system types. An assessment of the spatial distribution of globalfood production by value for crops, livestock, and fisheries is alsopresented. Second, a review in more depth is provided of thespecific regional and food group trends for crops, livestock, andfisheries.
8.2.1 Structure and Distribution of Food Provision
The overall distribution of food production by MA system typeand by major food group is presented in Table 8.1. Care must betaken in interpreting the Table for several reasons. First, the MAsystems are neither mutually exclusive nor fully exhaustive of allterrestrial ecosystems. For example, a single cropland area mightsimultaneously be counted as belonging to several MA systems,since it is a cultivated system in a dryland area, situated in the coastalzone. Second, it is very difficult to obtain any reliable informationon the quantity and value of wild sources of food (apart fromcommercial fisheries), even though they are extremely importantin many parts of the world.
All crop production is considered to take place in cultivatedsystems. (See Chapter 26.) Dryland systems account for about38% of total crop production, with forest and mountain ecosys-tems each accounting for about 25%, and coastal systems around12%. Table 8.1 shows both annual and perennial crop production,irrigated and rain-fed production proportions, and an assessmentof the food and feed utilization of crops. On average, about 53%of food crops find their way into food and 21% are used for feed.
Table 8.1. The Global Structure of Food Provision by Food Category and MA Ecosystem (2000 production)
Food/Feed TypesTotalValue
Share By Use Value by Selected MA System
Food Feed Dryland ForestsCultivatedSystems Mountains Polar
InlandWaters Coastal Marine
(percent) (billion 1989–91 dollars)
Crops Total 815 53.3 21.1 314 202 815 195 100
336 185 38 336 38
479 129 165 479 157
Annual 663 49.3 23.0 254 164 663 151
Perennial 152 95.8 2.0 60 38 152 44
Wild plants n.a.
Livestock Total 576 83.0 15.7 294 98 242 150 35
Wild meat n.a.
Fish Total 32 2 32 67 57
Wild 83.0 17.0 2 n.a. 34 57
65 100.0 32 32 33 n.a.
Aquaticplants
Wild n.a.
Aquaculture 8 n.a. 8
Total value of food production 1,557 608 300 1,089 345 2 32 210 57
Production values derived from 2000 production estimates weighted by 1989–91 global average international dollar prices for individual products in each food type group (FAO-STAT 2004; FAO Fishstat 2003; FAO 1997). The 1989–91 prices are the most recent set of complete and comparable prices covering all FAO crop and livestock products.Fisheries prices based on landed values by group of species. Production values by MA system and irrigated/rain-fed split derived by authors from GIS analysis of cropland, irri-gated area, and pasture and livestock distribution. Non-food agricultural products were excluded from the analysis. Note that total value for each food group is not the sum ofindividual MA system values since MA systems overlap and not all MA systems are included in the table.a Fisheries totals do not include wild inland water catches.n.a. = data not available.
Irrigated
Rain-fed
Aquaculture
158a
93a
PAGE 213
The remaining 26% is categorized as used for seed, waste, or otherindustrial processing. Only a small share of perennial crop produc-tion is used for feed. However, a significant quantity of wild fish-eries capture is used for feed—for aquaculture and, to a lesserextent, livestock. Aquaculture production is roughly split evenlybetween inland/fresh and coastal/brackish waters. Wild fishcatches from freshwater systems are extremely difficult to esti-mate, as most go unreported. Some 63% of wild marine fishcatches are from marine systems and 37% from coastal systems.
Figure 8.2 (in Appendix A) shows the spatial distribution ofthe total value of food production summarized in Table 8.1, indi-cating where the major calorie and protein sources of the worldare concentrated. Figure 8.3 (in Appendix A) shows a detail forAsia, highlighting the importance of coastal zone systems in pro-viding high values of both marine and terrestrial food sources.This dual pressure on coastal zones poses particular managementchallenges. (See Chapter 19.)
8.2.2 Distribution of and Trends in Domesticatedand Wild Food Production
8.2.2.1 Domesticated SpeciesAs domestication of plant and animal species favored for foodproduction has evolved, the species base supporting food provi-sion has been eroded. Of the estimated 10,000–15,000 edibleplants known, only 7,000 have been used in agriculture and lessthan 2% are deemed to be economically important at a nationallevel. Only 30 crops provide an estimated 90% of the world pop-ulation’s calorific requirements, with wheat, rice, and maize aloneproviding about half the calories consumed globally (Shand 1997;FAO 1998; FAOSTAT 2004).
There is a large potential for the improvement and greater useof neglected and underutilized species (FAO 1996; Naylor et al.
................. 11432$ $CH8 10-11-05 14:55:29 PS

214 Ecosystems and Human Well-being: Current State and Trends
2004). In addition, along with traditional crop varieties, wild rela-tives of crop plants have been used to supply specific traits thathave been introduced into crop plants using conventional breed-ing techniques, and, increasingly, using modern biotechnology(FAO 1998). There is also a large potential for the domesticationand improvement of new crops, especially fruits, vegetables, andindustrial (or cash) crops (Janick and Simon 1993), but the proba-bility of developing new major staple crops is probably rather lim-ited (Diamond 1999). With regard to livestock, of the estimated15,000 species of mammals and birds, only some 30–40 (0.25%)have been used for food production, with fewer than 14 speciesaccounting for 90% of global livestock production.
Since the origins of agriculture, farmers—and, more recently,professional plant and animal breeders—have developed a diverserange of varieties and breeds that contain a high level of geneticdiversity within the major species used for food. For some cropspecies, there are thousands of distinct varieties (FAO 1998). Sim-ilarly, there are many breeds of livestock that originate from asingle species. However, as larger and larger areas are planted witha smaller and smaller number of crop varieties, and as livestocksystems are intensified, many of these varieties and breeds are atrisk of being lost in production systems and increasingly are foundonly in ex situ collections. (See Chapter 26.) For example, FAOestimates that in Europe 50% of livestock breeds that existed 100years ago have disappeared (Shand 1997).
Plant breeders have achieved yield increases through changingplant physiology and number of grains; increasing the oil, protein,and starch content of specific crops; shortening the maturity pe-riod for annual and perennial crops; and increasing drought resis-tance and nutrient use efficiency. Plant breeding per se has beencomplemented by deliberate programs of genetic enhancement or‘‘base broadening’’ in order to incorporate genetic variation intoplant breeders’ stocks. Generally, there has been insufficient in-vestment in such ‘‘pre-competitive’’ crop improvement activities(Simmonds 1993; FAO 1996; Cooper et al. 2000).
8.2.2.1.1 Crops
Over the 40 years from 1964 to 2004, the total output of cropsexpanded by some 144% globally, an average increase of just over2% per year, always keeping ahead of global population growthrates. As shown in Table 8.2, output growth varied by region andover the period as a whole.
Despite a resurgence of crop output in the early to mid-1990sin response to both the decline in outputs from countries in tran-
Table 8.2. Global and Regional Growth Rates in Crop Output(Bruinsma 2003)
Region 1969–99 1979–99 1989–99
(percent per year)
Sub-Saharan Africa 2.3 3.3 3.3
Near East/North Africa 2.9 2.9 2.6
Latin America and Caribbean 2.6 2.3 2.6
South Asia 2.8 3.0 2.4
East Asia 3.6 3.5 3.7
Developing countries 3.1 3.1 3.2
Industrial countries 1.4 1.1 1.6
Transition economies –0.6 –1.6 3.7
World 2.1 2.0 2.1
g
PAGE 214
sition and a surge in food prices, many middle-income and richercountries have seen a gradual slowing down in the growth of cropoutput in line with the deceleration of population growth and theattainment of generally satisfactory levels of food intake. Deceler-ating growth patterns in crop output have been most evident inindustrial countries and in Asia more widely.
Output in the transition economies fell by about 30% between1990 and 1995 from its fairly stable level in the mid to late 1980s.While output has since steadied around a lower level, a significantdrop in average food energy intake and an increase in the inci-dence of malnutrition have been documented during the 1990s,as described elsewhere in this chapter.
In response to growing affluence and shifting dietary patternsthat increased demand for both food and feed crops, growth offood output in Asia has been consistently high, at 3% a year ormore since the early 1960s. The feed market is important not onlyfor intensive livestock production, but increasingly for aquacul-ture, as seen in the rapid increase in soybean demand for carpcultivation in China.
While growth in overall crop output in sub-Saharan Africahas been relatively strong over the past two decades, beverage andfiber crops, predominantly for export, still represent a significantshare of that production. Since food crop production has notgrown as markedly, and population growth rates remain high,sub-Saharan Africa remains the only region in which per capitafood production has not seen any sustained increase over the lastthree decades, and this has recently been in decline. In NorthAfrica and the Middle East, growth in crop output has been bothmoderate and often erratic.
The past 40 years have also seen some considerable shifts incrop production, driven by changes in consumption. Figure 8.4shows the trends in crop production by major crop group on aper capita basis. There have been four general trends exhibited byoilcrops; fruits and vegetables; cereals and sugar crops; and roots,tubers, and pulses.
Growth in output of oilcrops and vegetable oils between 1961and 2001was consistently strong at just over 4% per year, largelypropelled by a rapid growth in palm oil (8.2% per year), rapeseedoil (6.9% per year), and soybeans (4.1% per year). The principalcommodities included in this category (and their global produc-tion quantities in million tons in 2001) include soybeans (177), oilpalm (128), coconuts (52), groundnuts (36), and rapeseed (36).Cottonseed (37 million tons) is usually often part of this group,but it is excluded here as it is not considered a food product.
Food use of oil and vegetable oil crops, expressed in oil equiv-alent, grew from 6.3 kilograms per capita per year in 1964/66 to11.4 kilograms in 1997/99. Demand has grown more in develop-ing countries (5.0% per year) than in industrial ones (3.2%), stim-ulated by rising incomes and urbanization that have increasedconsumption of cooking oil, processed foods, and snacks. Morethan for any other crop (and excluding pastures), it is the globalarea expansion of oilcrops over the past 40 years that has drivencropland expansion. (See Box 8.1.)
Fruit and vegetable production grew in line with populationduring the 1960s and 1970s, when growing demand lead to in-creased per capita output. The principal commodities in this cate-gory, and their 2001 production in million tons, are tomatoes(106), watermelons (81), bananas (65), cabbages (61), grapes (61),oranges (60), apples (58), and dry onions (51). While per capitaoutput growth was modest during the 1980s, it accelerated duringthe 1990s. Between 1961 and 2001, production of vegetablesgrew from 72 kilograms per capita on average per year to 126kilograms, and that of fruits from 56 to 77 kilograms per year.
................. 11432$ $CH8 10-11-05 14:55:31 PS
215Food
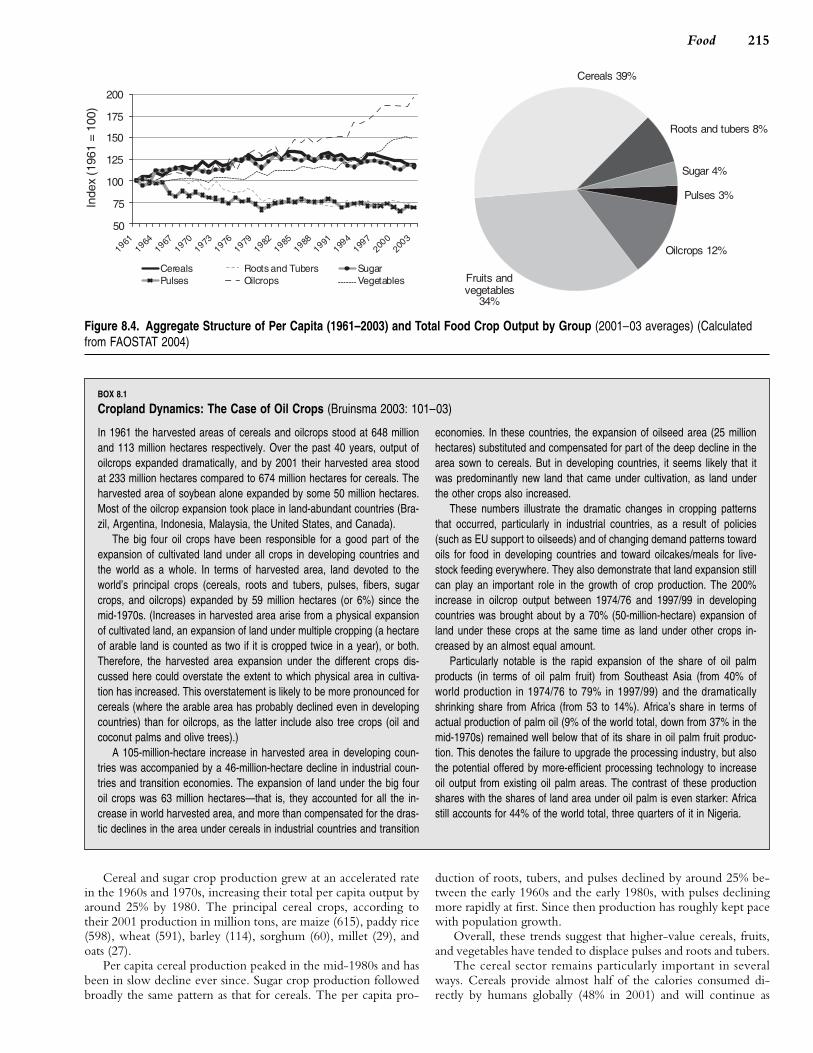
Figure 8.4. Aggregate Structure of Per Capita (1961–2003) and Total Food Crop Output by Group (2001–03 averages) (Calculatedfrom FAOSTAT 2004)
BOX 8.1
Cropland Dynamics: The Case of Oil Crops (Bruinsma 2003: 101–03)
In 1961 the harvested areas of cereals and oilcrops stood at 648 million economies. In these countries, the expansion of oilseed area (25 millionand 113 million hectares respectively. Over the past 40 years, output of hectares) substituted and compensated for part of the deep decline in theoilcrops expanded dramatically, and by 2001 their harvested area stood area sown to cereals. But in developing countries, it seems likely that itat 233 million hectares compared to 674 million hectares for cereals. The was predominantly new land that came under cultivation, as land underharvested area of soybean alone expanded by some 50 million hectares. the other crops also increased.Most of the oilcrop expansion took place in land-abundant countries (Bra- These numbers illustrate the dramatic changes in cropping patternszil, Argentina, Indonesia, Malaysia, the United States, and Canada). that occurred, particularly in industrial countries, as a result of policies
The big four oil crops have been responsible for a good part of the (such as EU support to oilseeds) and of changing demand patterns towardexpansion of cultivated land under all crops in developing countries and oils for food in developing countries and toward oilcakes/meals for live-the world as a whole. In terms of harvested area, land devoted to the stock feeding everywhere. They also demonstrate that land expansion stillworld’s principal crops (cereals, roots and tubers, pulses, fibers, sugar can play an important role in the growth of crop production. The 200%crops, and oilcrops) expanded by 59 million hectares (or 6%) since the increase in oilcrop output between 1974/76 and 1997/99 in developingmid-1970s. (Increases in harvested area arise from a physical expansion countries was brought about by a 70% (50-million-hectare) expansion ofof cultivated land, an expansion of land under multiple cropping (a hectare land under these crops at the same time as land under other crops in-of arable land is counted as two if it is cropped twice in a year), or both. creased by an almost equal amount.Therefore, the harvested area expansion under the different crops dis- Particularly notable is the rapid expansion of the share of oil palmcussed here could overstate the extent to which physical area in cultiva- products (in terms of oil palm fruit) from Southeast Asia (from 40% oftion has increased. This overstatement is likely to be more pronounced for world production in 1974/76 to 79% in 1997/99) and the dramaticallycereals (where the arable area has probably declined even in developing shrinking share from Africa (from 53 to 14%). Africa’s share in terms ofcountries) than for oilcrops, as the latter include also tree crops (oil and actual production of palm oil (9% of the world total, down from 37% in thecoconut palms and olive trees).) mid-1970s) remained well below that of its share in oil palm fruit produc-
A 105-million-hectare increase in harvested area in developing coun- tion. This denotes the failure to upgrade the processing industry, but alsotries was accompanied by a 46-million-hectare decline in industrial coun- the potential offered by more-efficient processing technology to increasetries and transition economies. The expansion of land under the big four oil output from existing oil palm areas. The contrast of these productionoil crops was 63 million hectares—that is, they accounted for all the in- shares with the shares of land area under oil palm is even starker: Africacrease in world harvested area, and more than compensated for the dras- still accounts for 44% of the world total, three quarters of it in Nigeria.tic declines in the area under cereals in industrial countries and transition
Cereal and sugar crop production grew at an accelerated ratein the 1960s and 1970s, increasing their total per capita output byaround 25% by 1980. The principal cereal crops, according totheir 2001 production in million tons, are maize (615), paddy rice(598), wheat (591), barley (114), sorghum (60), millet (29), andoats (27).
Per capita cereal production peaked in the mid-1980s and hasbeen in slow decline ever since. Sugar crop production followedbroadly the same pattern as that for cereals. The per capita pro-
PAGE 215
duction of roots, tubers, and pulses declined by around 25% be-tween the early 1960s and the early 1980s, with pulses decliningmore rapidly at first. Since then production has roughly kept pacewith population growth.
Overall, these trends suggest that higher-value cereals, fruits,and vegetables have tended to displace pulses and roots and tubers.
The cereal sector remains particularly important in severalways. Cereals provide almost half of the calories consumed di-rectly by humans globally (48% in 2001) and will continue as
................. 11432$ $CH8 10-11-05 14:55:34 PS
216 Ecosystems and Human Well-being: Current State and Trends
the foundation of human food supply into the foreseeable futurebecause of their high yields, nutrient density, and ease of cooking,transport, and storage compared with other staples such as rootand starch crops. Cereal production accounts for almost 60% ofthe world’s harvested crop area and an often disproportionatelylarger share of the usage of fertilizer, water, energy, and otheragrochemical inputs. The cereal sector therefore is especially im-portant from the perspective of ecosystem services and trade-offsbetween services both locally and globally. Chapter 7 in the MAScenarios volume describes the technological and humanitariansuccesses of the cereal-based Green Revolution, as well as thesubsequent and continuing controversy about the scale and lon-gevity of its environmental and equity implications. At the heartof this debate lie many questions of trade-offs among ecosystemservices and among elements of human well-being. One part ofthat debate has focused on the relative economic, social, and envi-ronmental costs of intensification versus expansion strategies formeeting global (cereal) food needs (Evenson and Gollin 2003;Conway 1997; Green et al. 2005) as well as on key assumptionsregarding the scientific opportunities for improving future cropyield potential (Cassman 1999; Cassman et al. 2003).
Aggregate cereal consumption and production patterns are in-fluenced by three major, codependent forces. The first force is atwo-stage income effect in which cereal consumption increases inproportion with incomes as they grow from low levels, but areversal in this behavior (technically, a reverse in the ‘‘incomeelasticity’’) is witnessed as incomes continue to rise and as basicenergy and other dietary needs are met. At this stage most con-sumers tend to replace food staples like cereals with higher-valuefoods, such as animal protein and fruits and vegetables. The sec-ond force is urbanization, which often brings a shift in cereal pref-erences toward wheat and rice at the same time as an overalldecline in the share of cereals in a more diverse diet. And thethird force is the increasing role of coarse grains (maize, sorghum,millet) but also wheat and, to a lesser extent, rice as livestock feed.These forces, all at various stages of evolution in different parts ofthe world, have resulted in a net increase in per capita cerealconsumption globally from 135 to 155 kilograms per year be-tween 1961 and 2001, even though cereals now constitute aslightly lower proportion of total energy intake (down from 50%to 48%).
The trends are clearer if industrial- and developing-countrygroupings are distinguished. In industrial countries, per capitaconsumption of cereal as food fell from 148 to 130 kilograms peryear (representing 38% and 31% respectively of dietary energysupply), while in developing countries per capita consumptionincreased from 129 to 162 kilograms per year (representing 59%and 53% respectively of DES). (See Box 8.2 for a description oftrends in cereals for feed.)
Following a peak in food prices in 1996, there was stronggrowth in crop output in 1999 in both industrial and developingcountries, but since then the general pattern of growth decelera-tion has resumed. In industrial countries, output actually declinedin both 2001 and 2002. In the case of cereals, global output levelshave stagnated since 1996, while grain stocks have been in de-cline. The area devoted to the major cereals has been decreasingat about 0.3% annually since the 1980s. These trends are likely tocontinue if real cereal prices continue to fall, causing farmers toswitch to more profitable crops, such as vegetables and fruits. Lossof highly productive cereal-growing land is particularly acute inareas of rapid urban expansion, a common feature of developmentin many countries. Although there has been some cereal pricerecovery since 2001, prices still stand at some 30–40% lower thantheir peak in the mid-1990s (FAO 2004b).
PAGE 216
Growth in the yield of the major cereals has been virtuallyconstant for the past 35 years since the release of the first miraclevarieties of wheat and rice and of the single-cross maize hybrids.And in many of the world’s most important cereal productionareas, there has even been a plateauing of yields in the past 15–20years as average farm yields reached about 80–85% of the geneticyield potential (Cassman 1999). Such stagnation is evident in keyrice-growing provinces in China, Java and other parts of Indone-sia, Central Luzon in the Philippines, the Indian Punjab, Japan,and South Korea (Cassman et al. 2003), as well as for irrigatedwheat in the Yaqui Valley of Mexico. However, yield growthrates will have to increase to meet future food demand unlessmore land area is devoted to cereal production. While in manylow-productivity areas there is still considerable scope (and press-ing need) for raising yields through the use of improved technolo-gies and management practices, in high-productivity areas futureyield growth will depend increasingly on raising genetic yield po-tential and more fine-tuned crop and soil management practicesto allow consistent production near the yield potential ceiling.
Despite the potential contribution of genomics and molecularbiology, as well as substantial research investments to improvephotosynthesis during the 1970s and 1980s, there is as yet limitedevidence that biotechnology approaches can help raise the yieldpotential ceiling. Indeed, there has been little progress toward in-creasing maximum net assimilation rates (photosynthesis minusrespiration) in crop plants, and the determinants of yield potentialare under complex genetic control that result in trade-offs be-tween different options for increasing seed number, seed size, par-titioning of dry matter among different organs, crop growthduration, and so forth (Denison 2003; Sinclair et al. 2004). Con-sideration of these issues has led to calls for caution in projectingforward past achievements in yield growth as a basis for assessingfuture food security, as well as for greater urgency in the keyscientific challenges involved (Denison 2003; Cassman 2001).
8.2.2.1.2 Livestock
Livestock and livestock products are estimated to make up overhalf of the total value of agricultural gross output in industrialcountries, and about a third of the total in developing countries,but this latter share is rising rapidly (Bruinsma 2003). The globalimportance of livestock and their products is increasing as con-sumer demand in developing countries expands with populationgrowth, rising incomes, and urbanization. This rapid worldwidegrowth in demand for food of animal origin, with its accompany-ing effects on human health, livelihoods, and the environment,has been dubbed the ‘‘Livestock Revolution’’ (Delgado et al.1999). Livestock production has important implications for eco-systems and ecosystem services, as it is the single largest user ofland either directly through grazing or indirectly through con-sumption of fodder and feedgrains (Bruinsma 2003). Industriallivestock production, the most rapidly growing means of raisinglivestock, poses a range of pollution and human health problems.(See Chapter 26.) At the same time, livestock production canpromote linkages between system components (land, crops, andwater) and enables the diversification of production resources forpoor farmers (Devendra 2000).
The overall annual growth rates for livestock product outputsare summarized by region and by time period in Table 8.3. Theglobal growth rate is currently just over 2% per year and is declin-ing over time, but this masks the true dynamics of the sector (andhighlights the potential pitfalls of interpreting global-scale data),as there are large regional disparities. While growth rates in indus-trial countries, where people already enjoy adequate supplies of
................. 11432$ $CH8 10-11-05 14:55:35 PS
217Food
BOX 8.2
The Growing Use of Crops as Feed (Delgado et al. 1999)
Crops are used both as feed inputs for intensive livestock systems and increasing demand for food crops, substantially more feed grains will havefor direct or processed sources of food. Global use of cereals as feed to be imported by developing countries in the future.increased at only 0.7% per year between 1982 and 1994 despite rapid Alternatives to crops in the way of feed include household waste prod-increases in meat production. Growth rate in cereal use in industrial coun- ucts and crop residues. In developing countries, household food waste,tries was negligible, while it increased by about 4% a year in the develop- such as tuber skins, stems, and leaf tops, has traditionally been an impor-ing countries. Despite the higher growth rate, developing countries still tant feed source for backyard monogastric production in particular. Butuse less than half as much cereal for feed as industrial countries do. small-scale backyard operations are disappearing because of low returnsDuring the early 1990s, concentrated cereal feed provided between 59% to labor and increased competition from large-scale producers. Althoughand 80% of the nutrition given to animals in the industrial world. By con- each backyard operation is small, at the aggregate level such systems acttrast, cereals accounted for only 45% of total concentrate feed in South- as major transformers of waste into meat and milk. Because large opera-east Asia, the developing region with the most intensive use of feed tions are unlikely to find it cost-effective to collect small amounts of wastegrains. from many households, this source of animal feed may be underused in
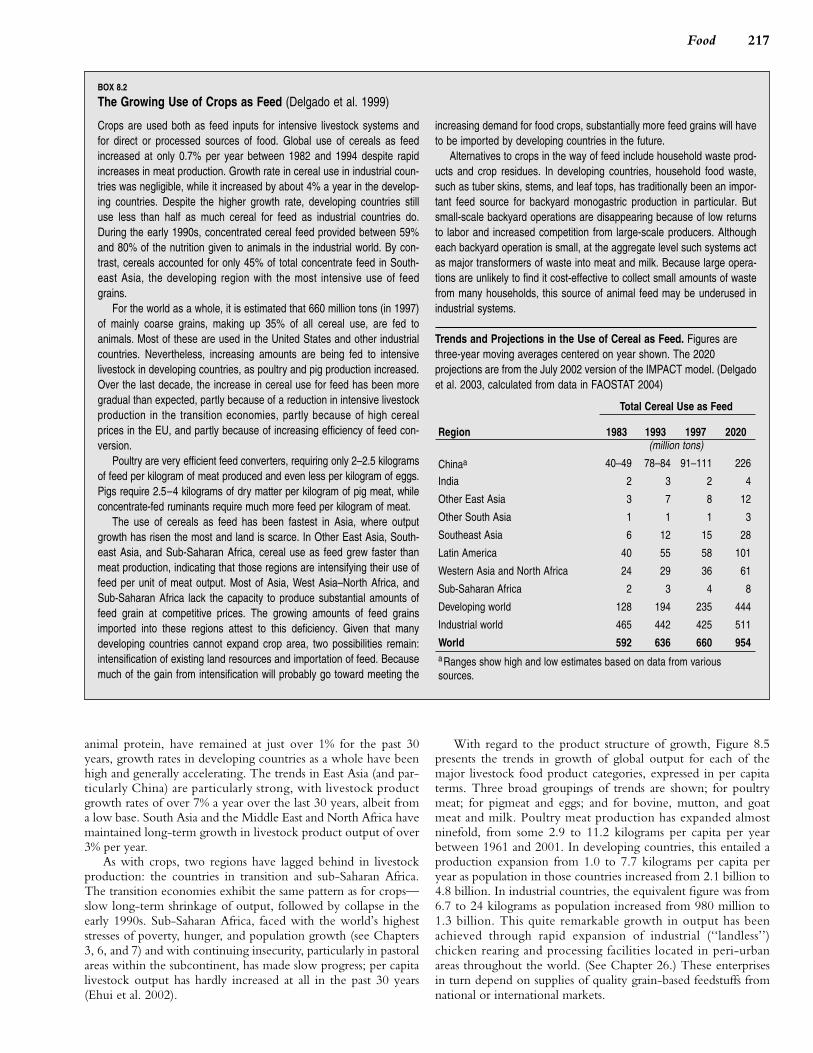
For the world as a whole, it is estimated that 660 million tons (in 1997) industrial systems.of mainly coarse grains, making up 35% of all cereal use, are fed toanimals. Most of these are used in the United States and other industrial Trends and Projections in the Use of Cereal as Feed. Figures arecountries. Nevertheless, increasing amounts are being fed to intensive three-year moving averages centered on year shown. The 2020livestock in developing countries, as poultry and pig production increased. projections are from the July 2002 version of the IMPACT model. (DelgadoOver the last decade, the increase in cereal use for feed has been more et al. 2003, calculated from data in FAOSTAT 2004)gradual than expected, partly because of a reduction in intensive livestockproduction in the transition economies, partly because of high cerealprices in the EU, and partly because of increasing efficiency of feed con-version.
Poultry are very efficient feed converters, requiring only 2–2.5 kilogramsof feed per kilogram of meat produced and even less per kilogram of eggs.Pigs require 2.5–4 kilograms of dry matter per kilogram of pig meat, whileconcentrate-fed ruminants require much more feed per kilogram of meat.
The use of cereals as feed has been fastest in Asia, where outputgrowth has risen the most and land is scarce. In Other East Asia, South-east Asia, and Sub-Saharan Africa, cereal use as feed grew faster thanmeat production, indicating that those regions are intensifying their use offeed per unit of meat output. Most of Asia, West Asia–North Africa, andSub-Saharan Africa lack the capacity to produce substantial amounts offeed grain at competitive prices. The growing amounts of feed grainsimported into these regions attest to this deficiency. Given that manydeveloping countries cannot expand crop area, two possibilities remain:intensification of existing land resources and importation of feed. Becausemuch of the gain from intensification will probably go toward meeting the
Region
Total Cereal Use as Feed
1983 1993 1997 2020(million tons)
Chinaa 40–49 78–84 91–111 226
India 2 3 2 4
Other East Asia 3 7 8 12
Other South Asia 1 1 1 3
Southeast Asia 6 12 15 28
Latin America 40 55 58 101
Western Asia and North Africa 24 29 36 61
Sub-Saharan Africa 2 3 4 8
Developing world 128 194 235 444
Industrial world 465 442 425 511
World 592 636 660 954a Ranges show high and low estimates based on data from varioussources.
animal protein, have remained at just over 1% for the past 30years, growth rates in developing countries as a whole have beenhigh and generally accelerating. The trends in East Asia (and par-ticularly China) are particularly strong, with livestock productgrowth rates of over 7% a year over the last 30 years, albeit froma low base. South Asia and the Middle East and North Africa havemaintained long-term growth in livestock product output of over3% per year.
As with crops, two regions have lagged behind in livestockproduction: the countries in transition and sub-Saharan Africa.The transition economies exhibit the same pattern as for crops—slow long-term shrinkage of output, followed by collapse in theearly 1990s. Sub-Saharan Africa, faced with the world’s higheststresses of poverty, hunger, and population growth (see Chapters3, 6, and 7) and with continuing insecurity, particularly in pastoralareas within the subcontinent, has made slow progress; per capitalivestock output has hardly increased at all in the past 30 years(Ehui et al. 2002).
PAGE 217
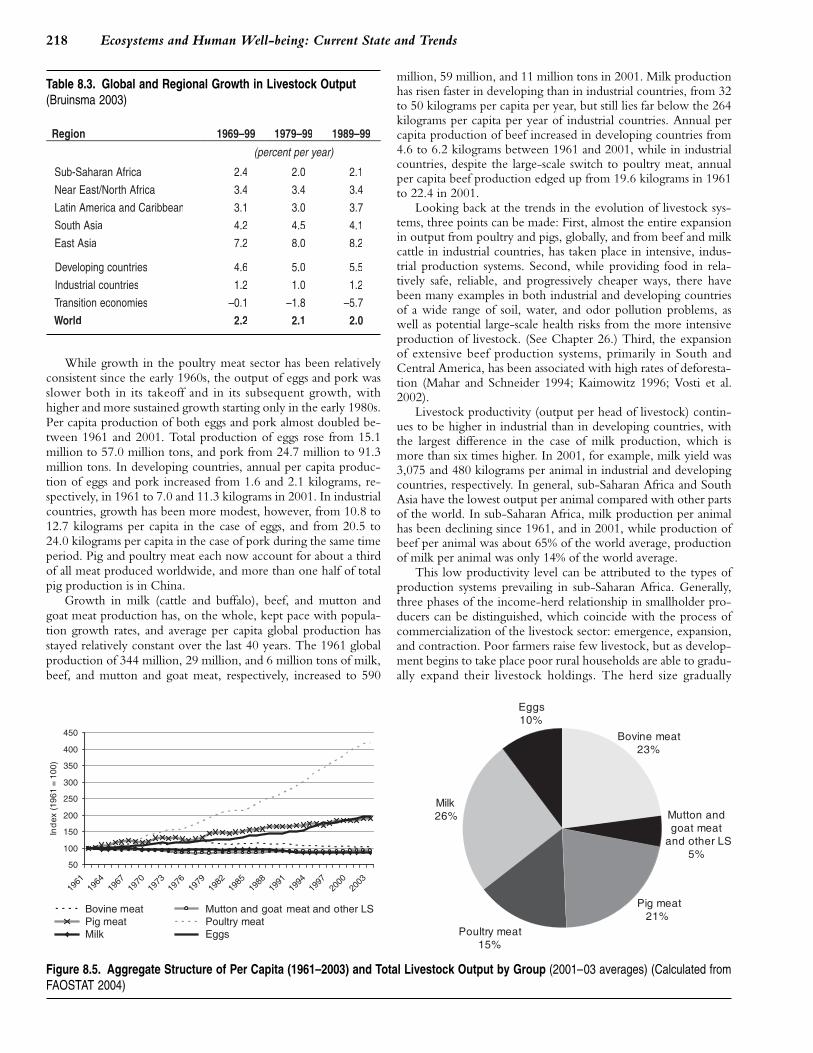
With regard to the product structure of growth, Figure 8.5presents the trends in growth of global output for each of themajor livestock food product categories, expressed in per capitaterms. Three broad groupings of trends are shown; for poultrymeat; for pigmeat and eggs; and for bovine, mutton, and goatmeat and milk. Poultry meat production has expanded almostninefold, from some 2.9 to 11.2 kilograms per capita per yearbetween 1961 and 2001. In developing countries, this entailed aproduction expansion from 1.0 to 7.7 kilograms per capita peryear as population in those countries increased from 2.1 billion to4.8 billion. In industrial countries, the equivalent figure was from6.7 to 24 kilograms as population increased from 980 million to1.3 billion. This quite remarkable growth in output has beenachieved through rapid expansion of industrial (‘‘landless’’)chicken rearing and processing facilities located in peri-urbanareas throughout the world. (See Chapter 26.) These enterprisesin turn depend on supplies of quality grain-based feedstuffs fromnational or international markets.
................. 11432$ $CH8 10-11-05 14:55:36 PS
218 Ecosystems and Human Well-being: Current State and Trends
Table 8.3. Global and Regional Growth in Livestock Output(Bruinsma 2003)
Region 1969–99 1979–99 1989–99
(percent per year)
Sub-Saharan Africa 2.4 2.0 2.1
Near East/North Africa 3.4 3.4 3.4
Latin America and Caribbean 3.1 3.0 3.7
South Asia 4.2 4.5 4.1
East Asia 7.2 8.0 8.2
Developing countries 4.6 5.0 5.5
Industrial countries 1.2 1.0 1.2
Transition economies –0.1 –1.8 –5.7
World 2.2 2.1 2.0
While growth in the poultry meat sector has been relativelyconsistent since the early 1960s, the output of eggs and pork wasslower both in its takeoff and in its subsequent growth, withhigher and more sustained growth starting only in the early 1980s.Per capita production of both eggs and pork almost doubled be-tween 1961 and 2001. Total production of eggs rose from 15.1million to 57.0 million tons, and pork from 24.7 million to 91.3million tons. In developing countries, annual per capita produc-tion of eggs and pork increased from 1.6 and 2.1 kilograms, re-spectively, in 1961 to 7.0 and 11.3 kilograms in 2001. In industrialcountries, growth has been more modest, however, from 10.8 to12.7 kilograms per capita in the case of eggs, and from 20.5 to24.0 kilograms per capita in the case of pork during the same timeperiod. Pig and poultry meat each now account for about a thirdof all meat produced worldwide, and more than one half of totalpig production is in China.
Growth in milk (cattle and buffalo), beef, and mutton andgoat meat production has, on the whole, kept pace with popula-tion growth rates, and average per capita global production hasstayed relatively constant over the last 40 years. The 1961 globalproduction of 344 million, 29 million, and 6 million tons of milk,beef, and mutton and goat meat, respectively, increased to 590
Figure 8.5. Aggregate Structure of Per Capita (1961–2003) and Total Livestock Output by Group (2001–03 averages) (Calculated fromFAOSTAT 2004)
PAGE 218
million, 59 million, and 11 million tons in 2001. Milk productionhas risen faster in developing than in industrial countries, from 32to 50 kilograms per capita per year, but still lies far below the 264kilograms per capita per year of industrial countries. Annual percapita production of beef increased in developing countries from4.6 to 6.2 kilograms between 1961 and 2001, while in industrialcountries, despite the large-scale switch to poultry meat, annualper capita beef production edged up from 19.6 kilograms in 1961to 22.4 in 2001.
Looking back at the trends in the evolution of livestock sys-tems, three points can be made: First, almost the entire expansionin output from poultry and pigs, globally, and from beef and milkcattle in industrial countries, has taken place in intensive, indus-trial production systems. Second, while providing food in rela-tively safe, reliable, and progressively cheaper ways, there havebeen many examples in both industrial and developing countriesof a wide range of soil, water, and odor pollution problems, aswell as potential large-scale health risks from the more intensiveproduction of livestock. (See Chapter 26.) Third, the expansionof extensive beef production systems, primarily in South andCentral America, has been associated with high rates of deforesta-tion (Mahar and Schneider 1994; Kaimowitz 1996; Vosti et al.2002).
Livestock productivity (output per head of livestock) contin-ues to be higher in industrial than in developing countries, withthe largest difference in the case of milk production, which ismore than six times higher. In 2001, for example, milk yield was3,075 and 480 kilograms per animal in industrial and developingcountries, respectively. In general, sub-Saharan Africa and SouthAsia have the lowest output per animal compared with other partsof the world. In sub-Saharan Africa, milk production per animalhas been declining since 1961, and in 2001, while production ofbeef per animal was about 65% of the world average, productionof milk per animal was only 14% of the world average.
This low productivity level can be attributed to the types ofproduction systems prevailing in sub-Saharan Africa. Generally,three phases of the income-herd relationship in smallholder pro-ducers can be distinguished, which coincide with the process ofcommercialization of the livestock sector: emergence, expansion,and contraction. Poor farmers raise few livestock, but as develop-ment begins to take place poor rural households are able to gradu-ally expand their livestock holdings. The herd size gradually
................. 11432$ $CH8 10-11-05 14:55:43 PS

219Food
expands with further development, but there is a point of devel-opment in many rural economies after which most farmers chooseto stop raising livestock. Beyond a certain income level, herd sizefor most households falls as productivity increases, and only a fewspecialized households evolve toward larger-scale commercial op-erations (McIntire et al. 1992).
To date, overall growth in livestock production has been suf-ficient to meet increases in demand without significant price in-creases, and relative to the long-term downward trend in pricesfor cereals, oils, and fats, the prices for livestock products haveremained relatively stable. However, there are considerable differ-ences between continents and countries in production and con-sumption, and international trade between surplus and deficitproducers has increased. Developing countries, as a group, havebecome net importers of livestock products from industrial coun-tries. Between 1990 and 2000, net imports of meat and milk todeveloping countries grew by more than 6% a year, while netimports of eggs declined by a little over 16%.
8.2.2.2 Wild Food Sources: Fisheries
Biodiversity provides a diverse range of edible plant and animalspecies that have been and continue to be used as wild sources offood, including plants (leafy vegetables, fruits, and nuts), fungi,bushmeat, insects and other arthropods, and fish (including mol-lusks and crustaceans as well as finfish) (Pimbert 1999; Koziell andSaunders 2001). Many types of wild food remain important forthe poor and landless, especially during times of famine and inse-curity or conflict, when normal food supply mechanisms are dis-rupted and local or displaced populations have limited accessother forms of nutrition (Scoones et al. 1992). Even in normaltimes, these wild land-based foods are often important in comple-menting staple foods to provide a balanced diet, and plants grow-ing as weeds may often be important in this respect (Johns andStaphit 2004; Cromwell et al. 2001; Satheesh 2000).
About 7,000 species of plants and several hundred species ofanimals have been used for human food at one time or another(FAO 1998; Pimbert 1999). Some indigenous and traditionalcommunities use 200 or more species for food (Kuhnlein et al.2001). The capacity of ecosystems to provide wild food sources isgenerally declining, as natural habitats worldwide are under in-creasing pressure and as wild plant and animal populations areexploited for food at unsustainable levels.
This section focuses on freshwater and marine fisheries, asthey are globally significant sources of wild food, and it also coversaquaculture.
During the past century, the production and consumption offish (including crustaceans and mollusks) has changed in impor-tant ways. Three trends are notable: average per capita consump-tion has increased steadily; the proportion of fish consumed atconsiderable distances from where it is harvested is growing; andan increasing number of fish stocks have been critically depletedby catch rates that exceed, often considerably, any commonly un-derstood measure of maximum sustainable yield.
During the last four decades, the per capita consumption offish as seafood increased from 9 to 16 kilograms per year. Table8.4 shows fish production and utilization over the last half of the1990s.
8.2.2.2.1 Trends in trade, commercialization, and intensification
Ninety percent of full-time fishers conduct low-intensive fishing(a few tons per fisher per year), often in species-rich tropical wa-ters of developing countries. Their counterparts in industrialcountries generally produce several times that quantity of fishing
PAGE 219
output annually, but they are much fewer, probably numberingabout 1 million in all (FAO 1999), and their numbers are declin-ing. In industrial countries, fishing is seen as a relatively dangerousand uncomfortable way to earn an income, so as a result fishersfrom economies in transition or from developing countries arereplacing local fishers in these nations.
Nearly 40% of global fish production is traded internationally(FAO 2002). Most of this trade flows from the developing worldto industrial countries (Kent 1987; FAO 2002). Many developingcountries are thus trading a valuable source of protein for an im-portant source of income from foreign revenue, and fisheries ex-ports are extremely valuable compared with other agriculturalcommodities. (See Figure 8.6.)
Although fish are consumed in virtually all societies, the levelsof consumption differ markedly. Per capita consumption is gener-ally higher in Oceania, Europe, and Asia than in the Americasand Africa. Small island countries have high rates of consumption;land-locked countries often low levels. Fish is eaten in almost allsocial strata, due to the large variety of fish species and productsderived from them, ranging from the very exclusive and expen-sive and rare to the cheap and currently still plentiful.
8.2.2.2.2 Overfishing and sustainability
After 50 years of particularly rapid expansion and improving tech-nological efficiency in fisheries, the global state of the resources iscausing widespread concern. Between 1974 and 1999, the num-ber of stocks that had been overexploited and were in need ofurgent action for rebuilding increased steadily and by 1999 stoodat 28% of the world’s stocks for which information is available.While the percentage of overexploited stocks appears to have sta-bilized since the late 1980s, the latest information indicates thatthe number of fully exploited stocks has been increasing in recentyears while the number of underexploited stocks has been de-creasing steadily—from an estimated 40% in 1970 to 23% in 2004.The most recent information available from FAO suggests thatjust over half of the wild marine fish stocks for which informationis available are fully or moderately exploited, and the remainingquarter is either overexploited or significantly depleted.
The Atlantic Ocean was the first area to be fully exploited andoverfished, and fish stocks in the Pacific Ocean are almost allcurrently fully exploited. There still seems to be some minor po-tential for expansion of capture fisheries in the Indian Ocean andthe Mediterranean Sea, although this may be due to environmen-tal changes including eutrophication. Phytoplankton plumes neardensely populated areas and riverine plumes have been associatedwith higher levels of fisheries productivity (Caddy 1993).
At the beginning of the twenty-first century, the biologicalcapability of commercially exploited fish stocks was probably at ahistorical low. FAO has reported that about half of the wild ma-rine fish stocks for which information is available are fully ex-ploited and offer no scope for increased catches (FAO 2002). Ofthe rest, 25% are underexploited or moderately exploited and theremaining quarter are either overexploited or significantly de-pleted.
Although information on catches from inland fisheries is lessreliable than for marine capture fisheries, it appears that freshwaterfish stocks are recovering somewhat from depletion in the North-ern Hemisphere, while the large freshwater lakes in Africa arefully exploited and in parts overexploited. Some fish species ex-hibit more dramatic threshold effects, appearing less able to re-cover than others.
Accentuating the ecological implications of the increase incapture fisheries production is an important trend in catch com-
................. 11432$ $CH8 10-11-05 14:55:44 PS

220 Ecosystems and Human Well-being: Current State and Trends
Table 8.4. World Fishery Production and Utilization, 1996–2001
Production and Utilization 1996 1997 1998 1999 2000 2001a
(million tons)ProductionInland
Capture 7.4 87.6 8.0 8.5 8.8 8.8
Aquaculture 15.9 17.5 18.5 20.2 21.4 22.4
Total inland 23.3 25.0 26.5 28.7 30.2 31.2
Marine
Capture 86.0 86.4 79.2 84.7 86.0 82.5
Aquaculture 10.8 11.2 12.0 13.3 14.1 15.1
Total marine 96.9 97.5 91.3 98.0 100.2 97.6
Total capture 93.5 93.9 87.3 93.2 94.8 91.3
Total aquaculture 26.7 28.6 30.5 33.4 35.6 37.5
Total production 120.2 122.5 117.8 126.7 130.4 128.8
UtilizationHuman consumption 88.0 90.8 92.7 94.5 96.7 99.4
Non-food uses 32.2 31.7 25.1 32.2 33.7 29.4
(kilograms)
Per capita food fish supply 15.3 15.6 15.7 15.8 16.0 16.2
a Denotes projected data (Fisheries Centers, UBC).
Figure 8.6. Developing-Country Net Exports of Fish and Se-lected Agricultural Commodities, 1982, 1992, and 2002 (FAO2004)
position—over the past 30 years the average trophic level of fishlanded from marine and freshwater ecosystems has declined. (SeeBox 8.3.) Trophic level decline is the progressive change in catchcomposition, in the case of marine systems, from a mixture of toppredatory fish such as sharks and saithe, mid-trophic level fish suchas cods and herrings, and a few lower trophic level animals such asshrimp to a catch of a few mid-trophic species such as whiting andhaddock and many low-trophic species such as shrimp. Thischange is a result of three phenomena: the expansion of fisheriesfrom benthic coastal production areas to the pelagic open ocean;the expansion of fisheries from the Northern Hemisphere (domi-nated by large shelves and bottom fish) to the Southern Hemi-sphere (dominated by upwelling systems and pelagic fish); andoverfishing, possibly leading to a local replacement of depletedlarge predators by their smaller preys. This change in catch compo-sition is sometimes called ‘‘fishing down marine food webs.’’
PAGE 220
BOX 8.3
Trophic Level
One way to understand the structure of ecosystems is to arrange themaccording to who eats what along a food chain. (See Figure.) Each linkalong the chain is called a trophic level. Levels are numbered accord-ing to how far particular organisms are along the chain—from the pri-mary producers at level 1 to the top predators at the highest level.Within marine systems, large predators such as sharks and saithe areat a high trophic level, cod and sardines are in the middle, and shrimpare at a low trophic level, with microscopic plants (mainly phytoplank-ton) at the bottom sustaining marine life (Pauly et al. 2003).
................. 11432$ $CH8 10-11-05 14:55:47 PS

221Food
8.2.2.2.3 Freshwater fisheries and food security
Approximately 10% of wild harvested fish are caught from inlandwaters, likely a smaller proportion than in the early twentiethcentury. However, it is more difficult to measure freshwater fish-eries catches than marine catches. They may be underreported byas much as a factor of two because informal fisheries activities,such as subsistence fisheries, are not accurately accounted for innational statistics (Coates 1995). Fish production from inland wa-ters is almost entirely finfish, with negligible amounts of crusta-ceans or mollusks, except in localized areas. As shown in Figure8.7, the mean tropic level of freshwater fisheries landings tends tobe lower than that of marine catches.
The socioeconomic value of freshwater fish catches is espe-cially high. Freshwater fish tend to be consumed in their entirety,with minimal wastage, providing key sources of protein for localcommunities. And in addition to their nutritional value, fresh-water fisheries provide livelihoods for low-income and resource-poor groups. The high level of artisanal and informal activity, re-lying on labor-intensive catching methods, contributes to foodsecurity for vulnerable groups, including women and children.
Figure 8.7. Decline in the Trophic Level of Fishery Catch,1970–95 (Pauly et al. 1998)
8.2.2.2.4 Aquaculture
Although aquaculture is an ancient activity, it is only during thepast 50 years that it has become a globally significant source offood. In 2002 it contributed approximately 27% of fish harvestedand 40% (by weight) of all fish consumed as food. However, thevariety of supply from aquaculture is well below that of capturefisheries: only five different Asian carp species account for about35% of world aquaculture production, and inland waters currentlyprovide about 60% of global aquaculture outputs.
The distinction between capture fisheries and aquaculture infresh waters can be unclear. For example, extensive aquaculturein China includes catches from stocked rivers and lakes (whichare substantial). While expanding aquaculture production cantake the pressure off wild fisheries resources in some cases, inother cases the opposite is true (Naylor et al. 2000), as cultivationof carnivorous species can require large inputs of wild fish forfeed. Overall, catches of wild fish for non-food uses are increasingfaster than catches for food.
8.3 Food Provision and BiodiversityThis section reviews some of the key impacts of the provision offood on biodiversity. Since food provision involves the purposive
PAGE 221
management or exploitation of ecosystems to enhance food pro-ductivity, there are often trade-offs involved with other ecosystemservices. In the past, when food production activities affected asmaller share of Earth’s land and ocean bodies, and overall de-mand for ecosystem services supported by biodiversity was lessthan today, many of these trade-offs were not recognized or werenot considered to be important. Now cultivated systems accountfor about 27% of the world’s land surface and for a much highershare of habitable land (Wood et al. 2000).
The most direct impact of food provision on biodiversity hasbeen through habitat conversion: around 43% of tropical and sub-tropical dry and monsoon forests and 45% of temperate broadleafand mixed forests globally have been converted to croplands.Huge areas of the world are now planted to a small number ofcrop species or covered by modified pastures. In addition, rapidincreases in coastal aquaculture have lead to the loss of mangroveecosystems. Though future rates of conversion are expected to bemuch lower in absolute terms than historically, the major loca-tions of agricultural expansion have frequently coincided withremnants of natural habitats with high biodiversity value (Myerset al. 2000). And the construction of roads and other infrastruc-ture (such as irrigation canals), which are seen as key to promotingagricultural development and meeting the Millennium Develop-ment Goals, tends to dissect the landscape and to further limit themovement of wildlife and the dissemination of plant species.
Second, food provision affects wild biodiversity through itsdemand for inputs other than land, most notably water and nutri-ents, and through the pollution of ecosystems with pesticides andexcess nutrients. Irrigated agriculture is a major user of fresh water(see Chapter 7), which, together with the direct loss of wetlandhabitats from conversion and the pollution of inland waters fromexcess nutrients, has a major negative impact on inland water bio-diversity. (See Chapter 20.) As a consequence, wild fish popula-tions in inland waters can be greatly reduced, often having thegreatest negative impacts on the poor (Bene et al. 2003). Despiteincreases in water use efficiency, total water demand for agricul-ture is increasing and in many regions is projected to outstripsustainable supplies over the coming decades. (See Chapter 7.)
Agriculture is the major consumer of reactive nitrogen, butonly a fraction this is used in plant growth and retained in foodproducts. The excess leads to biodiversity loss and reduced waterquality in inland waters and coastal systems through eutrophica-tion and to terrestrial plant diversity losses through aerial deposi-tion. (See Chapters 12, 19, and 20.) Despite modest increases innitrogen use efficiency, demand for fertilizer is projected to in-crease by 65% by 2050, leading to a doubling of current rates ofN aerial deposition and N loading in waterways (Galloway et al.2004).
Of the pesticides in widespread use, the most important effectson biodiversity are from persistent organic pollutants, since thesehave effects on large spatial and temporal scales. (See Chapter 25.)Many of the most persistent chemicals are being phased outthrough appropriate legislation and replaced by ones with fewerenvironmental impacts. However, the total use of pesticides is stillincreasing, and the poor regulatory environments in many coun-tries mean that highly toxic chemicals continue to be used un-safely.
A third aspect of the impact of food provision on biodiversityconcerns the effects within agricultural production systems andlandscapes. Since agricultural landscapes (areas containing a sig-nificant share of cropland and pasture) now occupy 38% of Earth’sland area, the maintenance of biodiversity within them is an im-portant part of any overall strategy for biodiversity conservation.Even in relatively intensely farmed areas, cultivated crop produc-
................. 11432$ $CH8 10-11-05 14:55:49 PS

222 Ecosystems and Human Well-being: Current State and Trends
tion typically only covers a portion of the actual land areas, andmuch of the rest of the land can serve as habitat for wild species, ifappropriately managed. However, in many agricultural landscapeswild biodiversity appears to be declining. For example, the pan-European bird index for farmland birds shows a declining trendsince 1980 (see Chapter 26), in contrast to the situation for overallpan-European bird index.
One positive landscape-wide impact noted in sub-Saharan Af-rica, South Asia, and Southeast Asia is the trend of growing moretrees in agricultural landscapes, for a wide variety of purposes.Trees stabilize and enhance soils, contribute in themselves to bio-diversity, but also play host to a variety of birds and insects. Man-agement practices can have major impacts on such biodiversityand the services that it provides for nutrient cycling, pest control,and pollination (Chapter 26), with positive spillovers for agricul-tural production.
The spread of invasive alien species is a fourth way that foodprovision affects biodiversity. While most of the world’s majorcrops species are ‘‘alien’’ in the sense that their main productionareas are outside their areas of origin (with notable exception ofrice, the world’s most important crop), none of the major cropplants are invasive. The greatest ecological risks probably arisefrom the spread of alien aquatic species. (See Chapter 20.) Theintroduction of the Nile perch in Lake Victoria, for example, ledto the extinction of a large number of cichlid fish species.
Tilapia is the second most important fish species for aquacul-ture. Like carp, tilapia is vegetarian, and therefore tilapia-basedaquaculture avoids many of the negative effects of carnivorousspecies. However, escapes into surrounding freshwater ecosystemsmay disrupt local species populations. Besides the direct use ofalien species for food production, trade in food products is a majorpotential pathway for the introduction of pests and diseases, andmost countries have quarantine systems to address this threat(FAO/NACA 2001).
Finally, when food provision is from wild sources, overexploi-tation and certain fishing practices can have major impacts onspecies composition. Overexploitation has been implicated as theleading threat to the world’s marine fishes and has led to a declinein the average trophic level of catches, as described earlier. Over-fishing affects not only the target species but also habitats, foodwebs, and non-target species. High-impact fishing (including bot-tom trawling, long-lining, gill netting, and dynamite fishing)causes damage to the biodiversity of sensitive habitats, such ascold-water reefs, tropical coral reefs, and seamounts, and to mi-gratory seabirds (Pauly et al. 1998, 2003; Jackson et al. 2001). (SeeChapter 18.)
Historically, many terrestrial species have become extinct dueto hunting, and there are currently 250 mammal species, 262 birdspecies, and 79 amphibian species listed as threatened due to over-exploitation for food (Baillie et al. 2004). In some groups of spe-cies and in some ecosystems, overexploitation is a particularlyserious threat. In eastern and southeastern Asia, for example, al-most all species of turtles and tortoises are in serious decline as aresult of harvesting for human consumption and medicine, mainlyin China (Baillie et al. 2004). In some cases overexploitation ofplants, particularly medicinal plants, is also threatening many pop-ulations.
Food insecurity can have very severe consequences for localbiodiversity. Famines, conflict, civil unrest, floods, and other nat-ural disasters can decimate local food production and break foodsupply chains. In such cases, people are often forced to resort toexploitation of local wild plant and animal sources of food, oftenunsustainably.
PAGE 222
8.4 Drivers of Change in Food ProvisionThe MA defines a driver as ‘‘any natural or human-induced factorthat directly or indirectly causes a change in an ecosystem.’’ (SeeChapter 3.) In this section, that definition is limited to factorscausing change in a specific ecosystem service: food provision.
Increased understanding of the drivers of change in food pro-vision can generate insights into potential intervention opportuni-ties for accelerating desired change and mitigating or adapting toless welcome trends. The discussion of drivers here is organizedaround two key dimensions. The first is the distinction recog-nized by the MA conceptual framework between indirect anddirect drivers of ecosystem change. The second is the distinctionbetween factors influencing food demand as opposed to thoseshaping food supply.
Assessing the impact of drivers for both demand and supply isparticularly important in the case of food. The demand for foodhas long since outstripped the capacity of nature to provide itunaided, and for several millennia humans have transformed natu-ral ecosystems for the singular purpose of obtaining more accessi-ble, reliable, and productive sources of food to meet growingdemands (Evans 1998; Smith 1995). The factors driving thesechanging demands must therefore be examined as a proper con-text for examining drivers of change in food provision.
Emerging patterns of food consumption provide early signalsof the shifts in stresses on specific ecosystems in specific locations.In subsistence-oriented food production systems there is stronggeographical coincidence of food consumption and ecosystemstress. In the increasingly globalized commodity trade and foodindustry sectors, the consumption-driven footprint of productionon ecosystems might be several continents or oceans removedfrom the sites where consumption takes place.
Chapter 3 in this volume and Chapter 7 in the Scenarios vol-ume contain information that is complementary to this section,particularly with regard to the treatment of indirect drivers suchas technology, demographic trends, and economic growth. Chap-ter 26 in this volume also provides a brief summary with regardto the agricultural sector in exemplifying the important role ofscience and technology as a driver of change. That material is notrepeated here, but appropriate cross-references are made.
Table 8.5 presents an assessment of the key indirect drivers offood provision, using separate grouping of drivers for food de-mand and supply. Table 8.6 presents the key direct (supply-side)drivers. For each driver the Tables provide a qualitative assessmentof its rate of change and a judgment of its relevance in termsof influencing food provision. These variables are assessed bothretrospectively over the past 50 years and for current and pro-jected trends (up to 2015). Finally, to provide a slightly morenuanced perspective, these driver-specific assessments are pro-vided for both industrial (In) and developing (Dg) regions in twoadjacent rows. In the subsections that follow, every driver is notdescribed in detail, but the key drivers where some relevant dataexist are dealt with selectively. Trends in some important driversare shown in Figure 8.8.
8.4.1 Indirect Drivers
8.4.1.1 Drivers of Food Demand
Eight factors are identified here that shape the demand for food.The first four of these (population growth, urbanization, eco-nomic growth, food prices) encompass the major demographicand economic trends that condition the demand for food andspecific types of food in the aggregate. The remaining four factors(food marketing, food-related information, consumer attitudes to
................. 11432$ $CH8 10-11-05 14:55:50 PS

223Food
Table 8.5. Indirect Drivers of Food Provision (compiled by authors from assessment of literature and evidence)
Drivers
Past 50 Years Current Trends
Remarks/ExamplesChangeRelevanceof Driver Change
Relevanceof Driver
Demand factorsPopulation growth and structure
InDg
+/+++++
medhigh
–/++/+++
low/medmed/v. high
Europe static/shrinking; North America still growingEast Asia slow; SSA, WANA, SA highest growth rates
Urbanization InDg
++ +++
medmed
–/+++/+++
lowmed/high
70–80% urbanized40% urbanized, 3%/yr growth, 80% of global urban total
Income growth InDg
+++/+++
med/highhigh
++–/+++
med/highhigh
slow to medium long-term growthsome negative, esp. SSA; strong growth: East Asia
Food prices InDg
–––
medhigh
–/o–/+
low/medmed/high
well-integrated markets, productivity growthweaker markets, lower productivity growth
Food marketing:branding and advertising
InDg
+++
medlow
++++/++
medmed
major diet changes are through switching brands/productless in poor rural areas, but increasing, e.g., radio, tv
Diet and health information
InDg
++o/+
medlow
++/++++/++
med/highmed
increased information on the healthfulness or otherwiserelated to specific food types or food processing
Consumer concerns with production context
InDg
xo/x
lowlow
xxo/x
low/medlow
concerns with environmental, food safety, child labor,equity, GMOs, animal welfare, etc. issues
Dietary (and lifestyle) preferences
InDg
o/xx/xxx
low/medmed/high
o/xxx
low/medmed/high
largely consequence of marketing, diet, and health infolargely consequence of urbanization and income growth
Consumer demands for mini-mum produce grades, stan-dards, labels
lnDg
++o/+
med/highlow
+++o/+++
high/v. highmed/v. high
most producers conform; contract farming on the rise major challenge to poor smallholders
Supply factorsInvestments in infrastructure and institutions
InDg
++–/+
medhigh
+–/+
medvery high
industrial countries maintained investments in high stockdeveloping countries often underinvesting in low stock
Investments in science and technology
InDg
++o/+
highhigh
+/++–/+
highvery high
biotechnology: increasing, conventional: stable/declinewidening gap between industrial and developing R&D
Domestic price policies (e.g., producer subsidies, price controls)
InDg
++++
med/highmed/high
+++
medvery high
powerful farm lobbies resist support reduction policies often favor urban consumer
International trade regimes and regulations (e.g., WTO)
InDg
+o/+
medlow/med
+++/++
medhigh
limited incentives for industrial-country concessionsgrowing incentives developing countries to seek change
Regulatory environment for pro-duction practices
InDg
+o/+
medlow
+++/++
med/highmed
regulatory pressures on effluents, animal welfare, etc.less regulation/enforcement
Food industry integration andfood retailing practices
InDg
+++o/+
medmed
+/+++/++
medhigh
increased attention to on-farm standards and food safetyincreased incentives for smallholder collective marketing
Prices of produce and inputs C/WIn/Dg
– –/+–/–
highhigh
o/++–/–
med/highhigh/v. high
prices increasing with scarcity of wild food sources real prices declining; raise productivity to compete
Access to information, technolo-gy and credit, markets
InDg
++o/+
highhigh
+++/++
very highvery high
growing ICT role; weather/price forecasts, creditcredit is a major constraint; ICT role growing fast
Level of market access/integra-tion
InDg
++–/+
high/v. highhigh
+–/++
highvery high
more mature and integrated; lower transactions costs oftenpoor infrastructure, institutions; high costs
Insecurity and instability InDg
o–/+
very lowv. high )(loc)
o–/++
very lowv. high (loc)
not a significant issue; FSU a possible exception locallycritical loss of assets, resources
Key:In – industrial-country grouping; Dg – developing-country groupingIncreases: + low; ++ medium; +++ high; decreases: – low, – – medium, – – – high; – –/+ indicates a range from – – to +Change (no sign): x low, xx medium, xxx high, o no change.C/W: cultivated/wildICT: information and communication technologies
PAGE 223................. 11432$ $CH8 10-11-05 14:55:51 PS

224 Ecosystems and Human Well-being: Current State and Trends
Table 8.6. Direct Drivers of Food Provision (compiled by authors from assessment of literature and evidence)
Drivers
Past 50 Years Current Trends
Remarks/Examples ChangeRelevanceof Driver Change
Relevanceof Driver
Increasing climate variability and long-term climate change
InDg
+++
lowlow/med
+++
low/medmed/high
current and projected changes often low/positiveapparent increases in variability/extremes; high/neg
Area expansion of cropland, pasture, fishing grounds
InDg
+++
low/medmed/high
–/++/++
lowlmed/high
little available unexploited area; some are in declineforest/habitat loss, urban growth loss
Intensification of production (e.g., seeds, irrigation, fertilizers)
InDg
++++/++
med/highhigh
+++/++
medvery high
main source of growth in food outputmixed; sustainable increases critical for SSA
Degradation of underpinningresource stocks
InDg
++– – –/+
med very high
o/+– – –/+
med very high
overfishing of marine fisheries; agrobiodiversity loss major impact on soil degradation, wild food sources
Pest and disease incidence and adaptation
InDg
o/+o/++
med/highhigh
–/+o/++
med high
extensive (regulated) pesticide use; GM crops (US)greater pressures, less regulation; IPM increasing
Key:In – industrial-country grouping; Dg – developing-country grouping.Increases: + low, ++ medium, +++ high; decreases: – low, – – medium, – – – high; – –/+ indicates a range from – – to + No change: o
Figure 8.8. Trends in Selected Drivers of Food Provision World-wide, 1961–2001 (FAOSTAT 2004; World Bank 2003)
production practices, and diet and lifestyle preferences) are oftenmore subtle expressions of the interplay of the previous threedrivers but are increasingly shaping the structure of food con-sumption. Finally, these trends are drawn together in the para-digm of the ‘‘diet transition’’ (Popkin 1993, 1998; WHO 2003b).
8.4.1.1.1 Population growth and age structure
Between 1961 and 2001 the major driver of growth in total foodconsumption was population growth. Global population doubledin this time period, from just over 3 billion to 6.1 billion, whilethe apparent consumption of calories per person increased on av-erage by around 24% (FAOSTAT 2004). But from a global per-spective the central role of population growth as a driver of fooddemand has started to decline, significantly in some regions of theworld. Population growth rates, which peaked at 2.1% per year
PAGE 224
in the late 1960s, had fallen to around 1.35% (or 78 million addi-tional people) per year by the turn of the millennium (UNDP2003). This still represents a daunting food security and humani-tarian challenge, as approximately 90% of this increase is takingplace in developing countries. Around half of the total populationincrease in developing countries will occur in sub-Saharan Africaand South Asia, where the incidence of hunger is already highand, according to estimates for 2000–02, increasing in absoluteterms (FAOSTAT 2004; Bruinsma 2003; FAO 2004a).
By contrast, in Western Europe, transition countries, and EastAsia, population growth is extremely low and in some cases nega-tive. As a consequence of lower fertility rates and increased lifeexpectancy, typical of richer countries, the average age of individ-uals in such countries is increasing. Conversely, countries withhigher fertility rates, which are also often poorer, have youngerage structures. (See Chapter 3.)
While population size and growth rates have direct conse-quences for food needs and the required resilience of food pro-duction systems, age structure has more subtle impacts. One suchimpact is that energy and diet diversity requirements are age- (andsex-) dependent and, for example, increase for mothers duringpregnancy and lactation. Furthermore, there is evidence of differ-ences in food consumption according to age in the United States(Blisard and Blaylock 1993) and Japan (Mori and Gorman 1999).For example, U.S. and Japanese studies found older people to beconsuming more fruit, as well as eating more meals at home.
8.4.1.1.2 Urbanization
Urbanization has proceeded at such a pace that globally, urbandwellers will outnumber rural populations by around 2007. High-income countries currently have populations that are 70–80%urban, and the same pattern is being seen as development prog-resses elsewhere (such as in Latin America and the Caribbean).The proportion of those in developing countries who live in citieshas doubled since 1960 from 22% to over 40%. This share is ex-
................. 11432$ $CH8 10-11-05 14:55:52 PS
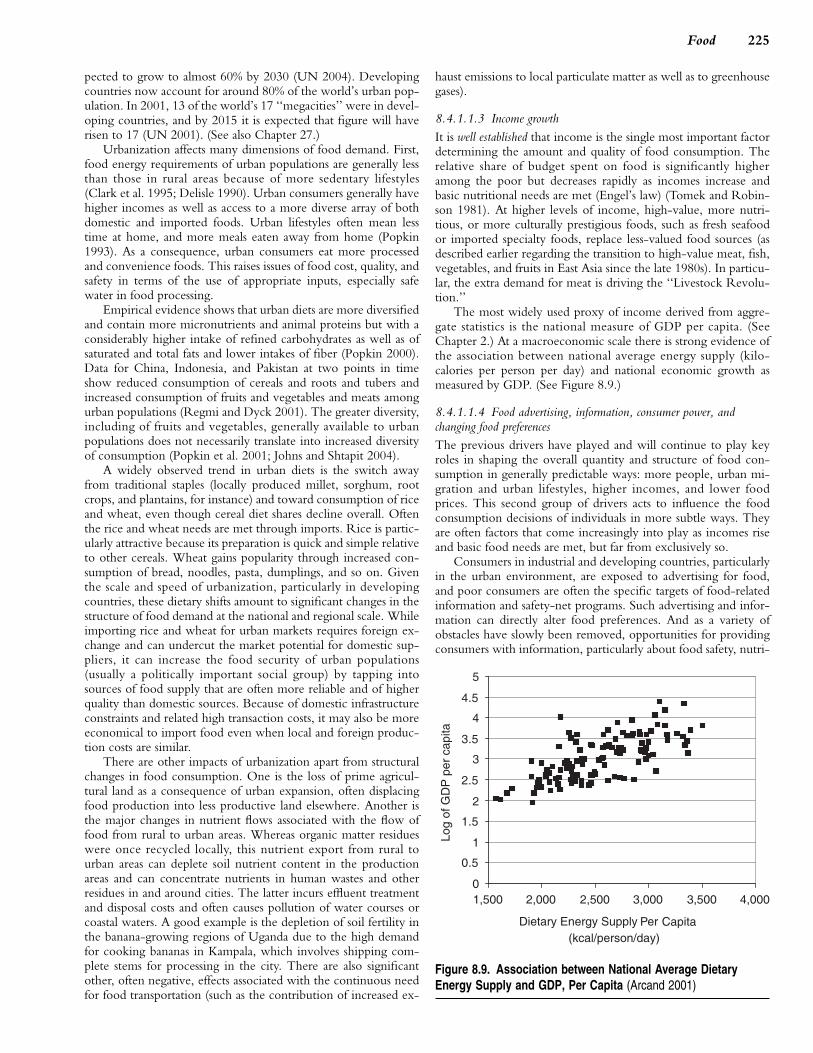
225Food
pected to grow to almost 60% by 2030 (UN 2004). Developingcountries now account for around 80% of the world’s urban pop-ulation. In 2001, 13 of the world’s 17 ‘‘megacities’’ were in devel-oping countries, and by 2015 it is expected that figure will haverisen to 17 (UN 2001). (See also Chapter 27.)
Urbanization affects many dimensions of food demand. First,food energy requirements of urban populations are generally lessthan those in rural areas because of more sedentary lifestyles(Clark et al. 1995; Delisle 1990). Urban consumers generally havehigher incomes as well as access to a more diverse array of bothdomestic and imported foods. Urban lifestyles often mean lesstime at home, and more meals eaten away from home (Popkin1993). As a consequence, urban consumers eat more processedand convenience foods. This raises issues of food cost, quality, andsafety in terms of the use of appropriate inputs, especially safewater in food processing.
Empirical evidence shows that urban diets are more diversifiedand contain more micronutrients and animal proteins but with aconsiderably higher intake of refined carbohydrates as well as ofsaturated and total fats and lower intakes of fiber (Popkin 2000).Data for China, Indonesia, and Pakistan at two points in timeshow reduced consumption of cereals and roots and tubers andincreased consumption of fruits and vegetables and meats amongurban populations (Regmi and Dyck 2001). The greater diversity,including of fruits and vegetables, generally available to urbanpopulations does not necessarily translate into increased diversityof consumption (Popkin et al. 2001; Johns and Shtapit 2004).
A widely observed trend in urban diets is the switch awayfrom traditional staples (locally produced millet, sorghum, rootcrops, and plantains, for instance) and toward consumption of riceand wheat, even though cereal diet shares decline overall. Oftenthe rice and wheat needs are met through imports. Rice is partic-ularly attractive because its preparation is quick and simple relativeto other cereals. Wheat gains popularity through increased con-sumption of bread, noodles, pasta, dumplings, and so on. Giventhe scale and speed of urbanization, particularly in developingcountries, these dietary shifts amount to significant changes in thestructure of food demand at the national and regional scale. Whileimporting rice and wheat for urban markets requires foreign ex-change and can undercut the market potential for domestic sup-pliers, it can increase the food security of urban populations(usually a politically important social group) by tapping intosources of food supply that are often more reliable and of higherquality than domestic sources. Because of domestic infrastructureconstraints and related high transaction costs, it may also be moreeconomical to import food even when local and foreign produc-tion costs are similar.
There are other impacts of urbanization apart from structuralchanges in food consumption. One is the loss of prime agricul-tural land as a consequence of urban expansion, often displacingfood production into less productive land elsewhere. Another isthe major changes in nutrient flows associated with the flow offood from rural to urban areas. Whereas organic matter residueswere once recycled locally, this nutrient export from rural tourban areas can deplete soil nutrient content in the productionareas and can concentrate nutrients in human wastes and otherresidues in and around cities. The latter incurs effluent treatmentand disposal costs and often causes pollution of water courses orcoastal waters. A good example is the depletion of soil fertility inthe banana-growing regions of Uganda due to the high demandfor cooking bananas in Kampala, which involves shipping com-plete stems for processing in the city. There are also significantother, often negative, effects associated with the continuous needfor food transportation (such as the contribution of increased ex-
PAGE 225
haust emissions to local particulate matter as well as to greenhousegases).
8.4.1.1.3 Income growthIt is well established that income is the single most important factordetermining the amount and quality of food consumption. Therelative share of budget spent on food is significantly higheramong the poor but decreases rapidly as incomes increase andbasic nutritional needs are met (Engel’s law) (Tomek and Robin-son 1981). At higher levels of income, high-value, more nutri-tious, or more culturally prestigious foods, such as fresh seafoodor imported specialty foods, replace less-valued food sources (asdescribed earlier regarding the transition to high-value meat, fish,vegetables, and fruits in East Asia since the late 1980s). In particu-lar, the extra demand for meat is driving the ‘‘Livestock Revolu-tion.’’
The most widely used proxy of income derived from aggre-gate statistics is the national measure of GDP per capita. (SeeChapter 2.) At a macroeconomic scale there is strong evidence ofthe association between national average energy supply (kilo-calories per person per day) and national economic growth asmeasured by GDP. (See Figure 8.9.)
8.4.1.1.4 Food advertising, information, consumer power, andchanging food preferencesThe previous drivers have played and will continue to play keyroles in shaping the overall quantity and structure of food con-sumption in generally predictable ways: more people, urban mi-gration and urban lifestyles, higher incomes, and lower foodprices. This second group of drivers acts to influence the foodconsumption decisions of individuals in more subtle ways. Theyare often factors that come increasingly into play as incomes riseand basic food needs are met, but far from exclusively so.
Consumers in industrial and developing countries, particularlyin the urban environment, are exposed to advertising for food,and poor consumers are often the specific targets of food-relatedinformation and safety-net programs. Such advertising and infor-mation can directly alter food preferences. And as a variety ofobstacles have slowly been removed, opportunities for providingconsumers with information, particularly about food safety, nutri-
P Capita
Figure 8.9. Association between National Average DietaryEnergy Supply and GDP, Per Capita (Arcand 2001)
................. 11432$ $CH8 10-11-05 14:55:56 PS

226 Ecosystems and Human Well-being: Current State and Trends
tion, and health have increased. At the same time, however, localand traditional knowledge that underpin traditional diets and cui-sine is often in decline (Johns and Sthapit 2004).
Public information media—radio stations, newspapers, andtelevision channels as well as public service access points such asclinics, schools, churches—are increasingly being used as cost-effective means of providing food and nutrition information tothe public. Messages are varied, from direct commercial advertis-ing to important public health information, such as the advantagesof breast-feeding or the existence of contaminated food supplieslocally. In richer countries, this phenomenon is most apparentwith regard to the high levels of consumer interest and credencein information concerning health-related or weight-control-related attributes of food. While the latter are often passing fads,they do have significant impacts on food production. The currentattention being given to low-carbohydrate diets for weight loss,for example, has had a measurable increase in demand for whitemeats, fish, and eggs and a measurable reduction in demand forwheat-flour based products and, in the United States, tomatoes (alarge share of which are grown for tomato paste in pastas andpizzas).
In the transition to lifestyles more characteristic of industrialsocieties, retaining a strong traditional food system in which diethas recognized health, cultural, and ecological roles has allowedsome countries to reduce the often concomitant increases inchronic noncommunicable diseases (Popkin et al. 2001). Asianand Mediterranean diets (Trichopolulou and Vaasiloppoulou2000) provide the clearest examples. Traditional societies oftensee food, medicine, and health as interrelated. Food may havestrong symbolic and religious value and is highly associated withcultural identity and social well-being (Etkin 1994; Johns 1990;Johns and Sthapit 2004).
Trade liberalization and the increased role of transnationalfood companies, urbanization, and migration, combined with theequalizing effects of rising incomes, has led to convergence be-tween diets internationally. Yet cultural and religious factors ap-pear to limit such convergence and to help retain dietary diversity(Bruinsma 2003).
8.4.1.1.5 The ‘‘diet transition’’Excessive consumption, particularly of some food types, has beenassociated with the growing phenomena of excessive body weightand obesity and with the associated health risks. Urbanization andsocioeconomic changes have resulted in diets that are higher inenergy and lower in diversity of fruits and vegetables than thoseconsumed historically. As a consequence, many countries nowface a ‘‘double burden’’ of diet-related disease: the simultaneouschallenges of increased morbidity and susceptibility to communi-cable diseases among undernourished populations and increasedincidence of chronic diseases associated with the overweight andobese (WHO 2003a; Ezzati et al. 2002). The pathway from tradi-tional rural diets to those of increasingly urban and affluent socie-ties and its attendant implications for nutrition and health has beendubbed the nutrition transition or the diet transition (Popkin1993; Smil 2000; Receveur et al. 1997). (See Box 8.4.) The diettransition can be viewed as the integration of many of the individ-ual consumption-related drivers just described, having both sig-nificant human and ecosystem health outcomes.
8.4.1.2 Drivers of Food Supply
8.4.1.2.1 Investments in agricultural research and developmentIt is well established that technological innovation is a major driverof increased agricultural productivity and in many cases is now
PAGE 226
the major source of increased productivity (Evenson et al. 1999;Acquaye et al. 2003; Roe and Gopinath 1998; Ruttan 2002). Inturn, a major indirect driver of changes in food production sys-tems has been the flow of innovations arising from investments inagricultural research and development. Worldwide, public invest-ments in agricultural research nearly doubled in inflation-adjustedterms, from an estimated $11.8 billion (in 1993 dollars) in 1976to nearly $21.7 billion in 1995. (See Table 8.7.) Developing coun-tries account for just over half of the world’s public agriculturalresearch (Pardey and Beintema 2001). (See Table 8.8.)
Regional totals fail to reveal, however, that the public spend-ing was concentrated in only a handful of countries. Just fourcountries—the United States, Japan, France, and Germany—accounted for two thirds of the $10.2 billion of public agriculturalresearch done by rich countries in 1995. Similarly, China, India,and Brazil dominate the spending on agricultural research in de-veloping countries. By the mid-1990s, about one third of theannual $33-billion investment in agricultural research worldwidewas done by private firms, including those involved in providingfarm inputs and processing farm products. The overwhelmingmajority ($10.8 billion, 94% of the global total) of this privatelyfunded research was conducted in industrial countries (Pardey andBeintema 2001).
Chapter 7 of the Scenarios volume discusses the historical evo-lution of the impacts of investments in agricultural productivity.A meta-study of quantitative evidence on the economic payoffsfrom improved productivity attributable to agricultural research,which included 1,845 data points from evaluation studies pub-lished between 1950 and 1995, revealed that the mean averageeconomic rate of return on investment was 30.4% per year,though the range was wide; there appeared not to have been, aswas popularly believed, any observable decrease in the rate ofreturn to research investment over time; nor was there any sig-nificant regional bias in payoffs—that is, the economic returns toresearch investments in sub-Saharan Africa were not statisticallydifferent from those in Asia (Alston et al. 2000). One persistentfinding has been the importance in agricultural research of spill-over of knowledge and technologies between different locations.Indeed, evaluation studies that have specifically taken account ofknowledge and technology spillovers have shown that this hasaccounted for a large share, and in many cases more than half, ofthe overall economic benefits (Alston 2002). Nonetheless, localR&D is necessary to facilitate spillover, and the lower levels oflocal R&D in Africa as opposed to Asia help account for the for-mer’s lower level of productivity growth (Masters 2005).
8.4.1.2.2 Agricultural policy and trade: producer subsidies and importtariffs
One of the most important and controversial set of drivers condi-tioning food provision globally are agricultural production andtrade policies, and especially the producer subsidy and tariff pro-tection measures supported, in particular, by the EuropeanUnion, the United States, and Japan. By subsidizing food produc-tion and exports, while keeping in place high import tariffs, par-ticularly on semi-processed or processed foods, these OECDcountries drive down food prices on the world market, undercut-ting the potential profitability of developing-country producersin their own markets while simultaneously limiting their exportopportunities (Watkins and von Braun 2003).
In 2002, some $235 billion of the over $300 billion spent byOECD countries on their agricultural sectors (some six times theamount they allocate to overseas development aid) went to sup-port agricultural producers. This support is paid for by higher
................. 11432$ $CH8 10-11-05 14:55:57 PS

227Food
BOX 8.4
Diet and Nutrition Drivers: The ‘‘Diet Transition’’
Popkin (1998) has described five broad nutrition patterns (see Figure), not Pattern 5: Behavioral Change. A new dietary pattern appears to berestricted to particular periods of human history but presented as historical emerging as a result of changes in diet, evidently associated with thedevelopments. ‘‘Earlier‘‘ patterns are not restricted to the periods in which desire to prevent or delay degenerative diseases and prolong health.they first arose, but continue to characterize certain geographic and socio- Whether these changes, instituted in some countries by consumers andeconomic subpopulations. in others also prodded by government policy, will constitute a large-scale
Pattern 1: Collecting Food. This diet, which characterizes hunter- transition in dietary structure and body composition remains to be seen.gatherer populations, is high in carbohydrates and fiber and low in fat, If such a new dietary pattern takes hold, it may be very important inespecially saturated fat. The proportion of polyunsaturated fat in meat increasing disability-free life expectancy.from wild animals is significantly higher than in meat from modern domes- The focus is increasingly on patterns 3 to 5, in particular on the rapidticated animals. Activity patterns are very high and little obesity is found shift in much of the world’s low- and moderate-income countries fromamong hunter-gatherer societies. pattern 3 to pattern 4, commonly termed the ‘‘diet transition’’ or ‘‘nutrition
Pattern 2: Famine. The diet becomes much less varied and subject transition.’’to larger variations and periods of acute scarcity of food. During the laterphases of this pattern, social stratification intensifies, and dietary variationincreases according to gender and social status. The pattern of faminehas varied over time and space. Some civilizations have been more suc-cessful than others in alleviating famine and chronic hunger. The typesof physical activities changed, but there is little change in activity levelsassociated with this pattern.
Pattern 3: Receding Famine. The consumption of fruits, vegetables,and animal protein increases, and starchy staples become less importantin the diet. Many earlier civilizations made great progress in reducingchronic hunger and famines, but only in the last third of the last millenniumhave these changes become widespread, leading to marked shifts in diet.However, famines continued well into the eighteenth century in portionsof Europe and remain common in some regions of the world. Activitypatterns start to shift and inactivity and leisure becomes a part of the livesof more people.
Pattern 4: Nutrition-related Noncommunicable Disease. A diet highin total fat, cholesterol, sugar, and other refined carbohydrates and lowin polyunsaturated fatty acids and fiber, and often accompanied by anincreasingly sedentary life, is characteristic of most high-income societies(and increasing portions of the population in low-income societies), result-ing in increased prevalence of obesity and contributing to the degenerativediseases that characterize Omran’s final epidemiologic stage.
Table 8.7. Global Agricultural Research Spending, 1976–95.Figures in parenthesis indicate number of countries. (Pardey andBeintema 2001)
Region 1976 1985 1995
(thousand 1993 dollars)
Developing countries (119) 4,738 7,676 11,469
Sub-Saharan Africa (44) 993 1,181 1,270
China 709 1,396 2,063
Asia and Pacific, excluding China (23) 1,321 2,453 4,619
Latin America and the Caribbean (35) 1,087 1,583 1,947
Middle East and North Africa (15) 582 981 1,521
Industrial countries (34) 7,099 8,748 10,215
Total (153) 11,837 16,424 21,692
g
PAGE 227
Table 8.8. Public-Private Breakdown of Research Expenditures,Circa 1995 (Pardey and Beintema 2001)
Region Public Private Total
(thousand 1993 dollars)
Developing countries 11,469 672 12,141
Industrial countries 10,215 10,829 21,044
Total 21,692 11,511 33,204
domestic food prices and by taxes ($100 billion in the EU, $44billion in Japan, and $31 billion in the United States). And itrepresents around 31% of average farm income (18% in theUnited States and 36% in the EU). For individual commoditiesthat OECD countries target for support (wheat, maize, cotton,dairy, beef, sugar, rice, and oilcrops), the levels of support canbe much higher (OECD 2003a; Watkins and von Braun 2003).Government support in Japan has consistently represented around85% of farmers’ rice production revenues, while U.S. rice supporthas declined from around 50% in 2002 (OECD 2004). The eco-
................. 11432$ $CH8 10-11-05 14:56:00 PS

228 Ecosystems and Human Well-being: Current State and Trends
nomic losses to developing countries due to these policies hasbeen estimated as some $24 billion a year in lost agricultural pro-duction and incomes of farm households and about $40 billion ayear in lost access to markets in OECD countries (Diao et al.2004).
Fisheries are another area of food production where subsidieshave become controversial. In the early 1990s it was establishedthat subsidies had probably contributed to an excessive buildup offishing fleets worldwide during the preceding decade. (See Chap-ter 18.) Since then, it has proved difficult to limit the fishing ofexisting fleets, and fish stocks continue to be overexploited asillegal, unreported, and unregulated fishing spreads. Subsidies tothe fishing industry are regulated through WTO agreements;however, the international community has agreed that existingWTO rules are not sufficient to ‘‘discipline’’ their use, and effortsare now being made to seek improved measures under the so-called Doha round of trade talks (Chang 2003).
From an ecosystem perspective, these market distortions havetwo major effects. In countries where subsidies are paid, food out-put increases to levels that would be uneconomic in the absenceof subsidies, drawing proportionately more land, labor, and otherresources into production and creating higher levels of agricul-tural pollution. While other factors such as increasing productivityhave caused the net amount of agricultural land to grow moreslowly or even to decline in some OECD countries, those effectswould have been more significant in the absence of subsidies.Recently, the OECD reported that while nitrogen runoff, pesti-cide use, and agricultural greenhouse gas emissions have fallensince the mid-1980s in most OECD countries, they have in-creased in the United States (OECD 2003b).
The other major impact of producer subsidies is the reductionof production and income opportunities in other parts of theworld where subsidies are not paid, although these impacts can beambiguous. While it could be argued that reduced productionincentives might conserve more habitat and reduce demands onlocal natural resources, it also can make poor people even poorerby limiting productivity enhancement incentives on existinglands, thus accelerating land degradation and further increasingpressure to convert more land.
International processes and agreements under the WorldTrade Organization have a major bearing on these drivers, partic-ularly WTO’s Agreement on Agriculture. This provides a frame-work for removing the ‘‘amber box’’ trade biases induced byproducer subsidies and import tariffs, as well as for agreeing on abroader set of ‘‘green box’’ provisions dealing with support toproducers for improving the environmental and landscape dimen-sions of farming through a range of ‘‘set-aside,’’ ‘‘conservation,’’‘‘countryside stewardship,’’ or similar programs. The espoused in-tent of ‘‘green box’’ measures is to provide incentives to farmersto follow less polluting, more environmentally sensitive produc-tion practices. However, such provisions have become highlycontentious as they are seen by many, including most developingcountries, as a way of legitimizing existing rich-country producersupport in another guise.
There are other ecosystem-relevant dimensions of the Agree-ment on Agriculture, including the notion of decoupling supportto producers from the quantity of production so as to limit per-verse incentives to overproduce food, use more agricultural land,use more potentially polluting agricultural inputs, and generatemore wastes. The impacts of the WTO on agriculture are stillemerging and developing, but its potential ramifications willlikely grow, bringing with it a significant change in food produc-tion incentives globally. Through the WTO, for example, devel-
PAGE 228
oping countries are becoming increasingly effective at assertingdemands for more liberal agricultural trade policies.
8.4.1.2.3 Food industry commercialization and integrationJust as agriculture has witnessed a gradual industrialization of theproduction process, so too have there been sweeping changes infood marketing, processing, and retailing practices. Even whereindustrialization of the production process has not taken place, theconcentration and formalization of marketing is having significantrepercussions on production decisions and on the need for im-proved smallholder collective action in order to stay engaged infood markets. Several forces at work are leading to the integrationand formalization of food marketing and supply chains: growingeconomies of scope and scale in the transportation, processing,and retailing subsectors; falling food prices that have reducedprofit margins and further encouraged consolidation in the post-harvest sector; a growing need to respond to consumer demandsfor specific type and quality of product that provides incentivesto shorten the marketing ‘‘chain,’’ such as vertical integration; agrowing need for transparency and accountability in the certifi-cation of food sources, such as organic foods, and to satisfy appro-priate (regulated or self–imposed) standards and food safetyrequirements; and the enormous expansion in the role of super-markets, even in developing countries (Berdegue et al. 2003).
Thus an increasing share of food production is being con-tracted for before planting, with contracts that often involve pro-ducer obligations relating to minimum quantities, product quality,and delivery dates. Such stringent criteria are very difficult forsmallholders to meet, and farmer associations and marketinggroups are increasingly being formed to help respond to theseneeds. For example, in the United States there has been massiveconsolidation of farms due to the economic pressures to improveeconomies of scale for both production and marketing purposes(as well as, in recent times, to fully reap the benefit of productionsubsidies). In the 1920s and 1930s there were more than 6 millionfarms of around 40 hectares each. By the late 1990s, there werefewer than 2 million farms and they averaged 200 hectares each(Bread for the World 2003).
8.4.2 Direct Drivers
8.4.2.1 Climate Change and Climate VariabilityAlthough there is a relatively rich literature on the potential im-pacts of long-term climate trends on future food production (see,for example, Rosenzweig and Parry 1996; Sombroek and Gom-mes 1996; Parry et al. 2004), evidence on the impacts of historicaland recent climate change on food production is relatively sparse.Although climate is a major uncontrollable factor influencingfood production (especially in areas of rain-fed agriculture), it isextremely difficult to reliably isolate the influence of climate fromother factors such improved seeds, the use of irrigation, fertilizer,pesticides, crop and land management.
However, some data do exist. For example, based on over 80years of crop yield and climate data in five central Corn Belt statesin the United States, Thompson (1998) developed relationshipsdescribing the influence of monthly average temperature and totalprecipitation on corn yields. These suggest that 40 millimetersabove normal precipitation in July would lead to a corn yieldincrease of 316 kilograms per hectare above the long-term aver-age. It has also been suggested that U.S. corn and soybean yieldscould drop by as much as 17% for each degree that the growingseason warms (Lobell and Asner 2003), although the level of cer-tainty in such findings remains low (Gu 2003). Weather variabilityin China has been shown to have a measurable effect on year-to-
................. 11432$ $CH8 10-11-05 14:56:01 PS

229Food
year national grain output (Carter and Zhang 1998), and a studyof the temperature and wine quality in the world’s top 27 wineregions over the past 50 years reveals that rising temperatures havealready affected vintage quality ( Jones et al. 2004).
Global-scale cyclical weather patterns have also strongly in-fluenced food production. This includes the impact of, in particu-lar, the El Nino-Southern Oscillation and the North AtlanticOscillation. Carlson et al. (1996) found that a negative SouthernOscillation Index (a measure of pressure difference in an ENSOevent) can result in a corn yield that is 10% above trend line inU.S. Corn Belt states, and ENSO-based climate variability hassignificant impact on cereal production in Indonesia (Naylor et al.2002), where year-to-year fluctuations in the August sea-surfacetemperature anomaly explain about half the interannual variancein paddy production during the main (wet) growing season. TheNorth Atlantic Oscillation has also been shown to significantlycorrelate to vegetation productivity in northern Asia, with a sur-prisingly long lag time of one-and-a-half years (Wang and You2004).
8.4.2.2 Area Expansion and IntensificationThere have been two main direct drivers of growth in food pro-duction: the increase in the area extent of cultivation, grazing,or fishing and the intensity of production or exploitation withincultivated areas. Figure 8.8 showed increasing trends in both har-vested area (area expansion) and cereal yields (a proxy of increasedintensification). It is clear that, for crops, it is intensification ratherthan area expansion that has mainly driven increased food output.Over the past 40 years cropland area has expanded globally bysome 15%—from 1.3 billion to 1.5 billion hectares (see Chapter26), the area of pasture has grown some 11% from 3.14 billion to3.48 billion hectares (FAOSTAT 2004), and practically all cornersof the world’s oceans are now accessible to the world’s fishingfleet (given the capacity of modern fishing vessels to stay at sea forextended periods and the large amounts of catch in refrigeratedholds).
While physical expansion in the area dedicated to food provi-sion has been important in the past, rates of growth are now rela-tively low—and in some places in decline (for instance, in theEuropean Union and Australia). This slowdown reflects both theslowing growth in global food demand and the more limited op-portunities for area expansion. Just as with the large growth incrop yields per hectare of cropland, there has also been substantialincrease in livestock production per animal; however, intensivelivestock systems are dependent on inputs from a significant landarea for feed production. (These trends are described in moredetail in Chapter 26.)
Investments in agricultural research and the resulting flow ofinnovation have been key to the intensification process. Technicalchange and increased use of external inputs such as irrigation,fertilizer, and mechanical power contribute to changes in produc-tivity—the formal means by which changes in intensification canbe measured. Increased productivity can also come from the in-troduction of less capital-intensive food-feed systems, wherebyboth the main crops as well as the introduction of legumes canenhance the cropping system. The complementary advantages ofboth food and feed enable intensification of mixed crop-livestocksystems and can increase total factor productivity (Devendra et al.2001).
8.5 Food Provision and Human Well-beingThe MA defines five dimensions of human well-being—basicmaterial for a good life, security, health, good social relations, and
PAGE 229
freedom and choice (MA 2003)—into which the production andconsumption of food maps in several ways. Food production, dis-tribution, processing, and marketing provide employment and in-come to a large share of the world’s population. About 2.6 billionpeople depend on agriculture for their livelihoods, either as ac-tively engaged workers or as dependants (FAO 2004b). (The exactnumber of people dependent on food processing, distribution,and marketing for their livelihoods is not certain.) Food con-sumption contributes directly to health and is an important aspectof cultures and social relations, and indirectly supports improvedsecurity and freedom and choices.
There are several attributes of food that have a major bearingon its potential impact on human well-being—quantity and price,diversity and quality of its nutrient content, and safety. The actualimpact of food depends on local food availability and the abilityof consumers to gain access to and properly use it, as well as onindividual food preferences. The dimensions of food availability,access, and utilization are integrated in the notion of food security,defined as ‘‘access by all people at all times to enough food for anactive, healthy life’’ (Reutlinger and van Holst Pellekan 1986).For the poor, the price of food (as well as access to wild sourcesof food) is key to determining the value of incomes, and for manysuch people the relationship between wage rates and food pricesis a critical determinant of human well-being. It is well establishedthat a productive food and agriculture sector not only benefitsindividual farmers and food consumers but also provides a plat-form for economic growth (Mellor 1995; Hazell and Ramasamy1991).
8.5.1 Health and Nutrition
The most direct and tangible benefit of food is its role in enablingindividuals to pursue active, healthy, productive lives as a conse-quence of adequate nutrition. For these reasons, access to ade-quate, safe food has been recognized as a basic human right. The1948 Universal Declaration of Human Rights proclaimed that‘‘everyone has the right to a standard of living adequate for thehealth and well-being of himself and his family, including food.’’Nearly 20 years later, the International Covenant on Economic,Social and Cultural Rights (1966) developed these concepts morefully, stressing ‘‘the right of everyone to . . . adequate food’’ andspecifying ‘‘the fundamental right of everyone to be free fromhunger.’’ These rights were specifically embodied in the 1989International Convention on the Rights of the Child and havefound further expression and practical interpretation through sub-sequent confirmation at the 1996 and 1999 World Food Summits(UN/SCN 2004).
Proper nutrition has many benefits for human, physical, andmental development. Better-fed children show improved educa-tional performance, and better-fed adolescents and adults are ableto lead more economically productive lives. Good nutrition alsoreduces neonatal and child mortality, helping to slow populationgrowth by increasing birth intervals and reducing demand forlarge families. Well-nourished mothers are also more likely to sur-vive childbirth themselves and to deliver healthier babies (ACC/SCN 2002).
Inadequate consumption of protein and energy as well as de-ficiencies in key micronutrients such as iodine, vitamin A, andiron are key factors in the morbidity and mortality of children andadults. An estimated 55% of the nearly 12 million deaths each yearamong children under five in the developing world are associatedwith malnutrition (UNICEF 1998). Malnourished children alsohave lifetime disabilities and weakened immune systems (UNICEF1998). Moreover, malnutrition is associated with disease and poor
................. 11432$ $CH8 10-11-05 14:56:02 PS

230 Ecosystems and Human Well-being: Current State and Trends
health, which places a further burden on households as well ashealth care systems.
A commonly used measure of the impact of ill health onhuman well being is disability-adjusted life years. This is a mea-sure of the burden of disease, reflecting the total amount ofhealthy life lost, to all causes, whether from premature mortalityor from some degree of disability during a period of time. Table8.9 summarizes the available evidence regionally and globally onthe burden of nutrition-related health impacts measured in termsof DALYs.
While the human health consequences of undernourishment,since they arise largely out of conditions of poverty and marginali-zation, legitimately dominate global humanitarian concerns,health problems associated with overconsumption of (certaintypes of ) food have grown alarmingly over the past 40 years. Thehealth-related aspects of nutrition are examined in three steps.First, micronutrient deficiency is considered, since although thisis most often associated with undernourishment, it can arise evenin diets with adequate or excessive protein and energy content.Second, undernourishment-related aspects are looked at, largelyacute and communicable diseases. And third, the evidence onovernourishment-related noncommunicable diseases is reviewed.
The constituents of good nutrition are fairly well understood, butdietary needs vary according to a range of context- and individual-specific characteristics, including climate, metabolism, and occu-pation. Guidelines indicate that a healthy adult diet includes adaily intake of 2,780 kilocalories for males and 2,235 kilocaloriesfor females. Recommended daily allowances for protein are 37
Table 8.9. Regional and Global Burden of Nutrition-related Disease Risk Factors. The Table shows the estimated disease burden foreach risk factor considered individually. These risks act in part through other risks and act jointly with other risks. Consequently, the burdendue to groups of risk factors will usually be less than the sum of individual risks. The disability-adjusted life year is a measure of the burdenof disease. It reflects the total amount of healthy life lost to all causes, whether from premature mortality or from some degree of disability,during a period of time. (Adapted from Ezzati et al. 2002; Ollila n.d.; and WHO 2002a)
Population/Risk Factor Africa AmericasEast
Mediterranean EuropeSoutheast
AsiaWesternPacific World
(thousand)
Total population 639,593 827,345 481,635 873,533 1,535,625 1,687,287 6,045,017
Childhood and maternal-undernutrition-related diseases(DALYs as percent of regional and world population)
Underweight 9.82 0.24 3.58 0.09 3.06 0.48 2.28
Iron deficiency 1.59 0.21 0.77 0.12 0.91 0.26 0.58
Vitamin A deficiency 2.57 0.04 0.61 0 0.42 0.03 0.44
Zinc deficiency 2.15 0.06 0.67 0.01 0.35 0.03 0.46
Malaria 0.74
HIV/AIDS 1.49
Respiratory infections 1.67
Iodine deficiency 0.04
Measles 0.4
Diarrhea 1.19
Other nutrition-related risksHigh blood pressure 0.69 0.78 1.02 2.22 0.98 0.83 1.06
High cholesterol 0.31 0.55 0.67 1.51 0.8 0.31 0.67
High BMI 0.23 0.89 0.6 1.35 0.27 0.35 0.55
Low fruit and vegetable intake 0.24 0.36 0.34 0.76 0.57 0.3 0.44
Diabetes 0.25
PAGE 230
grams for males and 29 grams for females (FAO/WHO/UNU1985); however, these recommendations vary by country. Rec-ommended daily intakes have also been established for a numberof vitamins, minerals, and other micronutrients. For example,daily intakes have been established of 750 micrograms of vitaminA for both males and females, 130 micrograms of iodine for males,and 110 micrograms for females (FAO/WHO 2002). In addition,components of foods may have functions that include antibiotic,immuno-stimulation, nervous system action, anti-inflammatory,antioxidant, anti-glycemic, and hypolipidemic properties (Johnsand Sthapit 2004).
Figure 8.10 presents a simplified schematic summary of theprincipal pathways of impact of food on human well-being, asmediated through nutrition. The following sections describesome of these pathways and, as far as available evidence permits,quantify the scale and intensity of specific nutrition, health,human development, and economic outcomes. But first themajor trends in key measures of nutrition over the past 40 yearsare reviewed.
8.5.1.1 Diet Quantity: Dietary Energy Supply
The most commonly used proxy of food availability is the grossavailability of food, as proxied by the average per capita availabil-ity of calories from food products, the dietary energy supply. Fig-ure 8.11 shows levels and trends in DES over the period 1961 to2001 for industrial and developing countries and for the world.Expansion of food production, coupled with declining real pricesfor food, increased DES by 24% globally over that period (an
................. 11432$ $CH8 10-11-05 14:56:03 PS
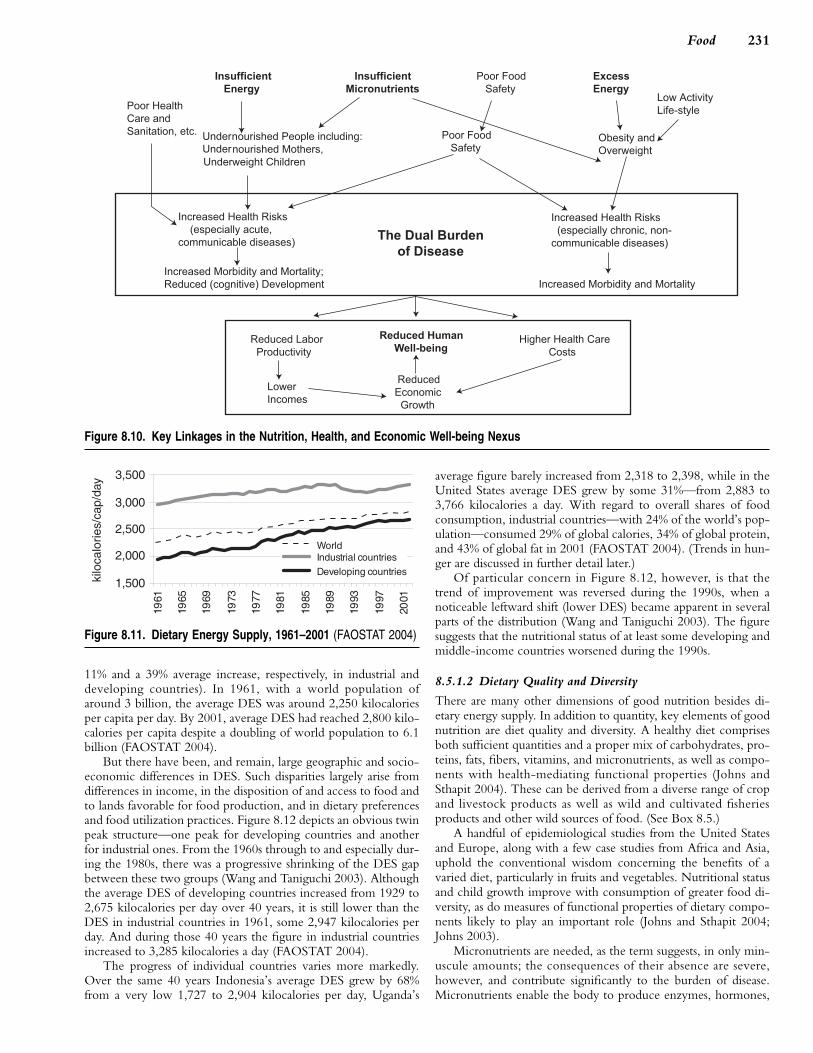
231Food
Figure 8.10. Key Linkages in the Nutrition, Health, and Economic Well-being Nexus
kilo
calo
ries/
cap/
day
Figure 8.11. Dietary Energy Supply, 1961–2001 (FAOSTAT 2004)
11% and a 39% average increase, respectively, in industrial anddeveloping countries). In 1961, with a world population ofaround 3 billion, the average DES was around 2,250 kilocaloriesper capita per day. By 2001, average DES had reached 2,800 kilo-calories per capita despite a doubling of world population to 6.1billion (FAOSTAT 2004).
But there have been, and remain, large geographic and socio-economic differences in DES. Such disparities largely arise fromdifferences in income, in the disposition of and access to food andto lands favorable for food production, and in dietary preferencesand food utilization practices. Figure 8.12 depicts an obvious twinpeak structure—one peak for developing countries and anotherfor industrial ones. From the 1960s through to and especially dur-ing the 1980s, there was a progressive shrinking of the DES gapbetween these two groups (Wang and Taniguchi 2003). Althoughthe average DES of developing countries increased from 1929 to2,675 kilocalories per day over 40 years, it is still lower than theDES in industrial countries in 1961, some 2,947 kilocalories perday. And during those 40 years the figure in industrial countriesincreased to 3,285 kilocalories a day (FAOSTAT 2004).
The progress of individual countries varies more markedly.Over the same 40 years Indonesia’s average DES grew by 68%from a very low 1,727 to 2,904 kilocalories per day, Uganda’s
PAGE 231
average figure barely increased from 2,318 to 2,398, while in theUnited States average DES grew by some 31%—from 2,883 to3,766 kilocalories a day. With regard to overall shares of foodconsumption, industrial countries—with 24% of the world’s pop-ulation—consumed 29% of global calories, 34% of global protein,and 43% of global fat in 2001 (FAOSTAT 2004). (Trends in hun-ger are discussed in further detail later.)
Of particular concern in Figure 8.12, however, is that thetrend of improvement was reversed during the 1990s, when anoticeable leftward shift (lower DES) became apparent in severalparts of the distribution (Wang and Taniguchi 2003). The figuresuggests that the nutritional status of at least some developing andmiddle-income countries worsened during the 1990s.
8.5.1.2 Dietary Quality and Diversity
There are many other dimensions of good nutrition besides di-etary energy supply. In addition to quantity, key elements of goodnutrition are diet quality and diversity. A healthy diet comprisesboth sufficient quantities and a proper mix of carbohydrates, pro-teins, fats, fibers, vitamins, and micronutrients, as well as compo-nents with health-mediating functional properties (Johns andSthapit 2004). These can be derived from a diverse range of cropand livestock products as well as wild and cultivated fisheriesproducts and other wild sources of food. (See Box 8.5.)
A handful of epidemiological studies from the United Statesand Europe, along with a few case studies from Africa and Asia,uphold the conventional wisdom concerning the benefits of avaried diet, particularly in fruits and vegetables. Nutritional statusand child growth improve with consumption of greater food di-versity, as do measures of functional properties of dietary compo-nents likely to play an important role (Johns and Sthapit 2004;Johns 2003).
Micronutrients are needed, as the term suggests, in only min-uscule amounts; the consequences of their absence are severe,however, and contribute significantly to the burden of disease.Micronutrients enable the body to produce enzymes, hormones,
................. 11432$ $CH8 10-11-05 14:56:09 PS

232 Ecosystems and Human Well-being: Current State and Trends
Figure 8.12. Distribution of Per Capita Dietary Energy Supply byDecade (Wang and Taniguchi 2003)
BOX 8.5
Biofortification (IFPRI/CIAT 2002)
It is now possible to breed plants for increased vitamin and mineralcontent, making ‘‘biofortified’’ crops a promising tool in the fight to endmalnutrition and save lives. An estimated 3 billion people suffer theeffects of micronutrient deficiencies because they lack money to buyenough meat, fish, fruits, lentils, and vegetables. Women and childrenin sub-Saharan Africa, South and Southeast Asia, and Latin Americaand the Caribbean are especially at risk of disease, premature death,and impaired cognitive abilities because of diets poor in crucial nutri-ents, particularly iron, vitamin A, iodine, and zinc.
We have the ability today to further improve and disseminate morewidely iron-rich rice, quality protein maize, high-carotene sweet potato,and high-carotene cassava. The potential advantages of biofortificationare that it does not require major changes in behavior by farmers orconsumers, can directly address the physiological causes of micronutri-ent malnutrition, can readily be targeted to the poorest people, usesbuilt-in delivery mechanisms, is scientifically feasible and cost-effective,and can complement other ongoing methods of dealing with micronutri-ent deficiencies.
The potential disadvantages are that biofortification may not benefitsmall-scale and poor farmers; it undermines dietary diversity and cre-ates possible conflict with distinctive food cultures; nutrient traits (ex-cept (-carotene) are difficult to verify without advanced technology;public investment is needed where infrastructure, including formal seedsystems and marketing , and economies are weak; evaluations will betime-consuming; and resistance to and ethical issues related to trans-genic crops are found in some regions.
and other substances essential for proper growth and develop-ment. Different micronutrients interact: there is a correlation, forexample, between iron deficiency and deficiency in other vita-mins and minerals (WHO 2004b). In addition, the content ofspecific micronutrients in foods can affect the absorption of otherminerals.
Iodine, vitamin A, iron, and zinc are the most important indi-vidual micronutrients in global public health terms; their lackrepresents a major threat to the health and development of popu-lations the world over, particularly to preschool children and
PAGE 232
pregnant women in low-income countries. Vitamin A deficiencyand iron deficiency (related to anemia) alone affect as many as 3.5billion people (WHO 2004b). Micronutrients with high bioavail-ability that are provided from animal-source foods include miner-als, calcium, iron, phosphorus, zinc, magnesium, and manganese,along with the vitamins thiamine B1, riboflavin B2, niacin, pyri-doxine B6, and B12 (CAST 1999). Several other nutrients areknown to be inadequate in developing countries, including B12,folate, and vitamin C. This section describes the four micronutri-ents most important for public health at present.
Vitamin A is derived from animal sources as retinol and fromfruits and vegetables (such as dark leafy vegetables and yellow andorange non-citrus fruits) as carotene, which is converted into vita-min A in the body. Plant-derived vitamin A is more difficult toabsorb than that from animals. Vitamin A deficiency significantlyincreases the risk of blindness and of severe illness and death fromcommon childhood infections, particularly diarrheal diseases andmeasles. In communities where vitamin A deficiency exists, chil-dren are on average 50% more likely to suffer from acute measles.
Improvements in vitamin A status have been demonstrated tolead to a 23% reduction in mortality among children aged one tofive (Rahmathullah 2003), so preventing between 1.3 million and2.5 million deaths each year and saving hundreds of thousands ofchildren from irreversible blindness. Vitamin A therapy is a stan-dard treatment in children with measles infection in developingcountries. Measles infection itself causes a transient immuno-suppression. Measles as an acute catabolic disease is thought to useup body reserves of nutrients, making the child more vulnerableto disease in the first instance and unable to counter the effects ofthe disease. The risk of dying from diarrhea, malaria, and measleswas increased by around 20–24% in Vitamin A–deficient children(Rice et al. 2003).
Iron is readily available in many foods, especially meat, fish,and poultry, as well as in some leafy vegetables such as spinach.WHO estimates that 4–5 billion people worldwide, many ofthem women of reproductive age and children under 12 (as manyas half of all such women and children in developing countries),are affected by iron-deficiency-induced anemia. Iron deficiencyis associated with malaria, intestinal parasitic infestations, andchronic infections. One strategy to mitigate iron deficiency hasbeen to promote the use of home gardens with small animals.Other strategies include food fortification and the eradication ofinfections.
Iodine deficiency is the world’s most prevalent—yet easilypreventable—cause of brain damage. Iodine deficiency disordersjeopardize children’s mental health. They affect over 740 millionpeople, 13% of the world’s population; 30% of the remainderare at risk. Chronic iodine deficiency causes goiter in adults andchildren. Serious iodine deficiency during pregnancy may resultin stillbirths, abortions, and congenital abnormalities such as cre-tinism—a grave, irreversible form of mental retardation that hasaffected people living in iodine-deficient areas of Africa and Asia(Aquaron et al. 1993; Hsairi et al. 1994; Foo et al. 1994; Yusuf etal. 1994). Global rates of goiter, mental retardation, and cretinismare all falling, attributed in varying degrees to the increased use ofiodized salt (WHO 2004b). Of far greater global and economicsignificance, however, is iodine deficiency disorder’s less visibleyet more pervasive level of mental impairment that lowers intel-lectual development.
The consequences of severe human zinc deficiency have beenknown since the 1960s, but only more recently have the effectsof milder degrees of zinc deficiency, which are highly prevalent,been recognized. Trials have shown that zinc supplementationresults in improved growth in children; lower rates of diarrhea,
................. 11432$ $CH8 10-11-05 14:56:11 PS

233Food
malaria, and pneumonia; and reduced child mortality. In total,about 800,000 child deaths per year and, through deaths and in-creased rates of infectious diseases in affected areas, some 1.9% ofDALYs are attributed to zinc deficiency. The incidence of diar-rhea is increased around 20% in zinc-deficient children and thatof pneumonia around 10–40% (Black 2003).
8.5.1.3 Hunger
Undernutrition can be broadly categorized into protein energyundernutrition (the result of a diet lacking enough protein andcalorie sources) and (specific) micronutrient deficiencies. PEM isprobably the most important factor contributing to nutrition-related mortalities (Habicht 1992).
FAO estimates that 852 million people worldwide did nothave enough food to meet their basic daily energy needs in 2000–02. This includes 9 million in industrial countries, 28 million incountries in transition, and 815 million in developing countries(FAO 2004a). Some 519 million hungry people live in Asia andthe Pacific and 204 million in sub-Saharan Africa, around 60%and 24% respectively of the global total of undernourished people.Viewed as a share of regional population, this means that some16% of Asians and 33% of sub-Saharan Africans are undernour-ished. The two most populous countries in the world—Chinaand India—alone account for almost 43% of the global total ofhunger, but the highest incidence rates, ranging from 40% to 55%of the population, are found in Eastern, Southern, and CentralAfrica (FAO 2004a).
The latest hunger estimates signal a disturbing reversal of trendsreported since around 1970 of a gradual decline in both hungerincidence and the absolute number of hungry people. Between1969–71 and 1995–97, the absolute number of hungry people indeveloping countries had fallen from around 959 million to 780million people. During the period 1995–97 to 2000–02, how-ever, while the proportion of undernourished in developingcountries fell by 1%, the number of hungry increased by some 18million people to a total of 815 million.
This trend reversal reported by FAO (2003) confirms the anal-ysis of overall DES patterns globally undertaken by Wang andTaniguchi (2003). The regional trends in the number of under-nourished in developing countries for the early to mid-1990s andfrom the mid-1990s to around 2000 are clearly shown in theupper panel of Figure 8.13. The progress in hunger reduction inthe early 1990s occurred predominantly in China and India. Butin the second half of the decade, progress in China slowed and inIndia reversed, while in the Near East and Central Africa thenumbers of hungry increased throughout the 1990s. The large-scale humanitarian crisis existing in Central Africa has escalatedunabated.
Chronic child hunger, in particular, is measured using anthro-pometric measures for height-for-age or stunting. Using cross-sectional data from 241 nationally representative surveys, de Oniset al. (2000) have shown that the prevalence of stunting in chil-dren has fallen in developing countries from 47% in 1980 to 33%in 2000 (by 40 million). Progress has not been uniform, however.Stunting has increased in East Africa but decreased in SoutheastAsia, South Central Asia, and South America. Stunting has mod-erately improved in North Africa and the Caribbean. West andCentral Africa show little progress. Despite the average decrease,child undernutrition remains a major public health problem.
Undernutrition has a huge global impact on morbidity andmortality due to infectious diseases. In spite of a general under-standing that undernutrition increases susceptibility to infectiousdiseases, good estimates of etiological fractions for the influence
PAGE 233
of hunger on infectious disease mortality predominantly exist forchildren under five, where being underweight confers about 50%of the mortality risk for the main infectious diseases in the devel-oping world like diarrhea, malaria, pneumonia, and measles (Schelp1998; Cebu Study Team 1992). Child growth (also in utero, re-sulting in low birth weight) has again a very strong effect onmorbidity and mortality. Birth weight alone is the single mostimportant predictor of mortality in early life.
Evidence suggests that PEM is linked with higher malariamorbidity/mortality (Caulfield et al. 2004). Both malaria andchronic hunger have effects on child growth. Undernutrition ishighly prevalent in many areas in which morbidity and mortalityfrom malaria is unacceptably high. The global burden of malariais associated with various nutrient deficiencies as well as under-weight status. Although the association is complex and requiresadditional research, improved nutritional status lessens the severityof malaria episodes and results in fewer deaths due to malaria.Deficiencies in vitamin A, zinc, iron, and folate as well as othermicronutrients are responsible for a substantial proportion of ma-laria morbidity and mortality. It is recommended that nutritionprograms should be integrated into existing malaria interventionprograms.
Diarrheal diseases are an important cause of mortality andmorbidity in children, leading to more malnutrition but alsobeing a consequence of undernutrition, as susceptibility to diar-rheal diseases is increased in malnourished children (Lanata andBlack 2001). There is ample evidence that giving formula andthe early introduction of solids increases susceptibility to diarrhea,which emphasizes the importance of access to clean water.
Disease affects a person’s development from a very early age.Gastroenteritis, respiratory infections, and malaria are the mostprevalent and serious conditions that can affect development inthe first three years of life. It is estimated that children under theage of five in developing countries suffer from 3.5 episodes ofdiarrhea per year and between four and nine respiratory tract in-fections in their first two years of life (Mirza et al. 1997). Infec-tions affect children’s development by reducing their dietaryintake, by causing a loss of nutrients, or by increasing nutrientdemand as a result of fever.
Undernutrition also plays a significant role in morbidityamong adults. The link between morbidity from chronic diseaseand mortality, on the one side, and a high body mass index, onthe other side, has been recognized and analyzed in industrialcountries primarily for the purpose of determining life insurancerisk. These relationships have also been studied in developingcountries. A study on Nigerian men and women has shown mor-tality rates among chronically energy-deficient people who aremildly, moderately, and severely underweight to be 40%, 140%,and 150% greater than rates among non-chronically energy-deficient people (ACC/SCN 2000).
There are also linkages between food provision and HIV/AIDS. Not only does good nutrition of afflicted individuals helpmaintain the quality of their life, but in a rural environment thereare implications for the feasibility of continued engagement infood production activities. One challenge is to minimize demandson a household labor pool that is severely depleted by the inca-pacitation of the afflicted family member and the time devotedto care giving by other family members (Gillespie and Haddad2002).
8.5.1.4 Obesity and OverweightObesity has become a global epidemic. At present over 1 billionadults are overweight, with at least 300 million considered clini-cally obese, up from 200 million in 1995 (WHO 2003a). Obesity
................. 11432$ $CH8 10-11-05 14:56:12 PS

234 Ecosystems and Human Well-being: Current State and Trends
0 20 40 60 80 100 120 140
214
Central Africa
Near East
East Africa
Southern Africa
Caribbean
West Africa
South America
Southeast Asia
India
China
-60 -50 -40 -30 -20 -10 0 10 20
Central Africa
Near East
East Africa
Southern Africa
Caribbean
West Africa
South America
Southeast Asia
India
China
Figure 8.13. Status and Trends of Hunger, 1990–2001 (FAO 2003)
is now a major determinant of the global burden of chronic dis-ease and disability. In many countries, significant incidence ofboth obesity and undernutrition may co-exist. (See Figure 8.14.)Obesity is a complex condition, with serious social and psycho-logical dimensions, and can be found across almost all ages andsocioeconomic groups (WHO 2003a). The prevalence of over-weight and obesity is commonly assessed using the body massindex, which is defined as the weight in kilograms divided by thesquare of the height in meters (kilograms per square meter). ABMI of over 25 kilograms per square meter is defined as over-weight, and a BMI of over 30 kilograms per square meter as obese(WHO 2003a).
Rising rates of obesity and overweight are due to both re-duced physical activity and increased consumption of more energy-dense, nutrient-poor foods with high levels of sugar and saturatedfats. Obesity rates often increase faster in developing countries
PAGE 234
than in industrial ones (Chopra 2002; WHO 2003a). The under-lying causes of these trends include urbanization, income growth,changing lifestyles, and globalization of and convergence of‘‘western’’ diets, the ‘‘diet transition.’’ This transition is generallyassociated with an epidemiological transition in which disease pat-terns shift over time so that infectious and parasitic diseases aregradually but not completely displaced, and noncommunicablediseases become the leading cause of death (Uusitalo et al. 2002).WHO reports that NCDs now account for 59% of the 57 milliondeaths annually and 46% of the global burden of disease. There isa well-established link between an unhealthy diet and several of themost important of these NCDs, including coronary heart disease,cerebrovascular disease, various cancers, diabetes mellitus, dentalcaries, and various bone and joint diseases (WHO 2003b). Lowlevels of physical activity exacerbate dietary causes of increasedrisk of NCDs (WHO 2003b).
................. 11432$ $CH8 10-11-05 14:56:14 PS

235Food
0
10
20
30
40
50
60
70
Indi
aHait
i
Niger
Nigeria
Kenya
Tanz
ania
Uzbek
istan
China
Brazil
South
Afri
ca
Zimba
bwe
Mex
ico
Egypt
Figure 8.14. Double Burden of Undernutrition and Overnutritionamong Women Aged 20–49 for Selected Developing Countries.A calculation of body mass index, BMI, can determine if a person isnot eating enough, or is consuming too much. Many developing coun-tries are facing both problems simultaneously. Note: data for eachcountry are from the most recent year available. (Mendez et al. 2005)
Obesity rates have tripled or more since 1980 in some areas ofNorth America, the United Kingdom, Eastern Europe, the Mid-dle East, the Pacific Islands, Australasia, and China. Current obe-sity levels range from below 5% in China, Japan, and certainAfrican nations to over 75% in urban Samoa. But even in rela-tively low prevalence countries like China, rates are almost 20%in some cities (WHO 2003a). A study by the Centers for DiseaseControl and Prevention in the United States found that almost65% of Americans are overweight and around one quarter areobese (Flegal et al. 2002).
Child obesity is a growing concern and is already an epidemicin some areas. Based on an analysis of 160 nationally representa-tive cross-sectional surveys from 94 countries, the global preva-lence of overweight among pre-school children was assessed at3.3%, representing, in developing countries, some 17.6 millionchildren (de Onis et al. 2000). According to the U.S. SurgeonGeneral, the number of overweight children in the United Stateshas doubled and the number of overweight adolescents has tripledsince 1980 (WHO 2003a).
Overweight and obesity lead to adverse metabolic effects onblood pressure, cholesterol, triglycerides, and insulin insensitivity(Rguibi and Belahsen 2004). Non-fatal health problems includerespiratory chronic musculoskeletal problems, skin problems, andinfertility. The more life-threatening problems are cardiovasculardisease, conditions associated with insulin resistance such as type-2diabetes, and certain types of cancers, especially the hormonallyrelated and large-bowel cancers and gall bladder disease (WHO2003b). Four out of the 10 leading global disease burden risk fac-tors for NCDs identified by WHO (2002a) were diet-related:high blood pressure, high cholesterol, obesity, and insufficientconsumption of fruits and vegetables.
An estimated 16.7 million deaths, or almost 30% of the globaltotal, result from various forms of cardiovascular disease (WHO2004c). Many of these are preventable by action on the majorprimary risk factors: unhealthy diet, physical inactivity, and smok-ing. Cancer accounts for about 7.1 million deaths annually (12.5%of the global total). Dietary factors account for about 30% of allcancers in western countries and approximately up to 40% in de-veloping countries. Diet is second only to tobacco as a prevent-able cause (WHO 2004c). And up to 2.7 million lives couldpotentially be saved each year with sufficient global fruit and veg-etable consumption (WHO 2004c). Fruits and vegetables as part
PAGE 235
of the daily diet could help prevent major NCDs such as cardio-vascular disease and certain cancers.
A number of concerns have been raised concerning the con-vergence of diets that accompanies globalization, in addition tothe negative effects on health and nutrition. These are loss ofcultural identity and increased resource use in food productionand transportation (Bruinsma 2003). It is estimated, for example,that an average American diet requires about three times as muchnitrogen fertilizer per capita as the average Mediterranean diet(Howarth et al. 2002).
The simplification of diets in terms of food sources as a conse-quence of the nutrition transition has also had implications ondemand for certain types of food and hence on the structure ofcrop, livestock, and aquaculture production systems as well as thegenetic diversity they embody (Johns 2003). Although an increas-ing number of processed foods are available, particularly in urbanand higher-income markets, the species and intra-species diversityof food sources is narrowing (Johns 2003).
Conversely, agricultural intensification and the simplificationof agricultural landscapes can limit the availability of and access towild foods and to food plants growing as weeds that may be ofnutritional importance, especially to landless poor people and tovulnerable groups within households (Scoones et al. 1992). Simi-larly, the decline of traditional fisheries (following commercialexploitation of coastal fisheries and damage to inland water eco-systems due to water extraction and diversion) can have severenegative nutritional consequences for poor artisanal fishers (DFID2002).
8.5.2 Food Safety
Illness as a result of contaminated food is a widespread healthproblem and an important factor in reduced economic productiv-ity. The global incidence of food-borne disease is difficult to esti-mate, but it has been reported that in 2000 alone 2.1 millionpeople died from diarrheal diseases, and it is estimated that 70% ofthe 1.5 billion global episodes of diarrhea are due to biologicallycontaminated food (WHO 2002b). Additionally, diarrhea is amajor contributor to malnutrition in infants and young children.In industrial countries, up to 30% of people reportedly suffer fromfood-borne diseases each year (WHO 2002b). In the UnitedStates, for example, around 76 million cases of food-borne dis-eases, resulting in 325,000 hospitalizations and 5,000 deaths, areestimated to occur each year (Mead et al. 1999).While the situa-tion in developing countries is less documented, they bear thebrunt of food safety problems due to the presence of a wide rangeof food-borne diseases, including those caused by parasites. Forexample, cholera is a major public health problem in developingcountries (WHO 2002b).
Food contaminants can occur naturally or as a result of poor orinadequate production, storage, and handling. Hazardous agentsinclude microbial pathogens, zoonotic disease agents, parasites,myco- and bacterial toxins, antibiotic drug residues, hormones,and pesticide residues. Genetically modified organisms and theirpotential to contain allergens or toxins have also begun to receiveattention (Unnevehr 2003). Food safety risks vary with climate,diet, income level, and public infrastructure, and food-bornepathogens are more prevalent in developing countries, wherefood safety may be as important as food security for health andnutrition. Consumption of contaminated food may cause childrento be stunted, underweight, and more susceptible to infectiousdiseases in childhood and later in life.
In addition to food safety risks associated with uncontrolledendemic diseases found in developing regions, there are also food
................. 11432$ $CH8 10-11-05 14:56:15 PS

236 Ecosystems and Human Well-being: Current State and Trends
safety risks that appear in highly developed production systemswhen animal concentrations are high, feeds contain contaminants,or meat and milk are improperly handled. There have been out-breaks of several zoonotic diseases (those naturally transmittedfrom animals to humans) recently in people, including avian in-fluenza, severe acute respiratory syndrome, and Creutzfeldt-JakobDisease. Of 1,709 human pathogens, 832 are zoonotic, and of 156emerging diseases, 114 are zoonotic. Overall, zoonotic pathogensare more than three times more likely to be associated withemerging diseases than non-zoonotic pathogens. Examples in-clude influenza, brucellosis, bovine spongiform encephalopathy,tuberculosis, and rabies (Kaufmann and Fitzhugh 2004).
Genetically modified foods are increasingly receiving atten-tion in the food safety debate with regard to toxicity, allergenicity,stability of the modified genetic composition, nutritional effectsassociated with genetic modification, and unintended effects as aresult of gene insertion (WHO 2005). Outcrossing (the move-ment of genes from GM plants into conventional crops or relatedspecies in the wild), as well as the mixing of crops derived fromconventional seeds with those grown using GM crops, may havean indirect effect on food safety and food security if the geneproducts are toxic. The risk of seed mixing is real, as was shownwhen traces of a maize type that was only approved for feed useappeared in maize products for human consumption in theUnited States (WHO 2005).
GM foods currently available on the international market havepassed risk assessments and are not likely to present risks forhuman health (WHO 2005). In the developing world, the ap-proval and cultivation of GM crops is largely limited to soybean,maize, and cotton in Argentina, Brazil, China, India, Mexico, andSouth Africa ( James 2004). Consumption of GM foods has notshown any adverse effects on human health in the general popula-tion in the countries where they have been approved. Neverthe-less, food safety assessments are essential to GM approvals and thusneed to be started early in the process of GM crop development(Unnevehr 2003).
Pesticide residues on food are also of growing concern. In theUnited States, for example, the Environmental ProtectionAgency has set maximum legal limits for pesticide residues onfood commodities for sale domestically. In the most recent U.S.Food and Drug Administration studies, dietary levels of most pes-ticides were less than 1% of the acceptable daily intake establishedby the FAO and WHO (Bessin 2004). Consumption of pesticideresidues in food remains a significant problem in most developingcountries, however, especially for food that is produced and con-sumed locally (Dasgupta et al. 2002). Pesticides, especially organ-ochlorides, are expected to increase in importance as a healthconcern, particularly in the context of multiple pesticide expo-sure. Although the long-term effects of pesticide exposure remainuncertain, evidence suggests that toxins may increase carcinogenicand neurotoxic health risks in susceptible sub-groups (Alavanja etal. 2004; Maroni and Fait 1993).
8.5.3 Household Economic Impacts
Consumption of food is also linked to cognitive development andlabor productivity. Nutrition has a dynamic and synergistic rela-tionship with economic growth through the channel of educa-tion, and the evidence shows that the causality works in bothdirections: better nutrition can lead to higher cognitive achieve-ment and increased learning capacity, and thus to higher laborproductivity as well as higher incomes. And higher levels of edu-cation lead to better nutrition.
PAGE 236
8.5.3.1 Nutrition and Cognitive Development
This dual causality between nutrition and cognitive developmentis complex and varies over the life cycle of a family. In utero,infant, and child nutrition can all affect later cognitive achieve-ment and learning capacity during school years, ultimately in-creasing the quality of education gained as a child, adolescent, andadult. Parental education affects in utero, infant, and child nutri-tion directly through the quality of care given (principally mater-nal) and indirectly through increased household income. Humancapital development, primarily through education, has receivedmerited attention as a key to economic development (Verner2004), but early childhood nutrition has yet to obtain the requiredemphasis as a necessary facilitator of education and human capitaldevelopment.
Despite the limited evidence demonstrating a causal link be-tween poor nutrition and cognitive achievement, systematic evi-dence supports the argument that policy interventions in earlychildhood nutrition are crucially important for cognitive achieve-ment, learning capacity, and, ultimately, household welfare. Spe-cifically, available studies (Horton 1999) have shown that:• PEM deficiency, as manifested in stunting, is linked to lower
cognitive development and educational achievement;• low birth weight is linked to cognitive deficiencies;• iodine deficiency in pregnant mothers negatively affects the
mental development of their children;• iodine deficiency in children can cause delayed maturation
and diminished intellectual performance; and• iron deficiency can result in impaired concurrent and future
learning capacity.Children are most vulnerable to malnutrition in utero and be-
fore they reach three years of age, as growth rates are fastest andthey are most dependent on others for care during this period.However, nutrition interventions, such as school feeding pro-grams, among children of school age are also important forstrengthening learning capacity.
Yet there remains significant uncertainty surrounding esti-mates of the monetary costs associated with the impact of hungerand malnutrition on school performance. Nevertheless, Behrman(2000) cites three studies suggesting that, by facilitating cognitiveachievement, child nutrition and schooling can significantly in-crease wages. Micronutrients from animal-source foods are espe-cially important in the health of women of reproductive age andin the cognitive development and school performance of children(Neumann and Harris 1999). Behrman (2000) concludes thatwhile the link between health and educational attainment is notas robust as most studies suggest, and specific cost-benefit analysisis difficult to carry out, policies supporting nutrition make goodsense, and the empirical basis for this is as sound as that of manyother conventional assumptions in economics.
8.5.3.2 Nutrition and Labor Productivity
Much of the empirical work linking economic outcomes to nu-trition to date has focused on agriculture, and it attempts to linkfarm output, profits, wages, or labor allocation choices to indica-tors of nutritional intake such as calories or to nutritional outputssuch as weight-for-height, BMI, and height. Widely cited workby Strauss (1986) links the average calorie intake per adult in ahousehold to the productivity of on-farm family labor in SierraLeonean agriculture. For this sample, on average, a 50% increasein calories per consumer equivalent increased output by 16.5%,or 379 kilograms. For an increase of 50% in hours of family laboror in the area of cultivated land, this compares with an outputresponse of 30% and 13%, respectively. Significantly, Strauss’s
................. 11432$ $CH8 10-11-05 14:56:16 PS

237Food
findings show that the lower the calorie intake is, the more sig-nificant the output response is to increased calorie intake. Forexample, based on a daily intake of 1,500 calories per consumerequivalent, a mere 10% increase in calorie intake would increaseoutput by nearly 5%.
Findings from Ethiopia, presented in Croppenstedt and Mul-ler (2000), show that a 10% increase in weight-for-height andBMI would increase output and wages by about 23% and 27%,respectively. They also find that height, an indicator of a person’spast nutritional experience, is a significant determinant of wagesin Ethiopia, with a person who is 7.1 centimeters above the aver-age height earning about 15% more wages. These findings haveto be contrasted with the effect of other productivity-augmentinginvestments, such as education. Nutrition would appear to com-pare well with the 4% increase in cereal output attributed to anadditional year of schooling in a rural Ethiopian household.
Poor nutritional status not only reduces a person’s output, itmay also prevent them from carrying out certain tasks. A study inRwanda found that those who are poorly fed have to chooseactivities that are physically less demanding—and less well paid(Bhargava 1997). A low BMI and poor nutritional status may alsolimit productivity indirectly through absenteeism and reducedemployment opportunities. Moreover, to carry out certain activi-ties, undernourished people may have to put their muscle massand heart rate under much greater strain than well-nourished peo-ple do, requiring more energy to produce the same output, whichmay lead to health problems in the long term.
There is also an increasing awareness of the role of micronu-trients in people’s nutritional status, as described earlier. For ex-ample, iron deficiency in adults negatively affects productivity aswell as contributing to absenteeism. Basta et al. (1979) found thatproductivity among Indonesian rubber plantation workers withanemia was reduced by 20% compared with non-anemic workers.There is also some evidence that iodine deficiency during adult-hood reduces productivity and work capacity (Hershman et al.1986).
8.5.4 Macroeconomic Growth
There is clear evidence of an association between improvementsin nutrition and improvements in macroeconomic growth, butthe nature and strength of the association is sensitive to the con-text and time frame (Easterly 1999; Arcand 2001; Wang and Tani-guchi 2003). Overall, inadequate nutrition is estimated to causelosses of between 0.23% and 4.7% per year in per capita GDPgrowth rates worldwide (Arcand 2001). Improved nutrition af-fects economic growth directly through its impact on labor pro-ductivity and indirectly through improvements in life expectancy.The reverse is also true, and analysis using 81 indicators found thata 1% increase in per capita GDP raises per capita calorie intake byapproximately 540 kilocalories a day (Easterly 1999). Differencesin economic growth explained 40% of cross-country differencesin improved mortality rates over the last three decades (Pritchettand Summers 1996), while in a separate study covering some 65countries between 1970 and 1995, half of the decline in childmalnutrition from 1970 to 1995 could be attributed to incomegrowth (Smith and Haddad 2000). Half of the economic growththat occurred in the United Kingdom and France in the eigh-teenth and nineteenth centuries has been attributed to improve-ments in nutrition and health (Fogel 1994).
More recent and comprehensive analysis of 114 countries overthe period 1961–99 found that, on average, the GDP growthrate increased by 0.5% per capita for each 500 kilocalorie-per-dayincrease in dietary energy supply (Wang and Taniguchi 2003).
PAGE 237
However, the results differed significantly between countrygroups and short-term and long-term perspectives. For somegroups (East and Southeast Asia), GDP growth was up to fourtimes higher, while in others (sub-Saharan Africa) GDP growthwas absent or negative. Furthermore, short-term GDP impactswere also ambiguous (a mix of positive, neutral, and negative im-pacts). This is explained on the basis of a ‘‘nutrition trap’’ forsome countries, particularly—and persistently—in sub-SaharanAfrica. In such countries, significant increases in DES often trans-late into an expansion in short-term population growth rates thatdepress both per capita DES and GDP. To overcome this, nutri-tion and income need to attain levels at which further increases inDES do not promote population expansion, or DES increasesneed to be large and sustained (Wang and Taniguchi 2003).
8.5.5 Cultural Aspects
Food is not just an economic good and a requirement for goodhealth, but also a centerpiece of culture. It is no coincidence thatthe word ‘‘company’’ stems from com, meaning together and panismeaning bread. Recalling the quasi-mystical status of the yam inmuch of African culture, Wole Soyinka, the Nigerian Nobel lau-reate for literature, speaking on the role of cultural leaders inchanging attitudes and behaviors related to food and nutrition,said ‘‘Food is allied to culture in the most organic, interactiveway, and one may be brought to the aid of, in enhancement of,or in celebration of the other’’ (IFPRI 2004).
Cultural aspects of food and acquired tastes (a type of ‘‘foodbias’’) can be significant determinants of both physical and eco-nomic well-being. For example, in drought-prone southernZambia, some drought-resistant crops, such as millet and sor-ghum, are not cultivated because southern Zambians have notacquired a taste for them despite the fact that these foods couldprovide food security during times of drought.
Food is so integral to the formation of cultural identities andglobal unity that 2004 was declared ‘‘The International Year ofRice’’ by FAO, to commemorate rice as a life force having ‘‘enor-mous impact on human nutrition and global food security’’ (FAO2004). A grain of rice is compared with a grain of gold in South-east Asia, and many Japanese perceive rice as the ‘‘heart’’ of theirculture. Rice, along with many other foods, is used for consump-tion by people every day, as well as to celebrate religious andsocial holidays, festivals, and other special occasions.
Indeed, food rituals form the core of many religious rituals,and inadvertently affect markets and trade. Taboos associated withdifferent types of food also set apart cultures, sects, and denomina-tions. Not only do these taboos and rituals help promote socialsolidarity and maintain cultural boundaries, they also promote‘‘food bias’’ and, thereby, contribute to the kinds of food trade aculture will initiate and promote. For example, religious beliefsassociated with pigs in the Judaic and the Muslim traditions arenot likely to initiate any pork trade in these regions. Similarly,Hinduism’s taboo of beef, due to the sacred allegiance to the cow,can adversely affect the beef trade in certain regions of India. InNorth America, the turkey has become a cultural symbol associ-ated with Thanksgiving, and more broadly is associated withChristmas, generating a large turkey trade during these seasons.
Recognizing that the enjoyment of wholesome food is impor-tant in the pursuit of happiness and, in part, as a backlash to therapidly growing western/urban culture of fast food, a small butrapidly growing grassroots movement has been established thatseeks to maintain the cultural significance of food and its con-sumption (Jones et al. 2003).
................. 11432$ $CH8 10-11-05 14:56:17 PS
238 Ecosystems and Human Well-being: Current State and Trends
8.5.6 Distributional Dimensions
In low-income countries, most of which are characterized by arelatively large share of agriculture in the economy and a highproportion of rural population, food production has critical distri-butional impacts in the form, for example, of income or healthinequalities. It has impacts on poverty alleviation, reduced ine-qualities in food consumption, improved nutrition and health,low commodity and food prices, and direct and indirect employ-ment and income generation. The size and pattern of these im-pacts depend on a number of factors: the rate of growth ofagricultural and food production across regions and types of crops,agriculture’s share in the economy, the proportion of the popula-tion that is rural, asset (mainly land) distribution, rural infrastruc-ture, well-functioning markets, availability of agricultural inputsand credit to the poorer farmers and in remote areas, and adequateresearch and extension (von Braun 2003).
Thus a whole set of factors combine to have a broad and equi-table impact from increased food productivity. This explains thecontinued food distributional inequalities despite food productionper capita increasing globally. Increased local food production re-mains critical to alleviating poverty and providing food security.In general, the experience of the last few decades shows that thehigher the food (and agricultural) output (especially when it isdue to higher labor and land productivity), the more equal theland distribution, the better the small farmer’s access to inputs andmarkets, and the less suppression of agricultural prices, the greateris the positive impact on income and consumption distribution,poverty alleviation, and food security for the poor (von Braun2003). Further, the more ‘‘distribution friendly’’ variables that arepresent, the stronger is their synergistic impact.
Livestock are also a significant source of income and con-sumption in low-income countries. Often they provide a supple-mentary source of income and income stability. However, inmany cases livestock are a vital, even the sole, source of incomefor the poorest, the landless, pastoralists, sharecroppers, and wid-ows. They are one of the few assets available to these groups.Livestock also allow the rural poor to exploit common propertyresources, such as open grazing areas, in order to earn incomesand reduce income variability, especially in semiarid areas.
ReferencesACC/SCN (Administrative Committee on Coordination/Standing Committee
on Nutrition), 2002: Nutrition: A Foundation for Development (12 briefs). Ge-neva.
ACC/SCN, 2000: Fourth report on the World Nutrition Situation: NutritionThroughout the Life Cycle. ACC/SCN in collaboration with the InternationalFood Policy Research Institute, Geneva, 121 pp.
Acquaye, A.K.A., J.M. Alston, and P.G. Pardey, 2003: Post-war productivitypatterns in U.S. agriculture: influences of aggregation procedures in a state-level analysis. American Journal of Agricultural Economics, 85(1), 59–80.
Alavanja, M.C.R., J.A. Hoppin, and F. Kamel, 2004: Health effects of chronicpesticide exposure: Cancer and neurotoxicity. Annual Review of Public Health,25, 155–197.
Alston, J.M., 2002: Spillovers. Australian Journal of Agricultural and Resource Eco-nomics, 46(3), 315–346.
Alston, J.M., C. Chan Kang, M.C. Marra, P.G. Pardey, and T.J. Wyatt. 2000.A Meta-Analysis of Rates of Return to Agricultural R&D: Ex Pede Herculem?Research Report 113. International Food Policy Research Institute, Wash-ington. 148 pp.
Aquaron, R., K. Zarrouck, M. Eljarari, R. Ababou, A. Talibia, and J.P. Ardis-sone, 1993: Endemic goiter in Morocco (Skoura-Toundoute areas in the highAtlas). Journal of Endocrinological Investigation, 16(1), 9–14.
Arcand, J. 2001. Undernourishment and Economic Growth: the Efficiency Cost ofHunger. FAO Economic and Social Development Paper No. 147, FAO,Rome, 60 pp.
PAGE 238
Baillie J.E.M., C. Hilton-Taylor, and S. Stuart (eds.), 2004: 2004 IUCN RedList of Threatened Species: A Global Species Assessment. International Union forthe Conservation of Nature, Gland, Switzerland, and Cambridge, UK, 217pp.
Basta, S., S. Soekirman, D. Karyadi, and N.S. Scrimshaw, 1979: Iron deficiencyanemia and the productivity of adult males in Indonesia. American Journal ofClinical Nutrition, 32, 916–925.
Behrman, J., 2000. Literature Review on Interactions between Health, Education andNutrition and the Potential Benefits of Intervening Simultaneously in All Three.International Food Policy Research Institute, Washington, DC, 33 pp.
Bene, C., A. Neiland, T. Jolley, S. Ovie, O. Sule, B. Ladu, K. Mindjimba,E. Belal, F. Tiotsop, and M. Baba, 2003: Inland fisheries, poverty, and rurallivelihoods in the Lake Chad Basin. Journal of Asian and African Studies,38(Part 1), 17–51.
Berdegue, J.A., F. Balsevich, L. Flores, D. Mainville, and T. Reardon, 2003:Food Safety and Food Security in Food Trade. Case Study: Supermarkets and Qual-ity and Safety Standards for Produce in Latin America. Focus 10. Brief 12 of 17.International Food Policy Research Institute, Washington, DC, 2 pp.
Bessin, R.T., 2004: Pesticide residues in foods: is food safety just a matter oforganic vs. traditional farming? [online] Lexington: University of KentuckyEntomology. Cited February 18, 2005. Available at http://www.uky.edu/Agriculture/Entomology/entfacts/misc/ef009.htm.
Bhargava, A., 1997. Nutritional status and the allocation of time in Rwandesehouseholds. Journal of Econometrics, 77, 277–295.
Black, R.E., 2003. Zinc deficiency, infectious disease and mortality in the de-veloping world. The Journal of Nutrition, 133 (5), 1485–1489.
Blisard, N. and J.R. Blaylock, 1993: US Demand for Food: Household Expendi-tures, Demographics and Projections for 1990–2010, Economic Research Ser-vice, United States Department of Agriculture, Technical Bulletin 1818,December 1993, Washington, DC.
Bread for the World Institute, 2003: Agriculture in the Global Economy, Hunger2003. 13th Annual Report on the State of the World’s Hunger. Washington DC,157 pp.
Bruinsma, J. (ed.), 2003: World Agriculture: Towards 2015/2030, An FAO Per-spective. Earthscan and FAO, London and Rome, 432 pp.
Caddy, J.F, 1993: Contrast between recent fishery trends and evidence for nu-trient enrichment in two large marine ecosystems: the Mediterranean and theBlack Seas. In: Kenneth Sherman, et al. (eds.), Large Marine Ecosystems: Stress,Mitigation, and Sustainability, American Association for the Advancement ofScience, Washington, DC, pp.137–147.
Carlson, R.E., D.P. Todey, and S.E. Taylor, 1996: Midwestern corn yield andweather in relation to extremes of the Southern Oscillation. Agronomy Jour-nal/Production Agriculture, 9, 347–352.
Carter, C. and B. Zhang, 1998: The weather factor and variability in china’sgrain supply. J Comparative Economic 26, 529.
Cassman, K.G., 2001. Crop science research to assure food security. In:J. Noesberger et al. (eds.), Crop Science: Progress and Prospects. CAB Interna-tional, Wallingford, UK. pp. 33–51.
Cassman, K.G., 1999: Ecological intensification of cereal production systems:yield potential, soil quality, and precision agriculture. Proceedings of the Na-tional Academy of Sciences, 96, 5952–5959.
Cassman, K.G., A. Dobermann, D.T. Walters, and H. Yang, 2003: Meetingcereal demand while protecting natural resources and improving environ-mental quality. Annual Review of Environmental Resources, 28, 315–358.
CAST (Council for Agricultural Science and Technology), 1999: Animal Agricul-ture and Global Food Supply. Ames, Iowa, 92 pp.
Caulfield, L.E., S.A. Richard, and R.E. Black. Undernutrition as an UnderlyingCause of Malaria Morbidity and Mortality. DCPP Working Paper No. 16, Cen-ter for Human Nutrition, Bloomberg School of Public Health, The JohnsHopkins University, Baltimore, MD, 38 pp.
Cebu Study Team, 1992: A child health production function estimated fromlongitudinal data. Journal of Development Economics, 38(2), 323–351.
Chang, S.W., 2003: WTO Disciplines on fisheries subsidies: a historic steptowards sustainability? Journal of International Economic Law, 6(4), 879–921.
Chopra, M., 2002: Globalization and food: implications for the promotion ofhealthy diets. In: Globalization, Diets and Non-communicable Diseases. WHO,Geneva, 185 pp.
Clark, G., M. Huberman, and P. Lindert, 1995: A British food puzzle, 1770–1850, Economic History Review, 48 (2), 215–37.
Coates, D., 1995: Inland Capture Fisheries and Enhancement: Status, Con-straints and Prospects for Food Security. FISHAID Project, Port Moresby,Papua New Guinea. Report presented at the International Conference on Sustain-able Contribution of Fisheries to Food Security, Kyoto, Japan, 4–9 December.
................. 11432$ $CH8 10-11-05 14:56:17 PS
239Food
Conway, G., 1999: The Doubly Green Revolution: Food for all in the 21st Century.Cornell University Press, Ithaca, 335 pp.
Cooper, H.D., T. Hodgkin, and C. Spillane, 2000: Broadening the Genetic Baseof Crop Production. Commonwealth Agricultural Bureaux International/ Foodand Agriculture Organization/ International Plant Genetics Research Insti-tute. Rome, 480 pp.
Cromwell, E., D. Cooper, and P. Mulvany, 2001: Agricultural Biodiversity andLivelihoods: Issues and Entry Points for Development Agencies. Overseas Develop-ment Institute, London, 52 pp.
Croppenstedt, A. and C. Muller, 2000: The impact of farmers’ health andnutritional status on their productivity and efficiency: evidence from Ethio-pia. Economic Development and Cultural Change, 48 (3), 475–502.
Dasgupta S., C. Meisner, D. Wheeler, and Y. Jin, 2002: Agricultural trade,development and toxic risk. World Development, 30(8), 1401–1412.
Delgado, C., M. Rosegrant, and N. Wada, 2003: Meating and milking globaldemand: stakes for small-scale farmers in developing countries. In: The Live-stock Revolution: A Pathway from Poverty? Record of a Conference Conducted bythe ATSE Crawford Fund. Parliament House, Canberra, 13 August 2003. A fest-schrift in honor of Derek E. Tribe.
Delgado C., M. Rosegrant, H. Steinfeld, S. Ehui, and C. Courbois, 1999:Livestock to 2020: The Next Food Revolution. Food, Agriculture and the Environ-ment Discussion Paper 28. 2020 Vision. International Food Policy ResearchInstitute. Washington, DC, 83 pp.
Delgado C., J. Hopkins, and V. Kelly, with P. Hazell, A. McKenna, P. Gruhn,B. Hoijati, J. Sil, and C. Courbois, 1998: Agricultural Growth Linkages in sub-Saharan Africa. International Food Policy Research Institute, Research ReportNo.107, Washington, DC, 154 pp.
Delisle, H., 1990: Patterns of Urban Food Consumption in Developing Countries:Perspectives from the 1980s. FAO, Rome, 92 pp.
Denison, R.F., 2003: Darwinian agriculture: When can humans find solutionsbeyond the reach of natural selection? Quarterly Review of Biology 78, 145–168.
de Onis M., E.A. Frongillo, and M. Blossner, 2000: Is malnutrition declining?an analysis of changes in levels of child malnutrition since 1980. Bulletin of theWorld Health Organization, 78 (10), 1222–1233. World Health Organization,Geneva.
Devendra, C., 2000: Animal production and rainfed agriculture in Asia: poten-tial opportunities for productivity enhancement. Outlook on Agriculture, 29(3),161–75.
Devendra, C., C. Seville, and D. Pezo, 2001: Food-feed systems in Asia: re-view. Asian-Australasian Journal of Animal Science, 14(5), 733–745.
DFID (Department for International Development, UK), 2002: Marine fisher-ies. Key sheets for sustainable livelihoods [online], cited February 28, 2005.Available at http://www.keysheets.org/green_8_marinefish.pdf.
Diamond, J., 1999: Guns, Germs and Steel: The Fates of Human Societies. W. W.Norton and Company, New York. 480 pp.
Diao, X., E. Diaz-Bonilla, S. Robinson, and D. Orden, 2005: Tell Me Where ItHurts, and I’ll Tell You Who to Call: Industrialized Countries’ Agricultural Policiesand Developing Countries, MTID Discussion Paper No 84. International FoodPolicy Research Institute, Washington, DC.
Doll, P. and S. Siebert, 1999: A Digital Map of Irrigated Areas. Report No. A9901,Center for Environmental Systems Research, Germany, University of Kassel.
Easterly, W., 1999. Life during growth. Journal of Economic Growth, 4(3), 239–276.
Ehui, S., S. Benin, T. Williams, and S. Meijer, 2002: Food Security in sub-SaharanAfrica to 2020. Socio-economics and Policy Research Working Paper 49.International Livestock Research Institute (ILRI): Nairobi, Kenya, 60 pp.
Etkin, N.L. (ed.), 1994: Eating on the Wild Side: The Pharmacologic, Ecologic, andSocial Implications of Using Noncultigens. University of Arizona Press, Tucson,AZ, 305 pp.
Evans, L.T., 1998: Feeding the 10 Billion: Plants and Population Growth. Cam-bridge University Press, Cambridge, UK, 247 pp.
Evenson, R.E. and D. Gollin, 2003: Assessing the impact of the green revolu-tion. Science, 300, 758–762.
Evenson, R.E., C. Pray, and M.W. Rosegrant, 1999: Agricultural Research andProductivity Growth in India. IFPRI Research Report No. 109. Washington,D.C., International Food Policy Research Institute, 103 pp.
Ezzati, M., A. Lopez, A. Rodgers, S. Vander Hoorn, C. Murray, and the Com-parative Risk Assessment Collaborating Group, 2002: Selected major riskfactors and global and regional burden of disease. The Lancet, 360 (Novem-ber), 1347–1360.
FAO (Food and Agriculture Organization of the United Nations), 2004: Inter-national year of rice: rice is life. Online at: http://www.fao.org/rice2004/en/rice-us.htm.
PAGE 239
FAO, 2004a: The State of Food Insecurity in the World. Monitoring Progress towardsthe World Food Summit and Millennium Development Goals. Rome.
FAO, 2004b: The State of Food and Agriculture. Food and Agriculture Organiza-tion of the United Nations, Rome, 208 pp.
FAO, 2003: The State of Food Insecurity in the World. Monitoring Progress Towardsthe World Food Summit and Millennium Goals. Rome. 37 pp.
FAO, 2002: The State of World Fisheries and Aquaculture. FAO, Rome, 150 pp.FAO, 2001: The State of Food Insecurity in the World. Monitoring Progress towards
the World Food Summit and Millennium Development Goals. Rome, 36 pp.FAO, 1999: Fishery Information, Data and Statistics Unit Fisheries Circular No.
929, Revision 2. Number of fishers 1970–1997. Rome, 106pp.FAO, 1998: The State of the World’s Plant Genetic Resources for Food and Agriculture.
Rome, 29 pp.FAO, 1997: Computer Printout of FAOSTAT’s International Commodity
Prices 1989–91. Personal communication via Technical Advisory Commit-tee, CGIAR. Rome.
FAO, 1996: The Global Plan of Action for the Conservation and Sustainable Use ofPlant Genetic Resources for Food and Agriculture. Rome, 63 pp.
FAO FISHSTAT, 2003: Online at: http://www.fao.org/fi/statist/statist.asp.FAO/ NACA (Network of Aquaculture Centers in Asia-Pacific), 2001: Manual
of Procedures for the Implementation of the Asia Regional Technical Guidelines onHealth Management for the Responsible Movement of Live Aquatic Animals, FAOFisheries Technical paper 402/1. Rome. 106 pp.
FAOSTAT, 2004: Food and Agriculture Organization of the United Nations,Statistical Databases. Online at: http://faostat.fao.org
FAO/WHO (World Health Organization), 2002: Human Vitamin and MineralRequirements. Report of a Joint Expert Consultation, Bangkok, Thailand.FAO, Rome, 303 pp.
FAO/WHO/UNU (United Nations University), 1985: Energy and Protein Re-quirements. Report of a Joint FAO/ WHO/ UNU Expert consultation.WHO Technical Report Series, 724, 1–206.
Flegal, K.L., M.D. Carroll, C.L. Ogden, and C.L. Johnson, 2002: Prevalenceand trends in obesity among US adults, 1990–2000. Journal of the AmericanMedical Association. 288(14), 1723–1727.
Fogel, R., 1994: Economic growth population theory and physiology: thebearing of long-term processes on the making of economic policy. AmericanEconomic Review, 84 (3), 369–95.
Foley, J.A., M.H. Costa, C. Delire, N. Ramankutty, and P. Snyder, 2003:Green surprise? how terrestrial ecosystems could affect earth’s climate. Fron-tiers in Ecology and the Environment, 1(1), 38–44.
Foo, L.C., T. Zainab, G.R. Letchuman, M. Nafikudin, R. Arriman, P. Dorai-singam, and A.K. Khalid, 1994: Endemic goiter in the Lemanak and Ai rivervillages of Sarawak. Southeast Asian Journal of Tropical Medicine and. PublicHealth, 25(3), 575–8.
Galloway, J.N., F. Dentener, D. Capone, E. Boyer, R. Howarth, et al., 2004:Nitrogen cycles: past, present and future. Biogeochemistry, 70(2), 153–226.
Gillespie, S. and L. Haddad, 2002: Food Security as a Response to AIDS. Interna-tional Food Policy Research Institute, Annual Report Essay, in Aids and FoodSecurity, IFPRI, Washington DC, pp. 10–16.
Green, R.E., S.J. Cornell, J.P.W. Scharlemann, and A. Balmford, 2005: Farm-ing and the fate of wild nature. Science 307, 550–555.
Gu, L., 2003. Comment on ‘‘climate and management contributions to recenttrends in US agricultural yields.’’ Science 300, 1505b.
Habicht, J.P., 1992: Discussion: mortality, malnutrition and synergies: determi-nants and interventions. In: Child health priorities for the 90’s. K. Hill for TheJohns Hopkins University, Baltimore, MD, pp. 215–220.
Hazell, P.B.R. and C. Ramasamy (eds.), 1991: The Green Revolution Reconsid-ered: The Impact of High-yielding Rice Varieties in South India. Johns HopkinsUniversity Press, Baltimore, MD, 286 pp.
Hershman, J.M., G.A. Melnick, and R. Kastner, 1986: Economic conse-quences of endemic goiter. In: Towards the eradication of endemic goiter, cretinismand iodine deficiency. J.T. Dunn, E.A. Pretell, C.H. Daza, and F.E. Viteri (eds.),Pan-American Health Organization, Scientific Publication No. 502, Wash-ington, DC, pp. 96–106.
Horton, S., 1999: Opportunities for investment in nutrition in low-incomeAsia. Asian Development Review, 17 (1,2), 246–273.
Howarth R.W., E. Boyer, W. Pabich, and J.N. Galloway, 2002: Nitrogen usein the United States from 1961–2000 and potential future trends. Ambio 31,88–96.
Hsairi, M., F. Ben Slama, C. Ben Rayana, R. Fakhfakh, B. Romdhane, et al.,2003: Prevalence of endemic goiter in the north western region of Tunisia.Tunis Medicine, 72(12), 663–669.
................. 11432$ $CH8 10-11-05 14:56:19 PS

240 Ecosystems and Human Well-being: Current State and Trends
IFPRI (International Food Policy Research Institute), 2004: Ready for Action inAfrica? 2020 Vision Initiative. IFPRI Forum, Special Issue. May. Washington,DC, 8 pp.
IFPRI/CIAT (International Center for Tropical Agriculture), 2002: Biofortifica-tion: Harnessing Agricultural Technology to Improve the Health of the Poor. FutureHarvest, Washington, DC, 4 pp.
Jackson, B.C.J., M.X. Kirby, W.H. Berger, K.A. Bjorndal, L.W. Botsford, etal., 2001: Historical overfishing and the recent collapse of coastal ecosystems.Science 293, 692.
James, C., 2004: Preview: Global Status of Commercialized Biotech/GM Crops:2004. ISAAA Briefs. No. 32. ISAAA, Ithaca, NY. 12 pp.
Janick, J. and J.E. Simon (eds.), 1993: New Crops: Exploration, Research andCommercialization. American Society of Agronomy, John Wiley & Sons, Inc.,New York, 710 pp.
Johns, T., 2003. Plant biodiversity and malnutrition: simple solutions to com-plex problems. African Journal of Food, Agriculture, Nutrition and Development.3(1), 45–52.
Johns, T., 1990: With Bitter Herbs They Shall Eat It: Chemical Ecology and TheOrigins of Human Diet and Medicine. University of Arizona Press, Tucson, AZ,356 pp.
Johns, T. and B.R. Sthapit, 2004: Biocultural diversity in the sustainability ofdeveloping country food systems. Food and Nutrition Bulletin 25, 143–155.
Jones, G.V., M.A. White, and O.R. Cooper, 2004: Climate change and globalwine quality. Climatic Change (in review).
Jones, P., P. Shears, D. Hillier, D. Comfort, and J. Lowel, 2003: Return totraditional values? a case study of slow food. British Food Journal, 105(4–5),297–304.
Kaimowitz, D., 1996: Livestock and Deforestation in Central America in the 1980sand 1990s: A Policy Perspective. Center for International Forestry ResearchCIFOR, Bogor, Indonesia, 95 pp.
Kaufmann, R. and H. Fitzhugh, 2004: Importance of livestock for the world’spoor. In: Perspectives in World Food and Agriculture. C. Scanes and J. Miranow-ski (eds). Iowa State Press, 485 pp.
Kent, G., 1987: Fish, Food and Hunger: The Potential of Fisheries for AlleviatingMalnutrition. Westview Press, London, 201 pp.
Koziell, I. and J. Saunders (eds.), 2001: Living Off Biodiversity: Exploring Liveli-hoods and Biodiversity Issues in the Natural Resources Management, InternationalInstitute for Environment and Development, London, 269 pp.
Kuhnlein, H.V., O. Receveur, and H.M. Chan, 2001, Traditional food systemsresearch with Canadian indigenous peoples. International Journal of CircumpolarHealth 60(2), 112–112.
Lanata, C.F. and R.E. Black, 2001: Diarrheal diseases. In: Nutrition and Healthin Developing Countries. R. Semba and M.W. Bloem (eds.) Humana Press Inc,Totowa, NJ, pp. 93–129.
Lobell, D. and G. Asner, 2003: Climate and management contributions to re-cent trends in US agricultural yields. Science, 299, 1032.
Mahar, D. and R. Schneider, 1994. Incentives for tropical deforestation. someexamples from Latin America. In: The Causes of Tropical Deforestation. K. Brown,D.W. Pearce, (eds.), UCL Press, London, pp.159–171.
Maroni, M. and A. Fait, 1993: Health—effects in man from long-term exposureto pesticides: a review of the 1975–1991 literature. Toxicology, 78, 1–3.
Masters, W.A., 2005: Paying for prosperity: how and why to invest in agricul-tural R&D for development in Africa. Journal of International Affairs 58(2),35–64.
McIntire, J., D. Bourzat, and P. Pingali, 1992: Crop-livestock interactions in sub-Saharan Africa. World Bank, Washington, DC, 246 pp.
Mead P.S., L. Slutsker, V. Dietz, L. F. McCaig, J.S. Bresee, et al., 1999: Foodrelated illness and death in the United States. Emerging Infectious Diseases, 5(5),607–625.
Mellor, J.W. (ed.), 1995: Agriculture on the Road to Industrialization. Johns Hop-kins University Press, Baltimore, MD, 358 pp.
Mendez, M.A., C.A. Monteiro, and B.M. Popkin, 2005: Overweight exceedsunderweight among women in most developing countries. American Journalof Clinical Nutrition, 81, 714 �21.
Millennium Ecosystem Assessment, 2003: Ecosystems and Human Well-being.Island Press, Washington DC, 245 pp.
Mirza, M.N., L.E. Caulfield, R.E. Black, and W.M. Macharia, 1997: Riskfactors for diarrheal duration. American Journal of Epidemiology, 146(9), 776.
Mori, H. and W.D.Gorman, 1999: A cohort analysis of Japanese food consump-tion–old and new generations. Senshu Economics Bulletin, 34( 2), 71–111.
Myers, N.A., R.A. Mittermeier, C.G. Mittermeier, G.A.B. da Fonseca, andJ. Kent, 2000: Biodiversity hotspots for conservation priorities. Nature, 403,853–858.
PAGE 240
Naylor, R.L., W. Falcon, R. Goodman, M. Jahn, T. Sengooba, H. Tefera, andR. J. Nelson, 2004: Biotechnology in the developing world: a case for in-creased investments in orphan crops. Food Policy 29, 15–44.
Naylor, R., W. Falcon, N. Wada and D. Rochberg, 2002: Using El Nino-Southern Oscillation climate data to improve food policy planning in Indo-nesia. Bulletin Indonesian Economic Studies, 38, 75.
Naylor, R., R. Goldburg, J. Primavera, N. Kautsky, M. Beveridge, et al., 2000:Effect of aquaculture on world fish supplies. Nature, 405, 1017–1024.
Neumann, C.G. and D.M. Harris, 1999: Contribution of Animal Source Foods inImproving Diet Quality for Children in the Developing World. [online] Commis-sioned paper for the World Bank, Washington, DC, cited 18 February 2005.Available at http://glcrsp.ucdavis.edu/projects/project_subpages/CNP_folder/CNPWB.pdf.
OECD (Organisation for Economic Co-operation and Development), 2004:Producer and Consumer Support Estimates OECD Database, 1986–2003.User Guide and Data Files. Online at: www.oecd.org/document/58/0,2340,en_2649_201185_32264698_1_1_1_1,00.html.
OECD, 2003a: Agricultural Policies in OECD Countries: Monitoring and Evalua-tion. Paris, 296 pp.
OECD, 2003b: OECD Agricultural Outlook 2003/2008. Paris, 212 pp.Ollila, E., n.d.: Kansainvalinen terveyspolitiikka.[online] Cited February 28
2005. Available at http://www.valt.helsinki.fi/staff/jkoponen/b1104/eevaollilla220304.pdf.
Pardey, P.G. and N.M. Beintema, 2001: Slow Magic: Agricultural R&D a Centuryafter Mendel. International Food Policy Research Institute Food Policy Re-port. Washington DC, 30 pp.
Parry, M.L., C. Rosenzweig, A. Iglesias, M. Lovermore, and G. Fishcher, 2004:Effects of climate change on global food production under SRES emissionsand socio-economic scenarios. Global Environmental Change, 14, 53–67.
Pauly, D., J. Alder, E. Bennett, V. Christensen, P. Tyedmers, and R. Watson,2003: The future for fisheries. Science 302, 1359–1361.
Pauly, D, V. Christensen, J. Dalsgaard, R. Froese, and F. Torres, 1998: Fishingdown marine food webs. Science, 279, 860–863.
Pimbert, M., 1999: Agricultural Biodiversity. In Cultivating Our Futures. FAO,Rome.
Popkin, B., 2000: Urbanization and the Nutrition Transition. Policy Brief 7 of10. Focus 3. In: Achieving Urban Food and Nutrition Security in the DevelopingWorld. J. Garret and M. Ruel (eds.), International Food Policy Research In-stitute, Washington, DC, 20 pp.
Popkin, B., 1998: The nutrition transition and its health implications in lowerincome countries. Public Health Nutrition, 1, 5–21.
Popkin, B.M., 1993: Nutritional patterns and transitions. Population and Devel-opment Review 19(1), 138–157.
Popkin B.M., S. Horton, and S. Kim, 2001: The nutrition transition and pre-vention of diet-related diseases in Asia and the Pacific. Food Nutrition Bulletin,22, 51–58.
Pritchett, L. and L.H. Summers, 1993: Wealthier is healthier. Journal of HumanResources, 31(4), 842–868.
Rahmathullah, L., J.M. Tielsch, R.D. Thulasiraj, J. Katz, C. Coles, et al.,2003: Impact of supplementing newborn infants with vitamin A on earlyinfant mortality: community based randomized trial in Southern India. BritishMedical Journal, 327(7409), 254.
Ramankutty, N. and J. A. Foley, 1998: Characterizing patterns of global landuse: an analysis of global croplands data. Global Biogeochemical Cycles, 12(4),667–685.
Receveur O., M. Boulay, and H.V. Kuhnlein, 1997: Decreasing traditional fooduse affects diet quality for adult Dene/Metis in 16 communities of the Cana-dian Northwest Territories. Journal of Nutrition 12(11), 2179–2186._
Regmi, A. and J. Dyck, 2001: Effects of urbanization on global food demand.In: Changing Structure of Global Food Production and Trade, A. Regmi (ed.),Economic Research Service, U.S. Department of Agriculture, Washington,DC, pp. 23–30.
Reutlinger, S. and J. van Holst Pellekan, 1986: Poverty and Hunger: Issues andOptions for Food Security in Developing Countries. World Bank, Washington,DC, 82 pp.
Rguibi M. and R. Belahsen, 2004: Metabolic syndrome among Moroccan Sah-raoui adult women. American Journal of Human Biology, 16, 598–601.
Rice, A.L., K.P. West, and R.E. Black, 2003: Vitamin A deficiency. In: Compar-ative Quantification of Health Risks: Global and Regional Burden of Disease Attrib-utable to Selected Major Risk Factors. M. Ezzati et al. (eds.), WHO, Geneva,2248 pp.
Roe, T. and M. Gopinath, 1998: The ‘‘miracle’’ of U.S. agriculture. MinnesotaAgricultural Economist, 69, 1–4.
................. 11432$ $CH8 10-11-05 14:56:20 PS

241Food
Rosenzweig, C. and M. Parry. 1996. Potential impact of climate change onworld food supply. Nature, 367, 133–138.
Runge, C.F., B. Senaur, P. Pardey, and M. W. Rosegrant, 2003: Ending Hungerin Our Lifetime: Food Security and Globalization. Johns Hopkins UniversityPress, Baltimore, MD, 204 pp.
Ruttan, V., 2002: Technology, Growth and Development: An Induced InnovationPerspective. New York, Oxford University Press, 672 pp.
Satheesh, S.V., 2000: Uncultivated Food and the Poor. Proceedings of South AsianWorkshop on Uncultivated Food and Plants. Policy Research for Develop-ment Alternative, Shaymoli, Dhaka, Bangladesh, pp.78–92.
Schelp, F.P., 1998: Nutrition and infection in tropical countries—implicationsfor public health intervention: a personal perspective. Nutrition, 14(2), 217–222.
Science Daily, 2003: Climate change in the vineyards: a taste of global warm-ing [online]. Cited April 21, 2005. Available from Science Daily at http://www.sciencedaily.com/releases/2003/11/031104064327.htm.
Scoones, I., M. Melnyck, and J. Pretty (eds.), 1992: The Hidden Harvest—ALiterature Review and Annotated Bibliography. International Institute for Envi-ronment and Development, London, 260 pp.
Shand, H., 1997: Human Nature: Agricultural Biodiversity and Farm-based FoodSecurity. Rural Advancement Foundation International, Ottawa, 110 pp.
Simmonds, N.W., 1993: Introgression and incorporation. strategies for the useof crop genetic resources. Biological Reviews, 68, 539–562.
Sinclair, T.R., L.C. Purcell, and C.H. Sneller, 2004: Crop transformation andthe challenge to increase yield potential. Trends in Plant Science, 9, 70–75.
Smil, V., 2000: Feeding the World – A Challenge for the 21st Century. The MITPress, Cambridge, MA, 360 pp.
Smith, B.D., 1995 The Emergence of Agriculture. Scientific American Library,New York, 231 pp.
Smith, L. and L. Haddad, 2000: Overcoming Child Malnutrition in DevelopingCountries: Past Achievements and Future Choices. Food Agriculture and the En-vironment Discussion Paper 30. International Food Policy Research Institute,Washington, DC, 66 pp.
Sombroek, W.G. and R. Gommes, 1996: The climate change-agriculture co-nundrum. In Global Climate Change and Agricultural Production. F. Bazzaz andW. Sombroek, eds. West Sussex, Wiley, 345 pp.
Strauss, J., 1986: Does better nutrition raise farm productivity? Journal of PoliticalEconomy, 94(2), 297–320.
Thompson, L.M., 1998: Effects of changes in climate and weather variabilityon the yield of corn and soybean. Agronomy Journal/Production Agriculture, 1,pp. 20–27.
Tomek, W.G. and K.L. Robinson, 1981: Agricultural Product Prices. CornellUniversity Press, Ithaca, NY, 367 pp.
Trichopoulou, A. and E. Vaasilopoulou, 2000: Mediterranean diet and lon-gevity. British Journal of Nutrition, 84, S209.
UN (United Nations), 2004: World Urbanization Prospects: The 2003 Revision.New York, 335 pp.
UN, 2001: World Urbanization Prospects: The 2001 Revision. New York, 190 pp.UN, 1998: World Urbanization Prospects: The 1998 Revision. New York.UNDP (United Nations Development Programme), 2003: Human Development
Report 2003. Oxford University Press, New York, 384 pp.UNICEF (United Nations Children’s Fund), 1998: State of the World’s Children.
Oxford University Press, New York, 131 pp.Unnevehr, L.J. (ed.), 2003: Food Safety in Food Security and Food Trade. 2020
Focus No. 10. International Food Policy Research Institute, Washington,DC, 38 pp.
PAGE 241
UN/SCN (United Nations Standing Committee on Nutrition), 2004: Nutritionfor Improved Development Outcomes. 5th Report on The World Nutrition Situation.WHO, Geneva, 143 pp.
Uusitalo, U., P. Pietinen, and P. Puska, 2002: Dietary transition in developingcountries: challenges for chronic disease prevention. In: Globalization, Dietsand Non-communicable Diseases. WHO, Geneva, pp.1–25.
Verner, D., 2004: Education and Its Poverty-reducing Effects: The Case of Paraıba,Brazil, Policy Research Working Paper 3321. World Bank, Washington DC.
Vosti, S., J. Witcover, and C. L. Carpentier, 2002: Agricultural Intensification bySmallholders in the Western Brazilian Amazon. International Food Policy Re-search Institute, Research Report 130, Washington, DC, 147 pp.
Wang, G. and L. You, 2004: Delayed impact of the North Atlantic Oscillationon biosphere productivity in Asia. Geophysical Research Letters, 31 (12),L12210, doi:10.1029/2004GL019766.
Wang, X. and K. Taniguchi, 2003: Does better nutrition enhance economicgrowth? the economic cost of hunger. In: Nutrition Intake and EconomicGrowth. Studies on the Cost of Hunger. K. Taniguchi and X. Wang (eds.), FAO,Rome, 126 pp.
Watkins, K. and J. von Braun, 2003: Time to Stop Dumping On The World’sPoor. 2002–2003 International Food Policy Research Institute, Annual Re-port Essay. Washington, DC, 18 pp.
WHO (World Health Organization), 2005: Modern Food Biotechnology, HumanHealth and Development: An Evidence-based Study. Geneva. 84 pp.
WHO, 2004a: 20 questions on genetically modified foods [online]. WHO Ge-neva, cited February 28, 2005. Available at http://www.who.int/foodsafety/publications/biotech/20questions/en/.
WHO, 2004b: Micronutrient deficiencies [online]. WHO, Geneva, cited Feb-ruary 28, 2005. Available at http://www.who.int/nut/mic.
WHO, 2004c: Chronic disease information sheets. Global strategy diet andphysical activity [online]. WHO, Geneva, cited February 28, 2005. Availableat http://www.who.int/dietphysicalactivity/publications/facts/en/.
WHO, 2004d: Global database on bodymass index [online]. WHO, Geneva,cited February 28, 2005. Available at http://www.who.int/nut/db_bmi.htm.
WHO, 2003a: Obesity and overweight. Global strategy on diet, physical activityand health [online] WHO, Geneva, cited February 28, 2005. Available athttp://www.who.int/dietphysicalactivity/publications/facts/obesity/en/.
WHO, 2003b: Diet, Nutrition and the Prevention of Chronic Diseases. WHO Tech-nical Report Series 916. Geneva, 160 pp.
WHO, 2002a: Globalization, Diets and Non-communicable Diseases. WHO, Ge-neva, 185 pp.
WHO, 2002b: Food safety and food borne illness [online] WHO, Geneva, citedFebruary 28, 2005. Available at http://www.who.int/mediacentre/factsheets/fs237/en/.
WHO, 2000: Collaborative study team on the role of breastfeeding on the pre-vention of infant mortality. Effect of breastfeeding on infant and child mortal-ity due to infectious diseases in less developed countries: a pooled analysis.The Lancet, 355, 451–455.
Wood, S., K. Sebastian and S.J. Scherr, 2000: Pilot Analysis of Global Ecosystems:Agroecosystems. A joint study by International Food Policy Research Instituteand World Resources Institute. Washington, DC, 110 pp.
World Bank, 2004: World Development Indicators [CD-ROM] World Bank,Washington, DC.
World Bank, 2003: World Development Indicators [CD-ROM].World Bank,Washington, DC.
Yusuf H.K., S. Quazi, M.N. Islam, T. Hoque, K.M. Rahman, et al., 1994:Current status of iodine-deficiency disorders in Bangladesh. The Lancet,343(8909), 1367–1368.
................. 11432$ $CH8 10-11-05 14:56:21 PS