chapter 6: capacity and location planning 1 solutions to chapter 6 exercises
Post on 21-Dec-2015
238 views
TRANSCRIPT

Chapter 6: Capacity and Location Planning
1
Solutions to Chapter 6 Exercises

Chapter 6: Capacity and Location Planning
2
Exercise 1
a. 60/6 = 10 tests/hour
b. 45/10 = 4.5 hours
c. 45
318 270 minutes (or 4.5 hours)
45
418 202 5 . minutes (or 3.375 hours)

Chapter 6: Capacity and Location Planning
3
Exercise 1 continued
d. 60/3 = 20 tests/hour
45/20 = 2.25 hours
e. The fifth professor would reduce the work but not the total time since two sections are both taking 3 minutes to grade.

Chapter 6: Capacity and Location Planning
4
Exercise 2aType of Utilization
Number of Next Cycle Hourly EfficiencyMachines Machine A B C Time Output (%)
3 -- 3 4 6 6 10 724 C 3 4 3 4 15 815 B 3 2 3 3 20 876 A (or C) 1.5 2 3 3 20 727 C 1.5 2 2 2 30 938 B (or C) 1.5 1.33 2 2 30 819 C 1.5 1.33 1.5 1.5 40 96
Machine Times (minutes)
Natural operating points are 5, 7, and 9 machines.

Chapter 6: Capacity and Location Planning
5
Exercise 2b - Lines 1 and 2 (Identical Data)
Cycle Hourly Efficiency ExtraA B C Time Output (%) Machine Type3 4 6 6 10 72 -- --3 4 4 4* 15 93** 1 C3 2.67 4 4 15 81 2 B3 2.67 3 3 20 96 3 C
Machine Times (minutes)
* 12 minutes of total work in both lines divided by three machines = 4 minutes
** 13 minutes of output divided by 3.5 machines times 4 minutes of cycle time = 93%.

Chapter 6: Capacity and Location Planning
6
Exercise 2b concluded
• Sharing machines between lines increases flexibility and efficiency considerably when there are a small number of processing machines.
• If the lines are initially identical, it is best to equally share the machine’s time.

Chapter 6: Capacity and Location Planning
7
Exercise 3
1000 0 8 0 75
1667
. ( . )C
C units / year

Chapter 6: Capacity and Location Planning
8
Exercise 4• First determine learning rate
• From table in text this corresponds to a 60% learning rate.
• This sixth unit will require approximately 0.267(5) = 1.602 labor hours.
• From the table in the text, the first five units will require 2.71(6) = 16.26 labor hours.
18324
53054
..

Chapter 6: Capacity and Location Planning
9
Exercise 5
• Use the cumulative table:
• Read across the 25th row of table to a rate of 85%.
103 6
714 8
..

Chapter 6: Capacity and Location Planning
10
Exercise 6
• Unit 1: 200 hours
• First 50: (63.1 hrs./unit)50 units = 3155 hrs.
• In cumulative table at 50 units locate 15.78 at 75% rate.
3155
20015 775 .
Chapter 6: Capacity and Location Planning
11
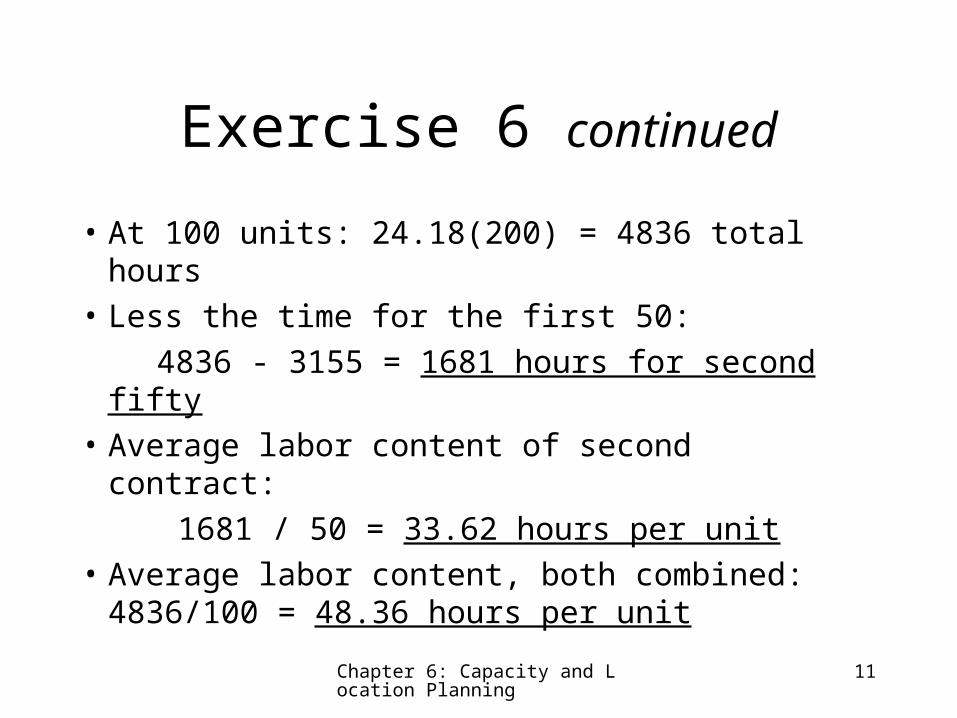
Exercise 6 continued
• At 100 units: 24.18(200) = 4836 total hours• Less the time for the first 50:
4836 - 3155 = 1681 hours for second fifty• Average labor content of second contract:
1681 / 50 = 33.62 hours per unit• Average labor content, both combined:
4836/100 = 48.36 hours per unit

Chapter 6: Capacity and Location Planning
12
Exercise 6 concluded• At a labor rate of $10/hour, the first fifty cost $631
each, so they lose money.• The second fifty cost $336.20 each and thus make
money.• Between both contracts, they cost $483.60 each, on
average, so the net result was a profit for the firm of $550 - 484 = $66 each for a total of $6600.
• One implication is to bid under cost to get a contract and then make a profit on follow-on contracts.

Chapter 6: Capacity and Location Planning
13
Exercise 7• Report 1 required 9.5 hours
• Report 3 required 4.8 hours
4.8 / 9.5 = .505
• The learning rate from table is 65%
• Report 4 will take: .4225(9.5) = 4.01
• Report 5 will take .3678(9.5) = 3.49
• Time to compete 4 and 5: 7.5 hours
• Therefore, will not be completed on time.

Chapter 6: Capacity and Location Planning
14
Exercise 8
• Site I: Sum = 871 total feet
• Site II: Sum= 835 total feet
• Site III: Sum = 956 total feet
• Site II is Best

Chapter 6: Capacity and Location Planning
15
Exercise 9
123456789
A B C D E
Site# Trips Dest. I II III
15 1 4695 3315 11706 2 1128 2256 612
12 3 2256 1104 5340233 4 1188 4092 405921 5 1869 462 4368
Sum 11,136 11,229 15,549
Site I is best.

Chapter 6: Capacity and Location Planning
16
Exercise 10
• Variable Cost per Unit– Location 1: $3.51– Location 2: 3.05– Location 3: 2.59
• Next decade’s sales: 48,000 to 96,000 units/year

Chapter 6: Capacity and Location Planning
17
Exercise 10 continued
12345678910
A B C D
Location 1 Location 2 Location 3Fixed Cost 400,000 500,000 600,000Var. Cost @ 48,000 168,480 146,400 124,320 @ 96,000 336,960 292,800 248,640
Total Cost @ 48,000 568,480 646,400 724,320 @ 96,000 736,960 792,800 848,640
Even with an increase in labor costs, production volume (and the related savings of locations 2 and 3) is not sufficient to offset the lower annual fixed cost of location 1.

Chapter 6: Capacity and Location Planning
18
Exercise 11 - Factor Weight Computation
• Clientele = 1
• Rent = .9 1 = .9
• Indoor Mall = .95 .9 = .855
• Volume = .8 .9 = .72

Chapter 6: Capacity and Location Planning
19
Exercise 11 - Location 1
• Clientele: 1 2 = 2
• Rent: .9 3 = 2.7
• Indoor Mall: .855 3 = 2.565
• Volume: .72 3 = 2.16
• Total Factor Weighted Score = 9.425

Chapter 6: Capacity and Location Planning
20
Exercise 11 - Location 2
• Clientele: 1 3 = 3
• Rent: .9 2 = 1.8
• Indoor Mall: .855 1 = .855
• Volume: .72 2 = 1.44
• Total Factor Weighted Score = 7.095

Chapter 6: Capacity and Location Planning
21
Exercise 11 - Location 3
• Clientele: 1 1 = 1
• Rent: .9 1 = .9
• Indoor Mall: .855 3 = 2.565
• Volume: .72 3 = 2.16
• Total Factor Weighted Score = 6.625

Chapter 6: Capacity and Location Planning
22
Exercise 11 - Location 4
• Clientele: 1 3 = 3
• Rent: .9 3 = 2.7
• Indoor Mall: .855 1 = .855
• Volume: .72 1 = .72
• Total Factor Weighted Score = 7.275
• Nina should select location 1.