chapter 5 traffic study - jicaopen_jicareport.jica.go.jp/pdf/12229738_02.pdf · traffic study 5.1...
TRANSCRIPT

CHAPTER 5
TRAFFIC STUDY

5-1
CHAPTER 5 TRAFFIC STUDY
5.1 PRESENT TRAFFIC CONDITION
5.1.1 Type of Traffic Surveys Undertaken
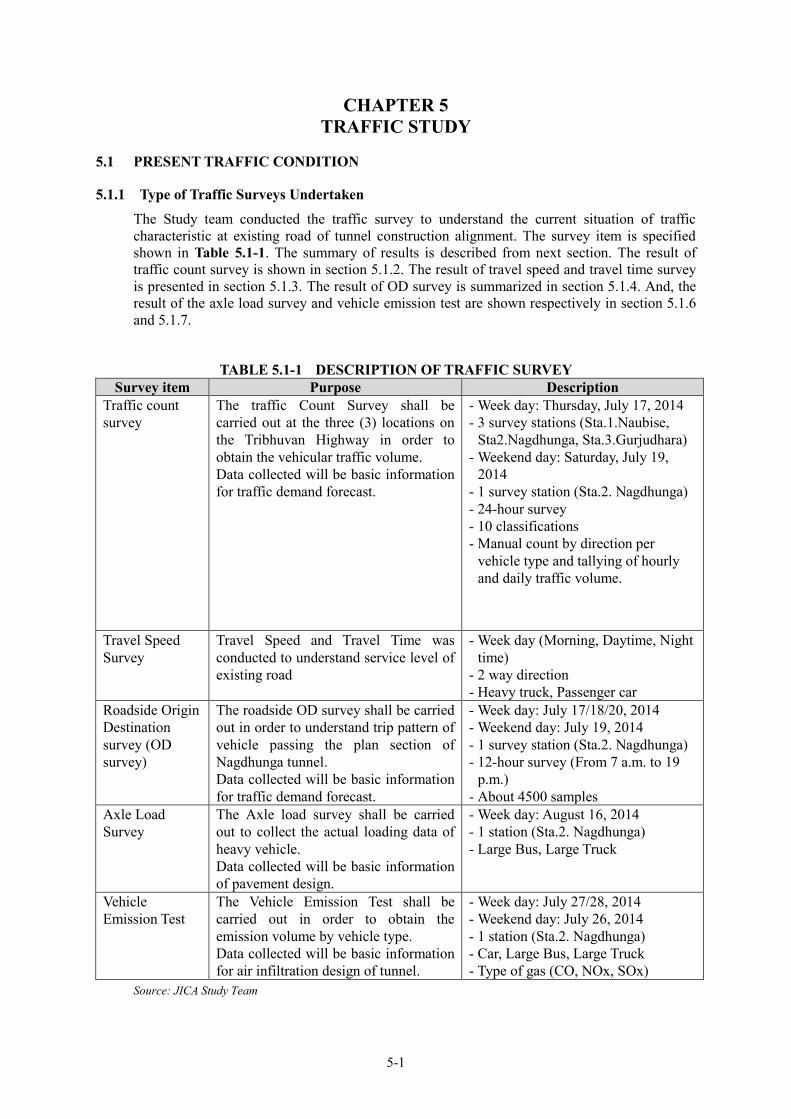
The Study team conducted the traffic survey to understand the current situation of traffic characteristic at existing road of tunnel construction alignment. The survey item is specified shown in Table 5.1-1. The summary of results is described from next section. The result of traffic count survey is shown in section 5.1.2. The result of travel speed and travel time survey is presented in section 5.1.3. The result of OD survey is summarized in section 5.1.4. And, the result of the axle load survey and vehicle emission test are shown respectively in section 5.1.6 and 5.1.7.
TABLE 5.1-1 DESCRIPTION OF TRAFFIC SURVEY Survey item Purpose Description
Traffic count survey
The traffic Count Survey shall be carried out at the three (3) locations on the Tribhuvan Highway in order to obtain the vehicular traffic volume. Data collected will be basic information for traffic demand forecast.
- Week day: Thursday, July 17, 2014 - 3 survey stations (Sta.1.Naubise,
Sta2.Nagdhunga, Sta.3.Gurjudhara) - Weekend day: Saturday, July 19,
2014 - 1 survey station (Sta.2. Nagdhunga) - 24-hour survey - 10 classifications - Manual count by direction per
vehicle type and tallying of hourly and daily traffic volume.
Travel Speed Survey
Travel Speed and Travel Time was conducted to understand service level of existing road
- Week day (Morning, Daytime, Night time)
- 2 way direction - Heavy truck, Passenger car
Roadside Origin Destination survey (OD survey)
The roadside OD survey shall be carried out in order to understand trip pattern of vehicle passing the plan section of Nagdhunga tunnel. Data collected will be basic information for traffic demand forecast.
- Week day: July 17/18/20, 2014 - Weekend day: July 19, 2014 - 1 survey station (Sta.2. Nagdhunga) - 12-hour survey (From 7 a.m. to 19
p.m.) - About 4500 samples
Axle Load Survey
The Axle load survey shall be carried out to collect the actual loading data of heavy vehicle. Data collected will be basic information of pavement design.
- Week day: August 16, 2014 - 1 station (Sta.2. Nagdhunga) - Large Bus, Large Truck
Vehicle Emission Test
The Vehicle Emission Test shall be carried out in order to obtain the emission volume by vehicle type. Data collected will be basic information for air infiltration design of tunnel.
- Week day: July 27/28, 2014 - Weekend day: July 26, 2014 - 1 station (Sta.2. Nagdhunga) - Car, Large Bus, Large Truck - Type of gas (CO, NOx, SOx)
Source: JICA Study Team

5-2
Source: JICA Study Team
FIGURE 5.1-1 LOCATION OF TRAFFIC SURVEY STATION
Source: JICA Study Team 17 July, 2014
PHOTO 5.1-1 TRAFFIC COUNT SURVEY
Source: JICA Study Team, 17July 2014
PHOTO 5.1-2 ROADSIDE ORIGIN DESTINATION SURVEY (OD SURVEY)
Sta.1 Naubise -Traffic Count Survey
Sta.3 Gurjudhara -Traffic Count Survey
Sta.2 Nagdhunga -Traffic Count Survey -Roadside OD survey -Axle load survey -Vehicle emission test

5-3
Source: JICA Study Team, 16 august 2014
PHOTO 5.1-3 AXLE ROAD SURVEY
Source: JICA Study Team, 28 July 2014
PHOTO 5.1-4 VEHICLE EMISSION TEST 5.1.2 Traffic Volume
(1) Traffic volume
The result of traffic count survey at 3 stations is shown in Table 5.1-2. According this survey result, total traffic volume including motorcycle is 7,462 veh. on Sta.1 Naubise, 7,890 veh. on Sta.2 Nagdhunga, and 15,454 veh. on Sta.3 Gurjudhara shown in Figure 5.1-2. In the same way, total traffic volume without motorcycle is 5,778 veh. on Sta.1 Naubise, 6,474 veh. on Sta.2 Nagdhunga, and 9,393 veh. on Sta.3 Gurjudhara Figure 5.1-3. Based on Nepal Road Standards 2070, The equivalency Factors in terms of PCU shown in Table 5.1-2 was used to convert to PCU from traffic volume.
TABLE 5.1-2 RESULT OF TRAFFIC COUNT SURVEY
Source: JICA Study Team
Classification 1. Naubise%
Total%
w/o MC 2. Nagdhunga%
Total%
w/o MC 3. Gurjudhara%
Total%
w/o MC1. Motor Cycle 1,684 23% 1,416 18% 6061 39%2. Car & Taxi 1,132 15% 20% 1,347 17% 21% 2116 14% 23%3. Utility Pick up 287 4% 5% 330 4% 5% 752 5% 8%4. Micro Bus 668 9% 12% 771 10% 12% 1886 12% 20%5. Mini Bus 291 4% 5% 480 6% 7% 1024 7% 11%6. Heavy Bus 926 12% 16% 1,138 14% 18% 986 6% 10%7. Light Truck 175 2% 3% 480 6% 7% 212 1% 2%8. Heavy Truck 1,392 19% 24% 1,097 14% 17% 1438 9% 15%9. Multi-axel Truck 894 12% 15% 831 11% 13% 846 5% 9%10. Others 13 0% 0% 0 0% 0% 133 1% 1%Total (All type of Veh.) 7,462 100% - 7,890 100% - 15,454 100% -
Share of Heavy Veh. 43% - - 39% - - 21% - -Share of Heavy truck 31% - - 24% - - 15% - -PCU 5,778 - - 6,474 - - 9,393 - -
Total(w/o 1.Motor Cycle) 5,778 - 100% 6,474 - 100% 9,393 - 100%Share of Heavy Veh. 56% - - 47% - - 35% - -Share of Heavy truck 40% - - 30% - - 24% - -PCU 5,778 - - 6,474 - - 9,393 - -

5-4
TABLE 5.1-3 EQUIVALENCY FACTORS IN TERMS OF PCU SN Vehicle Type PCU Equivalency Factor 1 Motorcycle 0.5 2 Car 1.0 3 Utility 1.0 4 Microbus 1.5 5 Minibus 3.0 6 Bus 3.0 7 Light Truck 1.5 8 Heavy Truck 3.0 9 Multi Axle Truck 3.0
10 Other 1.0 Source: Nepal Road Standards 2070 (2013)
Source: JICA Study Team
FIGURE 5.1-2 TOTAL TRAFFIC VOLUME BY VEHICLE TYPE
Source: JICA Study Team
FIGURE 5.1-3 TOTAL TRAFFIC VOLUME W/O MOTOR CYCLE BY VEHICLE TYPE
(2) Hourly variation of traffic volume
Regarding hourly variation for 24 hour, a similar trend was observed generally in 3 stations. The peak time in Sta.1 and Sta.2 is 9 a.m. On Sta.3 where has shops and houses on roadside, its peak time is 10 a.m. No major hourly variation is identified during daytime. After 19 p.m.
0
2,000
4,000
6,000
8,000
10,000
12,000
14,000
16,000
1. Naubise 2. Nagdhunga 3. Gurjudhara
6. Heavy Truck
5. Light Truck
4. Heavy Bus
3. Light Bus
2. Car
1. Motor Cycle
7462 7890
15454(Veh.)
0
2,000
4,000
6,000
8,000
10,000
1. Naubise 2. Nagdhunga 3. Gurjudhara
6. Heavy Truck
5. Light Truck
4. Large Bus
3. Bus
2. Car
57786474
9393(Veh.)

5-5
Traffic decreased gradually after 19 p.m. and that of night time during 23 p.m. to 4 a.m. is small.
Source: JICA Study Team
FIGURE 5.1-4 HOURLY VARIATION OF TRAFFIC VOLUME (W/O MOTOR CYCLE)
*Red line is eastbound, blue line is westbound Source: JICA Study Team
FIGURE 5.1-5 HOURLY VARIATION BY DIRECTION AT STA.1 NAUBISE
*Red line is eastbound, blue line is westbound Source: JICA Study Team
FIGURE 5.1-6 HOURLY VARIATION BY DIRECTION AT STA.2 NAGDHUNGA
*Red line is eastbound, blue line is westbound Source: JICA Study Team
FIGURE 5.1-7 HOURLY VARIATION BY DIRECTION AT STA.3 GURJUDHARA
(3) Traffic composition and share of heavy vehicle
Figure 5.1-8 illustrates traffic composition of 3 stations. The circle graph on left shows Total number of vehicle, that on right is total number w/o motor cycle. The share of heavy vehicle for the case of no motor cycle is approximately 50% at Sta. Nagdhunga.
0100200300400500600700800
7 8 9 10 11 12 13 14 15 16 17 18 19 20 21 22 23 0 1 2 3 4 5 6
1. Naubise 2. Nagdhunga 3. Gurjudhara(Veh.)
0
100
200
300
400
500
7 8 9 10 11 12 13 14 15 16 17 18 19 20 21 22 23 0 1 2 3 4 5 6
0
100
200
300
400
500
7 8 9 10 11 12 13 14 15 16 17 18 19 20 21 22 23 0 1 2 3 4 5 6
0100200300400500600700800900
1,000
7 8 9 10 11 12 13 14 15 16 17 18 19 20 21 22 23 0 1 2 3 4 5 6

5-6
Total number of vehicle Total number of vehicle w/o Motor Cycle
*HV: Heavy Vehicle Source: JICA Study Team
FIGURE 5.1-8 TRAFFIC COMPOSITION OF 3 STATIONS
TABLE 5.1-4 SHARE OF HEAVY VEHICLE OF 3 STATIONS Classification 1. Naubise % 2. Nagdhunga % 3. Gurjudhara % Light Vehicle 4,250 57% 4,824 61% 12,184 79%
Heavy Vehicle
Bus 926 12% 1,138 14% 986 6%
Truck 2,286 31% 1,928 24% 2,284 15%
Total 7,462 100% 7,890 100% 15,454 100%
Source: JICA Study Team
23%
19%
13%2%
12%
31%
1. Motor Cycle
2. Car
3. Light Bus
5. Light Truck
4. Heavy Bus
6. Heavy Truck
25%
17%
3%16%
40%
1. Motor Cycle
2. Car
3. Light Bus
5. Light Truck
4. Heavy Bus
6. Heavy Truck
18%
21%
16%6%
14%
24%
1. Motor Cycle
2. Car
3. Light Bus
5. Light Truck
4. Heavy Bus
6. Heavy Truck
26%
19%
7%
18%
30%
1. Motor Cycle
2. Car
3. Light Bus
5. Light Truck
4. Heavy Bus
6. Heavy Truck
39%
19%
19%
1%6%
15%1. Motor Cycle
2. Car
3. Light Bus
5. Light Truck
4. Heavy Bus
6. Heavy Truck
32%
31%2%
10%
24%
1. Motor Cycle
2. Car
3. Light Bus
5. Light Truck
4. Heavy Bus
6. Heavy Truck
HV=36%
HV=43%
HV=21%
HV=48%
HV=56%
HV=34%
Sta.1 Naubise
Sta.2 Nagdhunga
Sta.3 Gujudhara

5-7
TABLE 5.1-5 SHARE OF HEAVY VEHICLE W/O MORTAR CYCLE OF 3 STATIONS Classification 1. Naubise % 2. Nagdhunga % 3. Gurjudhara % Light Vehicle 2,566 44% 3,408 53% 6,123 65%
Heavy Veh.
Bus 926 16% 1,138 18% 986 10%
Truck 2,286 40% 1,928 30% 2,284 24%
Total 5,778 100% 6,474 100% 9,393 100%
Source: JICA Study Team
Source: JICA Study Team
FIGURE 5.1-9 SHARE OF HEAVY VEHICLE OF ALL TYPE VEHICLES AT 3 STATIONS
Source: JICA Study Team
FIGURE 5.1-10 SHARE OF HEAVY VEHICLE OF ALL TYPE VEHICLES W/O MOTOR CYCLE
(4) Share of day –night time traffic volume
The share of day - night time between 1.35-1.43 is about average. Sta.3. Gurjudhara where is a roadside land use indicates a relatively low value. This means that the traffic of nighttime is larger in comparison to other two stations.
TABLE 5.1-6 SHARE OF DAY – NIGHT TIME TRAFFIC VOLUME (Veh.)
1. Naubise 2. Nagdhunga 3. Gurjudhara
Day time (7 am – 19 pm) 5,235 5,720 11,411
Night time (19 am – 7 am) 2,227 2,170 4,043 Total 7,462 7,890 15,454
Total / Day time 1.43 1.38 1.35 Source: JICA Study Team
0%
10%
20%
30%
40%
50%
60%
70%
80%
90%
100%
7 8 9 10 11 12 13 14 15 16 17 18 19 20 21 22 23 0 1 2 3 4 5 6
1. Naubise 2. Nagdhunga 3. Gurjudhara
0%
10%
20%
30%
40%
50%
60%
70%
80%
90%
100%
7 8 9 10 11 12 13 14 15 16 17 18 19 20 21 22 23 0 1 2 3 4 5 6
1. Naubise 2. Nagdhunga 3. Gurjudhara

5-8
(5) Comparison of Weekday-Holiday
1) Traffic Volume
In this section, a comparative analysis of traffic on weekday and holiday is done with the traffic survey result on Sta.2 Nagdhunga. Regarding the traffic volume of the road section, the traffic on holiday is 1.3 times larger than weekday based on hour survey.
TABLE 5.1-7 TRAFFIC SURVEY RESULT AT STA.2 NAGDHUNGA
Source: JICA Study Team
Source: JICA Study Team
FIGURE 5.1-11 COMPARISON OF TOTAL TRAFFIC VOLUME BY VEHICLE TYPE
ClassificationWeek day
(a)%
Total%
w/o MCHoliday
(b)%
Total%
w/o MCb/a
1. Motor Cycle 1,416 18% 1,789 19% 1.262. Car & Taxi 1,347 17% 21% 1,673 18% 22% 1.243. Utility Pick up 330 4% 5% 321 3% 4% 0.974. Micro Bus 771 10% 12% 764 8% 10% 0.995. Mini Bus 480 6% 7% 456 5% 6% 0.956. Heavy Bus 1,138 14% 18% 1,075 11% 14% 0.947. Light Truck 480 6% 7% 404 4% 5% 0.848. Heavy Truck 1,097 14% 17% 2,243 24% 29% 2.049. Multi-axel Truck 831 11% 13% 748 8% 10% 0.9010. Others 0 0% 0% 0 0% 0% #DIV/0!Total (All type of Veh.) 7,890 100% - 9,473 100% - 1.20
Share of Heavy Veh. 39% - - 43% - - -Share of Heavy truck 24% - - 32% - - -PCU 12,567 - - 15,906 - - 1.27
Total(w/o 1.Motor Cycle) 6,474 - 100% 7,684 - 100% 1.19Share of Heavy Veh. 47% - - 53% - - -Share of Heavy truck 30% - - 39% - - -PCU 11,859 - - 15,012 - - 1.27
0
2,000
4,000
6,000
8,000
10,000
Weekday Holiday
5. Heavy Truck
4. Light Truck
3. Heavy Bus
2. Light Bus
1. Car
6474
7684
(Veh.)

5-9
Source: JICA Study Team
FIGURE 5.1-12 HOURLY VARIATION OF WEEKDAY AND HOLIDAY AT STA.2 NAGDHUNGA
2) Traffic Composition
Source: JICA Study Team
FIGURE 5.1-13 TRAFFIC COMPOSITION OF WEEK-DAY AND HOLIDAY AT STA.2 NAGDHUNGA
3) Share of Large Size Vehicle
TABLE 5.1-8 SHARE OF LARGE SIZE VEHICLE W/O MORTAR CYCLE OF 3 STATIONS (Veh.)
Classification Weekday % Holiday % Light Veh. 3,408 53% 3,618 47%
Heavy Veh. Bus 1,138 18% 1,075 14% Truck 1,928 30% 2,991 39%
Total 6,474 100% 7,684 100% Source: JICA Study Team
0
100
200
300
400
500
600
7 8 9 10 11 12 13 14 15 16 17 18 19 20 21 22 23 0 1 2 3 4 5 6
Weekday Holiday(Veh.)
26% 26%
19% 16%
18%14%
7%5%
30%39%
0%
20%
40%
60%
80%
100%
Weekday Holiday
5. Heavy Truck
4. Light Truck
3. Heavy Bus
2. Light Bus
1. Car

5-10
Source: JICA Study Team
FIGURE 5.1-14 SHARE OF LARGE SIZE VEHICLE WITH WEEK-DAY AND WEEKEND-DAY
(6) Estimation of Annual Average Daily Traffic
Table 5.1-9 shows the Annual Average Daily traffic of each station form traffic survey result using the seasonal coefficient of DoR. AADT without motor cycle on Nagdhunga was estimated to be 7704 veh./day in 2014.
TABLE 5.1-9 ESTIMATION RESULT OF AADT OF TOTAL VEHICLES Total vehicles (veh.) Total vehicles w/o MC (veh.) Seasonal
Coefficient Station Survey Result AADT Survey Result AADT 1. Naubise 7,462 8,880 5,778 6,876 1.19
2. Nagdhunga 7,890 9,389 6,474 7,704 1.19 3. Gurjudhara 15,454 16,845 9,393 10,238 1.09
* w/o MC: without motor cycle Source: JICA Study Team
The annual variation of traffic volume of Nagdhunga based on AADT is shown in Table 5.1-10. In seven years from 2007 to 2014, traffic volume on Nagdhunga showed an increase of 7.7% per annum, and in case of without motorcycle was 6.7% of annual average growth.
TABLE 5.1-10 ANNUAL VARIATION OF TRAFFIC VOLUME AT NAGDHUNGA year AADT (veh.) AADT w/o MC (veh.) 2007 5,582 4,891 2008 6,861 5,682 2009 6,479 5,379 2010 8,020 6,280 2011 9,773 8,668 2012 7,899 6,653 2013 9,022 7,062 2014 9,389 7,704
AGR(’07-‘14) 7.7% 6.7% *year: April-March Source: JICA Study Team based on traffic survey on July 17, 2014. And data of DoR
0%10%20%30%40%50%60%70%80%90%
100%
7 8 9 10 11 12 13 14 15 16 17 18 19 20 21 22 23 0 1 2 3 4 5 6
Weekday Holiday

5-11
5.1.3 Travel Speed and Travel Time
(1) Travel speed survey result of Eastbound (from Naubise to Kathmandu)
The average travel speed of heavy truck on eastbound is less than 20km/hr. Uphill section at morning time is just around 10km/hr. and total travel time for existing road of 8km is 30min.
Source: JICA Study Team
FIGURE 5.1-15 TRAVEL SPEED SURVEY RESULT OF EASTBOUND (FROM NAUBISE TO KATHMANDU)
10.0
23.0
13.9 12.2
22.0
15.7 16.3
21.5 18.5
21.6
26.2 23.7
28.6
32.1 30.2
26.0
32.2 28.8
0.0
5.0
10.0
15.0
20.0
25.0
30.0
35.0
40.0
Up Down Ave. Up Down Ave. Up Down Ave. Up Down Ave. Up Down Ave. Up Down Ave.
24.019.7
14.7 11.1 8.4 9.2
10.410.9
11.29.2
7.5 7.5
0.0
10.0
20.0
30.0
40.0
Truck_Morning Truck_Daytime Truck_Evening Car_Morning Car_Daytime Car_Evening
Down Section Up Section
Heavy Truck Passenger Car
Morning Daytime Evening Morning Daytime Evening
Down section Up section To Kathmandu
To Naubise
Driving direction
Travel time (min)
Travel speed (km/hr)
Heavy Truck Passenger Car

5-12
Car (Light vehicle) (Truck) Heavy vehicle
Morning time 7:30- Morning time 7:30-
Daytime 12:00- Daytime 12:00-
Daytime 14:00- Daytime 14:00-
Night time: 19:00- Night time: 19:00-
Source: JICA Study Team
FIGURE 5.1-16 TRAVEL SPEED: EASTBOUND (FROM NAUBISE TO KATHMANDU)
0km/h-10km/h-20km/h-30km/h-40km/h-50km/h50km/h-
0km/h-10km/h-20km/h-30km/h-40km/h-50km/h50km/h-

5-13
(2) Travel speed survey result from Kathmandu to Naubise
The average travel speed of heavy truck on eastbound is less than 25km/hr and travel time is 22 min. Even if downhill section, travel speed is approximately 20km/hr.
Source: JICA Study Team
FIGURE 5.1-17 TRAVEL SPEED SURVEY RESULT OF WEST BOUND (FROM KATHMANDU TO NAUBISE)
28.4
21.0
24.1 25.3
19.0 21.7
26.8 23.5 25.0
27.6 25.5
26.5
34.1 31.2
32.6 35.0
27.6 30.9
0.0
5.0
10.0
15.0
20.0
25.0
30.0
35.0
40.0
Up Down Ave. Up Down Ave. Up Down Ave. Up Down Ave. Up Down Ave. Up Down Ave.
9.3 10.4 9.9 9.6 7.8 7.5
12.613.9
11.2 10.48.5 9.6
0.0
5.0
10.0
15.0
20.0
25.0
30.0
Truck_Morning Truck_Daytime Truck_Evening Car_Morning Car_Daytime Car_Evening
Down Section Up Section
Heavy Truck Passenger Car
Morning Daytime Evening Morning Daytime Evening
Up section Down section To Kathmandu
To Naubise
Driving direction
Travel time (min)
Travel speed (km/hr)
Heavy Truck Passenger Car

5-14
Car (Light vehicle) (Truck) Heavy vehicle
Morning time 7:30- Morning time 7:30-
Daytime 12:00- Daytime 12:00-
Daytime 14:00- Daytime 14:00-
Night time: 19:00- Night time: 19:00-
Source: JICA Study Team
FIGURE 5.1-18 TRAVEL SPEED: WESTBOUND (FROM KATHMANDU TO NAUBISE)
0km/h-10km/h-20km/h-30km/h-40km/h-50km/h50km/h-
0km/h-10km/h-20km/h-30km/h-40km/h-50km/h50km/h-
0km/h-10km/h-20km/h-30km/h-40km/h-50km/h50km/h-
0km/h-10km/h-20km/h-30km/h-40km/h-50km/h50km/h-

5-15
5.1.4 Characteristics of Traffic Composition and OD Pattern
(1) Characteristics of Traffic composition
OD survey was conducted to understand the traffic flow on the road of Nagdhunga section. The current traffic flow is analyzed based on the OD survey results. OD zone for analysis is 18 zones that 15 zones of Nepal and 3 zone of India and China shown in Figure 5.1-19 OD survey results is taken the enlargement process using the traffic count survey.
OD pattern is examined the data after magnification correction to daily amount using the traffic count survey result.
Source: JICA Study Team
FIGURE 5.1-19 MAP OF OD ZONING SYSTEM
1
2
3
4
5
7
8 9
10
11
12
13
14
1516
17
18
6
4
5
78 9
10
11
13
6
12

5-16
TABLE 5.1-11 OD ZONING CODE
Source: JICA Study Team
Zone Code
Zone ID Zone name Region Level Dstrict / VDC level
Far-Western Region All district
Mid-Western Region All district
2 Western_North Western Region All district
Dist. Nawalparasi
Dist. Rupandehi
Dist. Kapilbastu
Dist. Palpa
Dist. Arghakriandhi
4 Birgunj ICD Central Region Birgunj ICD/ Indian Border / Industrial area
Dist. Makwanpur
Dist. Rautahat
Dist. Bara
Dist. Parsa
6 Central West_2Central Region / Narayani zone
(with Dhading)Dist. Chitawan
7 Dist. Dhading without VDC.Naubise Dist. Dhading without VDC.Naubise(zone 5)
8 Naubise Central Region / Bagmati zone VDC. Naubise (Dhading district)
VDC. Baad Bhanjyang
VDC. Thankot
VDC. Dahachok
VDC. Mahadevsthan
VDC. Matatirtha
Dist.Kathmandu (without VDC in Zone 6)
Dist.Bhaktapur
Dist.Lalitpur
Dist.Rasuwa
Dist.Nuwakot
Dist. Dhanusa
Dist. Mahottari
Dist. Sarlahi
Dist.Sindhupalchok
Dist.Kavrepalanchok
Dist. Sindhuli
Dist. Ramechhap
Dist. Dolakha
14 Eastern Region_1 Eastern Region Other district
Dist. Siraha
Dist. Saptari
Dist. Sunsari
Dist. Morang
Dist. Jhara
Dist. Ilam
Dist. Udaypur
16 India India via Birgunj
17 India India via other places, Bangladesh
18 China China
East of NagdhungaCentral Region / Bagmati zone 5
VDC in Kathmandu district
Kathmandu valley Central Region / Bagmati zone10
9
Central East_1 Central Region / Bagmati zone
Central East_2 Central Region / Janakpur zone12
11
Central East_3 Central Region / Bagmati zone
Eastern Region_2
(South)Eastern Region15
13
1
5
Western_South Western Region3
Far and Mid-Western
Central West_1 Central Region / Narayani zone

5-17
1) Purpose of trip
The share of purpose of trip by all type of vehicle is illustrated in Figure 5.1-20 and the detail data of Purpose of trip by passenger vehicle is shown in Table 5.1-12.
Source: JICA Study Team
FIGURE 5.1-20 PURPOSE OF TRIP BY PASSENGER VEHICLE
TABLE 5.1-12 DETAIL DATA OF PURPOSE OF TRIP BY PASSENGER VEHICLE
Source: JICA Study Team
2) Occupancy
The average occupancy is shown in Table 5.1-13.
TABLE 5.1-13 OCCUPANCY BY TYPE OF VEHICLE Car Micro bus Mini Bus Heavy bus Light truck Heavy truck
3.1 15.2 25.3 40.4 1.7 2.6 Source: JICA Study Team
3) Ratio of loading truck and empty truck
The 97% of Heavy truck of eastbound, which is into Kathmandu, is loaded. In contrast, the empty truck accounts 87 % in the direction out of the Kathmandu.
71%
1%
8%
12%
7%
0%
1.TO/FROM WORK
2.TO/FROM SCHOOL
3.BUSINESS
4.PRIVATE
5.LEASURE/TOURISM
6.OTHERS
1.WORK 2.SCHOOL 3.BUSINESS 4.PRIVATE 5.LEASURE 6.OTHERS Total
Car 487 5 254 892 347 10 1,996
Micro bus 813 8 6 15 76 0 917
Mini Bus 513 20 6 13 18 1 571
Heavy bus 1,200 25 11 0 115 3 1,354
Light truck 444 1 99 26 0 0 571
Heavy truck 2,007 11 267 0 0 9 2,294
Total 5,463 70 644 947 556 24 7,704
1.WORK 2.SCHOOL 3.BUSINESS 4.PRIVATE 5.LEASURE 6.OTHERS Total
Car 6% 0% 3% 12% 5% 0% 26%
Micro bus 11% 0% 0% 0% 1% 0% 12%
Mini Bus 7% 0% 0% 0% 0% 0% 7%
Heavy bus 16% 0% 0% 0% 1% 0% 18%
Light truck 6% 0% 1% 0% 0% 0% 7%
Heavy truck 26% 0% 3% 0% 0% 0% 30%
Total 71% 1% 8% 12% 7% 0% 100%

5-18
Source: JICA Study Team
FIGURE 5.1-21 LOADING RATIO OF HEAVY TRUCK BY DIRECTION
4) Average loading weight of heavy truck
TABLE 5.1-14 AVERAGE LOADING WEIGHT BY COMMODITY TYPE Commodity type Loading weight Construction material 14 ton Agricultural product 14 ton Fuel (Diesel, Petrol, Gas) 13 ton Other Consumables, Daily Commodities 9 ton Other than above 10 ton Food Product 11 ton Machinery, Equipment, Motorcycles etc. 9 ton Chemicals, Industrial Raw Materials 15 ton Average 13 ton
Source: JICA Study Team
5) Commodity type
Source: JICA Study Team
FIGURE 5.1-22 SHARE OF COMMODITY BY NUMBER OF VEHICLE AND BY LOADING WEIGH
97%
13%
3%
87%
0%
20%
40%
60%
80%
100%
Eastbound Westbound
Empty
loaded
0%
10%
20%
30%
40%
50%
60%
70%
80%
90%
100%
Number of Veh. Wight
Chemicals, Industrial Raw Materials
Machinary, Equipments, Motorcycles etc.
Food Product
Other than above
Other Consumables, Daily Commodities
Fuel (Diesel, Petrol, Gas)
Agricultural product
Construction material

5-19
(2) Desire Line at road of Nagdhunga section
From desire line obtained of total traffic, the largest traffic that passes Nagdhunga section is the traffic between Kathmandu and Western-North zone including Pokhara. And then, Western-south (zone 3), Central-west 2 (zone 6) is major traffic generation and attraction zone.
Total of all type vehicles (veh./day)
Total of all type vehicles (%)
Source: JICA Study Team
FIGURE 5.1-23 DESIRE LINE OF ALL TYPE VEHICLES
!(
!(
!(
!(
!(
!( !
(!(
!(
!(
!(
!(
!(
!(
!(
!(
!(
!(
98
76
54
3
2
1
18
17
16
15
1413
12
11
!(
!(
!(
!(
!(
!( !
(!(
!(
!(
!(
!(
!(
!(
!(
!(
!(
!(
98
76
54
3
2
1
18
17
16
15
1413
12
11
Legend
desirline_polyline_total
total
-10 veh./day
- 100 veh./day
- 500 veh./day
- 1000 veh./day
1000 veh./day -
Legend
desirline_polyline_total_56%
desirline_polyline$.56t_p
- 2.5%
- 5.0%
- 10%
- 15%
15% -
Pokhara
Birgunj India
Butwal
Pokhara
Birgunj India
Butwal
Chaina
Chaina
9 10
9 10

5-20
From the result of desire line of passenger car, the short-length or mid-length trip is major trip of passenger trip. In particular, the large OD pair is the trip between Kathmandu and Dhading district (zone 7), Western-north (zone 2) and Central west 2 (zone 6).
Passenger Car (Veh./day)
Passenger Car (%)
Source: JICA Study Team
FIGURE 5.1-24 DESIRE LINE OF PASSENGER CAR
!(
!(
!(
!(
!(
!( !
(!(
!(
!(
!(
!(
!(
!(
!(
!(
!(
!(
98
76
54
3
2
1
18
17
16
15
1413
12
11
!(
!(
!(
!(
!(
!( !
(!(
!(
!(
!(
!(
!(
!(
!(
!(
!(
!(
98
76
54
3
2
1
18
17
16
15
1413
12
11
Legend
desirline_polyline_total
total
-10 veh./day
- 100 veh./day
- 500 veh./day
- 1000 veh./day
1000 veh./day -
Legend
desirline_polyline_total_56%
desirline_polyline$.56t_p
- 2.5%
- 5.0%
- 10%
- 15%
15% -
Pokhara
Birgunj India
Butwal
Chaina
Pokhara
Birgunj India
Butwal
Chaina
9 10
9 10

5-21
Regarding the trip of bus that are used mainly for tourist trip, although the major OD pair is from /to Western-north (zone 2), long trip from Far and mid-western region (zone 1) and Eastern region (zone 15) is observed.
Total of Bus (Veh./day) *Total of Micro Bus, Mini Bus, Large Bus
Total of Bus (%) *Total of Micro Bus, Mini Bus, Large Bus
Source: JICA Study Team
FIGURE 5.1-25 DESIRE LINE OF BUS
!(
!(
!(
!(
!(
!( !
(!(
!(
!(
!(
!(
!(
!(
!(
!(
!(
!(
98
76
54
3
2
1
18
17
16
15
1413
12
11
!(
!(
!(
!(
!(
!( !
(!(
!(
!(
!(
!(
!(
!(
!(
!(
!(
!(
98
76
54
3
2
1
18
17
16
15
1413
12
11
Legend
desirline_polyline_total
total
-10 veh./day
- 100 veh./day
- 500 veh./day
- 1000 veh./day
1000 veh./day -
Legend
desirline_polyline_total_56%
desirline_polyline$.56t_p
- 2.5%
- 5.0%
- 10%
- 15%
15% -
Pokhara
Birgunj India
Butwal
Chaina
Pokhara
Birgunj India
Butwal
Chaina
9 10
9 10

5-22
As regards the freight traffic mainly of heavy truck, two type of trip characteristic was observed. Firstly, it is the traffic between south area near the Indian border such as Birgunji ICD (zone 4) and Western-south (zone 3) including Siddharthanagar ICD. Secondly, the short length trip between Dhading and Kathmandu is observed.
Total of Truck (Veh./day) *Total of Light Truck, Heavy truck
Total of Truck (%) * Total of Light Truck and Heavy truck
Source: JICA Study Team
FIGURE 5.1-26 DESIRE LINE OF TRUCK
!(
!(
!(
!(
!(
!( !
(!(
!(
!(
!(
!(
!(
!(
!(
!(
!(
!(
98
76
54
3
2
1
18
17
16
15
1413
12
11
!(
!(
!(
!(
!(
!( !
(!(
!(
!(
!(
!(
!(
!(
!(
!(
!(
!(
98
76
54
3
2
1
18
17
16
15
1413
12
11
Legend
desirline_polyline_total
total
-10 veh./day
- 100 veh./day
- 500 veh./day
- 1000 veh./day
1000 veh./day -
Legend
desirline_polyline_total_56%
desirline_polyline$.56t_p
- 2.5%
- 5.0%
- 10%
- 15%
15% -
Pokhara
Birgunj India
Butwal
Chaina
Pokhara
Birgunj India
Butwal
Chaina
9 10
9 10

5-23
(3) Traffic flow passing Nagdhunga road section
Based on the traffic survey result, the traffic flow passing Nagdhunga is shown in this section. Figure 5.1-27 illustrates the traffic flow of total of all vehicles passing Nagdhunga. Figure 5.1-28 illustrates the traffic flow of passenger car.
Source: JICA Study Team
FIGURE 5.1-27 TRAFFIC FLOW OF TOTAL OF ALL VEHICLES
Source: JICA Study Team
FIGURE 5.1-28 TRAFFIC FLOW OF PASSENGER CAR
Hetauda
To Butwal
Narayangadh
To Pokhara Mugling Naubise
Bardibas To Rajbiraj,Biratnagar ICD
Border Nepal-Chaina
Border Nepal-India
Tribhuvan HW.
Mahendra HW
SindhuliRd.
To India To India
To ChinaNagdhunga
1900(25%)
900(12%)
3900(51%)
7300
1900(25%)
1900(25%)
700(9%)
800(10)% 700(9%)
7700(100%)
Project section
5000 -3000 -1000 -500 -
Traffic Volume (veh./day)
1500(19%)
1100(14%)
Nijgadh
Dhulikhel
Birganj
Pathalaiya
Kathmandu
Nijgadh
Hetauda
To Butwal
Narayangadh
To Pokhara Mugling Naubise
Bardibas To Rajbiraj,Biratnagar ICD
Border Nepal-Chaina
Tribhuvan HW.
Mahendra HW
SindhuliRd.
To India
To China
600(30%)
200(10%)
800(40%)
1800
200(10%)
200(10%)
100(5%)
100(5%) 100(5%)
2000(100%)
Border Nepal-India
2000-1000 -500 -100 -
Traffic Volume (veh./day)
400(20%)
400(20%)
Dhulikhel
To India
Birganj
Pathalaiya
Nagdhunga
Project section
Kathmandu

5-24
Figure 5.1-29 illustrates the traffic flow of bus. 43% of total bus traffic come from / to western region including Pokhara. The other is traffic of south area of Nepal.
Regarding the freight flow, Figure 5.1-30 illustrates the traffic flow of truck. Around 60% of total truck is from / to south area of Nepal. Traffic of starting from Birganj ICD including the freight of India is largest traffic.
Source: JICA Study Team
FIGURE 5.1-29 FLOW OF BUS (TOTAL OF THREE TYPE OF BUS)
Source: JICA Study Team
FIGURE 5.1-30 TRAFFIC FLOW OF TRUCK (TOTAL OF LIGHT TRUCK AND HEAVY TRUCK)
Hetauda
To Butwal
Narayangadh
To Pokhara Mugling Naubise
Bardibas To Rajbiraj,Biratnagar ICD
Border Nepal-Chaina
Tribhuvan HW.
Mahendra HW
SindhuliRd.
To India
To China
1200(43%)
1300(46%)
2800
700(25%)
700(25%)
100(4%)
500(18%)
2800(100%)
Border Nepal-India
2000-1000 -500 -100 -
Traffic Volume (veh./day)
200(10%)
300(11%)
Nijgadh
300(11%) 500(18%)
Dhulikhel
To India
Birganj
Pathalaiya
Nagdhunga
Project section
Kathmandu
Birganj
Hetauda
To Butwal
Narayangadh
To Pokhara Mugling Naubise
Bardibas To Rajbiraj,Biratnagar ICD
Dhulikhel
Border Nepal-Chaina
Tribhuvan HW.
Mahendra HW
SindhuliRd.
To India To India
To China
Pathalaiya
100(3%)
400(14%)
1700(59%)
2700
1100(38%)
1100(38%)
600(21%)
200(7%) 200(7%)
2900(100%)
2000-1000 -500 -100 -
Traffic Volume (veh./day)
Border Nepal-India
900(31%)
200(7%)
Nijgadh
Nagdhunga
Project section
Kathmandu
Dhading

5-25
5.1.5 Commodity flow
The estimated commodity flow in 2013 based on customs data is shown in Figure 5.1-31 and Figure 5.1-32. The data is value basis. In the import, the around 60% of import commodities including air cargo are imported through Birgunj ICD. And 44% is passing Nagdhunga section to transport to mainly Kathmandu valley. On the other hand, the freight that is passing Nagdhunga section is only 10% of total export.
FIGURE 5.1-31 COMMODITY FLOW OF IMPORT IN 2013
Source: JICA Study Team Based On Customs Data
FIGURE 5.1-32 COMMODITY FLOW OF EXPORT IN 2013
40%4%
10%
3%
10%
11%
3%
3%
10%KathmanduDry Port (ICD)Major Customs
Biratnagar
Bhairahawa
Birgunj
Nepalgunj
Tatopani
Total: 557 billion NPRTrade partnerIndia(66%), China(11%), UAE(6%),Japan (10th:1%)Major import itemsGold/Silver, Petroleum products, Manufacturing, Electronic products
8%
2%
20%
2%
4%
34%
7%
2%
15%
Biratnagar
Bhairahawa
Birgunj
Nepalgunj
Tatopani
3%
Total: 77 billion NPR
KathmanduDry Port (ICD)Major Customs
Trade partnerIndia(67%), USA (8%), Germany(3%),Japan (10th:1%)Major import itemsManufacturing, Spice, Food products
Air
Air

5-26
5.1.6 Axle Load
(1) Purpose and Survey Method
The Axle load survey was carried out to collect the actual loading data of heavy vehicle and for the basic information of pavement design. The survey equipment is manual weight scale.
(2) Survey Result
1) Ratio of loading truck and empty truck
The 97% of Heavy truck of eastbound, which is into Kathmandu, is loaded. In contrast, the empty truck accounts 87 % in the direction out of the Kathmandu. In total of road section, the ratio of empty is 52%.
TABLE 5.1-15 LOADING END EMPTY RATIO OF TRUCK AT NAGDHUNGA Westbound Eastbound Total Loaded 13% 97% 48% Empty 87% 3% 52% Total 100% 100% 100% Source: JICA Study Team
(3) Gross Vehicle Load
The result of gross vehicle load is shown in Table 5.1-16. The gross bus weight is 15 ton at the both direction. The result of gross truck load has the clear difference between directions. The weight of 2 axle truck at the eastbound is 18 ton and that of westbound is 12 ton. The weight of 3 axles truck at the eastbound is 32 ton and that of westbound is 21 ton. In the section, the weight of 2 axle truck is 15 ton, and 3 axles is 30 ton. This difference is resulted from the empty truck ratio mentioned in previous section. Distribution chart of bus is illustrated in Figure 5.1-33. Distribution chart of truck is illustrated in Figure 5.1-34. Distribution charts of gross vehicle load by type of vehicle and direction are illustrated in Figure 5.1-35.
.
TABLE 5.1-16 AVERAGE GROSS VEHICLE LOAD
Direction Bus (t) Truck (t) 2 axle Truck 3 axle Truck Total of Truck
East Bound 15 18 32 28 West Bound 15 12 21 17
Total 15 15 30 25 Source: JICA Study Team

5-27
*Total of eastbound and westbound Source: JICA Study Team
FIGURE 5.1-33 DISTRIBUTION OF GROSS VEHICLE LOAD OF BUS
*Total of eastbound and westbound Source: JICA Study Team
FIGURE 5.1-34 DISTRIBUTION OF GROSS VEHICLE LOAD OF TRUCK
0
10
20
30
40
50
60
1 3 5 7 9 11 13 15 17 19 21 23 25 27 29 31 33 35 37 39 41 43 45 47 49
Wight of Vehicle (t/Veh.)
0
5
10
15
20
25
30
1 3 5 7 9 11 13 15 17 19 21 23 25 27 29 31 33 35 37 39 41 43 45 47 49
Wight of Vehicle (t/Veh.)

5-28
Tandem Axle Bus
Tandem Axle Bus
Tandem Axle Truck
Tandem Axle Truck
Tridem Axle Truck
Tridem Axle Truck
Total
Total
Westbound Eastbound Source: JICA Study Team
FIGURE 5.1-35 DISTRIBUTION OF GROSS VEHICLE LOAD BY DIRECTION
0
5
10
15
20
25
30
35
1 3 5 7 9 11 13 15 17 19 21 23 25 27 29 31 33 35 37 39 41 43 45 47 49
Wight of Vehicle (t/Veh.)
0
5
10
15
20
25
30
35
1 3 5 7 9 11 13 15 17 19 21 23 25 27 29 31 33 35 37 39 41 43 45 47 49
Wight of Vehicle (t/Veh.)
0
5
10
15
20
25
30
1 3 5 7 9 11 13 15 17 19 21 23 25 27 29 31 33 35 37 39 41 43 45 47 49
Wight of Vehicle (t/Veh.)
0
5
10
15
20
25
30
1 3 5 7 9 11 13 15 17 19 21 23 25 27 29 31 33 35 37 39 41 43 45 47 49
Wight of Vehicle (t/Veh.)
0
5
10
15
20
25
30
1 3 5 7 9 11 13 15 17 19 21 23 25 27 29 31 33 35 37 39 41 43 45 47 49
Wight of Vehicle (t/Veh.)
0
5
10
15
20
25
30
1 3 5 7 9 11 13 15 17 19 21 23 25 27 29 31 33 35 37 39 41 43 45 47 49
Wight of Vehicle (t/Veh.)
0
5
10
15
20
25
30
1 3 5 7 9 11 13 15 17 19 21 23 25 27 29 31 33 35 37 39 41 43 45 47 49
Wight of Vehicle (t/Veh.)
0
5
10
15
20
25
30
1 3 5 7 9 11 13 15 17 19 21 23 25 27 29 31 33 35 37 39 41 43 45 47 49
Wight of Vehicle (t/Veh.)

5-29
(4) Axle Load
1) Bus
Distribution charts of axle load of bus by direction are illustrated in Figure 5.1-36. The mode of first axle is 5t and the mode of second axle is 10t. Both directions are the same trend.
1st axle
1st axle
2nd axle
2nd axle
Westbound Eastbound Source: JICA Study Team
FIGURE 5.1-36 DISTRIBUTION OF AXLE LOAD OF BUS
05
101520253035404550
1 2 3 4 5 6 7 8 9 10 11 12 13 14 15
Wight of Vehicle (t/Axle)
05
101520253035404550
1 2 3 4 5 6 7 8 9 10 11 12 13 14 15
Wight of Vehicle (t/Axle)
05
101520253035404550
1 2 3 4 5 6 7 8 9 10 11 12 13 14 15
Wight of Vehicle (t/Axle)
05
101520253035404550
1 2 3 4 5 6 7 8 9 10 11 12 13 14 15
Wight of Vehicle (t/Axle)

5-30
2) Tandem Axle Truck
Distribution charts of axle load of tandem axle truck by direction are illustrated in Figure 5.1-37. On westbound, the load of first axle is distributed between 1 tons to 7 tons. The load of second axle is distributed between 2 tons to 14 tons. On eastbound, the load of first axle is distributed between 4 tons to 8 tons. the load of second axle is mainly distributed between 9 tons to 15 tons.
1st axle
1st axle
2nd axle
2nd axle
Westbound Eastbound Source: JICA Study Team
FIGURE 5.1-37 DISTIBUTION OF AXLE LOAD OF TANDEM AXLE TRUCK
0
5
10
15
20
25
30
1 2 3 4 5 6 7 8 9 10 11 12 13 14 15
Wight of Vehicle (t/Axle)
0
5
10
15
20
25
30
1 2 3 4 5 6 7 8 9 10 11 12 13 14 15
Wight of Vehicle (t/Axle)
0
5
10
15
20
25
30
1 2 3 4 5 6 7 8 9 10 11 12 13 14 15
Wight of Vehicle (t/Axle)
0
5
10
15
20
25
30
1 2 3 4 5 6 7 8 9 10 11 12 13 14 15
Wight of Vehicle (t/Axle)

5-31
3) Tridem Axle Truck
Distribution charts of axle load of tridem axle truck by direction are illustrated in Figure 5.1-38. On westbound, the load of first axle is distributed mainly between 3 tons to 7 tons. The load of second and third axle is distributed between 5 tons to 14 tons. On eastbound, the load of first axle is distributed between 4 tons to 8 tons. the load of second and third axle is mainly distributed between 11 tons to 14 tons. The difference between the direction-trend is due to the high rate of empty rate on the westbound direction.
1st axle
1st axle
2 nd axle
2nd axle
3rd axle
3rd axle
Westbound Eastbound Source: JICA Study Team
FIGURE 5.1-38 DISTRIBUTION OF AXLE LOAD OF TRIDEM AXLE TRUCK 5.1.7 Vehicle Emission Gas
(1) Purpose and survey method
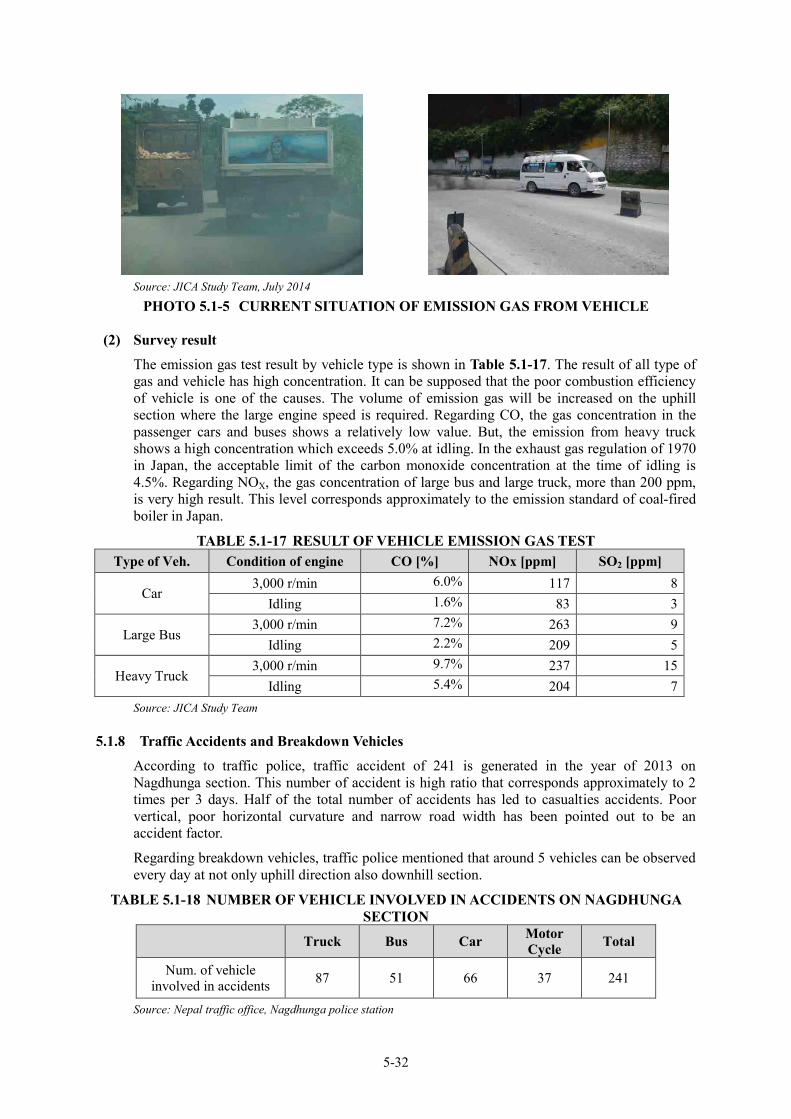
The vehicle emission test was carried out in order to obtain the emission volume by vehicle type. The intended gas for test is CO, NOx and SOx and each gas were measured by vehicle type under the condition of the idling and 3,000 r/min of engine revolutions. The emission test was conducted at Station 2 Nagdhunga for three days. The measuring instruments is the flue gas analyzer HT-2700 produced by Hodaka Co. Ltd.
0
10
20
30
40
50
60
70
80
1 2 3 4 5 6 7 8 9 10 11 12 13 14 15
Wight of Vehicle (t/Axle)
0
10
20
30
40
50
60
70
80
1 2 3 4 5 6 7 8 9 10 11 12 13 14 15
Wight of Vehicle (t/Axle)
0
5
10
15
20
25
30
1 2 3 4 5 6 7 8 9 10 11 12 13 14 15
Wight of Vehicle (t/Axle)
0
5
10
15
20
25
30
1 2 3 4 5 6 7 8 9 10 11 12 13 14 15
Wight of Vehicle (t/Axle)
0
5
10
15
20
25
30
35
40
45
1 2 3 4 5 6 7 8 9 10 11 12 13 14 15
Wight of Vehicle (t/Veh.)
0
5
10
15
20
25
30
35
40
45
1 2 3 4 5 6 7 8 9 10 11 12 13 14 15
Wight of Vehicle (t/Veh.)
5-32
Source: JICA Study Team, July 2014
PHOTO 5.1-5 CURRENT SITUATION OF EMISSION GAS FROM VEHICLE
(2) Survey result
The emission gas test result by vehicle type is shown in Table 5.1-17. The result of all type of gas and vehicle has high concentration. It can be supposed that the poor combustion efficiency of vehicle is one of the causes. The volume of emission gas will be increased on the uphill section where the large engine speed is required. Regarding CO, the gas concentration in the passenger cars and buses shows a relatively low value. But, the emission from heavy truck shows a high concentration which exceeds 5.0% at idling. In the exhaust gas regulation of 1970 in Japan, the acceptable limit of the carbon monoxide concentration at the time of idling is 4.5%. Regarding NOX, the gas concentration of large bus and large truck, more than 200 ppm, is very high result. This level corresponds approximately to the emission standard of coal-fired boiler in Japan.
TABLE 5.1-17 RESULT OF VEHICLE EMISSION GAS TEST Type of Veh. Condition of engine CO [%] NOx [ppm] SO2 [ppm]
Car 3,000 r/min 6.0% 117 8
Idling 1.6% 83 3
Large Bus 3,000 r/min 7.2% 263 9
Idling 2.2% 209 5
Heavy Truck 3,000 r/min 9.7% 237 15
Idling 5.4% 204 7 Source: JICA Study Team
5.1.8 Traffic Accidents and Breakdown Vehicles
According to traffic police, traffic accident of 241 is generated in the year of 2013 on Nagdhunga section. This number of accident is high ratio that corresponds approximately to 2 times per 3 days. Half of the total number of accidents has led to casualties accidents. Poor vertical, poor horizontal curvature and narrow road width has been pointed out to be an accident factor.
Regarding breakdown vehicles, traffic police mentioned that around 5 vehicles can be observed every day at not only uphill direction also downhill section.
TABLE 5.1-18 NUMBER OF VEHICLE INVOLVED IN ACCIDENTS ON NAGDHUNGA SECTION
Truck Bus Car Motor Cycle Total
Num. of vehicle involved in accidents 87 51 66 37 241
Source: Nepal traffic office, Nagdhunga police station

5-33
TABLE 5.1-19 NUMBER OF PEOPLE INVOLVED IN ACCIDENTS ON NAGDHUNGA SECTION
Death Major injured Minor injured Total Num. of people
involved in accidents 10 20 101 131
Source: Nepal traffic office, Nagdhunga police station
Source: The Himalayan times, 1 July, 2014
FIGURE 5.1-39 NEWSPAPER ARTICLE THAT TELLS THE ACCIDENT AT NAGDHUNGA
Source: JICA Study Team
PHOTO 5.1-6 ACCIDENT VEHICLE AT NAGDHUNGA 5.1.9 Summary of Traffic Characteristics
Based on the traffic survey result, the main traffic characteristic, a traffic volume, a travel speed and OD pattern is summarized below.
Traffic Volume
Annual average daily traffic of Nagdhunga section in 2014 was estimated 7,700 veh./day.
Traffic volume of Nagdhunga is increasing with each passing year from 2007. The annual growth rate is 6.7%.

5-34
Traffic composition
The high ratio of heavy vehicle ratio, which is 48%, of Nagdhunga section is a feature of the traffic of this road. (without motor cycle case).
The ratio of freight vehicle shows 37% of total volume. It can be explained that this road plays role as major logistics network road.
Travel speed:
It also became clear that vehicles are forced to a low-speed running on this section. Especially, the travel speed of loading truck to Kathmandu direction, around 10 km/hr. is very low. This is equivalent to a 35 minutes driving for 8 kilometers distance on existing road.
OD pattern:
Main traffic that pass Nagdhunga section is trip between Kathmandu, the capital of Nepal, and Western region or south area of Central region.
Main trip of Passenger car and bus is Pokhara direction. On the other hand, the main trips of freight, especially heavy truck, is direction of Birgunji where is gateway of logistics to / from India.
5.2 FUTURE TRAFFIC DEMAND FORECAST
5.2.1 Approach
In this section, the future traffic demand is estimated based on socio-economic framework in Nepal and traffic survey conducted by study team. Firstly, the socio-economic framework related to traffic demand is reviewed.
And next, traffic growth of year 2020 and 2030 is estimated using the socio-economic framework. At last, traffic volume of Nagdhunga tunnel section is predicted considering traffic assignment between Nagdhunga tunnel section and competitive road such as existing road or new construction road.
5.2.2 Socio-economic Framework
Predicting the future traffic demand, the socio-economic framework of related indicator is set based on the trend of past statistical data and on the plan by each authorities of Nepal government. Related indicators set are population, number of tourist, GDP, GDP of tertiary sector shown in Tables below.
TABLE 5.2-1 FRAMEWORK OF POPULATION
year Central Region (million)
Growth rate
Western Region (million)
Growth rate
2001 8.0 - 4.6 -
2011 9.7 1.9% 4.9 0.8%
2020 11.4 1.8% 5.2 0.5%
2030 13.5 1.5% 5.5 0.5%
2035 14.6 1.5% 5.6 0.5%
Source: CBS, Study team estimation

5-35
TABLE 5.2-2 FRAMEWORK OF NUMBER OF TOURIST
year Number of Tourist ( thousand)
Growth rate
2001 343 -
2011 718 7.7%
2020 1,406 7.7%
2030 2,777 7.0%
2035 3,664 5.7%
Source: Ministry of culture, tourism and civil aviation and study team estimation
TABLE 5.2-3 FRAMEWORK OF GDP
year GDP (billion) Growth rate
2001 430 -
2011 636 4.0%
2020 920 4.2%
2025 1,066 3.0%
2030 1,177 2.0%
2035 1,237 1.0%
*At basic price (constant) Source: Economic survey (Ministry of finance), Study team estimation based on Nepal government
TABLE 5.2-4 FRAMEWORK OF GDP OF TERTIORY SECTOR
year GDP of Tertiary Sector (billion)
Growth rate
2001 194 -
2011 322 5.2%
2020 516 5.4%
2025 643 4.5%
2030 764 3.5%
2035 907 3.5%
*At basic price (constant) Source: Economic survey (Ministry of finance), Study team estimation based on Nepal government
5.2.3 Estimation of Traffic Growth
It is known that economic activity and change such as population increasing generates traffic growth. In this section, the future traffic of Nagdhunga in case of business as usual is predicted based on regression analysis between traffic data and related indicators estimated in framework study on previous section. This estimation is conducted by vehicle type.
(1) Passenger vehicle
Intended vehicle is Car, Microbus, and Mini bus is Car, Micro bus, and Mini bus.
This type car is used for relatively short and middle distance trip. As an indicator related to the traffic increase, the total population of Central region and Western region is selected. The forecasting model estimated is below.
Number of passenger vehicle = 603.52*Population (million) – 5932 R2=0.87

5-36
TABLE 5.2-5 ESTIMATION RESULT OF PASSENGER VEHICLE year Passenger vehicle Growth rate 2011 2,900 - 2014 3,200 3.3% 2020 4,100 3.6% 2030 5,500 3.2% 2035 6,200 2.5%
Source: JICA Study Team
(2) Large size tourist bus
Intended vehicle is heavy bus calcified in traffic count survey. As an indicator related to the traffic increase of tourist bus, the number of tourist and GDP of tertiory sector is selected. The forecasting model estimated is below.
Traffic of passenger car = 1.66*Number of tourist (thousand) R2=0.88
TABLE 5.2-6 ESTIMATION RESULT OF HEAVY BUS year Heavy Bus Growth rate 2011 1,200 - 2014 1,400 5.3% 2020 1,900 5.2% 2030 2,800 4.0%
2035 3,300 3.0% Source: JICA Study Team
(3) Freight vehicle
Intended vehicle is trucks including light truck and heavy truck. As an indicator related to the traffic increase of freight vehicle, GDP of Nepal is selected. The forecasting model estimated is below.
Number of Freight Vehicle = 4.93*GDP (billion) – 768 R2=0.90
TABLE 5.2-7 ESTIMATION RESULT OF FREIGHT VEHICLE year Freight Vehicle Growth rate 2011 2,400 - 2014 2,800 5.3% 2020 3,700 4.8% 2030 5,000 3.1% 2035 5,600 2.3%
Source: JICA Study Team 5.2.4 Future Traffic Demand
(1) Traffic Growth Rate
Referring to the traffic modeling result based on socio-economic framework, Annual Traffic growth rate was set for short-term (2014-2020), mid-term (2020-2030), Long-term (2030-2035) in shown Table 5.2-8. Then, average annual growth rate that of short-term is 4.1%, that of mid-term is 3.2%, long-term is 2.4%. Future traffic demand is estimated by multiplying the traffic growth rate in traffic volume of 2014 observed in traffic count survey.

5-37
TABLE 5.2-8 TRAFFIC GROWTH RATE OF NAGDHUNGA SECTION
AGR(2014-2020) AGR(2020-2030) AGR(2030-) Passenger Car 3.5% 3.0% 2.5%
Micro Bus 3.5% 3.0% 2.5% Mini Bus 3.5% 3.0% 2.5%
Heavy Bus 5.0% 4.0% 3.0% Light Truck 4.5% 3.0% 2.0% Heavy truck 4.5% 3.0% 2.0%
Average 4.1% 3.2% 2.4% Source: JICA Study Team
(2) Effects of Toll Collection and tunnel utilization ratio
To identify the impact of toll collection to tunnel user, the opinion survey is conducted on Nagdhunga of existing road. This opinion survey consists of the questionnaire about a willing to pay of tunnel utilization in case of 30NPR for passenger vehicle. Samples of 300 per each direction are collected. The result is shown in Table 5.2-9.
According to the result of opinion survey, the user of passenger car more than 90% answered to accept this level of toll charge. Road user of east bound is more positive rather than westbound. This result is supposed that almost user has the will to choice the tunnel route to avoid the uphill section and long distance driving if 30NPR charged.
TABLE 5.2-9 OPINION SURVEY ABOUT TUNNEL UTILIZATION TO PASSENGER CAR USER
Response Naubise to Kathmandu Kathmandu to Naubise Eastbound Westbound
Yes 293 98% 277 92% No 7 2% 23 8%
Total 300 100% 300 100% Source: JICA Study Team based on Opinion Survey
According to the interview to truck owner that is charge of transship between Kathmandu and Birganj that is town of border with India, they also mentioned to use positively the new tunnel route if 40 NPR of toll fee. Based on the result of opinion survey, tunnel utilization ration is set shown in Table 5.2-10. Ration is estimated less than survey result. And also, the ration of westbound is lower than that of eastbound. Some drivers will choice the existing road to save the toll fee.
TABLE 5.2-10 TUNNEL UTILIZATION RATIO FOR TOTAL TRAFFIC OF NAGDHUNGA SECTION
AGR(2014-2020) AGR(2020-2030) AGR(2030-)
Eastbound Westbound Eastbound Westbound Eastbound Westbound
Passenger Car 80% 70% 80% 70% 80% 70% Micro Bus 80% 70% 80% 70% 80% 70%
Mini Bus 0% 0% 0% 0% 0% 0%
Heavy Bus 90% 80% 90% 80% 90% 80%
Light Truck 80% 70% 80% 70% 80% 70%
Heavy truck 90% 80% 90% 80% 90% 80%
Average 74% 74% 74% Source: JICA Study Team

5-38
(3) Future demand forecast in BAU case
In this section, the business as usual case which is not considered developments of competitive road such as fast truck, Sindhuli road. Table 5.2-11 shows the result of future demand forecast in business as usual case. The traffic volume is calculated as the result of multiplication with traffic count survey and growth rate and tunnel utilization ratio. If there are no developments of competitive roads, it is clear that all traffic have to transit at Nagdhunga section.
The result of estimation indicated that traffic demand in 2020 is 7,301 veh./day, 8,552 veh./day in 2025, 10,021 veh/day in 2030.
Source: JICA Study Team
FIGURE 5.2-1 FUTURE TRAFFIC DEMAND ON TUNNEL SECTION IN BAU CASE (VEH/DAY)
0
2000
4000
6000
8000
10000
12000
2014 2020 2025 2030 2030
(veh./day)

5-39
TABLE 5.2-11 FUTURE TRAFFIC DEMAND (BUSINESS AS USUAL CASE)
*AGR: Annual average growth rate ** Eastbound (From Naubise to Kathmandu), Westbound (From Kathmandu to Naubise) Source: JICA Study Team
Future Traffic Volume (Business as Usual Case) ①=②+③
Eastbound Westbound Total Eastbound Westbound Total Eastbound Westbound Total Eastbound Westbound Total Eastbound Westbound Total East West East West East West
Passenger Car 959 1,036 1,996 1,263 1,365 2,628 1,367 1,477 2,844 1,585 1,712 3,297 1,793 1,937 3,730 3.5% 3.5% 3.0% 3.0% 2.5% 2.5%Micro Bus 389 528 917 512 696 1,208 555 753 1,307 643 873 1,516 727 988 1,715 3.5% 3.5% 3.0% 3.0% 2.5% 2.5%Mini Bus 227 344 571 299 453 752 324 490 814 375 568 944 425 643 1,068 3.5% 3.5% 3.0% 3.0% 2.5% 2.5%Heavy Bus 639 715 1,354 944 1,057 2,001 1,042 1,166 2,208 1,268 1,419 2,686 1,470 1,645 3,114 5.0% 5.0% 4.0% 4.0% 3.0% 3.0%Light Truck 444 127 571 631 181 812 670 192 862 777 223 1,000 858 246 1,104 4.5% 4.5% 3.0% 3.0% 2.0% 2.0%Heavy truck 939 1,355 2,294 1,335 1,928 3,263 1,417 2,046 3,464 1,643 2,372 4,015 1,814 2,619 4,433 4.5% 4.5% 3.0% 3.0% 2.0% 2.0%Total 3,597 4,107 7,704 4,985 5,679 10,664 5,375 6,125 11,499 6,291 7,167 13,458 7,086 8,077 15,164
Number of Vehicles on Tunnel Section ②
Eastbound Westbound Total Eastbound Westbound Total Eastbound Westbound Total Eastbound Westbound Total Eastbound Westbound Total East West East West East West
Passenger Car - - - 1,010 955 1,966 1,093 1,034 2,127 1,268 1,199 2,466 1,434 1,356 2,790 80% 70% 80% 70% 80% 70%Micro Bus - - - 410 487 897 444 527 971 514 611 1,125 582 691 1,273 80% 70% 80% 70% 80% 70%Mini Bus - - - 0 0 0 0 0 0 0 0 0 0 0 0 0% 0% 0% 0% 0% 0%Heavy Bus - - - 850 845 1,695 938 933 1,871 1,141 1,135 2,276 1,323 1,316 2,638 90% 80% 90% 80% 90% 80%Light Truck - - - 505 127 632 536 135 671 621 156 777 686 172 858 80% 70% 80% 70% 80% 70%Heavy truck - - - 1,202 1,542 2,744 1,276 1,637 2,913 1,479 1,898 3,377 1,633 2,095 3,728 90% 80% 90% 80% 90% 80%Total - - - 3,977 3,957 7,933 4,287 4,265 8,552 5,023 4,998 10,021 5,658 5,631 11,288
Number of Vehicle on Existing road ③
Eastbound Westbound Total Eastbound Westbound Total Eastbound Westbound Total Eastbound Westbound Total Eastbound Westbound Total East West East West East West
Passenger Car - - - 253 409 662 273 443 716 317 514 831 359 581 940 80% 70% 80% 70% 80% 70%Micro Bus - - - 102 209 311 111 226 337 129 262 390 145 296 442 80% 70% 80% 70% 80% 70%Mini Bus - - - 299 453 752 324 490 814 375 568 944 425 643 1,068 0% 0% 0% 0% 0% 0%Heavy Bus - - - 94 211 306 104 233 337 127 284 411 147 329 476 90% 80% 90% 80% 90% 80%Light Truck - - - 126 54 181 134 58 192 155 67 222 172 74 245 80% 70% 80% 70% 80% 70%Heavy truck - - - 134 386 519 142 409 551 164 474 639 181 524 705 90% 80% 90% 80% 90% 80%Total - - - 1,009 1,722 2,731 1,088 1,859 2,947 1,267 2,169 3,436 1,429 2,447 3,876
Existing road ratio
(2014-2020)
Existing road ratio
(2020-2030)
Existing road ratio
(2035-)
25.6% 25.5% 25.6%
Tunnel utilization ratio
(2020-2030)
Tunnel utilization ratio
(2035-)
74.4% 74.5% 74.4%
2014 2022 2025 2030 2035
2014 2022 2025 2030 2035Tunnel utilization ratio
(2014-2020)
AAGR*
(2020-2030)
AAGR*
(2030-)
4.1% 3.0% 2.4%
2014 2022 2025 2030 2035AAGR*
(2014-2020)

5-40
(4) Traffic Assignment
1) Road Network for Traffic Assignment
In this section, traffic assignment considering the competitive road is examined. Opening year of Nagdhunga tunnel is 2022. Traffic assignment is considered using future OD pattern based on current OD pattern passing Nagdhunga section.
The road considered for traffic assignment and the basic idea about traffic assignment, traffic diversion from Nagdhunga section to competitive road, is shown in Table 5.2-12. It have an assumption that other vehicle will use the tunnel section or existing road at Nagdhunga section.
TABLE 5.2-12 RELATED COMPETITIVE ROAD AND CONDITION OF ASSIGNMENT Road Development plan and impact to Nagdhunga section 1) Fast track road by NPBCL
-Kathmandu Hetauda Tunnel Highway
This project is being developed by Nepal Purwadhar Bikash Company Ltd., (NPBCL) by BOOT schema. MoU between MoPIT and NPBCL is exchanged. Components: 3 tunnels 15 bridges. Road length: 59km. <Condition of assignement> - Opening year: 2031 - All traffic of zone 4, 12, 16 is shift to this road. - 20% of Traffic of zone 6 is shift to this road
2) Katumandu-Terai Fast track road by MoPIT
This road is a road that some parallel to the 1) Fast track road by NPBCL. In consideration of traffic assignment, is not taken into consideration as the road one) is preceded maintenance. This road is a road that some parallel to the 1) Fast track road by NPBCL. Road length: 76km.
3) Sindhuli road This road connects between Kathmandu and Eastern-south area. In traffic assignment, it is considered that traffic of zone 13 (Eastern reagion_2) will be shift. Opening year: 2025
4) Improvement of Naubise- Hetauda road -Naubise-Mugling road -Mugling-Narayanghat
road -Narayanghat- Hetauda
road
This project is developed by World Bank finance. This road contributes to increase traffic of Nagdhunga section.
Source: Interview to DOR and existing report

5-41
Source: JICA Study Team
FIGURE 5.2-2 LOCATION OF RELATED ROAD NETWORK
2) Traffic Assignment Result
The result of traffic assignment is shown in Table 5.2-13. And traffic flow from 2022 to 2035 is illustrated in Figure 5.2-3 – Figure 5.2-6. From result, the future traffic demand of Nagdhunaga tunnel section is estimated 7,900 veh./day in 2022, 8,100 veh./day in 2025, 9,500 veh./day in 2030, 8,300 veh./day in 2035.
Birganj
Nijgadh
Hetauda
To Butwal
Narayangadh
To Pokhara Mugling Naubise
Bardibas To Rajbiraj,Biratnagar ICD
Dhulikhel
Border Nepal-Chaina
Border Nepal-India
Tribhuvan HW.
Mahendra HW
SindhuliRd.
To India To India
To China
Pathalaiya
Kathmandu
Nagdhunga
1) Fast track road by NPBCL
2) Fast track road by MoPIT
4) Improvement of Naubise- Hetauda road
3) Sindhuli road

5-42
TABLE 5.2-13 FUTURE TRAFFIC DEMAND (WITH COMPETITIVE ROAD CASE)
Source: JICA Study Team
Future traffic volume (with Sindhuli Rd, Fast Track Rd.) ①=②+③
Eastbound Westbound Total Eastbound Westbound Total Eastbound Westbound Total Eastbound Westbound Total Eastbound Westbound Total Eastbound Westbound Total East West East West East West
Passenger Car 959 1,036 1,996 1,263 1,365 2,628 1,326 1,433 2,759 1,537 1,661 3,199 1,405 1,518 2,922 1,550 1,675 3,226 3.5% 3.5% 3.0% 3.0% 2.5% 2.5%
Micro Bus 389 528 917 512 696 1,208 550 747 1,297 638 866 1,504 603 819 1,423 666 904 1,571 3.5% 3.5% 3.0% 3.0% 2.5% 2.5%
Mini Bus 227 344 571 299 453 752 306 462 768 354 536 890 302 458 760 334 505 839 3.5% 3.5% 3.0% 3.0% 2.5% 2.5%
Heavy Bus 639 715 1,354 944 1,057 2,001 972 1,087 2,059 1,182 1,323 2,505 1,026 1,148 2,174 1,154 1,292 2,447 5.0% 5.0% 4.0% 4.0% 3.0% 3.0%
Light Truck 444 127 571 631 181 812 616 177 793 715 205 920 585 168 752 633 182 814 4.5% 4.5% 3.0% 3.0% 2.0% 2.0%Heavy truck 939 1,355 2,294 1,335 1,928 3,263 1,306 1,886 3,193 1,515 2,186 3,701 912 1,316 2,228 987 1,425 2,411 4.5% 4.5% 3.0% 3.0% 2.0% 2.0%
Total 3,597 4,107 7,704 4,985 5,679 10,664 5,076 5,793 10,869 5,941 6,778 12,719 4,833 5,427 10,259 5,325 5,983 11,308
Number of Vehicles on Tunnel Section ②
Eastbound Westbound Total Eastbound Westbound Total Eastbound Westbound Total Eastbound Westbound Total Eastbound Westbound Total Eastbound Westbound Total East West East West East West
Passenger Car - - - 1,010 955 1,966 1,061 1,003 2,064 1,230 1,163 2,393 1,124 1,063 2,186 1,240 1,173 2,413 80% 70% 80% 70% 80% 70%
Micro Bus - - - 410 487 897 440 523 963 510 606 1,117 483 574 1,056 533 633 1,166 80% 70% 80% 70% 80% 70%
Mini Bus - - - 0 0 0 0 0 0 0 0 0 0 0 0 0 0 0 0% 0% 0% 0% 0% 0%
Heavy Bus - - - 850 845 1,695 874 870 1,744 1,064 1,058 2,122 923 918 1,842 1,039 1,034 2,073 90% 80% 90% 80% 90% 80%
Light Truck - - - 505 127 632 493 124 617 572 143 715 468 117 585 506 127 633 80% 70% 80% 70% 80% 70%Heavy truck - - - 1,202 1,542 2,744 1,176 1,509 2,685 1,363 1,749 3,112 820 1,053 1,873 888 1,140 2,028 90% 80% 90% 80% 90% 80%
Total - - - 3,977 3,957 7,933 4,044 4,029 8,073 4,739 4,720 9,459 3,818 3,725 7,542 4,207 4,106 8,313
Number of Vehicle on Existing road ③
Eastbound Westbound Total Eastbound Westbound Total Eastbound Westbound Total Eastbound Westbound Total Eastbound Westbound Total Eastbound Westbound Total East West East West East West
Passenger Car - - - 253 409 662 265 430 695 307 498 806 281 455 736 310 503 813 20% 30% 20% 30% 20% 30%
Micro Bus - - - 102 209 311 110 224 334 128 260 387 121 246 367 133 271 405 20% 30% 20% 30% 20% 30%
Mini Bus - - - 299 453 752 306 462 768 354 536 890 302 458 760 334 505 839 100% 100% 100% 100% 100% 100%
Heavy Bus - - - 94 211 306 97 217 315 118 265 383 103 230 332 115 258 374 10% 20% 10% 20% 10% 20%
Light Truck - - - 126 54 181 123 53 176 143 61 204 117 50 167 127 54 181 20% 30% 20% 30% 20% 30%Heavy truck - - - 134 386 519 131 377 508 151 437 589 91 263 354 99 285 384 10% 20% 10% 20% 10% 20%
Total - - - 1,009 1,722 2,731 1,032 1,764 2,796 1,202 2,058 3,260 1,015 1,702 2,717 1,118 1,877 2,995
Existing road ratio
(2014-2020)
Existing road ratio
(2020-2030)
Existing road ratio
(2035-)
26% 26% 26%
2014 2020 2025 2030 2031 2035
Tunnel utilization ratio
(2014-2020)
Tunnel utilization ratio
(2020-2030)
Tunnel utilization ratio
(2035-)
74% 74% 74%
2014 2020 2025 2030 2031 2035
AGR (2014-2020) AGR (2020-2030) AGR (2030-)
4.1% 2.2% -2.3%
2014 2022 2025 2030 2031 2035

5-43
Source: JICA Study Team
FIGURE 5.2-3 TRAFFIC FLOW PASSING NAGDHUNGA IN 2022
Source: JICA Study Team
FIGURE 5.2-4 TRAFFIC FLOW PASSING NAGDHUNGA SECTION IN 2025
Birganj
Hetauda
To Butwal
Narayangadh
To Pokhara Mugling Naubise
Bardibas To Rajbiraj,Biratnagar ICD
Dhulikhel
Border Nepal-Chaina
Tribhuvan HW.
Mahendra HW
SindhuliRd.
To India To India
To China
Pathalaiya
Kathmandu
Nagdhunga
2900(26%)
1300(12%)
5300(490%)
10200
2600(24%)
2600(24%)
1500(14%)
1100(10%) 1000(9%)
7900(74%)
Border Nepal-India
2000(20%)
1400(13%)
Nijgadh
10000-5000 -3500 -2000 -
Traffic Volume (veh./day)
-2000
Project section
2700(26%)
Traffic flow in 2022
Birganj
Hetauda
To Butwal
Narayangadh
To Pokhara Mugling Naubise
Bardibas To Rajbiraj,Biratnagar ICD
Dhulikhel
Border Nepal-Chaina
Tribhuvan HW.
Mahendra HW
SindhuliRd.
To India To India
To China
Pathalaiya
Nagdhunga
2900(25%)
1400(12%)
5100(44%)
10300
2200(20%)
2200(20%)
1700(16%)
500(4%) 400(3%)
Border Nepal-India
2300(21%)
1500(13%)
Nijgadh 1000(9%)
600(5%)
600(5%)
8100(74%)
Project section
2800(26%)
10000-5000 -3500 -2000 -
Traffic Volume (veh./day)
-2000
Traffic flow in 2025
Kathmandu

5-44
Source: JICA Study Team
FIGURE 5.2-5 TRAFFIC FLOW PASSING NAGDHUNGA SECTION IN 2030
Source: JICA Study Team
FIGURE 5.2-6 TRAFFIC FLOW PASSING NAGDHUNGA SECTION IN 2035
Birganj
Hetauda
To Butwal
Narayangadh
To Pokhara Mugling Naubise
Bardibas To Rajbiraj,Biratnagar ICD
Dhulikhel
Border Nepal-Chaina
Tribhuvan HW.
Mahendra HW
SindhuliRd.
To India To India
To China
Pathalaiya
Nagdhunga
3500(26%)
1700(13%)
6000(45%)
12100
2600(19%)
2600(19%)
2000(9%)
600(4%) 400(3%)
Border Nepal-India
2600(21%)
1700(13%)
Nijgadh 1100(8%)
700(5%)
700(5%)
9500(75%)
Project section
3200(25%)
10000-5000 -3500 -2000 -
Traffic Volume (veh./day)
-2000
Traffic flow in 2030
Kathmandu
Birganj
Hetauda
To Butwal
Narayangadh
To Pokhara Mugling Naubise
Bardibas To Rajbiraj,Biratnagar ICD
Dhulikhel
Border Nepal-Chaina
Tribhuvan HW.
Mahendra HW
SindhuliRd.
To India To India
To China
Pathalaiya
Nagdhunga
3800(25%)
1900(13%)
3700(25%)
10600
200(1%)
2900(19%)
2200(14%)
700(5%) 500(3%)
Border Nepal-India
3100(20%)
2000(18%)
Nijgadh 1300(8%)
800(5%)
800(5%)
3000(20%)
8300(74%)
Project section
3000(26%)
10000-5000 -3500 -2000 -
Traffic Volume (veh./day)
-2000
Traffic flow in 2035
Kathmandu

CHAPTER 6
PRESENT CONDITION OF EXISTING ROAD


6-1
CHAPTER 6 PRESENT CONDITION OF EXISTING ROAD
6.1 FUNCTION AND ROLE OF EXISTING ROAD
As shown in Figure 6.1-1,the survey road is a part of Tribhuvan Highway, a National Highway which combines with Prithvi Highway at Naubise and is one of the only two roads connecting Kathmandu Capital with Pokhara and the Terai region. Pokhara is a tourist city located about 200km west of Kathmandu and Terai is the gateway to India where it presently shares the trade border at three locations with India. Sindhuli road, which is presently under construction under the Japanese assistance is another road that allows access from Kathmandu to India. However, the number of vehicles plying this road is only 659 vehicles per day and this is credited to the narrow width and the long and winding alignment. On the other hand, the current traffic on the survey road is about 7600 vehicles per day and is expected to increase in an approximate rate of 4%. As such, the survey road is expected to function as the life line or the vertebra of the economic activities inside the Kathmandu Valley until an alternative has been provided.
Major traffic along project road is heavy trucks transporting commodities from India, through Terai regions to Kathmandu and long trip buses from various parts of the country. As shown in Figure 6.1-1, the current routes are long detour route from Kathmandu via Kalanki, Naubise, Dharke, Mugling, Hetauda, Birganj. Naubise and Hetauda Section of Tribhuvan Highway are not used due to geographical constraint, bad road alignment and pavement condition. The project road has also the function of connecting between Kathmandu and Pokhara, which is the second largest city and long trip buses and trucks will use the project road.
FIGURE 6.1-1 SCHEMATIC ROAD NETWORK AND PRESENT TRAFFIC VOLUME
6.2 ISSUES OF THE EXISTING ROAD
6.2.1 Poor Geometric Conditions
The existing road alignment has many small horizontal curves which climbs up and down the mountains with a steep gradient of 7~10%. Loaded trucks can only travel with a very low speed of 10 ~ 15 km/hr for climbing up direction.

6-2
TABLE 6.2-1 EXISTING ROAD ALIGNMENT Horizontal Alignment
No. of Small Curve (R< 30m) 19 Curves
Vertical Alignment
The gradient length over 7%
10 % ℓ = 500m 8 % ℓ = 600m 7 % ℓ = 500m
Total ℓ = 1,600m
FIGURE 6.2-1 EXISTING ROAD ALIGNMENT
6.2.2 Transport Inefficiency
(1) Travel Speed and Time
Based on the traffic survey result, traffic problems are identified (see section 5.1.4 Travel Time) Travel Survey for Nagdhunga Section (L = 8.8km) was conducted for two vehicle type (passenger car and truck). Figure 6.2-2 shows the travel speed survey result for Truck. Travel speed of eastbound (from Naubise to Kathmandu) is lower than that of westbound (from Kathmandu to Naubise). Travel speed of eastbound at morning peak is only 16.9 km/h due to long steep up gradient (8%, L= 600 and 10% L=500m).
As shown Figure 6.2-4, travel time difference in the morning time between westbound and eastbound is ten (10) minutes. This means loss of time and money.
Note: 2014, July Survey
FIGURE 6.2-2 AVERAGE TRAVEL SPEED AT NAGDHUNGA SECTION BY TRUCK

6-3
Note: 2014, July Survey
FIGURE 6.2-3 AVERAGE TRAVEL SPEED AT NAGDHUNGA SECTION BY PASSENGER CAR
Note: 2014, July Survey
FIGURE 6.2-4 AVERAGE TRAVEL TIME AT NAGDHUNGA SECTION BY TRUCK
Note: 2014, July Survey
FIGURE 6.2-5 AVERAGE TRAVEL TIME AT NAGDHUNGA SECTION BY PASSENGER CAR

6-4
(2) Transport Cost of the Existing Road
Based on the traffic survey result, transport cost of existing road was estimated. Transport cost consists of vehicle operating cost and travel time cost.
1) Vehicle Operating Cost
Daily total vehicle × km at Nagdhunga section is estimated as 66,000 vehicle km/day below. 7,500 vehicle/day ×8.8 km 66,000 vehicle/km. Based on unit vehicle operating cost, estimated VOC is 4.0 Million NRP / day.
TABLE 6.2-2 ESTIMATED TOTAL VEHICLE OPERATES COST (YEAR 2014)
Vehicle*km Unit VOC (NRP.km.veh) VOC
Pass. car 17,600 22.2 390,720 S.Bus 7,920 29.5 233,640 M.Bus 4,400 51.5 226,600 L.Bus 11,440 82.5 943,800 L.Truck 4,400 32.5 143,000 H.Truck 20,240 102.4 2,072,576 Total 66,000 4,010,336 NRP/day
2) Travel Time Cost
Daily Total Travel Time is 2,517 vehicle/hour. (see Table 6.2-5). Based on Unit Travel Time Cost, estimated TTC is 1.0 Million NRP/day.
TABLE 6.2-3 ESTIMATED TOTAL TRAVEL TIME COST (YEAR 2014) Vehicle*hour TTC(NRP/hour/veh) TTC Pass. car 599 235 140,863 S.Bus 268 196 52,549 M.Bus 148 549 81,401 L.Bus 388 882 342,118 L.Truck 223 375 83,675 H.Truck 891 375 334,263 Total 2,517 1,034,868 NRP/day
3) Transport Cost
Total Transport Cost of Nagdhunga Section is 5.0 (4.0+ 1.0) Million NRP/day. The Yearly Transport Cost is 1.8 Billion NRP. If these transport cost can be reduced by tunnel project, there will be huge amount of economic benefit for Nepal nationwide.

6-5
TABLE 6.2-4 TOTAL TRAILER KILOMETER AT NAGDHUNGA SECTION
Time Direction Length Traffic Volume Year 2014 Total Vehicle * km Pass. Car Bus L. Truck H. Truck Total Pass. Car Bus L. Truck H. Truck Total
km vehicle vehicle vehicle vehicle vehicle veh.* km veh.* km veh.* km veh.* km veh.* km Morning Westbound 8.8 200 300 20 280 800 1,760 2,640 176 2,464 7,040 Eastbound 8.8 200 240 80 180 700 1,760 2,112 704 1,584 6,160 Day Time Westbound 8.8 600 900 60 840 2,400 5,280 7,920 528 7,392 21,120 Eastbound 8.8 600 720 240 540 2,100 5,280 6,336 2,112 4,752 17,480 Evening Westbound 8.8 200 300 20 280 800 1,760 2,640 176 2,464 7,040
Total
Eastbound 8.8 200 240 80 180 700 1,760 2,112 704 1,584 6,160 Westbound 8.8 1,000 1,500 100 1,400 4,000 8,800 13,200 880 12,320 35,200 Eastbound 8.8 1,000 1,200 400 900 3,500 8,800 10,560 3,520 7,920 30,800 Total 2,000 2,700 500 2,300 7,500 17,600 23,760 4,400 20,240 66,000
TABLE 6.2-5 TOTAL TRAVEL TIME AT NAGDHUNGA SECTION
Time Direction Travel Time, Year 2014 Traffic Volume, Year 2014 Total Vehicle * hour
Pass. Car Bus L. Truck H. Truck Pass. Car Bus L. Truck H. Truck Total Pass. Car Bus L. Truck H. Truck Total min. min. min. min. vehicle vehicle vehicle vehicle vehicle veh.*hour veh.*hour veh.*hour veh.*hour veh.*hour
Morning Westbound 19.9 19.9 25.1 25.1 200 300 20 280 800 66 100 8 117 291 Eastbound 22.5 22.5 33.5 33.5 200 240 80 180 700 75 90 45 101 310 Day Time Westbound 16.2 16.2 18.7 18.7 600 900 60 840 2,400 162 243 19 262 686 Eastbound 17.8 17.8 27.6 27.6 600 720 240 540 2,100 178 241 110 248 750 Evening Westbound 17.1 17.1 18.2 18.2 200 300 20 280 800 57 86 6 85 234
Total
Eastbound 18.1 18.1 26.2 26.2 200 240 80 180 700 60 72 35 79 246 Westbound 1,000 1,500 100 1,400 4,000 285 428 33 464 1,210 Eastbound 1,000 1,200 400 900 3,500 313 376 190 428 1,307 Total 2,000 2,700 500 1,300 7,500 599 804 223 891 2,517

6-6
6.2.3 Vulnerability to Disasters
Based on the study of existing topographic maps, aerial photographs, google earth Images and satellite images, it is found that the survey area east of the Nagdhunga is less hazardous to landslides. Most of the disastrous landslides affecting the stability of the existing roads are concentrated in the area between Nagdhunga in the east and the Sikre Khola in the west.
This part of the project area is characterized by many small to large landslides that once affected the passage of the vehicles in the road. The main cause of such high concentration of the landslides in this portion is attributed to the steep slopes, highly weathered, highly fractured and jointed, bedrocks composed of phyllite and phylltic sandstones with open joints. These landslides were active mainly during rainly season. However, most of these landslides now stable due to the construction of retaining structures though one can easily identify those landslides in the well preservation of the landslides scarps and the the body of the landslides .
The study area has also suffered some events of debris flow during past. Especially a recent event of debris flow has been identified from the Sisne Khola near the outlet of the proposed tunnel. According to the local people, the debris flow event was occurred in the august of 2007 creating obstacle to the passage vehicles for 7 hours. After this event 5 number of Sabo dams were constructed in the Sisne Khola so as to chase the flow of the debris into the road.
FIGURE 6.2-6 LANDSLIDE AND COLLAPSE DISTRIBUTION PROJECT AREA
Figure 6.2-6 shows the location of many landslide and collapse observed by topo-maps, aerial photos, field survey and google images.
Some of these landslide, we got more detail information as follows.
(1) LS 1 Near police check post at Nagdhunga
Around 2005, A new landslide started to move in the hillslope adjacent to the checkpost at Nagdhunga after the existing road was expanded to the present size during the conflict time. Though it did not create problem to the passage of the traffic, the cutslope was greatly unstable for the following years and even creat threat to the small houses on the upper part of the hillslope. Now a retaining structure has been constructed and the landslide is almost stable. The scarp and the body of the landslide can still be seen beside the large hoarding boards.

6-7
(2) LS 2 Near chisapanidhara
About 3 years ago, A big landslide was moved in this location after excavating the hillslope for expanding the Chisapani-Badbhanjyang road. The landslide was occurred after new cutslope was made for improving the existing gravel road. The landslide removed almost half part of the road. Later retaining wall was constructed on the hillside and gabion wall was constructed in the valley side to stabilze the road.
(3) LS 3 Location at Jhapre Khola
At the rainy season of 2008, the stream brought a huge amount of debris in the road and created problem for the passage of vehicles for about 7 hrs. The rain was persistent for the whole day and the sediments and the water were much beyond the capacity of the constructed surface drains. The traffic was stopped from about 4pm in the day and was opened for oneside after 7 hours. The similar event was repeated the following year but since then it has not caused any disturbances to the traffic.
(4) LS 4 At a small tributary with little water flowing
This is the place of another large landslide that caused problem to the road. Before construction of the retaining structures, about 10 years ago, there was a large landslide causing problem to the road. The landslide now seems stable with so many vegetations, however, still preserves the scarp of the landslide and its body. The landslide was active in rainy season.
(5) LS 5 In front of a big Landslide
According to the villagers, this landslide was very active and problematic about 15 to 20 years ago. The whole mass involving the road used to slide every year in the rainy season and created problem to the passage of the vehicles. The mass stopped to move after construction of the gabion walls in the foot of the landslide about 100m down the valley. It was constructed and strong concrete support and bolting was done to stabilize the road.
Some pictures concerned to slope failure from Nagdhunga pass to Sisne khola show in Figure 6.2-7 shows a trace of large-scale landslide north of Nagdhunga police check post. Surface of landslide is now covered by forest. Figure 6.2-8 shows a large scale collapse just north side of Sisne khola. Soil and rock blocks were continuously falling down during survey period also.
FIGURE 6.2-7 LARGE LANDSLIDE
NORTH OF CHECK POST
FIGURE6.2-8 LARGE LANDSLIDE
NORTH OF THE SISNE KHOLA
Figure 6.2-9 shows collapse of road shoulder due to steep gradient of slope, while Figure 6.2-10 shows continuous collapse of cut slopes occurred after rainy season.(Photo by google earth)

6-8
FIGURE6.2-9 COLLAPSE OF ROAD
SHOULDER
FIGURE 6.2-10 CUTSLOPE COLLAPSE
AFTER HARD RAINFALL
These pictures below were taken on August 8 at Thankot. After a rainfall debris flow attacked a village house. Villagers brought their furniture at safe places. If a big debris flow occurred at Thankot area, Tribhuvan highway will be closed.
FIGURE 6.2-11 COMBINATION PICTURES OF DEBRIS FLOW
6.2.4 Traffic Accidents and Vehicle Breakdowns
As mention in section 5.1.7, annual traffic accident along Nagdhunga section occurrence is 241. Major traffic accident factors are bad horizontal and vertical alignment and narrow road width, as reported by the local traffic police. These are also manifested in many vehicle breakdowns along Nagdhunga section every time. As these vehicle breakdowns stopped on the carriage way many traffic was blocked by these breakdown. (see Photo 6.2-1)
PHOTO 6.2-1 VEHICLE BREAKDOWN ON THE CARRIAGEWAY

6-9
6.2.5 Traffic Capacity
Traffic Capacity of existing road and proposed tunnel section were estimated by Japan’s road traffic capacity manual published by Japan Road Association.
If this project is implemented, the traffic capacity will drastically increase at this section.
Estimated Traffic Capacity
-Existing Road Section 621vehicle/hour
-Proposed Tunnel Road Section 1,353 vehicle/hour
The calculation method and results describes as follows.
(1) Calculation Method
Traffic Capacity was calculated by base traffic capacity, road condition and traffic condition.
CL = CB × ᵧ L × ᵧ C × ᵧ ℓ × ᵧ T × …. 1) CB : Base Traffic Capacity (2,500 veh /h for two-way two-lane road, 2,200 veh/h for one
lane of multi-lane road)
2) ᵧL : Carriageway width (WL [m]) Correction Factor WL [m] ᵧL
Over 3.25 3.00 2.75 2.50
1.00 0.94 0.88 0.82
3) ᵧC : Side space width (WL [m]) Correction Factor
Side space width,WC [m] ᵧC One side only Both side
Over 0.75 0.50 0.25 0.00
1.00 0.98 0.95 0.90
1.00 0.95 0.91 0.81
4) ᵧℓ : Road side Development
Degree of urbanized area ᵧℓ Not urbanized area
Some urbanized area Urbanized area
0.95 ~ 1.00 0.90 ~ 0.95 0.85 ~ 0.90
5) ᵧT : Gradient and Heavy Vehicle Rate
Er is applied based on Table 6.2-6.

6-10
TABLE 6.2-6 HEAVY VEHICLE’S PASSENGER CAR FACTOR (ER)
Gradient Length ( km )
Two-way Two-lane Road (Heavy Vehicle Rate, %)
Multi-lane Road (Heavy Vehicle rate, %)
10 30 50 70 90 10 30 50 70 90 3% less ̶ 2.1 2.0 1.9 1.8 1.7 1.8 1.7 1.7 1.7 1.7
4%
0.2 2.8 2.6 2.5 2.3 2.2 2.4 2.3 2.2 2.2 2.2 0.4 2.8 2.7 2.6 2.4 2.3 2.4 2.4 2.3 2.3 2.2 0.6 2.9 2.7 2.6 2.4 2.3 2.5 2.4 2.3 2.3 2.3 0.8 2.9 2.7 2.6 2.5 2.4 2.5 2.4 2.4 2.3 2.3 1.0 2.9 2.8 2.7 2.5 2.4 2.5 2.4 2.4 2.4 2.3 1.2 3.0 2.8 2.7 2.5 2.4 2.6 2.5 2.4 2.4 2.4 1.4 3.0 2.8 2.7 2.5 2.4 2.6 2.5 2.4 2.4 2.4 1.6 3.0 2.9 2.8 2.6 2.5 2.6 2.5 2.5 2.4 2.4
5%
0.2 3.2 3.0 2.8 2.7 2.6 2.7 2.6 2.6 2.6 2.5 0.4 3.3 3.1 2.9 2.8 2.7 2.9 2.7 2.7 2.7 2.6 0.6 3.4 3.2 3.0 2.8 2.7 2.9 2.8 2.7 2.7 2.7 0.8 3.5 3.2 3.0 2.9 2.8 3.0 2.9 2.8 2.8 2.7 1.0 3.5 3.3 3.1 2.9 2.8 3.0 2.9 2.8 2.8 2.8 1.2 3.6 3.4 3.1 3.0 2.9 3.1 3.0 2.9 2.9 2.8 1.4 3.6 3.4 3.2 3.0 2.9 3.1 3.0 2.9 2.9 2.8 1.6 3.7 3.4 3.2 3.1 2.9 3.2 3.0 3.0 2.9 2.9
6%
0.2 3.4 3.2 3.0 2.8 2.7 2.9 2.8 2.7 2.7 2.7 0.4 3.5 3.3 3.1 3.0 2.9 3.1 2.9 2.9 2.8 2.8 0.6 3.7 3.5 3.3 3.1 3.0 3.2 3.1 3.0 3.0 2.9 0.8 3.8 3.6 3.4 3.2 3.1 3.3 3.2 3.1 3.0 3.0 1.0 3.9 3.6 3.4 3.3 3.1 3.3 3.2 3.1 3.1 3.1 1.2 4.0 3.7 3.5 3.3 3.2 3.4 3.3 3.2 3.2 3.1 1.4 4.1 3.8 3.6 3.4 3.3 3.5 3.4 3.3 3.2 3.2 1.6 4.1 3.9 3.7 3.5 3.3 3.6 3.4 3.3 3.3 3.3
7%
0.2 3.5 3.3 3.1 2.9 2.8 3.0 2.9 2.8 2.8 2.8 0.4 3.7 3.5 3.3 3.1 3.0 3.2 3.1 3.0 3.0 2.9 0.6 3.9 3.6 3.4 3.3 3.1 3.4 3.2 3.1 3.1 3.1 0.8 4.0 3.8 3.5 3.4 3.3 3.5 3.3 3.3 3.2 3.2 1.0 4.2 3.9 3.7 3.5 3.4 3.6 3.4 3.4 3.3 3.3 1.2 4.3 4.0 3.8 3.6 3.5 3.7 3.5 3.5 3.4 3.4 1.4 4.5 4.2 3.9 3.7 3.6 3.8 3.7 3.6 3.6 3.5 1.6 4.6 4.3 4.0 3.8 3.7 3.9 3.8 3.7 3.7 3.6
ᵧT =
ᵧT :Gradient Correction Factor
Er : Heavy Vehicle’s Passenger Car Factor
6) Other Factors
Other factor to reduce traffic capacity is horizontal alignment, driver’s characteristics and vehicle performance (especially curve section and tunnel section). There are still no quantitative correction factors to consider these influences.
(2) Existing Road Capacity
Based on the above method, the existing road capacity was estimated
100
(100-T) + ETT

6-11
CL = CB × ᵧ L × ᵧ C × ᵧ l × ᵧ T
= 2,500 × 1.00 × 0.91 × 0.95 × 0.29 = 626 vehicle/hour
CB = 2,500
ᵧ L= 1.00 (WL ˃ 3.25m)
ᵧ C = 0.91 (Both side WC = 0.25m)
ᵧ l = 0.95 (sub-urban area)
ᵧ T = Er 3.4 (7%, Heavy Truck Rate 50%, ℓ =0.5km) (see Table 6.2-6)
= Er 5.7 (Gradient 10%, Heavy Truck 50%, ℓ = 0.5 km) was estimated by the Study Team
based on Table 6.2-6.
ᵧT = = 0.29
As the peak hour traffic volume at Nadhunga section was 621vehicle/hour, the traffic volume has already reached the traffic capacity.
(3) Tunnel Section
As the same method, the proposed tunnel section’s capacity was estimated.
CL = CB × ᵧ L × ᵧ C × ᵧ t × ᵧ T
= 2,500 × 1.00 × 0.95 × 0.95 × 0.6
= 1,353 vehicle/hour
The estimated traffic capacity is 1,353 vehicle/hour. If this project is implemented, the traffic capacity will drastically increase at this section.
(100-50) + 5.7 × 50
100


CHAPTER 7
NECESSITY OF THE PROJECT


7-1
CHAPTER 7 NECESSITY OF THE PROJECT
7.1 ITEMS TO BE CONFIRMED FOR PROJECT NECESSITY
Project necessity was confirmed from the following view points;
Alignment Problems
Existing road have a steep gradient of 7~10% and many small horizontal curves (Section 6.2.1).
Transport Efficiencies
Present average travel speed of westbound is 16.2km/h in the morning peak due to poor alignment condition (Section 6.2.2).
Traffic capacity will drastically increase at this section (Section 6.2.5).
Risk of Traffic Closure
This part of the project area is characterized by many small to large landslides. There are risk of traffic closure due to landslide or collapse of cut section along existing road (Section 6.2.4).
Effect of Future Road Network
DOR has confirmed that the improvement of the existing road from Mugling to the west portal of this project will be undertaken by DOR under the assistance of the WB. DOR has confirmed to incorporate the plan of Nagdhunga Tunnel Construction Project and assured that the improvement plan will be consistent with the plan of the tunnel.(Section 7.6 (1), Section 6.1)
Effects on National/Regional Development
The project will be support the National and Regional Development Plan (Chapter 2)
Economic Viability
Total transport cost of Nagdhunga section is approximately 5 million NPR/day. The project contribute the economic benefit for Nepal nationwide (Section 6.2.2).
7.2 NATIONAL PRIORITY PROJECT
In Nepal, the National Priority Projects are categorized as “Pride” “P1”, “P2” and “P3” in a priority order. As this project has a very important role as a national economic corridor, recognition has been given as “P1” and essential process has been initiated by DOR for approval by the National Planning Commission (NPC). The NPC has already announced inclusion of the project in the annual development program 2071/72 it has published. Given the documents are smoothly processed the designation of the project as “P1” will be approved and included in the Red Book for fiscal year 2072/73.
Presently, altogether 455 projects are entitled as the priority projects out of which 282 are categorized as P1 project.
Table 7.2-1 shows the number of National Priority Projects and Table 7.2-2 shows the major pride projects and the budget allocated.

7-2
TABLE 7.2-1 NUMBER OF NATIONAL PRIORITY PROJECT MOPIT Project Other Ministry
Project Total DOR Others Pride 6 1 14 21
P1 50 4 228 282 P2 16 3 110 129 P3 1 0 22 23
Total 67 7 374 455 Source: Red book 2013 – 14, Ministry of Finance
TABLE 7.2-2 PRIDE PROJECT OF ROADS
No Project Name Allocated Budget (2013-2014) 1,000 NRP
1 2 3 4 5 6
Mid Hill Highway Postal Highway North South Koshi Highway North South Karnali Highway North South Gardaki Highway Kathmandu Terai Fast Track
1,922,716 1,250,000
N/A N/A N/A N/A
South: Redbook 2013-2014, Ministry of Finance
7.3 TRAFFIC IMPACT
(1) Overall Traffic Characteristics
Based on the traffic surveys undertaken in July 2014, traffic flow is estimated as shown in Figure 7.3-1.
Through Traffic: Traffic which has origin or destination of Nagdhunga is 400 vehicles/day. It shares only five (5%) of the entire traffic. The remaining ninety five (95%) of traffic is through traffic.
Kathmandu Traffic: Traffic which starts from or ends in Kathmandu is 6,900 vehicle/day. The share of this section is 90%.
Pokhara Traffic: Pokhara is the second largest city and is a famous tourist destination in Nepal. Daily Traffic between Kathmandu and Pokhara through Dhading district is about 3,000 vehicle/day. Pokhara Traffic is 1,500 vehicle/day (Passenger Car 42%, Bus 54% and Truck 3%).
Birganj Traffic: Though Birgunj and central south traffic is 1,330 vehicles/day, Birgunj traffic passing this road was 570 vehicle/day (Heavy truck 80% and others 20%)

7-3
FIGURE 7.3-1 TRAFFIC CHARA CTERISTICS
7.4 ROAD IMPACT
As described in section 6.2, the road alignment of the objective existing road is in a very poor condition contributing to significant reduction of the traffic capacity.
Table 7.4-1 shows the road alignment factors and traffic capacity of the existing road and the proposed tunnel road. Since the proposed road section will be of high standard, and its geometric criteria such as the road width, horizontal curvature, vertical grades etc. will improve significantly, the traffic capacity in this section will increase. Consequently, the bottleneck situation of this road section will be alleviated, if not eliminated.
TABLE 7.4-1 ROAD ALIGNMENT FACTORS AND TRAFFIC CAPACITY OF EXISTING ROAD AND PROPOSED NEW TUNNEL ROAD
Existing Road Proposed Road Road Length (km) 8.00 km 5.05 km
(including tunnel, 2.45km) Gradient 10%, L = 500m
8%, L = 600m 7%, L = 500m
3.22%, L = 2,450 m (Tunnel) 5.0%, L = 300 m
Minimum Radius Curve Section
19 curves (R<30m) R = 200m
Road Width 8m 11m Design Speed 20 kph (estimated based on
curve radius) 40kph
Estimated Traffic Capacity 621 vehicle/hr 1,353 vehicle/hr (Tunnel Section)
Source: JICA Study Team
7.5 NECESSITY OF NAGDHUNGA TUNNEL
Nagdhunga Tunnel is necessary due to the following reasons;
Traffic condition along Tribhuan highway at Nagdhunga section is chronic due to many sharp curves and hairpin curves (19 locations), and steep gradient(aggregate 1.6km section exceed a vertical gradient of 7%). As Nagdhunga Tunnel has no sharp curve section and steep gradient, the Tunnel project will contribute to reduce the traffic problem at
Pokhara and Dhading District 3,020 (39%)
Bhairahawa and southwest area 2,400 (31%)
Nagdhunga 400 (5%)
Northeast area 600 (8%)
PROJECT SITE 7,700 (100%)
Kathmandu 6,900 (90%)
Birgunj area 1,330 (17%)
Southeast area 750 (10%)
4,480
Unit: veh./day

7-4
Nagdhunga area.
Due to the above road condition, the current traffic volume is 7,704 vehicle/day in 2014 and it has reached its traffic capacity. Since traffic volume will increase by approximately 4%, the traffic condition will become more serious. To increase the traffic capacity at Nagdhunga section, the new tunnel road project is necessary.
Strongly supports the economic activities not only in Kathmandu, but also nationwide as a whole, the road transport access to Birganj/Bhairahawa dry port of India must be strengthened. The share of truck is 37% of total traffic at Nagdhunga section. The Tunnel project will provide smooth access to Kathmandu and other areas.
Most of the road sections have steep slope cutting and embankment sections and slope protection are minimal. In such case, heavy rains can trigger serious slope failures accounting to long and frequent road closures and/or raising chances of serious accidents. Traces of slope failures exist at Nagdhunga section even at present. The Nagdhunga Tunnel project will drastically reduce the risk of road closures as an alternative route.
As estimated transport cost at Nagdhunga section is relatively high, which amounts to about 5 Million NRP/day (see Section 6.3). If the proposed tunnel road will be constructed, transport cost will be significantly reduced.
Major commodities transported by trucks that pass the Nagdhunga section are construction materials (45%), agricultural products (20%), fuel (10%) and so on. These items are very important for the activities of daily living of Kathmandu’s people.
Even if Fast Track Project is implemented, the reduced traffic along Nagdhunga area is estimated to be only about 15% (converted).
7.6 ISSUES TO BE CONSIDERED
It is clear Nagdhunga Tunnel is a measure against the most critical section of the existing Tribhuvan Highway. The necessity of the tunnel is already justified in the preceding sections. However, in order to achieve maximum advantage of the tunnel, some other issues need to be resolved. Some of the major issues are as follows;
(1) Improvement of Existing Road beyond Tunnel Section
The road condition of the existing Tribhuvan Highway is poor all the way up to Naubise- the starting point of Prithvi Highway. The provision of the Nagdhunga Tunnel will improve only the most critical section of the stretch leaving behind the issue of improvement beyond the west side portal. It is no doubt that the best outcome of the improvement work is attainable if the entire section up to Naubise is improved.
In connection to this, DOR has confirmed that the improvement of the existing road from Mugling to the west portal of this project will be undertaken by DoR under the assistance of the WB. The DOR, Foreign Cooperation Branch has called for expression of interest (EOI) for the feasibility study and detailed design of improvement under the project name, “Nepal India Regional Trade and Transport Project”. DOR has confirmed to incorporate the plan of Nagdhunga Tunnel Construction Project and assured that the improvement plan will be consistent with the plan of the tunnel.
(2) Maintenance of the Existing Road
From the opinion survey conducted during traffic count with the road users, about ninety percent of the traffic is estimated to use the tunnel. This means about ten percent of the traffic will continue using the existing road regardless of the geometric condition and other potential inconveniences and risks. Apart from these vehicles, vehicles that are barred from using the tunnel such as overloaded, oversized, and mechanically ill-functioning and those carrying hazardous and highly inflammable materials will also be using the existing road. Therefore,

7-5
maintaining the existing road adequately will be required. DOR has assured that the existing stretch will also be classified as the national highway and treat as a part of the SRN and maintain its condition in the same manner as it is being done at present.
(3) Measures to be taken when Existing Road is Impassable
The existing road beyond Sisnekhola (west side tunnel portal) is reported to have been closed frequently for traffic in the past due to landslides, slope failures and other natural causes. This is anticipated to occur again in the future. In such case, the only possible access to/from Kathmandu will be the tunnel way and such circumstances will raise a problem on whether to allow restricted vehicles from using the tunnel road or not. The Survey Team therefore proposes the following measures to be practiced during such time.
The oversized vehicles shall not be allowed inside tunnel at all.
The overloaded vehicles should be allowed inside only if/after it unloads the excess load
The mechanically malfunctioning (defected) vehicles and other vehicles including tankers such as motorbikes, 3-wheelers should be allowed inside the tunnel only at a specified time, under controlled speed with proper escort and strict surveillance
If necessary, limit the speed inside the tunnel.

CHAPTER 8
ALIGNMENT SELECTION


8-1
CHAPTER 8 ALIGNMENT SELECTION
8.1 ALTERNATIVE ALIGNMENT STUDY BY JICA-ASSISTED “DATA COLLECTION SURVEY ON THANKOT AREA ROAD IMPROVEMENT IN NEPAL”
8.1.1 Background
Prior to this Survey, JICA had conducted the project, “Data Collection Survey on Thankot Area Road Improvement in Nepal” (Data Collection Survey) from January, 2014. Altogether five alternatives were studied in this project and comparison study was performed to select the optimum one from the three alternative alignments that passed the initial screening. These alternative alignments were reviewed as discussed hereunder.
8.1.2 Review of the Alternative Alignments
The alternative alignments selected from among the five alternatives for detailed comparison to select the optimum alignment proposed during the Data Collection Survey are shown in Figure 8.1-1.
Source: Data Collection Survey
FIGURE 8.1-1 ALTERNATIVE ALIGNMENTS
Though there is no specific mentioning about what the proposed alternatives are intended for, it can be assumed that the alignments proposed were from the following points of view.
1) Alternative-A: Emphasis on maximum utilization of existing road 2) Alternative-B: Emphasis on minimizing tunnel length 3) Alternative-C: Emphasis on geometric requirements
Out of the three alternative alignments, Alternative-C was selected as the optimum alignment in the Data Collection Survey. Alternate-B, which has the shortest tunnel, is the least attractive alternative. The spiral land bridge (looped bridge) is not only extremely expensive to construct, but also difficult and its maintenance cost is also the highest. The construction cost of Alternative-B is twice as much as that of Alternative-C. To add, the vertical gradient of the tunnel (4.0%) as well as that of the spiral bridge section (4.8%) are relatively higher to enable smooth and safe drive to the vehicles.
Alternate-A is attractive in terms of lowest construction cost, maintenance cost and land acquisition including relocation of houses. Impact on the groundwater during construction is considered to be high and the approach road at the east side is considered to require high fill
Optimum Alignment

8-2
and high cut. However, the biggest concern is that there is high possibility of lowering the groundwater level of the surrounding area.
As mentioned in the Data Collection Survey, all alternatives have its own distinct advantages. This survey puts high emphasis on vertical grades. The vehicles plying on the objective road, particularly the trucks, are not only old and over loaded, but also lack in capacity. Measured record indicates that these trucks can run on an average of about 15-20km/h at sections inclined to 4.0%. This can create unfavorable situation inside the tunnel. Therefore, it is desirable to have a vertical gradient as small as possible.
From this aspect, Alternative-C, which has a vertical grade of 3.5% and was selected as optimum alignment is justifiable.
8.1.3 Suitability for Provision of Tunnel
The objective road is one of the most important trunk roads that support the economic and social activities of the country. The objective section of the project passes through Nagdhunga Pass, and consists of steep vertical grades exceeding 10% in combination to consecutive curves with small radius of curvature. This section is vulnerable to slope failures and other water-induced disasters, that often hamper traffic flow or sometimes even contributes to closure of the road. All combined, the section is being the biggest bottleneck of the road and immediate measures are required to deal with the situation. As have also been pointed out in pre-studies, the optimum measure to remedy the above situation is provision of a tunnel. The following reasons are considered to justify its suitability.
Being a mountainous area, improvement of vertical grades and widening of the existing road is extremely difficult, if not virtually impossible.
Other possible improvement measures are provision of land bridge, provision of spiral bridge etc. These methods were studied and compared and the results showed that provision of tunnel (as planned in this project) is the optimum measure.
The proposed tunnel was studied from various aspects and has been planned to satisfy the requirements specified in the Japanese Guidelines for Planning and Design of Tunnels.
This tunnel is potentially the first ever highway tunnel of its kind in Nepal. Various facilities have been planned to be installed inside the tunnel taking safety during and after construction into consideration. One of the programs planned is the capacity development (CD) of DOR during operation stage. The CD also includes enhancing safety awareness of road users through tunnel safety campaign program.
8.1.4 Issues of the Optimum Alignment
The Survey Team conducted site reconnaissance several times after the commencement of the project with an aim to verify the actual condition of the alignment at the site, as well as identify issues, if any, regarding the optimum alignment of the Data Collection Survey. Figure 8.1-2 shows the optimum alignment (indicated by the violet line) and locations where issues were identified.

8-3
Source: Data Collection Survey
FIGURE 8.1-2 OPTIMUM ALIGNMENT MAP AND LOCATION OF ISSUES
(1) Social and Environmental Issues
1) Houses Near End Point of East Side of Approach Road
One of the major issues of the previous alignment was identified at the intersection with the existing Tribhuvan Highway. As shown in Figure 8.1-3, the alignment affects several big residential houses necessitating relocation of many households. In addition, there is development work being conducted at the open area. According to the hearing conducted by the Survey Team with the workers there, it was understood that 14 new houses will be constructed in no matter of time. All these houses will be affected by the alignment.
FIGURE 8.1-3 HOUSES NEAR END POINT OF EAST SIDE APPROACH ROAD
LEGEND Affected houses New construction
(14 houses)
Previous Alignment

8-4
2) Impact on Brick Factories
The other issue is that the alignment almost bisects the brick kiln as is shown in Figure 8.1-4. In the Data Collection Survey, it is mentioned that the brick factories are not permanent structures. They move to different location once the material for making the bricks is no more available near its location. It also says that, being just a factory, where people commute to make bricks and not a place where people actually live, there is need for relocation of the factory only and does not require relocation of households. From such aspect it was concluded that alignment bisecting the brick factory is not a big issue.
The Survey Team met and discussed with the DOR and confirmed that there is less chance of any kind of objection in requiring the land belonging to the brick factory.
(2) Engineering Issue
As can be understood from Figure 8.1-3, the alignment near the intersection with the existing Tribhuvan Highway is curved. It is understood that doing so can secure smooth flow along the approach road. However, vehicles from Thankot headed for Kathmandu will have a hard time negotiating with the traffic to and from the approach road. This type of alignment is acceptable if the traffic volume from within Thankot area is significantly low. Otherwise, it is considered to lack traffic safety.
On the other hand, there is no specific plan for an approach road at the west side in the Data Collection Survey. There is also no detailed arrangement for securing connectivity between the approach road with the existing Tribhuvan Highway.
(3) Geological issue
The geological condition of the tunnel profile is shown in Figure 8.1-5. This figure depicts the soil type distribution along the tunnel. As shown in the figure, the area is basically composed of Sandstone and Phyllite, where excavation work for tunnel construction is relatively simple. However, the basin areas are composed of alternate layer of lacustrine and Talus deposited from the surrounding mountains such as Chandragiri and Badbhanjyang. These types of soil are considered weak and weathered. A portion of the previous tunnel alignment (Data Collection Survey) passes along this Lacustrine and talus soil deposit. Tunneling along this type of soil will require various auxiliary methods and is not only time-consuming but is also costly.
Source: Survey Team
FIGURE 8.1-5 GEOLOGICAL CONDITION ALONG TUNNEL SECTION
FIGURE 8.1-4 ALIGNMENT BISECTING BRICK
FACTORY
Material available area where
Brick factory
Previous Alignment
Basin-A Basin-B

8-5
8.2 SELECTION OF TUNNEL PORTALS AND ALIGNMENT
Past study reports were reviewed and those alignments proposed and studied are reviewed in detail. As a result, the Survey Team has concluded that the locations of tunnel portals recommended in the Data Collection Survey are optimum. Due to the short period allowed for site investigations, field survey areas and quantities for geotechnical, topographical, hydrological and environmental survey have been fixed and started implementation in the very early stage.
8.2.1 Eastern portal
The Survey Team once studied of the adequate location of eastern portal aiming to reduce the vertical gradient of the tunnel section to reduce concentration of harmful gasses and particles inside the tunnel as much as possible. During the course, a candidate location of tunnel portal was determined. The location of this portal is shown in Figure 8.2-2 as Alt 2 and the portal of recommended Alignment 1A is shown in the figure as indicated by Alt.1.
FIGURE 8.2-1 LOCATION OF EASTERN PORTAL AND ITS ALTERNATIVE
Site reconnaissance was carried out along the Alignment 1A and candidate portal Alt 2. After field survey on topography and geology, the eastern portal Alt 2 has been abandoned due to the following reasons.
Alt 2 is located at the margin of a small ridge about 300m south from the alignment 1A.

8-6
This means it will be necessary to have a significant alignment change from alignment 1A and will also require provision of a large S-curve in the tunnel section. In addition, alignment of approach road should also be largely modified.
There are some large cuttings in the ridge where complex geotechnical conditions are observed. Completely weathered basement rock mass is totally fractured and sheared and its structure is totally disturbed. There might have been a distribution of significant faults which could have caused such disturbance of geological settings.
In the small ridge extending from north to south, saddle topography is observed and southern portion of this saddle structure is anticipated to be in totally disturbed ground.
If the portal is fixed at Alt 2, the excavation of the tunnel will lie on this very difficult geotechnical condition. Tunneling may encounter serious difficulty and require longer construction period and higher cost.
8.2.2 Western portal
The western portal location was tentatively fixed at the foot point of the ridge behind a small shop by cutting the slope till the same elevation of that of existing road based on the site reconnaissance result and topographic survey result. There are two small streams at both sides of the portal. Thus it is extremely importance to manage the stream water to avoid any possible influence to the tunnel portal structure.
With adequate drainage system at the base of the streams, these small valleys are to be used for the temporary installment of various facilities for tunnel construction, such as stock yard for various materials and equipment for construction, water treatment facility for the waste water from the tunnel and so on.
It is of great importance for the alignment to adequately intersect with the existing road. Various alternative ideas are under study to safely intersect with existing road and new road. Meanwhile, the deep valley in front of the tunnel shall be filled up by material from slope cut and tunnel muck and utilized for new road access to the existing road. After topographical survey has been finished portal elevation was lowered by about 5m to intersect with the existing road at the same elevation because of the difficulty in approaching to the existing road in adequate gradient.
During the course due to the difficulty anticipated to construct the approach road connecting to the existing road in a safe manner and getting proper intersection there, our team started studying other candidate portal locations which are shown in the Figure 8.2-2 as Alt-2 and Alt-3.
Alt-2 is located at about 30m below the existing road (elevation may be about 1290m). When tunnel portal is constructed here and connected to the existing road at the small ridge northwest of the curve of the existing road, wide area can be obtained for the intersection of new road and existing road.
Site reconnaissance was carried out and after field survey on topography and geology, Alt-2 has been abandoned due to the following reasons.
Alt-2 situates just beneath the existing road at elevation of about 1290m and is friable to falling down of heavy vehicles.
Approach to the portal needs long access within the sharp valley topography where slope stability shall be a key factor.
Tunnel becomes longer and gradient is steeper than present alignment.
It is difficult to obtain sufficient working area at portal.
When the road goes out from the tunnel it requires very long and tall bridge which requires most advanced technique and higher cost.

8-7
Alt-3 is located at a tiny valley south of the existing road at elevation of about 1290m. When tunnel is constructed with large and wide cuttings of the slopes surrounding the portal, new road may easily approach to the existing road. And when the valley north of the portal is filled up for diversion of the existing road during tunneling, it can provide an intersection area.
Site reconnaissance was carried out and after field survey on topography and geology, the candidate portal Alt-3 has been abandoned due to the following reasons.
To get sufficient space to start tunneling form here, wide area of slopes shall be cut to obtain sufficient working area for tunneling. It destructs the natural environment and requires permanent slope maintenance of wide areas.
Length of the tunnel increases significantly and tunnel gradient also becomes steeper than the present alignment.
New road at the tunnel outlet intersects with the existing road which has gradient of about 6% and traffic safety may be a serious problem.
To fill the valley north of existing road to get road diversion materials for fill are not available in early stage.
FIGURE 8.2-2 WESTERN PORTAL LOCATION AND ITS ALTERNATIVES
8.2.3 Alignment of the tunnel
In the early stage after site reconnaissance survey and geological walk out survey, alignment of the tunnel section was shifted towards north as shown in Figure 8.2-3, in order to avoid the poor ground south of the saddle of the small ridge near eastern portal as well as to avoid the unconsolidated sediments in the valley area after passing the ridge. Thus, beneath the valley areas sufficient rock cover above the tunnel is safeguarded. By avoiding very poor geotechnical conditions tunnel construction can be done more economically and within shorter period. Following shifting of the initial alignment to the north, maintaining a straight alignment for the tunnel section was not possible and insertion of two reverse curves had to be done because the two portals (entrance and exit portal locations) are immobile. Therefore, the alignment proposed under this survey is curved. Being the first road tunnel, questions may be raised whether a curved alignment can be applied inside a tunnel. In general, drivers tend to speed up on long straight road. The long straight alignment can be monotonous under similar aesthetic like inside a tunnel and make the drivers sleepy or enhance driver errors. There is similar

8-8
practice in Japan also. The “Transport Engineering Handbook 2008” of Japan recommends a maximum length of 1000m for a road with design speed 50km/h. Therefore, from engineering approach, a tunnel with a big radius of curvature is rather better than a long straight alignment.
FIGURE 8.2-3 TENTATIVE ALIGNMENT
8.3 SELECTION OF APPROACH ROAD ALIGNMENT
The approach road is composed of two sections – one at the east side and the other at the west side. The east side approach road was selected from various alternatives during the Data Collection Survey. There was no selection of an approach road in the west side.
8.3.1 Basic Policy
Following policies were applied in selecting the alignment of the approach road.
(1) Meet the Engineering Requirements
(2) Minimize the length of the road
(3) Minimize adverse impact on natural and social environment
(4) Secure access appropriately to and from the community
(5) Secure safe flow during construction (construction efficiency)
(6) Economic feasibility
8.3.2 Requirements for Selection
Various requirements were applied in identifying the alternative alignments of the approach road. The major requirements taken into consideration are as follows.
(1) Overall Requirement
The approach road at the east side is relatively long with a length of about 2.6km. This

8-9
alignment was selected during the Data Collection Survey from among several alternatives. The Survey Team made a quick review and concluded that the selected alignment is justifiable for reasons mentioned below. (Some of these reasons are mentioned in Section 8.1.2 as well).
The location of the tunnel portal is a precondition for an approach road. The location of the tunnel portal was determined such that lowest possible vertical grade can be applied. Therefore, it is fixed. On the other hand, the location where the approach road would meet with the existing road is desirable to be such that the houses that would be affected are minimal. The proposed alignment for the approach satisfies these conditions.
There is a District Road running parallel north of the existing Tribhuvan Highway. The only proper connection between these two roads is in Nagdhunga. The proposed approach road alignment is such that it provides a new connecting point between these two roads allowing easy access from the District Road to not only to the tunnel, but also to the existing Trbhuvan Highway.
The Outer Ring road, if implemented will run north-south about several hundred meters east from the proposed approach road. The approach road can be extended towards the east in the future to provide direct access to/from the Outer Ring Road.
(2) Engineering Requirement
The approach road is considered to become a part of the Tribhuvan Highway, which is functionally classified into Class II. As such, the approach road should meet the basic geometric requirements of the said class (Class II). Table 8.3-1 shows the basic requirements for Class II roads based on Nepal Road Standard 2070 (July, 2013), but some of the requirements come from other standards such as Japan Road Ordinance and AASHTO.
TABLE 8.3-1 ENGINEERING REQUIREMENTS FOR SELECTION OF ROUTES
ITEMS REQUIREMENTS
1. Administrative Classification National Highway 2. Functional Classification Class II 3. Design Traffic (ADT) 10,000-11,000 4. Design Speed 60km/h (40km/h in case of existing road) 5. Design Vehicle WB-15 AASHTO 6. Horizontal Radius of Curvature Desirable 150m
Minimum 100m Unavoidable 90m Hair pin curves 15m
7. Vertical Gradient 0.5% - 7% 8. Right of Way Reserve 50m (25m from centerline at each side)
(3) Natural and Social Environmental Requirements
The following natural and social environmental concerns of existing land were taken into consideration in identifying the proposed approach road.
National and community forests
Rivers, streams and other sources of water
Religious and social facilities (temples, holy trees, cremation area, graves, etc.)
Cultivated lands/farms
Important government facilities
Residential houses/buildings

8-10
Institutional and educational facilities
Existing roads
(4) Access to Abutting Properties
The approach road at the east side will function as a bypass of the existing Tribhuvan Highway, emphasizing the mobility function of a road. However, there are communities alongside the approach road and the approach road should provide access to and from such communities.
8.3.3 Identification of Control Points
Control points for delineation of alignment were identified through review of relevant documents, thorough site reconnaissance and discussions with relevant organizations. Following are some major control points identified.
Built-up areas
Undergoing housing development plans
Water channels (rivers, streams)
Intersection with the existing roads
Geologically weak areas (faults, land slide and slope failure prone area etc.)
Topographically unsuitable areas (cliffs, mountains, soft ground etc.)
8.3.4 Delineation of Alternative Alignments
(1) East Side Alternative Alignment
As mentioned earlier, the alignment of east side approach road set during the Data Collection Survey is appropriate except for the issues mentioned in section 8.1. Therefore, instead of providing completely new and different alternative alignments, measures were taken to address the aforementioned issues and modify the optimum alignment determined in the previous Study. The control points mentioned above were also taken into consideration in modifying the alignment. The measures taken are;
1) Shifting of Alignment
Figure 8.3-1 shows the previous alignment (Data Collection Survey) and the newly delineated alignment. The new alignment runs almost in parallel with the previous alignment at about 200m to the east from the previous alignment. However, the intersecting point with the existing Tribhuvan Highway is almost at the same location. As depicted in the figure, in contrary to the previous alignment, which affects a number of houses, the newly delineated alignment allows avoidance of many houses that were affected by the previous alignment.

8-11
FIGURE 8.3-1 ALIGNMENT SHIFT AT END POINT OF EAST APPROACH ROAD
2) Provision of Intersection System
Signal controlled system will be planned at the intersection with the existing Tribhuvan Highway to control the traffic flow.
3) Change following Alteration of Tunnel Alignment
The tunnel alignment was altered tentatively based on the recommendation made in the Data Collection Survey and the findings of the preliminary results of geological investigations. The alignment of the approach road was then adjusted to meet with the modified alignment of the tunnel.
(2) West Side Alternative Alignment
The alignment of the approach road at the west side is dependent on how the connection with the existing road is provided. Many conceivable alternatives for connectivity between the approach road and the existing road were studied, among which two potential alternatives were ultimately selected. A simple comparison of these two alternatives was conducted with respect to the geometry, safety, drivability, and construction cost as summarized in Table 8.3-2.
LEGEND New Development (14 houses)
Houses affected
Proposed Alignment
Previous Alignment (Data Collection Survey)
200m

8-12
TABLE 8.3-2 COMPARISON OF CONNECTIVITY BETWEEN APPROACH ROAD AND EXISTING ROAD
Alternatives Alternative-1: Without Intersection Alternative-2: With Intersection
Illustration
Concept Traffic control: Merge/diverge Approach road: priority Existing road: Yield
Traffic control: Signalized Intersection (If possible, introduction of )
Structures Bridge L=60m (3-span, curved) Retaining walls
Traffic signals ✓
Eva
luat
ion
Fact
ors
Geometry Min. horizontal radius=15m Max. grade=11.7% (westbound)
=5.0% (eastbound)
Min. horizontal radius: 20m Max. grade= 5% (both direction)
✓
Safety Inferior to Alternative-2 No significant problem ✓ Drivability (approach road)
Interruption to traffic is low (Approach road priority)
✓ Interruption to traffic could be high (stop at intersection) (signal can be arranged to prioritize traffic flow on approach road)
Construction Efficiency
✓ ✓
Cost and period Expensive than Alternative-2 Cheaper than Alternative-1 ✓ Evaluation RECOMMENDED

8-13
8.3.5 Verification at Site
Site reconnaissance was conducted to verify the established alignment at the site. The alignment was checked whether it meets with the actual condition of the site and satisfies the control points set. There were no particular contradictions nor issues identified during the site reconnaissance
8.3.6 Determination of the Alignment
A comparative study was conducted to determine the optimum alignment of the tunnel and its approach road. Table 8-2 shows the comparison and its result.
8.4 SELECTED ALIGNMENT OF TUNNEL AND APPROACH ROAD SECTION
Table 8.4-1 shows the comparison between the proposed and previous alignments. The horizontal alignment of tunnel including the approach section and the profile is shown in Figure 8.4-1.
Plan and Profile of the final alignment is shown in the Sheets NO. 3 to 6 of the Preliminary Design Drawings.

8-14
TABLE 8.4-1 COMPARISON BETWEEN PROPOSED AND PREVIOUS ALIGNMENTS
PLAN
Items 【Alternative(1)】:Proposed Alternative of This Project (Curve Tunnel) 【Alternative(2)】:Alternative of Data Collection Survey(Straight Tunnel) Drivability Tunnel alignment is S-shaped curve. △ Tunnel alignment is Straight. ○ Vertical Grade Vertical grade is looser than "alternative (2)".(i=3.2%) ○ Vertical grade is steep. (i=3.5%) ○ Construction Difficulty(Tunnel)
Constructability of tunnel is better than “Alternative (2)” as the tunnel alignment pass through hard rock bed. ○ Construction of tunnel is difficult because the tunnel alignment pass
through residual soil layer of basin in east area of tunnel. △
Affected Houses Number of relocated house is about half of "Alternative (2)" ○ Maximum number of relocated house is about 27. △ Cost (Ratio) 1.00 ○ 1.40 △ Construction Period 42 months ○ 59 months △ Ranking Evaluation Vertical grade, construction difficulty, affected house, construction
cost and period are better than “Alternative (2)”. Traffic accident risk is lower than “Alternative (2)”.
1 Drivability is better than “Alternative (1)”. Traffic accident risk is high. 2
<To Naubise>
<To Kathmandu>
Alternative (2):Straight Tunnel (previous) Total Length: 4.6m Tunnel: 2.35km (i=3.5%) Earth : 2.25km
Alternative (1): Curve Tunnel (proposed) Total Length:5.06km Tunnel: 2.45km (i=3.22%) Earth : 2.61km

8-15
FIGURE 8.4-1 HORIZONTAL AND VERTICAL ALIGNMENT OF SELECTED ALIGNMENT (TUNNEL AND APPROACH ROAD)
