cs 6401 network traffic characteristics outline motivation self-similarity ethernet traffic wan...
Post on 22-Dec-2015
226 views
TRANSCRIPT
CS 640 1
Network Traffic Characteristics
OutlineMotivationSelf-similarityEthernet trafficWAN trafficWeb traffic
CS 640 2
Motivation for Network Traffic Study
• Understanding network traffic behavior is essential for all aspects of network design and operation– Component design
– Protocol design
– Provisioning
– Management
– Modeling and simulation
CS 640 3
Literature and Today’s Focus
• W. Leland, M. Taqqu, W. Willinger, D. Wilson, On the Self-Similar Nature of Ethernet Traffic, IEEE/ACM TON, 1994.– Baker Award winner
• V. Paxson, S. Floyd, Wide-Area Traffic: The Failure of Poisson Modeling, IEEE/ACM TON, 1995.
• M. Crovella, A. Bestavros, Self-Similarity in World Wide Web Traffic: Evidence and Possible Causes, IEEE/ACM TON, 1997.
CS 640 4
In the Past…
• Traffic modeling in the world of telephony was the basis for initial network models– Assumed Poisson arrival process
– Assumed Poisson call duration
– Well established queuing literature based on these assumptions
– Enabled very successful engineering of telephone networks• “Engineering for Mother’s Day”
CS 640 5
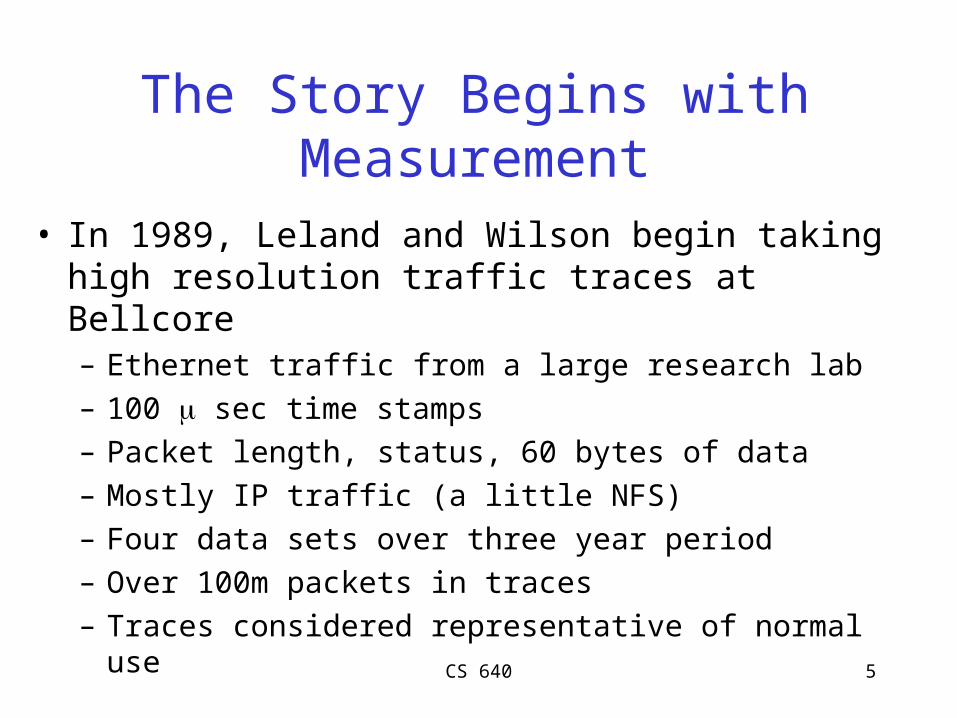
The Story Begins with Measurement
• In 1989, Leland and Wilson begin taking high resolution traffic traces at Bellcore – Ethernet traffic from a large research lab
– 100 sec time stamps
– Packet length, status, 60 bytes of data
– Mostly IP traffic (a little NFS)
– Four data sets over three year period
– Over 100m packets in traces
– Traces considered representative of normal use
CS 640 6
Fractals
CS 640 7
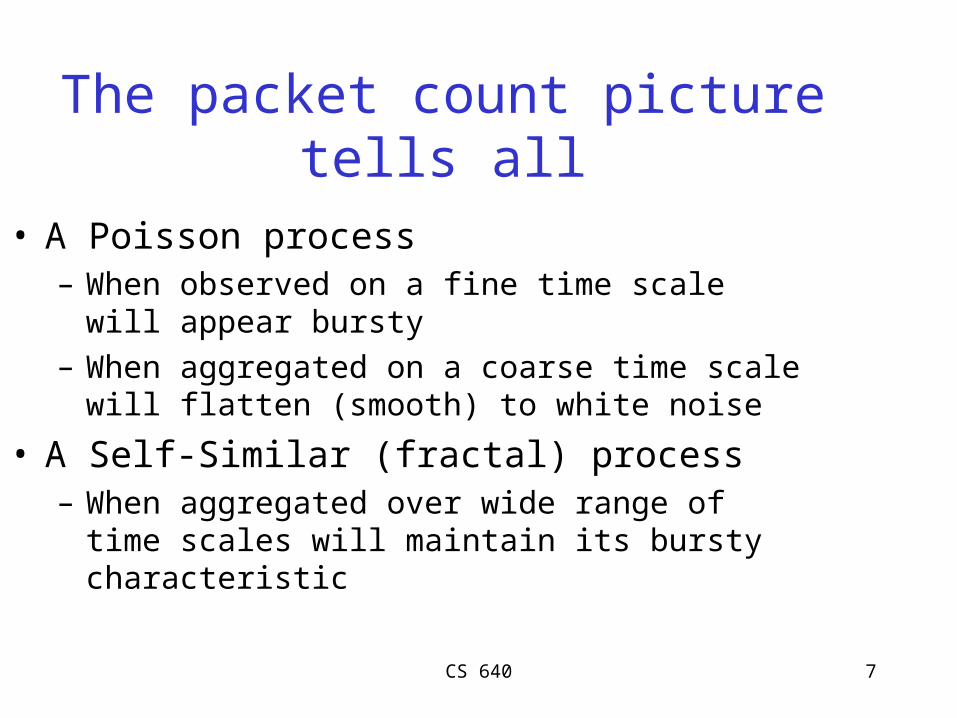
The packet count picture tells all
• A Poisson process – When observed on a fine time scale will appear bursty
– When aggregated on a coarse time scale will flatten (smooth) to white noise
• A Self-Similar (fractal) process– When aggregated over wide range of time scales will
maintain its bursty characteristic
CS 640 8
• Self-similarity manifests itself in several equivalent fashions:– Slowly decaying variance
– Long range dependence
– Non-degenerate autocorrelations
– Hurst effect
Self-similarity: manifestations
CS 640 9
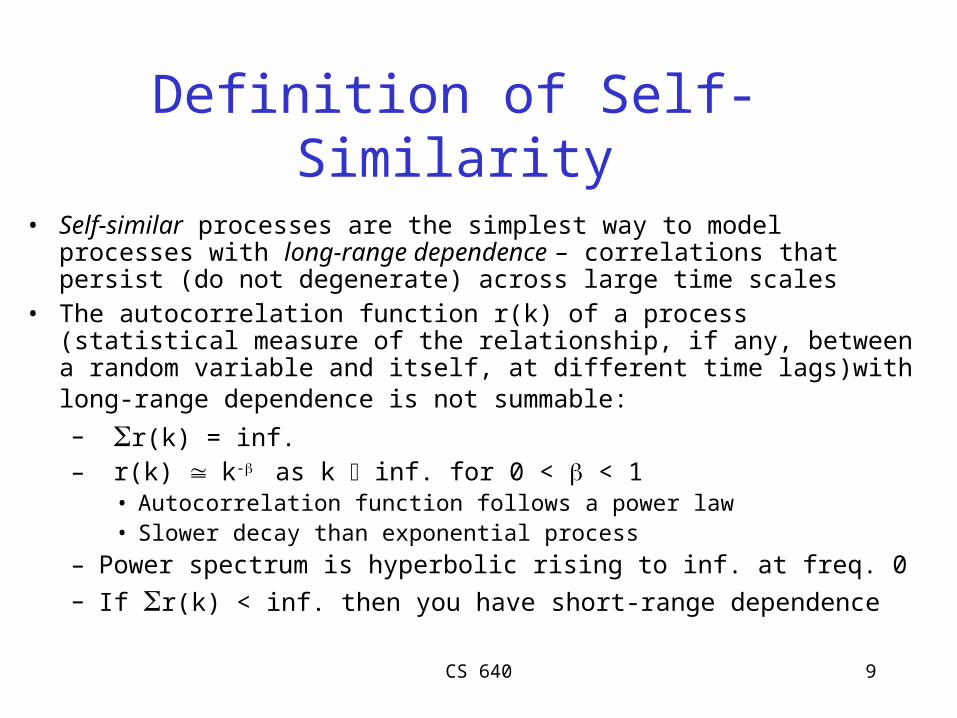
Definition of Self-Similarity
• Self-similar processes are the simplest way to model processes with long-range dependence – correlations that persist (do not degenerate) across large time scales
• The autocorrelation function r(k) of a process (statistical measure of the relationship, if any, between a random variable and itself, at different time lags)with long-range dependence is not summable: – r(k) = inf.– r(k) k- as k inf. for 0 < < 1
• Autocorrelation function follows a power law• Slower decay than exponential process
– Power spectrum is hyperbolic rising to inf. at freq. 0– If r(k) < inf. then you have short-range dependence
CS 640 10
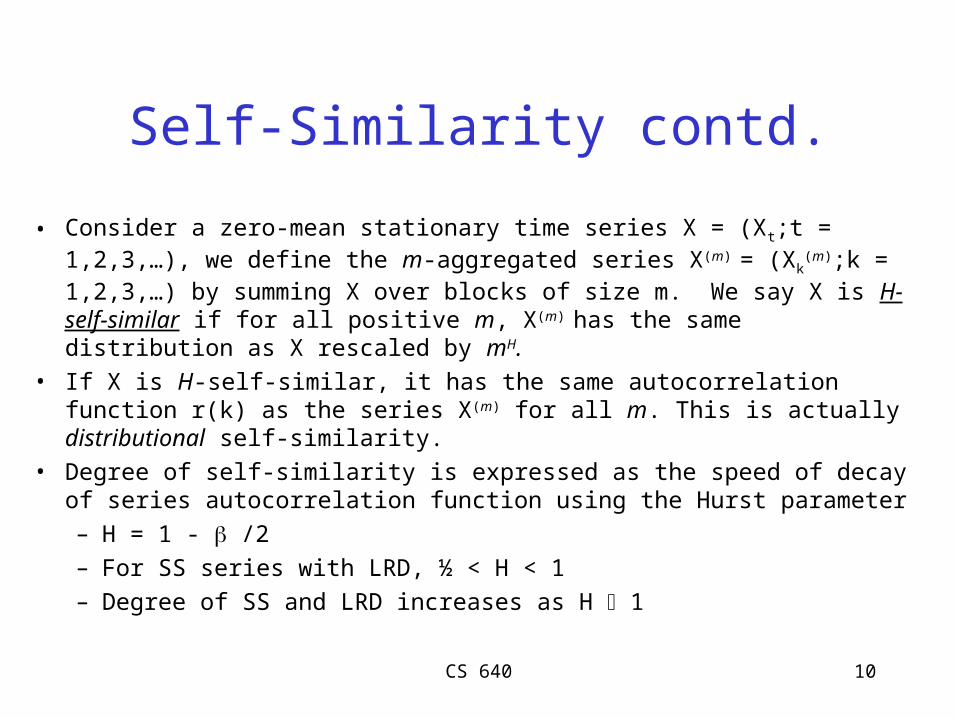
Self-Similarity contd.
• Consider a zero-mean stationary time series X = (Xt;t = 1,2,3,…), we define the m-aggregated series X(m) = (Xk
(m);k = 1,2,3,…) by summing X over blocks of size m. We say X is H-self-similar if for all positive m, X(m) has the same distribution as X rescaled by mH.
• If X is H-self-similar, it has the same autocorrelation function r(k) as the series X(m) for all m. This is actually distributional self-similarity.
• Degree of self-similarity is expressed as the speed of decay of series autocorrelation function using the Hurst parameter
– H = 1 - /2
– For SS series with LRD, ½ < H < 1
– Degree of SS and LRD increases as H 1
CS 640 11
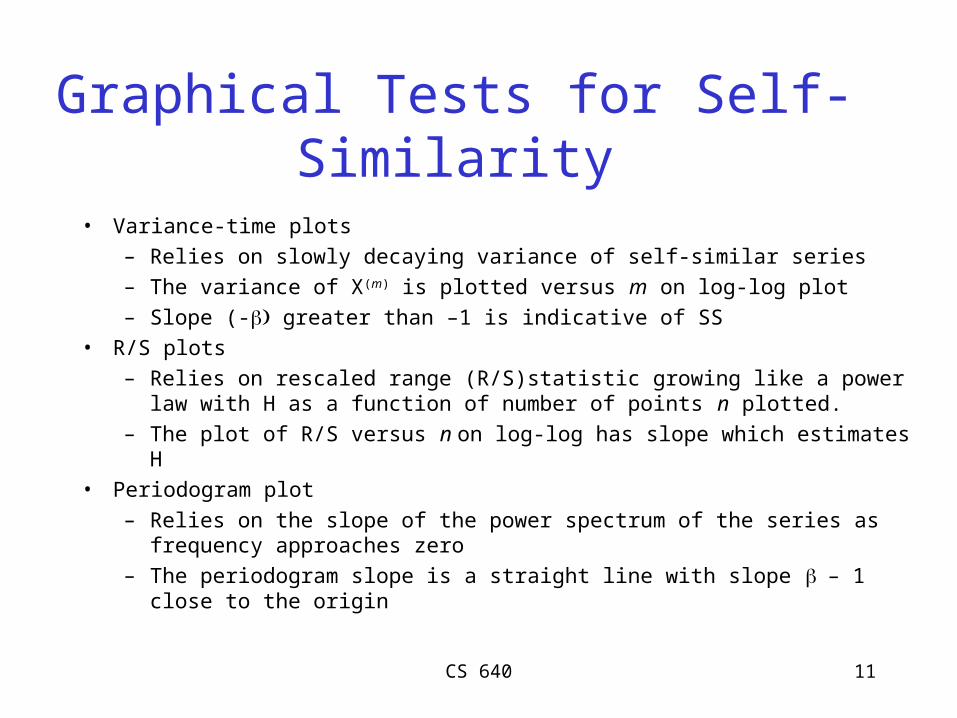
Graphical Tests for Self-Similarity
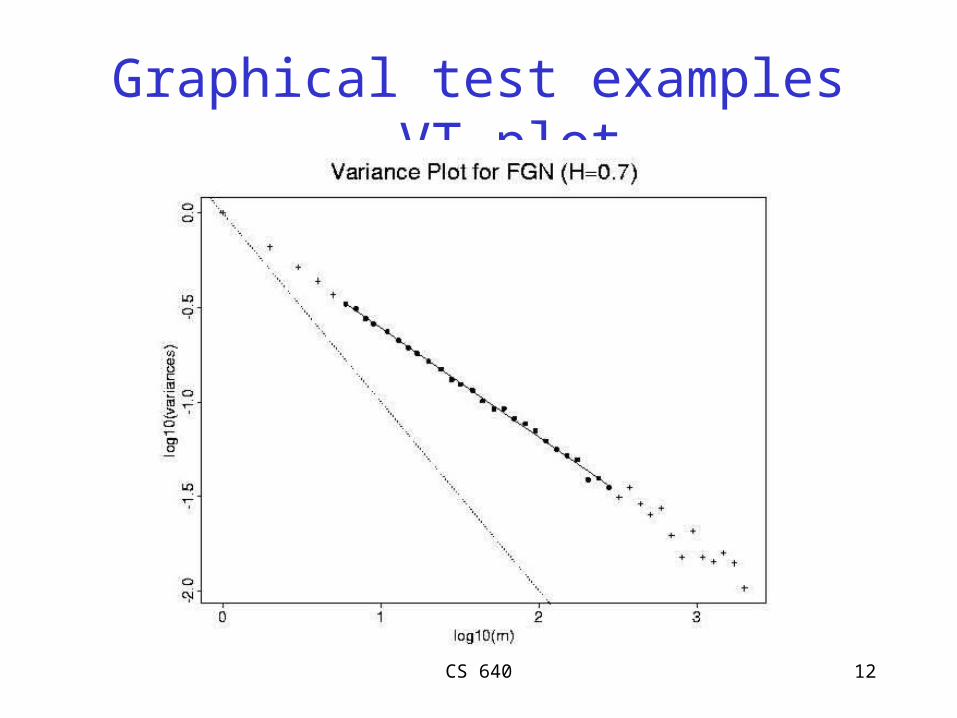
• Variance-time plots
– Relies on slowly decaying variance of self-similar series
– The variance of X(m) is plotted versus m on log-log plot
– Slope (- greater than –1 is indicative of SS
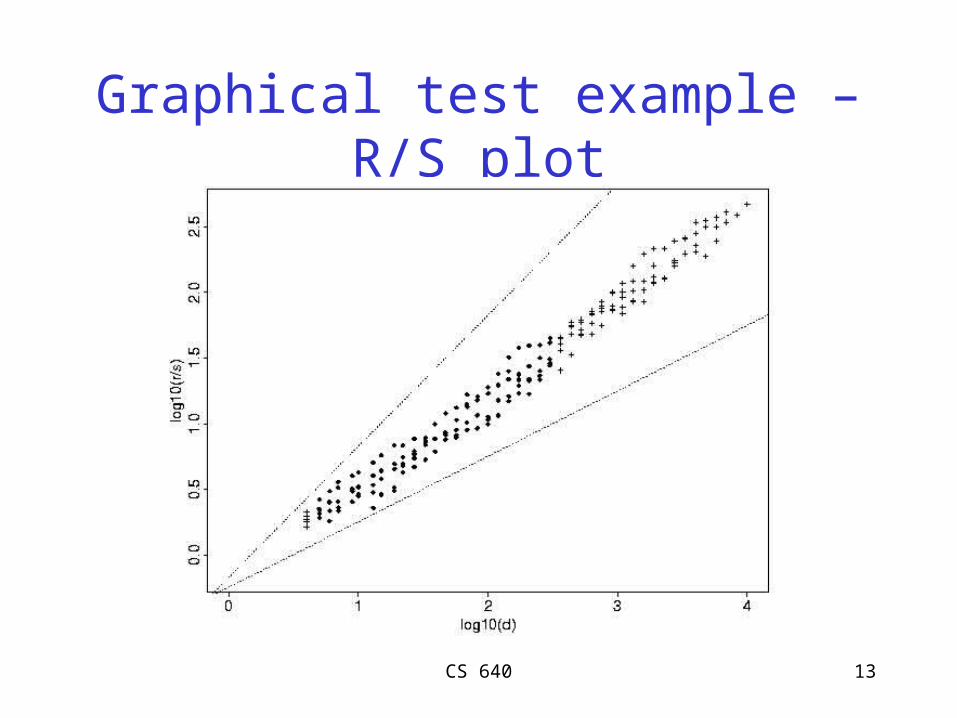
• R/S plots
– Relies on rescaled range (R/S)statistic growing like a power law with H as a function of number of points n plotted.
– The plot of R/S versus n on log-log has slope which estimates H
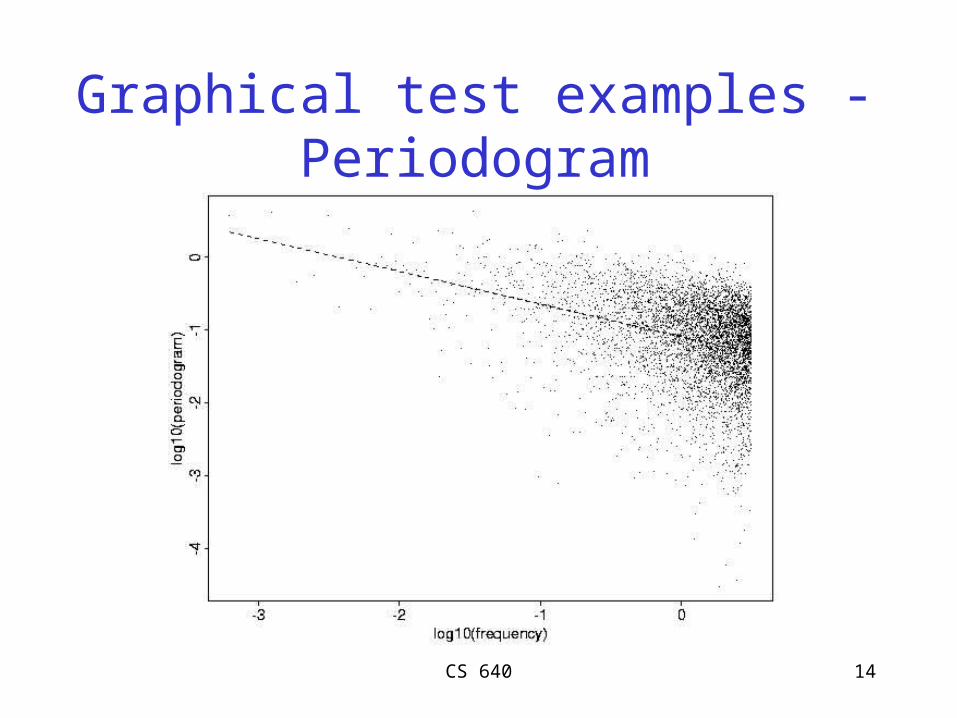
• Periodogram plot
– Relies on the slope of the power spectrum of the series as frequency approaches zero
– The periodogram slope is a straight line with slope – 1 close to the origin
CS 640 12
Graphical test examples – VT plot
CS 640 13
Graphical test example – R/S plot
CS 640 14
Graphical test examples - Periodogram
CS 640 15
Non-Graphical Self-Similarity Test
• Whittle’s MLE Procedure– Provides confidence intervals for estimation of H
– Requires an underlying stochastic process for estimate• Typical examples are FGN and FARIMA
• FGN assumes no SRD
CS 640 16
Analysis of Ethernet Traffic
• Analysis of traffic logs from perspective of packets/time unit found H to be between 0.8 and 0.95.– Aggregations over many orders of magnitude
– Effects seem to increase over time
– Initial looks at external traffic pointed to similar behavior
• Paper also discusses engineering implications of these results – Burstiness
– Synthetic traffic generation
CS 640 17
Major Results of LTWW94
• First use of VERY large measurements in network research
• Very high degree of statistical rigor brought to bare on the problem
• Blew away prior notions of network traffic behavior– Ethernet packet traffic is self-similar
• Led to ON/OFF model of network traffic [WTSW97]
CS 640 18
What about wide area traffic?
• Paxson and Floyd evaluated 24 traces of wide-area network traffic– Traces included both Bellcore traces and five other sites taken
between ’89 and ‘95
– Focus was on both packet and session behavior• TELNET and FTP were applications considered
– Millions of packets and sessions analyzed
CS 640 19
TCP Connection Interarrivals
• The behavior analyzed was TCP connection start times– Dominated by diurnal traffic cycle– A simple statistical test was developed to assess accuracy of
Poisson assumption• Exponential distribution of interarrivals• Independence of interarrivals
– TELNET and FTP connection interarrivals are well modeled by a Poisson process
• Evaluation over 1 hour and 10 minute periods
– Other applications (NNTP, SMTP, WWW, FTP DATA) are not well modeled by Poisson
CS 640 20
TELNET Packet Interarrivals
• The interarrival times of TELNET originator’s packets was analyzed.– Process was shown to be heavy-tailed
• P[X > x] ~ x- as x inf. and 0 < < 2• Simplest heavy-tailed distribution is the Pareto which is hyperbolic
over its entire range– p(x) = kx – , k > 0, x >=k– If < 2, the distribution has infinite variance– If < 1, the distribution has infinite mean– It’s all about the tail!
– Variance-Time plots indicate self-similarity
CS 640 21
TELNET Session Size (packets)
• Size of TELNET session measured by number of originator packets transferred– Log-normal distribution was good model for session size in
packets
– Log-extreme has been used to model session size in bytes in prior work
• Putting this together with model for arrival processes results in a well fitting model for TELNET traffic
CS 640 22
FTPDATA Analysis
• FTPDATA refers to data transferred after FTP session start– Packet arrivals within a connection are not treated
– Spacing between DATA connections is shown to be heavy tailed
• Bimodal (due to mget) and can be approximated by log-normal distribution
– Bytes transferred• Very heavy tailed characteristic
• Most bytes transferred are contained in a few transfers
CS 640 23
Self-Similarity of WAN Traffic
• Variance-time plots for packet arrivals for all applications indicate WAN traffic is consistent with self-similarity– The authors were not able to develop a single Hurst
parameter to characterize WAN traffic
CS 640 24
Major Results of PF95
• Verify that TCP session arrivals are well modeled by a Poisson process
• Showed that a number of WAN characteristics were well modeled by heavy tailed distributions
• Establish that packet arrival process for two typical applications (TELNET, FTP) as well as aggregate traffic is self-similar
• Provide further statistical methods for generating self-similar traffic
CS 640 25
What about WWW traffic?
• Crovella and Bestavros analyze WWW logs collected at clients over a 1.5 month period– First WWW client study
– Instrumented MOSAIC• ~600 students
• ~130K files transferred
• ~2.7GB data transferred
CS 640 26
Self-Similar Aspects of Web traffic
• One difficulty in the analysis was finding stationary, busy periods– A number of candidate hours were found
• All four tests for self-similarity were employed– 0.7 < H < 0.8
CS 640 27
Explaining Self-Similarity
• Consider a set of processes which are either ON or OFF– The distribution of ON and OFF times are heavy tailed
12
– The aggregation of these processes leads to a self-similar process
• H = (3 - min 12)/2 [WTSW97]
• So, how do we get heavy tailed ON or OFF times?
CS 640 28
Heavy Tailed ON Times and File Sizes
• Analysis of client logs showed that ON times were, in fact, heavy tailed– ~ 1.2
– Over about 3 orders of magnitude
• This lead to the analysis of underlying file sizes– ~ 1.1
– Over about 4 orders of magnitude
– Similar to FTP traffic
• Files available from UNIX file systems are typically heavy tailed
CS 640 29
Heavy Tailed OFF times
• Analysis of OFF times showed that they are also heavy tailed– ~ 1.5
• Distinction between Active and Passive OFF times– Inter vs. Intra click OFF times
• Thus, ON times are more likely to be cause of self-similarity
CS 640 30
Major Results of CB97
• Established that WWW traffic was self-similar• Modeled a number of different WWW characteristics
(focus on the tail)• Provide an explanation for self-similarity of WWW
traffic based on underlying file size distribution
CS 640 31
Where are we now?
• There is no mechanistic model for Internet traffic– Topology?
– Routing?
• People want to blame the protocols for observed behavior• Multiresolution analysis may provide a means for better
models• Many people (vendors) chose to ignore self-similarity• Lots of opportunity!!