chapter 5: results and discussion (part iv) s …opus.bath.ac.uk/44293/5/chapter_5.pdf · s-caged...
TRANSCRIPT

145
CHAPTER 5: RESULTS AND DISCUSSION (PART IV)
S-caged thiosemicarbazone iron chelators
5.1. Introduction
Since the discovery of 3-AP (13, Figure 5.1) and the link between its iron-chelating and
potent anti-proliferative activities, a number of novel, lipophilic ICs have been
synthesised based on the thiosemicarbazone backbone. An example is the di-2-pyridyl
ketone thiosemicarbazone (DpT) series of ICs (see Figure 1.14,) which were developed
by Richardson and colleagues who subsequently reported their potent cytotoxic
activity.[86]. Compound Dp44mT (15a, Figure 5.1) was found to possess the most potent
anti-proliferative activity across a range of tumour cell lines, with an IC50 of 0.03 M in
SK-N-MC neuroepithelioma cells [179] compared to 0.3 M for NIH and 0.26 M for 3-AP.
Significantly, Dp44mT has been found to possess a degree of selective antitumour
activity, as its antiproliferative effects are considerably lower in certain non-tumourigenic
or ‘normal’ cell lines, such as MRC-5 fibroblasts. It was also reported that 15a was
active against etoposide-resistant cell lines, and was in fact more active in vinblastine-
resistant tumours compared to vinblastine-sensitive cells, thus demonstrating the
potential that IC-based chemotherapy could have in overcoming resistance to
conventional cytotoxics.[180] Studies on the in vivo administration of Dp44mT to mice
have shown marked antitumour efficacy, and although generally well-tolerated, cardiac
fibrosis was observed with higher doses.
Following on from the DpT series of compounds, the BpT series of ICs were developed
where the non-coordinating pyridyl moiety on the molecule is replaced with a phenyl
ring, which would further increase the lipophilicity of the molecule. It was also
postulated that by replacing the electron-withdrawing pyridyl group with a phenyl group,
Figure 5.1.
3-AP (Triapine®, 13) and
Dp44mT (15a): two examples
of thiosemicarbazone ICs.
13
15a

146
the redox-potential of the Fe-complex may be reduced, which would thus enhance the
extent of redox-cycling and increase the cytotoxicity of the compound.[87] It was found
that these compounds, known as the 2-benzoylpyridine thiosemicarbazones (BpT)
possessed higher cytotoxicity than their DpT counterparts, with Bp4eT, 16d eliciting the
most potent effect with an IC50 of 2 nM. As with the DpT
series, the antiproliferative effects of the BpT series were
found to be selective for cancer cells over ‘normal’ cell
lines, and a recent in vivo study with Bp44mT has shown
potent anti-tumour efficacy when administered orally to
mice.[181] Significantly, the cardiac toxicity associated with
Dp44mT was not observed with Bp4eT, although mild
hepatotoxicity was observed.
The significant toxicity observed with 3-AP (Triapine®) during clinical trials as an anti-
tumour agent was a major contributing factor for its perceived clinical failure, and despite
the promising in vivo results observed with 15a and 16d, adverse effects resulting from
iron depletion in healthy tissue remains a potential stumbling block in the development
of these potent iron chelators.
The development of caged thiosemicarbazones represents a novel strategy to attenuate
the potent cytotoxicity of compounds such as Dp44mT, so that the desired biological
effects are harnessed to achieve anti-proliferative activity in more highly targeted
fashion. This concept bears similarities to PDT, where selective exposure of diseased
tissue to a potent photosensitiser can easily be achieved by an external light source.
CICs offer a similar therapeutic strategy, which has potential applications in the
treatment of skin cancers and other dermatological disease states such as psoriasis.
Figure 5.2.
Structure of Bp4eT 16d
16d

147
5.2. Synthesis of S-caged DpT iron chelators
As the DpT series of ICs do not possess an oxygen donor atom, attachment of a PRPG
at either nitrogen or sulfur is necessary to furnish a thiosemicarbazone-CIC that is
temporarily blocked from binding to iron. It has already been shown that sulfur-
containing compounds which possess a thione group can undergo S-alkylation with soft
electrophiles as illustrated by the S-methylation of 167 to give 168 (Scheme 5.1).[182]
Attachment of the NPE caging group to the thioamide sulfur was therefore considered in
to be a feasible synthetic strategy.
Synthesis of the DpT compounds 12a-c was achieved by condensation of di-2-pyridyl
ketone (169) with the corresponding N4-substituted thiosemicarbazide, or in the case of
15c, thiobenzhydrazide 59 as shown in Scheme 5.2. Isolation of the pure compounds
was accomplished by recrystallisation from EtOH or aqueous EtOH to give 15a-c in 34-
63% yield.
When these conditions were employed for the 4-ethyl-3-thiosemicarbazide however, no
reaction was observed to take place and compound 15d was not observed by TLC. It
Name R Rx. Yield
15a Dp44mT NMe2 a 34%
15b Dp4pT NHPh b 63%
15c Dp4bT Ph c 50%
15d Dp4Et NHEt d No reaction
Scheme 5.2. Preparation of DpT iron chelators from the corresponding thiosemicarbazides. Reagents and
conditions: a. 4,4-dimethyl-3-thiosemicarbazide, EtOH, reflux, overnight; b. 4-phenyl-3-thiosemicarbazide,
EtOH, reflux, 7 h; c. 59, EtOH, reflux, overnight; d. 4-ethyl-3-thiosemicarbazide, EtOH, overnight.
Scheme 5.1. S-alkylation of thiosemicarbazide derivative 167 as described by Ouyang et al.[182]
Reagents and conditions: MeI, acetone, reflux, 4 h, 95%.
168
167
169
15a-c
Rx. = Reaction conditions. See below.
148
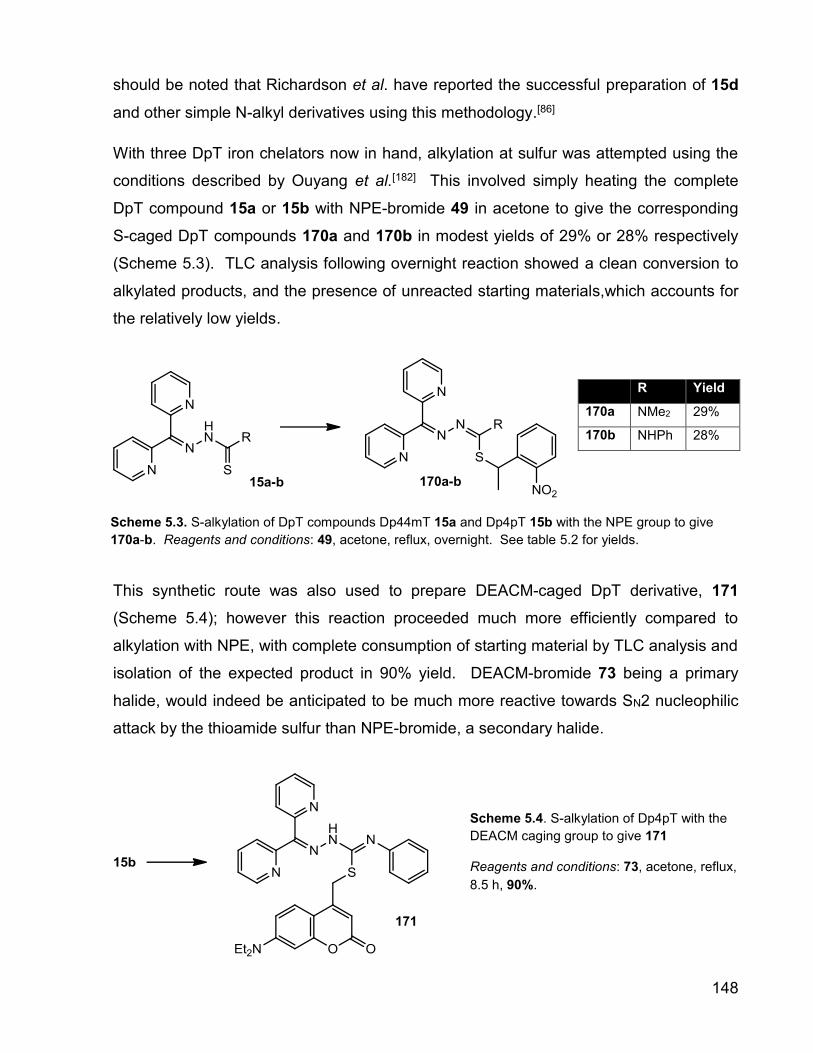
should be noted that Richardson et al. have reported the successful preparation of 15d
and other simple N-alkyl derivatives using this methodology.[86]
With three DpT iron chelators now in hand, alkylation at sulfur was attempted using the
conditions described by Ouyang et al.[182] This involved simply heating the complete
DpT compound 15a or 15b with NPE-bromide 49 in acetone to give the corresponding
S-caged DpT compounds 170a and 170b in modest yields of 29% or 28% respectively
(Scheme 5.3). TLC analysis following overnight reaction showed a clean conversion to
alkylated products, and the presence of unreacted starting materials,which accounts for
the relatively low yields.
This synthetic route was also used to prepare DEACM-caged DpT derivative, 171
(Scheme 5.4); however this reaction proceeded much more efficiently compared to
alkylation with NPE, with complete consumption of starting material by TLC analysis and
isolation of the expected product in 90% yield. DEACM-bromide 73 being a primary
halide, would indeed be anticipated to be much more reactive towards SN2 nucleophilic
attack by the thioamide sulfur than NPE-bromide, a secondary halide.
R Yield
170a NMe2 29%
170b NHPh 28%
Scheme 5.3. S-alkylation of DpT compounds Dp44mT 15a and Dp4pT 15b with the NPE group to give
170a-b. Reagents and conditions: 49, acetone, reflux, overnight. See table 5.2 for yields.
Scheme 5.4. S-alkylation of Dp4pT with the
DEACM caging group to give 171
Reagents and conditions: 73, acetone, reflux,
8.5 h, 90%.
15a-b
170a-b
171

149
5.3. Attempted synthesis of Bp4eT
As discussed above, efforts to prepare the 4-ethyl DpT derivative (13d) as shown in
Scheme 5.2 were unsuccessful, and when 4-ethylthiosemicarbazide was instead heated
with 2-benzoylpyridine 172 in an attempt to give Bp4eT (16d, Scheme 5.5), the same
result was observed and no reaction was found to occur by TLC.
It was later discovered that Richardson and colleagues describe a separate set of
synthetic conditions to prepare the BpT series of compounds, which differs slightly from
the method used to prepare the DpT iron chelators.[87] These included the use of a
catalytic amount of acetic acid, and addition of the thiosemicarbazide as an aqueous
solution instead of as a dry powder. When these conditions were employed, TLC
analysis showed a small degree of reaction progression; however the expected product
was only isolated in 5% yield (Scheme 5.6).
Although it is evident that the addition of AcOH as a catalyst is helpful, its specific role in
this reaction is not currently completely understood. It is probable that it acts to
protonate the hydroxyl anion on the tetrahedral intermediate which is formed following
Scheme 5.5. Attempted synthesis of Bp4eT 16d. Reagents and conditions: 4-ethyl-3-thiosemicarbazide,
EtOH, reflux, 18 h.
Scheme 5.6. Preparation of Bp4eT 16d using revised conditions. Reagents and conditions: 4-ethyl-3-
thiosemicarbazide, AcOH, EtOH/H2O (1:1), reflux, overnight, 5%.
172
16d
172
16d

150
nucleophilic attack by the hydrazide nitrogen, thus accelerating the elimination of water
to give the Schiff base (Scheme 5.7 shows an example). It is unclear however why an
acid catalyst is required for this reaction, whereas condensation with the other
thiosemicarbazides occurs without the need of an acid catalyst.
Doubling the amount of acetic acid or extending the reaction time made no difference to
the reaction outcome according to TLC analysis. It was thought that removing water
from the reaction medium might help to drive the reaction forward based on the principle
that water is actually generated by condensation of the thiosemicarbazide and
diarylketone. However, when water was omitted from the reaction above, and molecular
sieves added to remove water generated from the reaction, there was again no
improvement seen by TLC analysis.
The fact that condensation of an arylketone with other substituted thiosemicarbazides
had been found to proceed without any significant problems suggested that the 4-ethyl
thiosemicarbazide derivative 173 or other simple mono-N-alkyl derivatives, might be
peculiarly unreactive to simple condensation. An alternative strategy therefore was
considered, whereby the thiosemicarbazide 173 was ‘caged’ with the NPE group prior to
condensation with arylketone 172, to give the final desired Schiff base. S-alkylation of
thiosemicarbazide 173 was therefore attempted using the conditions described
Scheme 5.7. Mechanism for the condensation of a thiosemicarbazide with diarylketone 172, and its
facilitation by an acid catalyst (H+)
172

151
previously; however, even though the expected product 174 could be identified by NMR
analysis, a mixture of compounds was obtained, including a considerable amount of
unchanged starting material, which could not be separated by column chromatography.
When the reaction was repeated using another higher boiling polar solvent, acetonitrile,
no improvement in conversion was apparent by TLC analysis.
5.4. Fe-complex experiments
With the S-caged DpT compounds 170a-b in hand, it was hoped that these compounds
would not form complexes when mixed with an iron salt. To demonstrate that iron
chelating activity is abolished in the S-caged compounds, an iron complex with the
parental chelator Dp44mT (15a) was therefore first generated as a control according to
the method reported by Richardson (Scheme 5.9).[86]
Scheme 5.8.
S-alkylation of thiosemicarbazide
173, with NPE bromide
Reagents and conditions:
49, acetone, reflux, 48 h, mixture of
compounds.
Scheme 5.9. Preparation of the iron-complex [Fe(Dp44mT)2] ClO4 xH2O. Reagents and conditions:
Fe(ClO4)3 xH2O, Et3N, EtOH, reflux, 25 min.
173
174
15a
175

152
The UV absorbance spectra of the isolated complex 175, and Dp44mT itself (15a) was
measured at a concentration of 20 M in EtOH (Figure 5.3, A) The S-caged Dp44mT
compound 170a, was subjected to the same conditions as shown in Scheme 5.9, and
the UV spectra of the reaction mixture was also measured (Figure 5.3, B).
It can be seen that the uncaged IC 15a undergoes a considerable bathochromic shift
upon complexation with iron, with the observed max value for the Dp44mT-Fe complex
being consistent with that stated in the literature.[86] The S-caged compound appears to
have the same absorption profile at wavelengths above 320 nm both in the absence and
presence of iron, however it was surprising to observe a dramatic increase in absorption
around 270 nm when the caged compound was mixed with iron. Based on these results
alone it is difficult to account for this observation, although weak complexation of iron in a
bidentate fashion through the pyridyl and imine nitrogen donor atoms might be
responsible. However complexation with iron for Dp44mT appears to red-shift the
absorption maxima (as seen in A), and this is not observed in figure B for the caged
compound, rather the intensity of absorption is simply increased. Further work to
elucidate this phenomenon is therefore required.
200.0 220 240 260 280 300 320 340 360 380 400 420 440 460 480 500.0
-0.10
0.0
0.1
0.2
0.3
0.4
0.5
0.6
0.7
0.8
0.9
1.0
1.1
1.2
1.3
1.4
1.50
nm
A
Dp44mT (λ max = 333.0)
Dp44mT + Fe (λ max = 393.6)
200.0 220 240 260 280 300 320 340 360 380 400.0
-0.10
0.0
0.1
0.2
0.3
0.4
0.5
0.6
0.7
0.8
0.9
1.0
1.1
1.2
1.3
1.4
1.50
nm
A
NPE-Dp44mT ( λmax = 269.4 nm)
NPE-Dp44mT + Fe (λmax = 337.4 nm)
Figure 5.3. UV absorption spectra of ‘naked’ Dp44mT and its iron complex (A) and the corresponding
NPE-caged compound 170a (B).
A B

153
5.5. Decaging experiments
5.1. UV absorption spectra
The UV absorbance profile for the NPE and DEACM-caged derivatives of Dp4pT (170b
and 171 respectively) is shown in Figure 5.4. As one would expect, consistent with other
DEACM-caged compounds the CIC 171 displays a high level of absorption in the near-
UV region compared to the NPE analogue; however both compounds appear to absorb
comfortably within the UVA region, as does the NPE-S-caged Dp44mT derivative 170a
(not shown).
R = NPE (170b)
R = DEACM (171)
Figure 5.4. UV absorbance spectra of the NPE and DEACM-caged derivatives of Dp4pT in EtOH.

154
5.2. Single dose UVA decaging experiments
The uncaging profile of NPE-caged Dp4pT 170b is shown below in Figure 5.5. It is
apparent that at a dose of 250 kJ/m2, the compound only undergoes partial photolysis
(B); however the expected iron chelator (C) and NPK photofragment (D) appear to have
been released as anticipated. This is confirmed by co-injection of the irradiated sample
with Dp4pT and NPK (E and F respectively). Although this compound has an absorption
maxima within the UVA range at 345 nm, the level of absorption at this wavelength is
relatively modest ( = 11086 L mol-1 cm-1 at 345 nm).
6.00 7.00 8.00 9.00 10.00 11.00
min
7.8
00
9.2
67
9.6
83
WVL:280 nm
0.0 2.0 4.0 6.0 8.0 10.0 12.0 14.0 16.0 18.0
min
9.6
75
WVL:280 nm
0.0 2.0 4.0 6.0 8.0 10.0 12.0 14.0 16.0 18.0
min
9.3
08
WVL:280 nm
0.0 2.0 4.0 6.0 8.0 10.0 12.0 14.0 16.0 18.0
min
7.7
58
WVL:280 nm
Figure 5.5. HPLC chromatograms of NPE-Dp4pT 170b and its related photoproducts, depicting the
caged compound (A) and the UVA irradiated (250 kJ/m2) compound, magnified for clarity (B). Also
shown for reference is the ‘naked’ Dp4pT molecule (C) and NPK (D) as well as co-injection of the
irradiated sample with either Dp4pT (E) or NPK (F).
6.00 7.00 8.00 9.00 10.00 11.00
min
7.7
83
9.2
58
9.6
08
WVL:280 nm
7.00 8.00 9.00 10.00 11.00 12.00
min
9.3
50
9.6
75
WVL:280 nm
A B C
D E F
A

155
The decaging profile of NPE-Dp44mT (170a) is shown in Figure 5.6, where it can be
seen that, in contrast to NPE-Dp4pT, photolysis appears to occur to a much greater
extent, although a small degree of intact CIC appears to remain following irradiation (B).
This observation may be reflective of this compound absorbing more strongly within the
UVA range compared its Dp4pT derivative (max = 337.3 nm, = 20029 L mol-1 cm-1).
The released photoproduct signals are consistent with those of the expected
compounds, namely Dp44mT (C) and NPK (D), which was further confirmed by co-
injection of the irradiated sample and NPK (E). Despite this, the generation of
additional, unexpected photoproducts appears to be evident (B), for example the signal
with an Rt value of 5.02 min which has not been identified.
0.0 2.0 4.0 6.0 8.0 10.0 12.0 14.0 16.0 18.0
min
7.7
58
WVL:280 nm
4.00 5.00 6.00 7.00 8.00 9.00 10.00 11.00 12.00
min
6.4
42
WVL:280 nm
4.00 5.00 6.00 7.00 8.00 9.00 10.00 11.00 12.00
min
6.0
00
WVL:280 nm
2.5 4.0 6.0 8.0 10.0 12.0 14.0 16.0
min
5.0
17
5.9
08
6.2
92
7.6
83
WVL:280 nm
2.5 4.0 6.0 8.0 10.0 12.0 14.0 16.0 18.0
min
5.9
00
7.7
83
WVL:280 nm
A
Figure 5.6. HPLC chromatograms of NPE-Dp44mT 170a and its related photoproducts, depicting the
caged compound (A) and the UVA irradiated (250 kJ/m2) compound (B). Also shown for reference is the
‘naked’ Dp44mT molecule (C) and NPK (D) as well as co-injection of the irradiated sample with NPK (E).
B
A
C
D
A
E

156
Irradiation of the DEACM-caged Dp4pT compound (171) however appears to generate
an array of photoproducts which cannot be identified (Figure 5.7, B), as none of the
signals observed correlate with the ‘naked’ Dp4pT IC 15b, suggesting it is not
photoreleased as anticipated. It is interesting that this is also observed with the
corresponding O-caged DEACM compounds 75 and 78 (see chapter 2) which have
similar HPLC profiles following UVA irradiation.
0.0 2.0 4.0 6.0 8.0 10.0 12.0 14.0 16.0 18.0
min
8.5
67
WVL:280 nm
0.0 2.0 4.0 6.0 8.0 10.0 12.0 14.0 16.0 18.0
min
4.3
17
5.6
58
6.6
08
8.4
58
10
.40
0
WVL:280 nm
0.0 2.0 4.0 6.0 8.0 10.0 12.0 14.0 16.0 18.0
min
9.3
08
WVL:280 nm
A B
A
C
A
Figure 5.7. HPLC chromatograms of DEACM-caged Dp44mT 171 and its related photoproducts,
depicting the caged compound (A) and the UVA irradiated (250 kJ/m2) compound (B). Also shown for
reference is the ‘naked’ Dp4pT molecule (C).

157
5.5. Biological results
Figure 5.8 shows the growth-inhibitory effect of Dp44mT 15a on HaCaT cells when
incubated for 24, 48 or 72 hours at a concentration of 0.1, 0.2 or 0.4 M. Surprisingly,
the toxicity of this compound does not appear to be dose-dependent, and around 50% of
inhibition is achieved with all three concentrations at 72 h. There is however a clear
association between incubation time and antiproliferative effect. These results do
nevertheless demonstrate the potent cytotoxicity of this compound in the HaCaT cell
line, as it is the only compound tested in this study where >50% cellular enzymatic
activity is inhibited at concentrations as low as 0.1 M.
The related compound Dp4pT 15b (Figure 5.9) is also seen to elicit potent growth
inhibition, with >50% cellular enzyme activity abolished at concentrations of 1 M or
below following a 72 h incubation time. This makes it less toxic than the Dp44mT
derivative in the HaCaT cell line, which is consistent with the results reported by
Richardson [86] who describe the Dp44mT derivative being the most potent analogue of
this series in other tumourigenic cells. Unlike Dp44mT however, there is a clear dose-
dependent toxicity profile observed with this compound.
Figure 5.8. MTT assay: toxicity of Dp44mT 15a on HaCaT cells after incubation for 24, 48 or 72 h (n = 3-8)
* p < 0.05, significant difference between value and corresponding untreated control.
Δ p < 0.05, significant difference between value and corresponding treatment at 48 h
§ p < 0.05 significant difference between value and corresponding treatment at 24 h.
Enzymatic activity (%)
24 h 48 h 72 h

158
Given the poor decaging profile seen with NPE-Dp44mT, this compound was not tested
in this cell line; however the toxicity of NPE-Dp4pT (170b) at various concentrations in
the absence and presence of UVA radiation was evaluated (Figure 5.10).
Figure 5.10. MTT assay: toxicity of Dp4pT and its NPE-caged analogue 170b (+/- UVA, 250 kJ/m2) on
HaCaT cells 72 h post-treatment (n = 3).
* p < 0.05, significant difference between value and corresponding untreated control.
# p < 0.05, significant difference between value and corresponding treatment with Dp4pT.
Enzymatic activity (%)
24 h 48 h 72 h
Figure 5.9. MTT assay: toxicity of Dp4pT 15b on HaCaT cells after incubation for 24, 48 or 72 h (n = 3-8)
p < 0.05, significant difference between value and corresponding untreated control.
Δ p < 0.05, significant difference between value and corresponding treatment at 48 h
§ p < 0.05 significant difference between value and corresponding treatment at 24 h.

159
It is evident from these data that at concentrations above 0.2 M, the caged compound
NPE-Dp4pT 170b displays significantly higher cytotoxicity than the ‘naked’ IC molecule
in a highly dose-dependent fashion, and that upon irradiation with a UVA dose of 250
kJ/m2, this toxicity is attenuated and is comparable to that seen with ‘naked’ Dp4pT.
The decaging profile for this compound (Figure 5.5, section 5.4) has shown that this
compound undergoes only partial photolysis at this dose of UVA however, and so the
biological effects seen following irradiation cannot be attributed to that of the Dp4pT
molecule alone.
A very similar biological profile is seen with the ‘naked’ and DEACM-caged Dp4pT
compound 171 (Figure 5.11), where once again the caged compound appears to exert a
higher level of antiproliferative activity than the parent chelator molecule, and toxicity is
diminished upon irradiation with UVA. Given the rather ‘chaotic’ decaging profile of this
compound however (Figure 5.7) it is unclear what photoproducts are released and thus
what may be responsible for this observation.
Figure 5.11. MTT assay: toxicity of Dp4pT, and its DEACM-caged analogue 171 (+/- UVA) on
HaCaT cells at 1.0 M (n = 3).
* p < 0.05, significant difference between value and corresponding untreated control.
Δ p < 0.05, significant difference between value and corresponding treatment at 48 h
§ p < 0.05 significant difference between value and corresponding treatment at 24 h
Enzymatic activity (%)
24 h 48 h 72 h

160
The BrdU assay was performed on the parent iron chelators Dp44mT and Dp4pT (15a
and 15b respectively) with the results shown in Figure 5.12, which shows that a lower
proportion of cells treated with Dp44mT incorporate BrdU compared to Dp4pT. This
suggests that Dp44mT exerts a more potent growth inhibitory effect than Dp4pT, as the
extent of DNA synthesis in Dp44mT-treated cells is almost half that seen for Dp4pT
treated cells. This correlates well with the results seen in the MTT assay, where
Dp44mT appeared to possess a more potent cytotoxic effect in the HaCaT cell line.
0
20
40
60
80
100
Control Dp44mT 0.2 uM Dp44mT 0.4 uM Dp4pT 0.5 uM Dp4pT 1.0 uM
Brd
U +
ve
ce
lls
(%
)
Figure 5.12. BrdU assay: toxicity of 15a-b on HaCaT cells 72 h post treatment (n = 1).