chapter 5 inter-island dispersal of flightless ... · 190 chapter 5 . inter-island dispersal of...
TRANSCRIPT

190
CHAPTER 5
Inter-island dispersal of flightless Bothrometopus huntleyi
(Coleoptera: Curculionidae) from the sub-Antarctic
Prince Edward Island Archipelago
G.C. Grobler1*
, A.D.S. Bastos1,2
, C.T. Chimimba1,3
and S.L. Chown3
1Department of Zoology and Entomology, University of Pretoria, Pretoria 0002 South Africa
2Department of Biological Sciences, University of Cyprus, Nicosia, Cyprus
3Centre for Invasion Biology, Department of Botany and Zoology, Stellenbosch University,
Private Bag X1, Matieland 7602, South Africa
The results presented here have been published in Antarctic Science 23, 225-234 (2011).

191
Abstract: Bothrometopus huntleyi is a flightless weevil endemic to the volcanically-formed
sub-Antarctic Prince Edward Islands archipelago that arose approximately 0.5 million years
ago (m.y.a.). Since emergence, a series of volcanic and glaciation events have occurred on
Marion Island, whilst Prince Edward Island, the second island constituting the archipelago,
has remained largely unaffected by glaciation. Cytochrome oxidase I gene analyses indicate
that major historical dispersal events in this species are linked to the geologically discrete
histories of these islands and underlie the high haplotype diversity (0.995) recovered for the
Prince Edward Islands archipelago. The estimated time to haplotype coalescence of ~0.723
m.y.a. is in keeping with estimated dates of island emergence, and the majority of individuals
appear to have descended from a relict, high-altitude population that is still present on Marion
Island. The first major inter-island dispersal event occurred ~0.507 m.y.a., coinciding with the
oldest dated rocks on Marion Island. Apart from this early inter-island colonisation, only one
other between-island dispersal event was detected. The genetically discrete B. huntleyi
complexes on each of the islands of the Prince Edward Islands archipelago together with the
low levels of inter-island gene flow reaffirm the need to control alien invasive mice, which
are restricted to Marion Island, and which prey on this weevil species.
Key words: mtDNA, COI gene, conservation biogeography, dispersal, invasion biology,
phylogeography

192
Introduction
Bothrometopus huntleyi (Grobler et al. 2011) (Curculionidae: Coleoptera: Hexapoda)
belongs to the Ectemnorhinus group of genera (Kuschel & Chown 1995), also known as the
tribe Ectemnorhinini (Alonso-Zarazaga & Lyal 1999), which is restricted to islands of the
sub-Antarctic South Indian Ocean Province (SIP). This group of weevils comprises eight
genera and 37 flightless species (Kuschel & Chown 1995, Grobler et al. 2006, Grobler et al.
2011), of which seven occur on the Prince Edward Islands. Of these seven species, five,
including B. huntleyi, are endemic to the archipelago, with Bothrometopus randi (Jeannel
1953) also being found on the Crozet archipelago to the east, and Palirhoeus eatoni (C.O.
Waterhouse 1876) occurring on all SIP islands (Chown & Klok 2001, Kuschel & Chown
1995). Recent molecular studies both of this group of weevils (Grobler et al. 2006) and of
other taxa in the region (e.g. Stevens et al. 2006, Myburgh et al. 2007) have suggested that
relationships among species, within and among islands and archipelagos (including the Prince
Edward Island archipelago) may be much more complex than suggested by morphological
analyses. In consequence, it may be argued that the status of B. huntleyi on the Prince Edward
Island archipelago has not been fully resolved, and that it might be expected to show
substantial phylogeographic structure associated with the different histories of the two islands
which lie only 19 km apart. Perhaps most significantly, Marion Island, the larger of the two
Prince Edward Islands, was extensively glaciated whilst the smaller Prince Edward Island
shows no evidence of glaciation (Boelhouwers et al. 2008). McDougall et al. (2001)
suggested that Marion Island had five distinct cold periods and eight volcanic ages, with two
of these accompanying major glaciations (Fig. 1). Although the exact sequence and spatial
extent of volcanic and glacial events is currently the subject of revision, this overall scenario
appears to be robust (Boelhouwers et al. 2008).
In consequence, substantial differences among populations of B. huntleyi on the two
islands might be expected. Such differences would not only be of biogeographic significance
(see e.g. Chown 1992), but would also have substantial conservation implications given the
differences in invasive alien species on the islands, especially the absence of house mice on
Prince Edward Island, which have a dietary preference for weevils on Marion Island (Chown
& Smith 1993). Here we set out to examine the evolutionary dynamics shaping the population
structure of B. huntleyi, which occurs on both islands, is widely distributed across Marion
Island, and has until recently been confounded with B. parvulus (Grobler et al. 2011).

193
Marion Island
Glaciation Volcanic activity (YBP)
(Ages x 103 years)
10 VIII
(23)
50 VII
(69)
81
92 VI
110 V
(141)
156
IV
201
(209)
244 III
(311)
323
II
363
(357)
(395)
413
I
454
(475)
Fig. 1 Correlation of volcanic activity and glaciation on Marion Island. The shaded bars
represent periods of glaciation or volcanic activity with the older events at the bottom of the
figure and the most recent events at the top. This diagram is presented with the permission of
the Geological Magazine and Prof. McDougal (McDougal et al. 2001).
?
?
?

194
Materials and Methods
Systematics and biology
Although the genus Bothrometopus has previously been separated into two distinct
groups, viz. the fasciatus- and gracilipes-groups, which are distinguished by, respectively, the
absence and presence of vaginal spicules (see Dreux & Voisin 1984, 1986, 1987, Kuschel &
Chown 1995 for earlier work on the genus and its now synonymous allies), Grobler et al.
(2011) have called for the re-evaluation of these groups.
Because B. huntleyi was previously not distinguished from the very similar B.
parvulus, and because it is now clear that B. parvulus is restricted to coastal areas of both
islands (Grobler et al. 2011), it can be reasonably assumed, from the previous literature on
habitat use in the group (e.g. Chown 1989), that B. huntleyi predominantly occurs in epilithic
moss cushions from coastal rock faces to high altitude fellfield and polar desert. The larvae
and adults feed on algae, lichens, and bryophytes (Chown 1989, 1992). Individuals may occur
occasionally on Azorella selago, but feed on epiphytic algae and bryophytes, rather than on
the plant itself (Chown 1989, 1992). On both Marion Island and Prince Edward Island, B.
huntleyi shows distinct variation in size, associated both with elevation and habitat type,
although differences among the two islands are not pronounced (Chown 1992, Chown &
Smith 1993, Chown & Klok 2003).
Study sites and sampling
Specimens of B. huntleyi were collected during three consecutive years (April 2001 –
April 2003) from 14 localities from the eastern side of Marion Island (Fig. 2). Due to
restricted access to Prince Edward Island, weevils were only sampled from 5 localities on one
occasion in April 2003 (Fig. 2). For each island, the specimens were collected from a range of
altitudes, and individuals selected for genetic characterisation were chosen to ensure the
broadest possible size and colour variation representation, for each sampling locality. The
geographic coordinates, altitude and weevil size range recorded for each sampling locality are
summarized in Table 1. All specimens were collected by hand and preserved in absolute
ethanol. Bothrometopus brevis (C.O. Waterhouse) from Heard Island was selected as an
outgroup, since it is the closest known sister taxon of B. huntleyi (Grobler et al. 2011: Table
1).

195
Fig. 2 Map indicating flightless weevil (Bothrometopus huntleyi) sampling localities on the
Prince Edward Island Archipelago and that correspond to the geographic coordinates
summarised in Table 1.

196
TABLE 1 Summary of the 19 sampling localities on Marion (MI) and Prince Edward Islands
(PEI) from which the genetically characterised Bothrometopus huntleyi specimens included in
this study were collected.
Island Sampling Locality (a.s.l) Geographic coordinates Number of specimens per
locality (size range in mm)
MI Kildalkey Bay (0 m) S 46º57’38.3’’ E 37º51’22.2’’ 1 (3.92)
MI Ships Cove (0 m) S 46º51’41’’ E 37º50’66’’ 8 (3.31 - 5.00)
MI Trypot Beach (0 m) S 46º53’05.2’’ E 37º52’06’’ 1 (3.30)
MI Stony Ridge (150 m) S 46º54’88.1’’ E 37º51’48.4’’ 1 (4.61)
MI Junior's Kop (200 m) S 46º52.794’ E 37º50.083’ 4 (3.15 - 5.00)
MI Tafelberg (250 m) S 46º53’03.5’’ E 37º48’20.1’’ 1 (3.69)
MI Repetto’s Hill (300 m) S 46º50’35.7’’ E 37º44’21.8’’ 4 (3.36 - 4.77)
MI First Red Hill (400 m) S 46º53.412’ E 37º48.21’ 5 (2.80 - 4.08)
MI Long Ridge South (450 m) S 46º52’45’’ E 37º47’00’’ 2 (3.08 - 5.08)
MI First Red Hill (600 m) S 46º53.647’ E 37º47.208’ 4 (2.96 - 4.72)
MI Halfway Kop (600 m) S 46º54’06’’ E 37º47’83’’ 6 (3.08 - 5.31)
MI Feldmark Plateau (600 m) S 46º56’35’’ E 37º46’10’’ 2 (3.39 - 5.15)
MI Katedraalkrans (800 m) S 46º53.896’ E 37º46.482’ 4 (3.60 - 4.85)
MI Ice Plateau (1000 m) S 46º54.29’ E 37º45.375’ 8 (3.92 - 5.69)
PEI Cave Bay (0 m) S 46º38.752’ E 37º59.780’ 4 (2.46 - 4.62)
PEI (200 m) S 46º38.457’ E 37º58.396’ 5 (3.31 - 4.39)
PEI (400 m) S 46º38.211’ E 37º57.482’ 5 (3.31 - 4.31)
PEI (600 m) S 46º37.533’ E 37º55.985’ 4 (3.54 - 5.00)
PEI TvZB (672 m) S 46º37.590’ E 37º55.891’ 4 (3.54 - 4.46)
a.s.l.: above sea level; TvZB: Samples collected at the top of Van Zinderen Bakker.

197
Genetic characterization
DNA from each individual was extracted from a single leg which, following removal from
ethanol was washed and rehydrated in distilled water for 10 minutes, prior to being frozen in
liquid nitrogen and ground using an Eppendorf micro pestle (Merck, South Africa). DNA was
extracted using the High Pure PCR Template Preparation Kit (Roche Applied Science) using
the supplier’s procedure for the isolation of nucleic acids from mammalian tissue with
modification to the proteinase K tissue lysis incubation step, which was performed for 48 hrs
instead of the recommended 1 hr for mammalian tissue.
COI primers, GF-1858 and GR1-2938 which are specific for weevils from Marion
Island (Grobler et al. 2006) were used to amplify a 1059 bp PCR product under previously
described reaction conditions (Grobler et al. 2006) using a thermal cycling profile that
consisted of an initial denaturation step at 94ºC for 90 s, followed by 40 cycles of 94ºC for 22
s, 46ºC for 30 s and 72ºC for 1 min and concluding with a final extension step of 1 min at
72ºC. PCR products of the correct size were purified directly from the tube using a Roche
High Pure PCR Product Purification Kit (Roche Applied Science). Automated cycle
sequencing with the ABI PRISM Big DyeTM
Terminator version 3.0 (Applied Biosystems)
and two internal primers, GF5-1940 and GR5-2935 (Grobler et al. 2006), in separate
reactions, was performed at an annealing temperature of 46ºC. Sequences were viewed, edited
and aligned in MEGA4 (Tamura et al. 2007), resulting in a homologous dataset 885 bp in
length.
Phylogenetic analyses
Neighbor-Joining (NJ) and Minimum Evolution (ME) algorithms were used to
construct distance trees in MEGA4 (Tamura et al. 2007) and maximum likelihood analyses
were performed in PhyML (Guindon & Gascuel 2003) using the model of sequence evolution
identified as the best-fit model under the Akaike Information Criterion (AIC) in ModelTest
version 3.06 (Posada & Crandall 1998). Nodal support was assessed by 100,000 and 5,000
bootstrap replications, respectively. Maximum parsimony (MP) analyses were performed in
PAUP* v4.0b10 (Swofford 2003). Characters had equal weights in the initial analysis and
were subsequently reweighted using the rescaled consistency index (RCI). Starting trees were
obtained by random stepwise addition of sequences and branch swapping was performed

198
using the tree-bisection-reconnection (TBR) algorithm. Bayesian Inference (BI) using
MrBayes version 3.1 (Huelsenbeck & Ronquist 2001) was performed using priors guided by
the best-fit model and parameters in ModelTest (Posada & Crandall 1998), namely the
HKY85 model (Hasegawa et al. 1985) with the proportion of invariable sites (I) and gamma
distribution shape parameter (Γ) being 0.791 and 1.6671, respectively. The analysis was
initiated with random starting trees and run for 10,000,000 generations with Markov chains
sampled every 2,000 generations. Of the 5000 trees obtained, 1250 were discarded as “burn-
in”. Tracer plots were visually inspected and tracer diagnostics (standard deviation of split
frequencies, effective sample size), as implemented in MrBayes and Tracer v1.4 (Drummond
& Rambaut 2007) were inspected to ensure that stationarity had been reached.
The equality of evolutionary rates between lineages was evaluated using the relative
rate test (Li & Bousquet 1992) in PHYLTEST version 2.0 (Kumar 1996). The likelihood ratio
test (Felsenstein 1981, Felsenstein 1988) was also performed by calculating and comparing
the log likelihood scores with and without the molecular clock enforced. Divergence times
were estimated using the 2.3% nucleotide sequence divergence per million years, estimated
from an arthropod mtDNA survey (Brower 1994) and the appropriate parameter-rich model of
evolution (Papadopoulou et al. 2010) selected under the AIC in ModelTest (Posada and
Crandall 1998). BEAST 1.5.3 (Drummond & Rambaut 2007) was used to obtain an
ultrametric tree using Bayesian MCMC analysis orientated towards rooted, time-measured
phylogenetics. Well supported nodes identified following NJ, ML and BI analyses were
constrained to be monophyletic and the HKY+I+Γ model was enforced using a strict
molecular clock model. The results of two independent runs were merged and analyzed with
Tracer v1.4 and TreeAnnotator v1.4.7 (Drummond & Rambaut 2007).
The program TCS version 1.21 (Clement et al. 2000) was used to generate a haplotype
cladogram displaying the number of base pair differences between haplotypes. TCS version
1.21 (Clement et al. 2000) incorporates the cladogram estimation algorithm described by
Templeton et al. (1992) and provides 95% parsimoniously plausible branch connections
between the different haplotypes.
Mismatch analyses, population expansion and diversity estimates
Pairwise mismatch distributions, where the observed pairwise mismatch distributions
were fitted to a stepwise expansion model by a generalized least square procedure following
Schneider & Excoffier (1999), as implemented in Arlequin version 2.0 (Schneider et al.

199
2000), were generated. A constant size population is expected to show a ragged, multimodal
distribution, while an expanding population is consistent with a smooth unimodal distribution.
In each case, the raggedness index assesses the match of the real data to the model
while the overall validity of the estimated expansion model was tested by comparing the
distribution of the test statistic, SSD (sum of squared differences) between the observed and
the estimated mismatch distribution using a bootstrap approach. Evidence for departure from
the estimated expansion model is given by significant SSD values (Excoffier & Schneider
1999).
The validity of a stepwise expansion model for the data was tested by Monte Carlo
Markov chain simulations (1000 steps) in Arlequin version 2.0 (Schneider et al. 2000). The
time of the main expansion in generations (t) was estimated from the equation τ = 2μt using
the moment estimator of time to the expansion (τ) computed in Arlequin version 2.0
(Schneider et al. 2000) and a mutation rate (μ) of 2.3% nucleotide sequence divergence per
million years for arthropod mtDNA (Brower 1994). As the weevils complete one generation
in one-year (Chown & Scholtz 1989), t could also be used as the time of the main expansion
in years. Arlequin version 2.0 (Schneider et al. 2000) was utilized to estimate the essential
population parameter θ using Watterson’s (1975) estimate, which is based on the number of
segregating sites among the sequences, and Tajima’s (1983) estimate, which is based on the
calculation of the mean number of pairwise differences of the sequences. Tajima’s estimate of
θ puts more weight on ancient mutations and therefore reflects ancient population events (Fu
1997).
Fu’s (1997) FS test of neutrality, as estimated in Arlequin version 2.0 (Schneider et al.
2000), and the R2 test of neutrality (Ramos-Onsins & Rozas 2002), as estimated in DNASP
version 5 (Librado & Rozas 2009), were shown to be powerful tests for detecting recent
population expansions under assumptions of neutrality with R2 showing better results for
small sample sizes and FS for large sample sizes. The R2 statistic is based on the difference
between the number of singleton mutations and the average number of nucleotide differences
among sequences within a population sample (Ramos-Onsins & Rozas 2002). The haplotype
diversity (h) and nucleotide diversity (π) were estimated in DNASP version 5 (Librado &
Rozas 2009).

200
Results
A homologous region of 885 bp corresponding to the 5’ end of the COI gene was generated
for 73 B. huntleyi individuals and two B. brevis outgroup specimens. All sequences have been
deposited in the Genbank database under accession numbers GQ131940-GQ132014. Of the
885 sites characterised, 768 were conserved across all 75 sequences and 82 of the 117
variable sites were parsimony informative. Under the HKY+I+Γ model of sequence evolution,
a transition (ti)/transversion (tv) ratio of 14.5 and base frequencies of A = 0.3069, C = 0.1590,
G = 0.1497 and T = 0.3844 (% AT = 70.2%) were recovered. Third base position
substitutions accounted for 88.03% of the variation with 11.11% and 0.85% being due to first
and second base substitutions, respectively. Mutations at the nucleotide level gave rise to five
non-synonymous amino acid substitutions at codons 4, 191, 219, 238, and 289. Of the 73 B.
huntleyi individuals sequenced, 62 had unique haplotypes corresponding to a haplotype
diversity (h) of 0.995 and a nucleotide diversity (π) of 0.01278 for the Prince Edward Islands
archipelago. When considering each island individually, 43 unique haplotypes were recovered
from the 51 Marion Island specimens sequenced (h = 0.992 and π = 0.01130), whilst for
Prince Edward Island, 19 unique haplotypes were identified from 22 individuals (h = 0.987
and π = 0.00890).
MP analysis recovered 76125 equally parsimonious trees with homoplasy indices of:
CI=0.520; RI=0.827 and RCI=0.430 when characters were assigned equal weights.
Successive weighting with the RCI recovered the same number of equally parsimonious trees
and homoplasy indices of CI=0.699, RI=0.889 and RCI=0.621. All methods of phylogenetic
inference (Fig. 3) revealed the presence of two distinct clades.
Fig. 3 Neighbour-Joining (NJ) tree of Bothrometopus huntleyi from Marion (MI) and Prince
Edward (PEI) Islands and B. brevis outgroup from Heard Island , based on 885 nucleotides of
the mitochondrial cytochrome oxidase I (COI) gene inferred using the HKY85 model of
sequence evolution. The taxon name contains the species designation, sample number, body
length measurement, altitude and/or sampling locality, sex and island of origin. Nodal support
values ≥ 60 obtained from NJ and ML (100,000 and 5,000 bootstrap replications,
respectively) and ≥ 90 from Bayesian Inference (BI) and expressed as a percentage, are
indicated NJ/ML/BI. ‘--’ denotes bootstrap support values below 60 (NJ and ML) and below
90 (BI). (On page 201)

201
98/98/100
B. huntleyi 313-14: 5.00 mm, 600 m, Stones, F, PE
B. huntleyi 162-5: 3.60 mm, 800 m, Katedraakrans, A. selago, M, MI B. huntleyi 141-22: 4.31 mm, 300m, Repetto's Hill, Stones, M, MI
B. huntleyi 128-17: 5.31 mm, 600 m, Halfway Kop, Stones, F, MI B. huntleyi 170-1: 4.64 mm, 600 m, First Red Hill, Stones, F, MI
B. huntleyi 151-8: 5.00 mm, 200 m, Junior's Kop, Stones, F, MI
B. huntleyi 16-43: 4.85 mm, 0 m, Ships Cove, Stones, F, MI
B. huntleyi 16-23: 3.69 mm, 0 m, Ships Cove, Stones, M, MI
B. huntleyi 175-6: 3.92 mm, 400 m, First Red Hill, A. selago, F, MI B. huntleyi 170-18: 2.96 mm, 600 m, First Red Hill, Stones, M, MI
B. huntleyi 200-17: 4.85 mm, 800 m, Katedraalkrans, Stones, F, MI B. huntleyi 170-16: 4.72 mm, 600m, First Red Hill, Stones, M, MI
B. huntleyi 16-22: 3.46 mm, 0 m, Ships Cove, Stones, F, MI B. huntleyi 355-11: 5.08 mm, 450 m, Long Ridge S, Stones, F, MI
B. huntleyi 16-48: 4.08 mm, 0 m, Ships Cove, Stones, F, MI B. huntleyi 170-4: 3.04 mm, 600 m, First Red Hill, Stones, M, MI
B. huntleyi 7-2: 3.30 mm, 0 m, Tripot Beach, Stones, MI B. huntleyi 141-30: 3.85 mm, 300 m, Repetto's Hill, Stones, M, MI B. huntleyi 141-25: 4.77 mm, 300 m, Repetto's Hill, Stones, F, MI
B. huntleyi 151-5: 4.92 mm, 200 m, Junior's Kop, Stones, F, MI B. huntleyi 162-11: 4.64 mm, 800 m, Katedraalkrans, A. selago, F, MI
B. huntleyi 141-27: 3.36 mm, 300 m, Repetto's Hill, Stones, M, MI B. huntleyi 155-25: 4.69 mm, 1000 m, Ice Plateau, Stones, F, MI
B. huntleyi 180-15: 3.04 mm, 400 m, First Red Hill, Stones, M, MI B. huntleyi 128-20: 3.62 mm, 600 m, Halfway Kop, Stones, M, MI
B. huntleyi 175-1: 2.80 mm, 400 m, First Red Hill, A. selago, M, MI B. huntleyi 128-16: 4.01 mm, 600 m, Halfway Kop, Stones, M, MI
B. huntleyi 30-16: 3.69 mm, 250 m, Tafelberg, Stones, MI B. huntleyi 151-21: 3.31 mm, 200 m, Junior's Kop, Stones, F, MI
B. huntleyi 16-12: 5.00 mm, 0 m, Ships Cove, Stones, M, MI B. huntleyi 200-13: 3.85 mm, 800 m, Katedraalkrans, Stones, M, MI
B. huntleyi 128-3: 3.08 mm, 600 m, Halfway Kop, Stones, M, MI B. huntleyi 128-11: 4.46 mm, 600 m, Halfway Kop, Stones, F, MI B. huntleyi 128-1: 4.46 mm, 600 m, Halfway Kop, Stones, F, MI
B. huntleyi 42-34: 4.61 mm, 150 m, Stony Ridge, Stones, MI B. huntleyi 155-30: 5.69 mm, 1000 m, Ice Plateau, Stones, F, MI
B. huntleyi 151-18: 3.15 mm, 200 m, Junior's Kop, Stones, M, MI B. huntleyi 180-3: 3.76 mm, 400 m, First Red Hill, Stones, M, MI
B. huntleyi 155-21: 4.15 mm, 1000 m, Ice Plateau, Stones, F, MI B. huntleyi 339-1: 5.15 mm, 600 m, Feldmark Plateau, Stones, F, MI
B. huntleyi 158-40: 3.92 mm, 1000 m, Ice Plateau, Stones, F, MI B. huntleyi 330-21: 3.92 mm, 0 m, Kildalkey Bay, Stones, M, MI
B. huntleyi 339-21: 3.39 mm, 600 m, Feldmark Plateau, Stones, M, MI B. huntleyi 180-5: 4.08 mm, 400 m, First Red Hill, Stones, F, MI
B. huntleyi 16-34: 3.85 mm, 0 m, Ships Cove Stones, F, MI B. huntleyi 158-22: 4.08 mm, 1000 m, Ice Plateau, Stones, M, MI B. huntleyi 355-1: 3.08 mm, 450 m, Long Ridge S, Stones, F, MI
B. huntleyi 317-19: 4.23 mm, 200 m, Stones, F, PE B. huntleyi 16-28: 3.31 mm, 0 m, Ships Cove, Stones, M, MI B. huntleyi 16-29: 3.31 mm, 0 m, Ships Cove, Stones, M, MI
B. huntleyi 303-19: 3.39 mm, 0 m, Cave Bay, Stones, M, PE B. huntleyi 318-6: 4.31 mm, 672 m, TvZB, Stones, F, PE
B. huntleyi 318-10: 4.46 mm, 672 m, TvZB, Stones, F, PE B. huntleyi 313-5: 3.62 mm, 600 m, Stones, M, PE
B. huntleyi 318-2: 3.54 mm, 672 m, TvZB, Stones, M, PE B. huntleyi 307-7: 3.31 mm, 400 m, Stones, M, PE B. huntleyi 318-1: 3.54 mm, 672 m, TvZB, Stones, M, PE
B. huntleyi 303-20: 2.46 mm, 0 m, Cave Bay, Stones, M, PE B. huntleyi 307-9: 4.31 mm, 400 m, Stones, F, PE
B. huntleyi 322-5: 3.39 mm, 400 m, A. selago, M, PE
B. huntleyi 317-15: 3.31 mm, 200 m, Stones, M, PE B. huntleyi 303-7: 4.62 mm, 0 m, Cave Bay, Stones, F, PE
B. huntleyi 322-9:4.08 mm, 400 m, A. selago, F, PE B. huntleyi 317-6: 4.39 mm, 200 m, Stones, F, PE
B. huntleyi 322-8: 3.92 mm, 400 m, A. selago, M, PE B. huntleyi 317-4: 4.39 mm, 200 m, Stones, F, PE
B. huntleyi 303-23: 4.2 mm, 0 m, Cave Bay, Stones, F, PE
B. huntleyi 313-6: 3.54 mm, 600 m, Stones, M, PE B. huntleyi 317-16: 3.39 mm, 200 m, Stones, M, PE B. huntleyi 313-2: 4.77 mm, 600 m, Stones, M, PE
Lineage a
B. huntleyi 155-24: 4.08 mm, 1000 m, Ice Plateau, Stones, F, MI B. huntleyi 155-20: 5.38 mm, 1000 m, Ice Plateau, Stones, F, MI
B. huntleyi 158-45: 4.54 mm, 1000 m, Ice Plateau, Stones, F, MI
Clade 1
B. brevis Heard Island 1 B. brevis Heard Island 2 99/100/100
99/100/100
99/100/100
96/95/100
99/100/100
98/98/100
98/98/100
92/92/100
79/78/--
89/84/93
84/81/100
96/95/99
79/77/97
91/91/100
97/98/100
87/87/99
61/62/--
77/75/95
76/77/92
68/69/--
0.005
Estimated time to coalescence:
0.723 MYA
0.507 MYA
0.476 MYA
0.381 MYA
0.348 MYA
0.346 MYA
0.314 MYA
0.304 MYA
0.170 - 0.198 MYA
0.141 - 0.170 MYA
0.110 - 0.132 MYA
0.079 - 0.110 MYA
0.069 - 0.079 MYA
0.010 – 0.023 MYA
Lineage b
Clade 2
Outgroup
--/--/95
--/--/90
--/--/96
--/--/98 --/--/99
202
355x1
317x19
313x5
318x2
307x9
322x8
317x16
318x10
313x14 303x23
16x28
16x34
322x5 158x22
317x4
307x7
303x20
317x6 322x9
317x15
303x7
339x21 180x5
42x34
180x3
175x1
16x12
151x21 128x20
339x1 151x18
155x21
158x40
155x30
330x21
141x27
180x15
162x11
151x5
155x25
141x30
141x22
355x11
170x4
7x2
170x16
16x43
151x8
175x6 170x1 170x18 128x17
16x22
16x48
303x19
318x6
128x1 128x3 128x11
155x20
155x24
158x45
865
189
516
486
447
214
517
655
777
783
255
447
*783
783
366
*114
357
819
144
678 258
84
*36
789
630
603
552
153
448
834
735
585
448
214
522
448
651
61
48
150
804
381 321
141
555
342
378
231
573
402
162
660
822
558
336
774
564
78
783
619
174
448
366
*619
876
429
129 795
507
792
447
96
453
42
537
114
804
678
822
448
555
585
147
456
183
378
*865
453
865
795
*678
564
342
381
447 *255
534
654
801
447
591
78
834 144
534
171
282
673
834
159
774
*378
159
783
159
255
517
*42
535
804 795
393
684
630
*555
865
572
159
618
552
795
114
159
270
372
591
351
807
447
6
*183
444
12
555
747
114
114
4
619
789
612
822
15
129
588
150
783
558
67
705
*603
330
*447
714
42
150
24
702
517
*36
783
*150
159
780
531
(Clade 1)
PEI population (Clade 2, Lineage a)
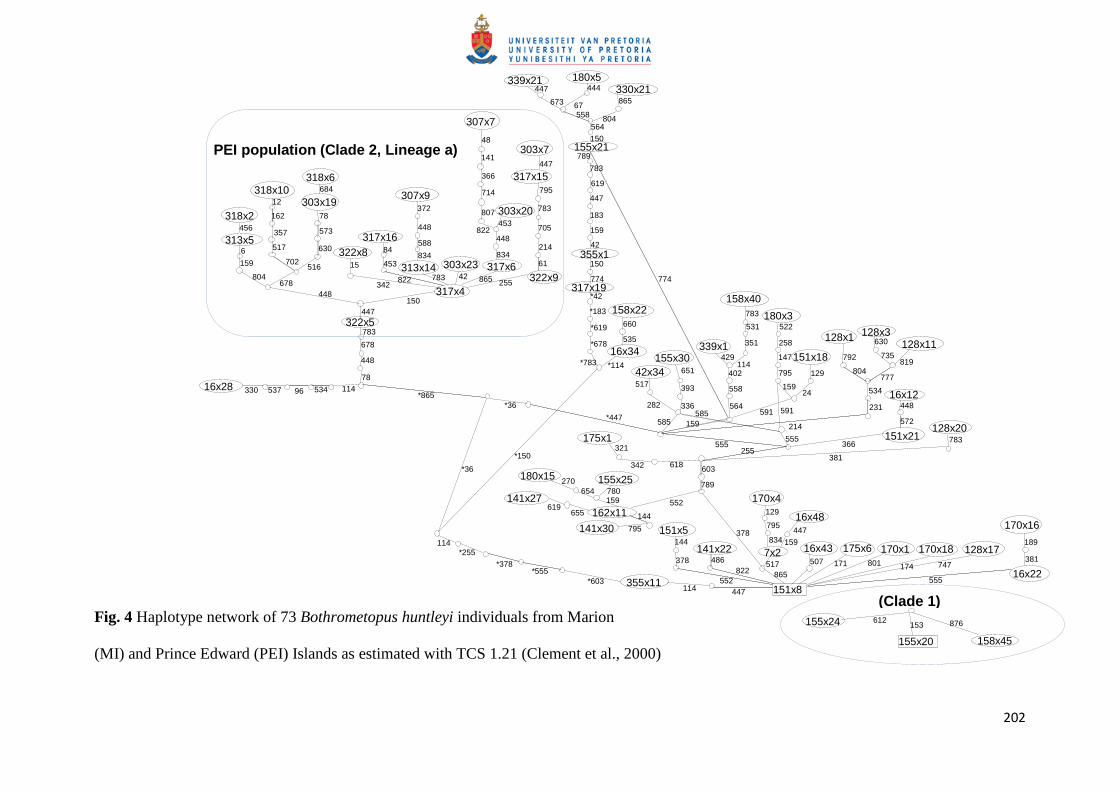
Fig. 4 Haplotype network of 73 Bothrometopus huntleyi individuals from Marion
(MI) and Prince Edward (PEI) Islands as estimated with TCS 1.21 (Clement et al., 2000)

203
Clade 1 (99%-100% support) comprised three individuals from Marion Island
collected from 1000 m a.s.l. that were basal to the second and larger clade comprising
individuals from Marion Island and Prince Edward Island, suggesting that B. huntleyi
originally colonised Marion Island at high altitude. For the remaining individuals that grouped
within clade 2, two major lineages could be discerned albeit with low levels of support. The
first lineage (labelled ‘a’ in Fig. 3) contains individuals collected from Prince Edward Island
alone, whilst lineage ‘b’ consists solely of individuals collected from Marion Island, the only
exception being individual 317-19. Clade 2 is characterised by low bootstrap support for the
internal nodes and by shallow divergences, with high support values occurring primarily at
the terminal nodes. The haplotype network (Fig.4) indicates that clade 1, the high altitude,
relict population present on Marion Island, is separated from clade 2 by more than 12 steps.
The two major lineages within clade 2, namely ‘a’ and ‘b’, which correspond to Prince
Edward Island and Marion Island, respectively are separated from each other by more than
seven steps.
Tests for rate heterogeneity revealed that B. huntleyi lineages from the Prince Edward
Islands archipelago do not evolve at significantly different rates. The estimated time to
coalescence of B. huntleyi is approximately 0.723 m.y.a., predating the oldest dated rocks, but
possibly not island emergence. The first major inter-island dispersal event, is estimated to
have occurred ca. 0.216 million years (m.y.) later, at which time the islands were fully
formed, following which B. huntleyi dispersed to the remainder of Marion Island during
predominantly glaciations-free periods. The results indicate that subsequent to this range
expansion, the populations on the two islands have remained largely isolated with the only
evidence of inter-island gene flow being detected for a single haplotype (317-19). This
individual, sampled from Prince Edward Island shares recent common ancestry with
individual 355-1 from Long Ridge South (Fig. 3) on Marion Island, and an estimated time to
coalescence of approximately 0.02 m.y.a. (Fig. 3).
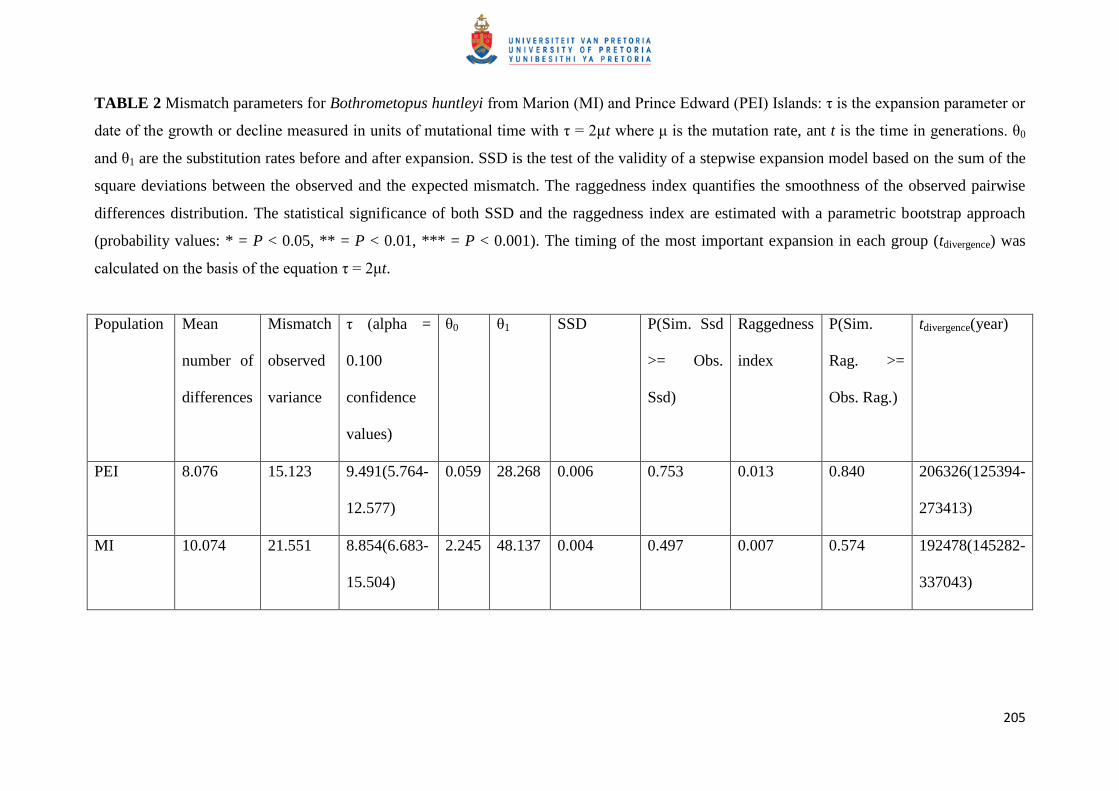
The mismatch distributions for individuals collected on each island are presented in
Fig. 5. Neither the SSD nor the raggedness index values (Table 2) showed any significant
deviation from the expansion model, indicating a population expansion for both Marion
Island and Prince Edward Island. The time of the main expansion events calculated using τ =
2μt (Table 2) correspond to ca. 0.2 m.y. before present (BP).
Fu’s Fs statistic (Table 3) showed statistically significant and large negative values for
both islands that are indicative of a population expansion (Fu 1997). The R2 statistic (Table 3)

204
of Ramos-Onsins & Rozas (2002) also indicates population expansion. The different
estimations for θ are presented in Table 3.
a)
b)
Fig. 5. Mismatch distribution for Bothrometopus huntleyi individuals from: a) Marion (MI)
and b) Prince Edward Islands (PEI). Circles represent the simulated stepwise expansion
model and the squares represent the observed data.
0
20
40
60
80
100
120
140
160
0 1 2 3 4 5 6 7 8 9 10 11 12 13 14 15 16 17 18 19 20 21 22 23 24 25
0
5
10
15
20
25
30
35
0 1 2 3 4 5 6 7 8 9 10 11 12 13 14 15 16 17
205
TABLE 2 Mismatch parameters for Bothrometopus huntleyi from Marion (MI) and Prince Edward (PEI) Islands: τ is the expansion parameter or
date of the growth or decline measured in units of mutational time with τ = 2μt where μ is the mutation rate, ant t is the time in generations. θ0
and θ1 are the substitution rates before and after expansion. SSD is the test of the validity of a stepwise expansion model based on the sum of the
square deviations between the observed and the expected mismatch. The raggedness index quantifies the smoothness of the observed pairwise
differences distribution. The statistical significance of both SSD and the raggedness index are estimated with a parametric bootstrap approach
(probability values: * = P < 0.05, ** = P < 0.01, *** = P < 0.001). The timing of the most important expansion in each group (tdivergence) was
calculated on the basis of the equation τ = 2μt.
Population Mean
number of
differences
Mismatch
observed
variance
τ (alpha =
0.100
confidence
values)
θ0 θ1 SSD P(Sim. Ssd
>= Obs.
Ssd)
Raggedness
index
P(Sim.
Rag. >=
Obs. Rag.)
tdivergence(year)
PEI 8.076 15.123 9.491(5.764-
12.577)
0.059 28.268 0.006 0.753 0.013 0.840 206326(125394-
273413)
MI 10.074 21.551 8.854(6.683-
15.504)
2.245 48.137 0.004 0.497 0.007 0.574 192478(145282-
337043)

206
TABLE 3 Summary statistics for Bothrometopus huntleyi from Marion (MI) and Prince Edward (PEI) Islands showing Fu’s (1997) Fs values,
Tajima’s (1983) D as well as estimations for θ (probability values: * = P < 0.05, ** = P < 0.01, *** = P < 0.001).
Population Fu’s (1997) Fs
test
Ramos-
Onsins
and Rozas
(2002) R2
statistic
P(sim_Fs
<=obs_Fs)
Watterson’s
(1975)
estimate (θ(S))
Tajima’s
(1983)
estimate
(θ(π))
PEI -7.686** 0.081 0.003 11.952 8.196
MI -24.614*** 0.053 <0.0001 18.368 10.233

207
Discussion
Time to B. huntleyi haplotype coalescence on the Prince Edward Islands archipelago
is estimated to have occurred approximately 0.723 m.y.a. This date is older than that of the
oldest dated rocks (0.45 m.y.a.), but remains within the estimated emergence time of the
islands of less than 1 m.y.a. (McDougall et al. 2001; Boelhouwers et al. 2008). It is probable
that the founder population was restricted to high elevation areas of Marion Island for a
period of approximately 0.216 m.y. High elevation refugia in the form of nunataks have been
identified for Marion Island both on geomorphological and molecular grounds (Boelhouwers
et al. 2008; Mortimer et al. 2010). Moreover, recent studies from Antarctica are also
providing evidence of refugia for invertebrate taxa that initially appear to be at odds with the
geological evidence (Convey et al. 2008).
Bothrometopus huntleyi is estimated to have then dispersed to the remainder of
Marion Island and on to Prince Edward Island, approximately 0.507 m.y.a. This occurrence
coincides with the oldest dated rocks on the island (Boelhouwers et al. 2008). Individual 317-
19 from Prince Edward Island groups with individuals (92 % bootstrap support; Fig. 3) in the
Marion Island-associated lineage b in clade 2, and represents a lineage that became
established on Prince Edward Island much later at c. 0.02 m.y.a. When comparing the dates
estimated in Fig. 3 with the estimated times of glaciations and volcanic activity on Marion
Island (Fig. 1) it can be seen that, while numerous divergence events coincide with times of
volcanic activity, very few divergence events occurred during the first and third glaciations
periods. Thus, it appears that genetic divergence of B. huntleyi is linked to volcanic activity
on Marion Island, especially at those times when the island was not glaciated. Quite what
mechanism of transport was involved is difficult to determine, but complex associations
between volcanism and population structure are well known for animals from other island
systems (e.g. Paulay 1985, Vandergast et al. 2004, Emerson et al. 2006, Moya et al. 2007).
It should be noted that for B. huntleyi only one instance of migration from Marion
Island to Prince Edward Island occurred after Prince Edward Island was originally colonised
(Fig. 1). This contrasts markedly with the multiple migration events noted for Ectemnorhinus
weevils from Marion Island to Prince Edward Island (Grobler et al. 2006). The difference
between B. huntleyi and Ectemnorhinus weevils could be explained by habitat preference.
Ectemnorhinus weevils occur mainly on vegetation (Chown 1989, 1992), and are thus more
likely to be transported by birds than B. huntleyi which mainly occurs on rock surfaces and

208
hides in crevices in the rocks. Bothrometopus huntleyi individuals also have adhesive brushes
on the tarsomeres 1-3 (Kuschel & Chown 1995) that prevent the weevils from being easily
lifted by the frequent, strong south-westerly winds.
The results of the mismatch distribution analyses are consistent with that of the
phylogeny as they indicate that the major expansion event occurred on Marion Island
approximately 0.192 m.y.a., with lower and upper bounds of ± 0.145 to ± 0.337 m.y.a.,
respectively. Most divergence times calculated for Marion Island (Fig. 3) fall within the
upper bound estimates of the mismatch analyses. Similarly, most Prince Edward Island
divergence estimates (Fig. 3) also fall within the lower and upper bounds of ± 0.125 to ±
0.273 m.y.a., respectively as estimated by the mismatch distribution analyses which revealed
that a major expansion event occurred on Prince Edward Island approximately 0.206 m.y.a.
At present, the high elevation Marion Island founder population is intact (clade 1) and
two island-discrete population complexes occur which are separated by an ocean barrier of 19
km. Historical inter-island migration has been minimal and uni-directional (from Marion
Island to Prince Edward Island only) compared to other endemic Ectemnorhinus weevils
studied to date. The isolation of the population on Prince Edward Island from the population
on Marion Island probably resulted from a combination of factors, including a lack of both
volcanic activity and of bird and/or wind-assisted dispersal between the islands. The genetic
data are thus consistent with the lack of morphological differences between the individuals
found on the islands, and the assumption of a shared species. Whilst the phylogeny did not
recover highly-supported island-specific clades, the haplotype network (Fig. 3) revealed that
B. huntleyi individuals from Prince Edward Island are genetically more similar to each other
than to individuals from Marion Island. It is therefore likely that these allopatric populations
will continue to diverge as long as the natural inter-island isolation is maintained.
An important conservation biogeographic (see Whittaker et al. 2005) insight from our
work is that anthropogenic gene flow between populations on Marion Island and Prince
Edward Island should be prevented. Thus, the current practise of limiting visits to Prince
Edward Island to a minimum, and the strict quarantine provisions for such visits (e.g.
Anonymous 1996, Davies et al. 2007) should be maintained. Moreover, the genetic
distinctiveness of the B. huntleyi population on Marion Island, which is under threat via
increased size-selective predation by the house mouse, Mus musculus domesticus (Gleeson &
van Rensburg 1982, Chown & Smith 1993, Smith et al. 2002; Jansen van Vuuren & Chown
2007), also underscores the need to control mice (see Angel et al. 2009) on Marion Island to

209
ensure that both the unique genetic variation on Marion Island, and the evolutionary
dynamics of the archipelago are conserved.
Acknowledgements
The authors thank I. McDougall and the Geological Magazine for the permission to use Fig.
1, taken from McDougall et al. (2001), and the referees for their helpful comments on a
previous version of the ms. The Directorate Antarctica and Islands of the South African
Department of Environmental Affairs and Tourism provided logistic support at Marion Island
via the South African National Antarctic Programme (SANAP). This work was funded by a
SANAP NRF grant (GUN2068301).
References
ALONSO-ZARAZAGA, M.A. & LYAL, C.H.C. 1999. A World Catalogue of families and genera
of Curculionoidea (Insecta: Coleoptera) excluding (Scolytidae and
Platypodidae). Entomopraxis: Barcelona, 315pp.
ANGEL, A., WANLESS, R.M., & COOPER, J. 2009. Review of impacts of introduced house
mouse on islands in the Southern Ocean: are mice equivalent to rats? Biological
Invasions, 11, 1743-1754.
ANONYMOUS. 1996. Prince Edward Islands Management Plan. Department of Environmental
Affairs and Tourism, Pretoria, South Africa.
BOELHOUWERS, J.C., MEIKLEJOHN, K.I., HOLNESS, S.D. & HEDDING, D.W. 2008. Geology,
geomorphology and change. In CHOWN, S.L. & FRONEMAN, P.W., eds. The Prince
Edward Islands: Land-sea interactions in a changing ecosystem. Sun Press,
Stellenbosch, 65-96.
BROWER, A.V.Z. 1994. Rapid morphological radiation and convergence among races of the
butterfly Heliconius erato inferred from patterns of mitochondrial DNA evolution.
Proceedings of the National Academy of Science of the United States of America, 91,
6491-6495.
CHOWN, S.L. 1989. Habitat use and diet as biogeographic indicators for sub-Antarctic
Ectemnorhinini (Coleoptera: Curculionidae). Antarctic Science, 1, 23-30.

210
CHOWN, S.L. 1992. A preliminary analysis of weevil assemblages in the sub-Antarctic: local
and regional patterns. Journal of Biogeography, 19, 87-98.
CHOWN, S.L. & KLOK, C.J. 2001. First record of Palirhoeus eatoni (Coleoptera:
Curculionidae) from sub-Antarctic Heard Island. African Entomology, 9, 193-194.
CHOWN, S.L. & KLOK, C.L. 2003 Altitudinal body size clines: Latitudinal effects associated
with changing seasonality. Ecography, 26, 445-455.
CHOWN, S.L. & SCHOLTZ, C.H. 1989. Biology and ecology of the Dusmoecetes Jeannel (Col.
Curculionidae) species complex on Marion Island. Oecologia, 80, 93-99.
CHOWN, S. L. & SMITH, V. R. 1993. Climate change and the short-term impact of feral house
mice at the sub-Antarctic Prince Edward Islands. Oecologia, 96, 508-516.
CLEMENT, M., POSADA, D. & CRANDALL, K. 2000. TCS: a computer program to estimate
gene genealogies. Molecular Ecology, 9, 1657-1660.
CONVEY, P., GIBSON, J.A.E., HILLENBRAND, C.D., HODGSON, D.A., PUGH, P.J.A., SMELLIE,
J.L. & STEVENS, M.I. 2008. Antarctic terrestrial life – challenging the history of the
frozen continent? Biological Reviews, 83, 103-117.
DAVIES, S.J., CHOWN, S.L. & JOUBERT, L.J. 2007. Renewed management systems and
provisions for South Africa’s sub-Antarctic islands. Papers and Proceedings of the
Royal Society of Tasmania, 141, 115-120.
DREUX, PH. & VOISIN, J.F. 1984. Description de Bothrometopus derelictorum, n. sp. et notes
sur le genre Bothrometopus Jeannel, 1940. [Coleoptera, Curculionidae,
Ectemnorrhininae]. Revue Francaise d'Entomologie (N.S.), 6, 33-38.
DREUX, PH. & VOISIN, J.F. 1986. Note sur les genres Mesembriorrhinus Jeannel et
Palirhoeus Kuschel (Coleoptera, Curculionidae). Nouvelle Revue d'Entomologie
(N.S.), 3, 257-261.
DREUX, PH. & VOISIN, J.F. 1987. Notes sur le genre Antarctonesiotes Jeannel et sur le genre
Disker nov., et description d'Antarctonesiotes villiersi n. sp. (Coleoptera,
Curculionidae). Nouvelle Revue d'Entomologie (N.S.), 4, 313-321.
DRUMMOND, A.J. & RAMBAUT, A. 2007. BEAST: Bayesian evolutionary analysis by
sampling trees. BMC Evolutionary Biology, 7, 214.
EMERSON, B.C., FORGIE, S., GOODACRE, S. & OROMI, P. 2006. Testing phylogeographic
predictions on an active volcanic island: Brachyderes rugatus (Coleoptera:
Curculionidae) on La Palma (Canary Islands). Molecular Ecology, 15, 449-458.

211
EXCOFFIER, L. & SCHNEIDER, S. 1999. Why hunter-gatherer populations do not show signs of
Pleistocene demographic expansions. Proceedings of the National Academy of
Sciences of the United States of America, 96, 10597-10602.
FELSENSTEIN, J. 1981. Evolutionary trees from DNA sequences: A maximum likelihood
approach. Journal of Molecular Evolution, 17, 368-376.
FELSENSTEIN, J. 1988. Phylogenies from molecular sequences: Inference and reliability.
Annual Reviews in Genetics, 22, 521-565.
FU, Y.X. 1997. Statistical tests of neutrality of mutations against population growth,
hitchhiking and background selection, Genetics, 143, 557-570.
GLEESON, J.P. & VAN RENSBURG, P.J.J. 1982. Feeding ecology of the house mouse Mus
musculus on Marion Island. South African Journal of Antarctic Research, 12, 34-39.
GROBLER, G.C., JANSE VAN RENSBURG, L., BASTOS, A.D.S., CHIMIMBA, C.T. & CHOWN,
S.L. 2006. Molecular and morphometric assessment of the taxonomic status of
Ectemnorhinus weevil species (Coleoptera: Curculionidae, Entiminae) from the sub-
Antarctic Prince Edward Islands. Journal of Zoological Systematics and Evolutionary
Research, 44, 200-211.
GROBLER, G.C., BASTOS, A.D.S., TREASURE, A. & CHOWN, S.L. 2011. Cryptic species,
biogeographic complexity and evolutionary history of the Ectemnorhinus-group in the
sub-Antarctic, including a description of Bothrometopus huntleyi, n. sp. Antarctic
Science, 23: 211-224.
GUIDON, S. & GASCUEL, O. 2003. A simple, fast and accurate algorithm to estimate large
phylogenies by maximum likelihood. Systematic Biology, 52, 696-704.
HASEGAWA, M. KISHINO, H & YANO, T. 1985. Dating of human-ape splitting by a molecular
clock of mitochondrial DNA. Journal of Molecular Evolution, 22, 160-174.
HUELSENBECK, J.P. & RONQUIST, F. 2001. MRBAYES: Bayesian inference of phylogeny.
Bioinformatics, 17, 754-755.
JANSEN VAN VUUREN, B.J. & CHOWN, S.L. 2007. Genetic evidence confirms the origin of the
house mouse on sub-Antarctic Marion Island. Polar Biology, 30, 327-332.
JEANNEL, R. 1953. Sur la faune entomologique de l’ile Marion. Revue Francaise
d’Entomologie, 31, 319-417.

212
KUMAR, S. 1996. PHYLTEST: A Program for Testing Phylogenetic Hypothesis, Version 2.0.
Institute of Molecular Evolutionary Genetics and Department of Biology, The
Pennsylvania State University, University Park, Pennsylvania, USA.
KUSCHEL, G. & CHOWN, S.L. 1995. Phylogeny and systematics of the Ectemnorhinus-group
of genera (Insecta: Coleoptera). Invertebrate Taxonomy, 9, 841-863.
LI, P. & BOUSQUET, J. 1992. Relative-rate test for nucleotide substitutions between two
lineages. Molecular Biology and Evolution, 9, 1185–1189.
LIBRADO, P. & ROZAS, J. 2009. DnaSP v5: A software for comprehensive analysis of DNA
polymorphism data. Bioinformatics doi: 10.1093/bioinformatics/btp187.
MCDOUGALL, I., VERWOERD, W. & CHEVALLIER, L. 2001. K-Ar geochronology of Marion
Island, Southern Ocean. Geological Magazine, 138, 1-17.
MORTIMER, E. & JANSEN VAN VUUREN, B., LEE, J.E., MARSHALL, D.J., CONVEY, P. & CHOWN,
S.L. 2010. Mite dispersal among the Southern Ocean Islands and Antarctica before the
last glacial maximum. Proceedings of the Royal Society of London B, in press.
MOYA, O., CONTRERAS-DIAZ, H.G., OROMI, P. & JUAN, C. 2007. Phylogeography of a
ground beetle species in La Gomera (Canary Islands): the effects of landscape
topology and population history. Heredity, 99, 322-330.
MYBURGH, M., CHOWN, S.L., DANIELS, S.R. & JANSEN VAN VUUREN, B. 2007. Population
structure, propagule pressure and conservation biogeography: lessons from
indigenous and invasive springtails. Diversity and Distributions, 13, 143-154.
PAPADOPOULOU, A., ANASTASIOU, I. & VOGLER, A.P. 2010. Revisiting the molecular clock:
the mid-Aegean trench calibration. Molecular Biology and Evolution, 27, 1659-1672.
PAULAY, G. 1985. Adaptive radiation on an isolated oceanic island: the Cryptorhynchinae
(Curculionidae) of Rapa revisited. Biological Journal of the Linnean Society, 26, 95-
187.
POSADA, D. & CRANDALL, K.A. 1998. MODELTEST: Testing the model of DNA
substitution. Bioinformatics, 14, 817-818.
RAMOS-ONSINS, S.E. & ROZAS, J. 2002. Statistical properties of new neutrality tests against
population growth. Molecular Biology and Evolution, 19, 2092-2100.
SCHNEIDER, S. & EXCOFFIER, L. 1999. Estimation of past demographic parameters from the
distribution of pairwise differences when the mutation rates vary among sites:
application to human mitochondrial DNA. Genetics, 152, 1079-1089.

213
SCHNEIDER, S., ROESSLI, D. & EXCOFFIER, L. 2000. Arlequin ver. 2.000: A software for
population genetics data analysis. Genetics and Biometry Laboratory, University of
Geneva, Switzerland.
SMITH, V.R., AVENANT, N.L. & CHOWN, S.L. 2002. The diet and impact of house mice on a
sub-Antarctic island. Polar Biology, 25, 703-715.
STEVENS, M.I., GREENSLADE, P., HOGG, I.D. & SUNNUCKS, P. 2006. Southern Hemisphere
springtails: could any have survived glaciation of Antarctica? Molecular Biology and
Evolution, 23, 874-882.
SWOFFORD, D. L., 2003: PAUP*. Phylogenetic Analysis Using Parsimony (*and Other
Methods). Version 4. Sinauer Associates, Sunderland, Massachusetts.
TAJIMA, F. 1983. Evolutionary relationship of DNA sequences in finite populations.
Genetics, 105, 437-460.
TAMURA, K., DUDLEY, J., NEI, M. & KUMAR, S. 2007. MEGA4: Molecular Evolutionary
Genetics Analysis (MEGA) software version 4.0. Molecular Biology and Evolution,
24, 1596-1599.
TEMPLETON, A.R., CRANDALL, K.A. & SING, C.F. 1992. A caldistic analysis of phenotypic
associations with haplotypes inferred from restriction endonuclease mapping. III.
Cladogram estimation. Genetics, 132, 619-633.
VANDERGAST, A.G., GILLESPIE, R.G. & RODERICK, G.K. 2004. Influence of volcanic activity
on the population genetic structure of Hawaiian Tetragnatha spiders: fragmentation,
rapid population growth and the potential for accelerated evolution. Molecular
Ecology, 13, 1729-1743.
WATERHOUSE, C.O. 1876. Description of a new species of Ectemnorhinus from Kerguelen
Island. Entomologist’s Monthly Magazine, 13, 51-52.
WATTERSON, G.A. 1975. On the number of segregation sites. Theoretical Population
Biology, 7, 256-276.
WHITTAKER, R.J., ARAÚJO, M.B., PAUL, J., LADLE, R.J., WATSON, J.E.M. & WILLIS, K.J.
2005. Conservation biogeography: assessment and prospect. Diversity and
Distributions, 11, 3-23.