chapter 4 case study of energy managment system deplyoment ... · chapter 4 case study of energy...
TRANSCRIPT
Chapter 4
Case Study of Energy Managment System Deplyoment for Office
Buildings
February 2017
This chapter should be cited as
ERIA (2016), ‘Case Study of Energy Managment System Deplyoment for Office
Buildings’, in Iida, Y., S. Inoue, and Y. Li (eds.), Study on the Advancement of the Energy
Management System in the East Asia Summit Region. ERIA Research Project Report
2015-17, Available at: http://www.eria.org/RPR_FY2015_No.17_Chapter_4.pdf ,
pp.53-75.
53
Chapter 4
Case Study of EMS Deployment for Office Buildings
1. Summary of the First-Year Study
1.1. Good practices of BEMS implementation
During the first year, the study discussed the applicability of BEMS referring to the actual cases
of BEMS implementation. The following six cases were introduced as examples of good
practices in the first-year report.
(1) Omotesando Hills (Tokyo, Japan)
Omotesando Hills, a shopping mall located in the Shibuya district of Tokyo, at first arranged
the operational schedule of the air-conditioning system around the business hours of the
shops and restaurants in the complex. However, it was determined, through the use of BEMS,
that air conditioning could be cut back 30 minutes each day.
In addition, the frequency of the air-conditioning units was adjusted by using the inverter
system for harmonising with that of the ventilation unit of restaurants, where the outside air
exchange units were originally operated at a constant, unchanging rate. It was discovered that
the amount of intake of external air was excessive. Adjusting the system frequency makes a
substantial contribution to energy conservation, because the amount of electric power
demanded is proportional to the cube of the electrical frequency.
As a result, Omotesando Hills successfully reduced its energy consumption by about 40
percent.
The Intelligent Energy System Project, which is a pilot smart grid project in Singapore
administered by Energy Market Authority, Singapore Power, and Nanyang Technological
University, aims to investigate the potential for behavioural change by residents if provided
real-time electricity consumption information.
In this pilot project, it was studied how residential energy-use patterns are affected by
providing consumption information to customers, through the use of smart metres with in-
home display and web-portal services provided by Singapore Power Service.
The results showed that customers who received in-home display reduced energy
consumption by 3.8 percent, whereas customers who had access only to web portal had no
change in energy consumption. This shows the potential to further influence consumption
behaviour through information, but the information should be easy to access.
(2) Sengokuyama Mori Tower (Tokyo, Japan)
Sengokuyama Mori Tower, which is a multipurpose complex located in the Minato district of
Tokyo, uses BEMS technology to monitor the energy systems and collect data. Mori Building,

54
owner of the complex, uses an energy-efficiency indicator, called the ‘water transportation
factor’ for controlling the water flow through the chilled water system. By adjusting the
amount of cooling water in the system, the operator saved about 10 percent of the energy
consumption.
In addition, Sengokuyama Mori Tower saved 30–60 percent of energy for the hot water system
by adjusting the pressure of hot water. The all-out use of the efficient LED fixtures saved its
tenants a significant amount although it required a higher upfront cost.
(3) ECOZZERIA, Shin-Marunouchi Building (Tokyo, Japan)
The Shin-Marunouchi Building was completed in 2007 by Mitsubishi Estate, a major Japanese
real estate company. Its tenants are all members of ECOZZERIA, which is a space to showcase
the diverse environmental efforts.
ECOZZERIA equips LED lighting system with a switch and a lux metre with which you can
change the intensity of the lighting. While most offices set the intensity of overhead light at
700 lux (lx), it is set at 300 lx to 500 lx in this office. According to them, setting the lux at those
levels enables workers to watch screens for a longer time without feeling discomfort. The
initial investment cost is about 3 times more expensive, but the energy used for lighting is 70
percent of the benchmark (=30 percent less) compared that used for normal offices.
ECOZZERIA also installed a radiation air-conditioning system, which uses cool water sent
through an innovative tubing system integrated into the ceiling. By using heat exchanger, the
temperature of the fresh air taken from the outside is almost the same as room temperature,
and carbon dioxide (CO2) sensors control it. Compared with the regular air-conditioning system,
the initial cost of radiation air-conditioning system is about 1.5 times more expensive, but
energy consumption is saved by 25 percent.
(4) Marunouchi Heat Supply (Tokyo, Japan)
Marunouchi Heat Supply is one of the advanced cases of district heating and cooling system
in Japan. The system controls boilers and chillers, reducing significant amount of CO2 emissions.
One of the major advantages is the efficient operation due to the centralisation of boilers and
chillers. It reduces primary energy consumption by 20–25 percent compared with stand-alone
heating and cooling system.
The company uses and installs both turbo and absorption chillers to realise the best mix of
electricity and gas consumption. It mainly uses turbo chillers for making cold water because
the coefficient of performance of turbo chiller, combined with inverters, is as high as 25.
However, during peak day-time hours, it uses absorption chillers that are low in coefficient of
performance (between 5 and 6) but do not consume electricity. By doing this, the company
saves the demand charge of its electricity tariff.

55
(5) Amari Water Gate Bangkok and Amarin Plaza (Bangkok, Thailand)
Azbil Corporation, an energy solution provider, started an ESCO pilot project at Amari
Watergate Bangkok and Amarin Plaza in Thailand. BEMS, combined heat power VWV (variable
water volume) control, CDP (constant differential pressure) VWV control, and cooling tower
fan VSD (variable speed drives) control are applied at these buildings. During the first year,
they checked the data on a monthly basis. On the second year, they checked the data every
quarter. They do not have its staff constantly on-site, and only look at BEMS data from Japan.
When the target was not achieved, they tried to find and revise the causes. As a result, an
annual energy consumption of 663,483 kilowatt-hours (KWh) and an annual cost of
THB3,498,347 were saved through those projects, saving 15 percent energy at Amari
Watergate Bangkok.
Since it was a pilot project, Azbil gained no profit from it. The understanding for ESCO has not
been enough in the ASEAN countries, so educating customers about the concept is
indispensable for promoting ESCO business.
1.2. Case studies in Indonesia and Thailand
The first-year study also analysed the potential of dissemination and deployment of EMS
technologies in the ASEAN region, especially focusing on BEMS.
The examples in the EAS countries showed that the key factors of energy saving through EMS
deployment were: (i) visibility (to grasp the actual situation of energy consumption), (ii)
accessibility (to easily check the collected data), and (iii) comparability (to compare with other
users with similar load profiles). Thereafter, the set of the most efficient measures was
selected to optimise the economic benefit against cost.
To grasp the real situation to serve for the aforementioned factors, a case study was conducted
in two sites during the first year, one in Indonesia and another in Thailand. The case studies
were carried out in the manner that desk research on energy-saving actions or behaviours was
first conducted. Thereafter, the effectiveness of energy-saving measures was examined
through the field survey on the actual status of energy consumption to confirm the energy-
saving effect more in detail.
Based on the results of a case study conducted at the two sites, it was observed that office
buildings in high-temperature and high-humidity environment had a great deal of room for
saving energy by improving air conditioning and that two main points should be improved for
air conditioning in office buildings: (i) to adjust the intake volume of fresh air from outdoors
and (ii) to adjust the frequency of motor power by using inverters.
(1) To adjust the intake volume of fresh air from outdoors
For the first point, the solution dealt with a problem that excessive ventilation caused load
increase through the energy loss of chillers and refrigerators by unnecessarily exhausting cold
air outside. The study suggested that the optimised volume of ventilation can be identified by
monitoring the number of people in the office and CO2 density periodically. The adjustment of
the intake volume of fresh air was to be made via adjustment of air intake and of air exhaust.
56
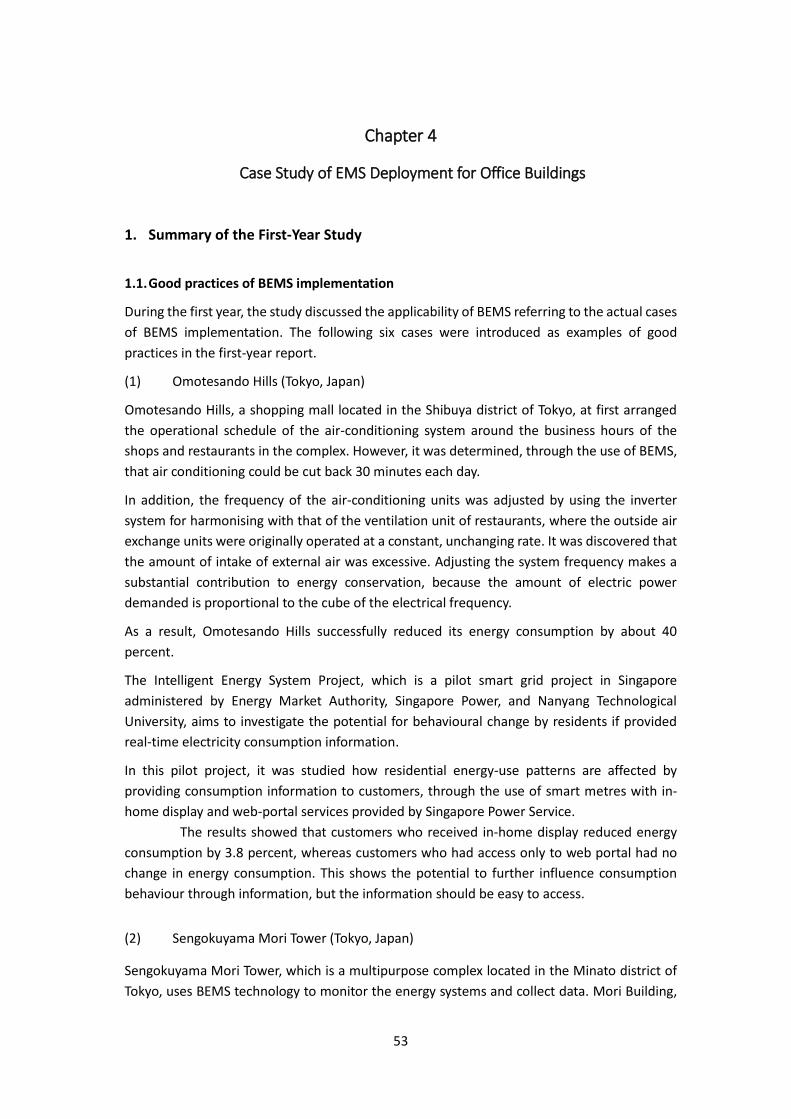
The case study results showed that it was a common practice in the EAS countries that air
exhaust of each floor was led to the washroom or the hot water supply room. Air exhaust was
made regardless of the CO2 density and, thus, it was not feasible to control air exhaust at these
points. Therefore, this study suggested that adjusting air intake by introducing motor damper
in the ventilation would contribute to the decreasing electricity load of chillers and
refrigerators. Although a little costlier, an advanced step to follow is to install a variable air
volume system to reduce the energy consumption of fans.
Figure 4.1: Air Intake at Machine Room
Figure 4.2: Image of Motor Damper
Source: Author (Left), Wikimedia Commons [Damper (flow)] (Right).
Figure 4.3: Recommended Schematics of Air flow with Motor Damper
AHU = air handling unit, CO2
= carbon dioxide. Source: Author.
(2) To control the frequency of motor power of compressors using inverters
For the second point, the solution was to reduce the energy consumption of compressors by
controlling the frequency of motor power by using invertors. The first-year study identified the
benefit of introducing induction motors and synchronous motors, and inverters were an
essential part. By adjusting the setting for the frequency of inverters and optimising the
rotation, high effects of energy saving were expected. In the study, it was observed that the
energy consumption of motor power was reduced remarkably by decreasing the rotation by
half. In the field study, it was also found that the motor was operated at maximum output even

57
in sites where inverters were already installed, i.e. no practice of adjustment has been done.
In the ASEAN region, the diffusion of inverters for air conditioning was still not common
enough, but the study suggested that the combination of optimising air ventilation and
adjusting the frequency of inverters (depending on circumstances, by introducing automatic
variably controlling) can help actualise the potential of energy saving to the maximum.
In addition, the study also argued that, on a longer-term basis, more attention should be paid
to energy efficiency through the introduction of advanced building structure. For example, the
Green Building program in the United States, the regulation of energy saving in new buildings
by the Ministry of Land, Infrastructure, Transport and Tourism of Japan, and the Top Runner
Program were discussed in the study.
Figure 4.4: Monitor Panel
Source: Author. .
58
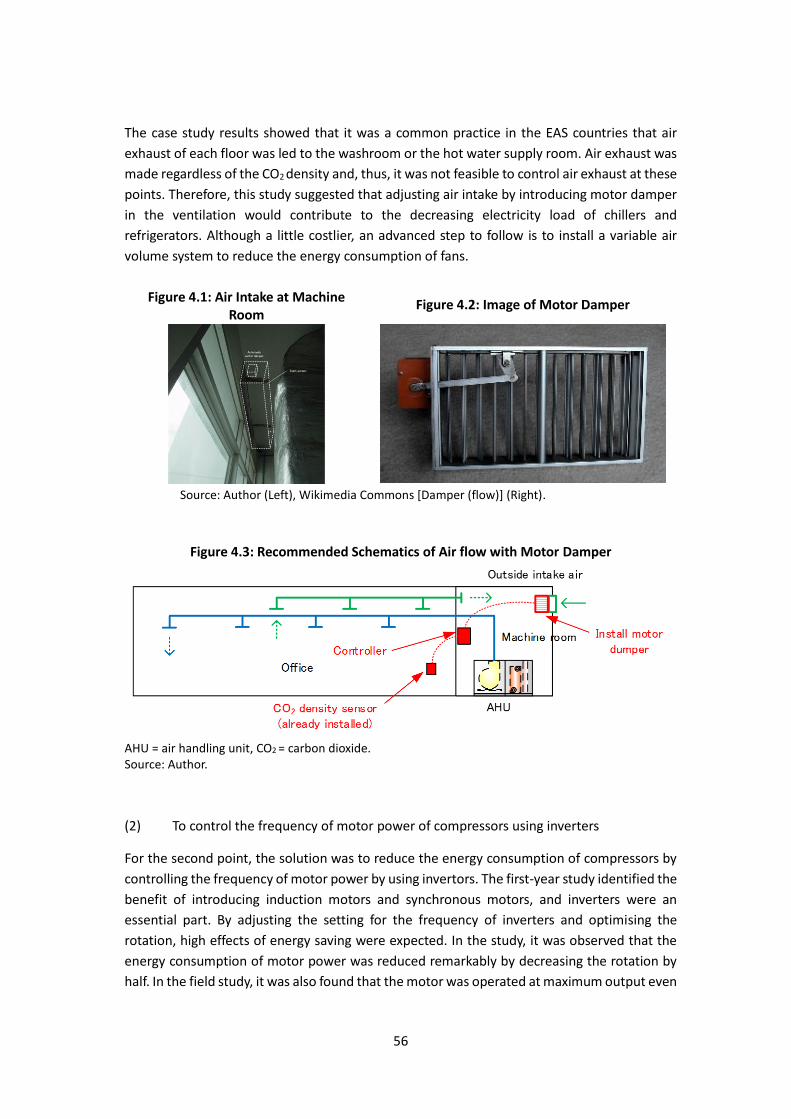
Figure 4.5: Diagram of Chilled Water Supply System
CH = chiller, CHWR = chilled water return, CHWS = chilled water supply, CT = cooling tower, INV =
inverter, kW = kilowatt, TR = ton of refrigeration.
Source: Author.
CS
CH-1 Turbine chiller400TR
CH-2 Turbine chiller400TR
CH-3 Turbine chiller200TR
CH-4 Turbine chiller200TR
4℃ to 6℃
4℃ to 6℃
4℃ to 6℃
CHWS
Chilled water pump (Primary)XXXL/min×35kW×4台
Chilled water pump (Secondary)XXXL/min×125kW×4台
INV INV INV
Chilled water pump (Secondary)XXXL/min×45kW×2台
CT-4 CT-3 CT-1 CT-2
CHWS CHWR
Left Wing Tower
Right Wing Tower
CHWS CHWR
CHWR
Building Support
Pressure diff ierential valve
Chilled water pump (Primary)XXXL/min×45kW×4台
Condenser water pumpXXXL/min×35kW×4台
Condenser water pumpXXXL/min×125kW×4台

59
2. Case Study at EVN Head Office, Hanoi, Viet Nam
In the second-year study, an additional case study of EMS deployment was conducted in Viet
Nam, where the climate conditions that strongly affect the air-conditioning demand and the
status of economic development are different from those in Indonesia and Thailand.
Most of the land area in the ASEAN region is located in tropical climate. Northern Viet Nam is
positioned in subtropical climate, and because of the seasonal fluctuation of temperature,
energy consumption deriving from air conditioning is supposed to be relatively small
compared with that in tropical climate where air-conditioning demand is constantly high
throughout the year. The case study in Viet Nam looks more at the potential of energy
efficiency in lighting than that in air conditioning.
It should be noted also that electricity price in Viet Nam is lower than that in other four ASEAN
countries as discussed in Section 1.6. A case study in Viet Nam, therefore, helps evaluate the
applicability of BEMS in a more conservative condition.
With the support of energy auditing experts, a walk-through was carried out at the EVN Head
Office in Hanoi.
2.1. About the case study site
EVN is a state-owned electric company in Viet Nam, whose head office is located in the central
district of Hanoi. It proposed to show EVN Head Office building complex for the case study.
The buildings were completed in April 2014. Hereunder is EVN’s general consumption
information.

60
Table 4.1: Overview of EVN Head Office
Name EVN Building – A Tower
Year Operated 2014
Total floor area 93 351 m2
Air-conditioned floor area 72 970 m2
Number of floor Overground: 33 Underground: 3
Number of daytime workers 1 050
Maximum demand 5 300 kW
Supply voltage 22 kV
Total capacity of Heat source: AC etc. 2 114 kW
AC = air conditioner, kV = kilovolt, kW = kilowatt, m2 = square metre.
Source: Study Team, using EVN data.
2.2. Observations from the survey
(1) Overview of the installed facilities
A site survey, which consists of interview with the facility manager and walk-through survey,
was conducted on 23 December 2015 to extract potential energy-saving measures. The
building was completed in March 2014, and the equipment and systems installed are new.
Hereunder is a list of all items checked for each system: chilled water supply, cooling and
ventilation, and lighting, as well as outline diagrams.
Chilled water supply system:
(1) Daily operating hours: 9 hours (7:00 to 18:00).
(2) Chillers: 4 No 900RT units installed, but only 2 units are normally in operation.
(3) Chilled water supply temperature is set at 7°C during the hottest months (June–July), but
the setting is relaxed during other months, ranging from 8°C to 12°C.
(4) Condenser water supply temperature setting is variable, ranging from 32°C to 37°C.
(5) Chilled water delivery primary pump system is composed of 5 units (1 unit as standby), 9
secondary pump units (3 units as standby).
(6) Chilled water secondary pumps and condensate water pump have speed converter control
installed for energy saving.
Cooling and ventilation system:
(1) Temperature control and ventilation for standard floor space offices is provided by air
handling units.
(2) Temperature control and ventilation for common areas on lower levels is provided by fan
coil units.
(3) Air-conditioning units are installed on machine rooms on each floor and have built-in
variable ventilation volume control depending on the indoor temperature and the variable
rotation of the inverters. A check inside the twenty-third floor machine room confirmed
that the inverter rotation was at 14 Hz.

61
(4) Sensors are installed within the air-conditioning unit return ducts to detect the CO2 and
control intake of fresh air.
(5) 2 Supply air fan units (1 unit as standby), 2 extraction fan units (1 unit as standby) are
installed to provide ventilation for the drive-in car park, operating hours at 7:30–18:30 (9
hours).
Lighting system:
(1) 1 40-watt fluorescent tube per lighting unit is deployed to provide lighting for standard
floor space offices, with switches for window and indoor lights on a separate circuit.
(2) Window lighting is normally on although there is sufficient illumination indoors.
(3) 3 fluorescent lamp units each at 40 watts are deployed for corridor lighting. Lighting units
have been disabled for energy saving.
Figure 4.6: Simplified Diagram of Chilled Water Supply System
kW = kilowatt, min = minute, RT = refrigeration ton . Source: Author.
A Tower
Primary Chilled Water Pumps****L/min×37kW×5units
B Tower Podium
CH1 Turbine Chiller800RT
CH2 Turbine Chiller800RT
CH3 Turbine Chiller800RT
CH4 Turbine Chiller800RT
Podium A TowerB Tower
P-2-1
P-2-2
P-2-3
P-2-4
P-2-5
P-1-1
P-1-2
P-1-3
P-1-4
P-1-5Spare
Condensed Water Pumps****L/min×75kW×5units
Secondary Chilled Water Pumps (A Tower)
****L/min×75kW×3units
Secondary Chilled Water Pumps (B Tower)
****L/min×55kW×3units
Secondary Chilled Water Pumps (Podium)
****L/min×30kW×3units
Cooling Tower22kW×4units
CT-1 CT-2 CT-3 CT-4
62
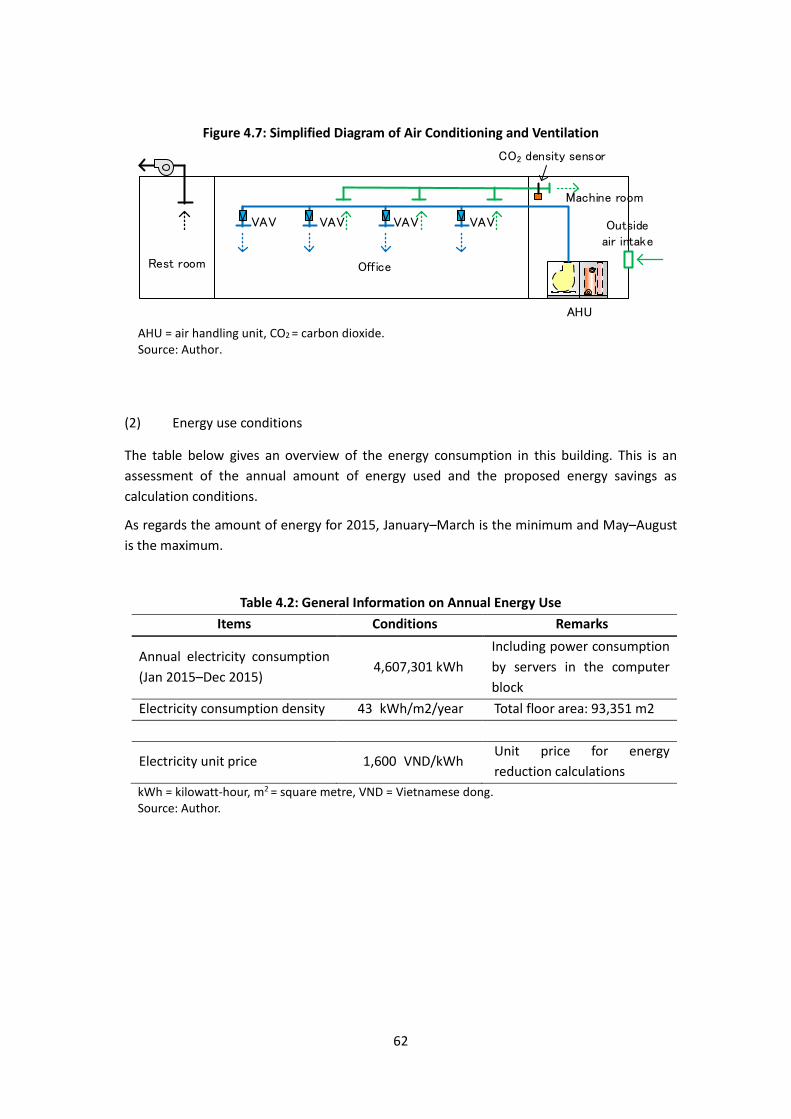
Figure 4.7: Simplified Diagram of Air Conditioning and Ventilation
AHU = air handling unit, CO2 = carbon dioxide. Source: Author.
(2) Energy use conditions
The table below gives an overview of the energy consumption in this building. This is an
assessment of the annual amount of energy used and the proposed energy savings as
calculation conditions.
As regards the amount of energy for 2015, January–March is the minimum and May–August
is the maximum.
Table 4.2: General Information on Annual Energy Use
Items Conditions Remarks
Annual electricity consumption
(Jan 2015–Dec 2015) 4,607,301 kWh
Including power consumption
by servers in the computer
block
Electricity consumption density 43 kWh/m2/year Total floor area: 93,351 m2
Electricity unit price 1,600 VND/kWh Unit price for energy
reduction calculations
kWh = kilowatt-hour, m2 = square metre, VND = Vietnamese dong. Source: Author.
Office
Machine room
AHU
Outside air intake
Rest room
VAV VAV VAV VAV
CO2 density sensor

63
Figure 4.8: Annual Electricity Consumption, 2015
EPS = external power supply, kWh = kilowatt-hour. Source: Author.
(3) Energy management conditions
During the interview with the facility manager and walk-through survey on site, a five-stage
evaluation was carried out on six categories regarding the energy management conditions at
the facility. There are four to five concrete items for evaluation in each category, the details of
which are shown in the diagram below.
The visible representation of energy management shows that it is good in terms of
maintenance but falls short in the other four categories.
Figure 4.9: Energy Management Conditions
Source: Author.
0
0.1
0.2
0.3
0.4
0.5
0.6
0.7
0.8
0.9
1
0
100,000
200,000
300,000
400,000
500,000
600,000
1 2 3 4 5 6 7 8 9 10 11 12
2015
Po
we
r d
em
and
[kW
]
Ele
ctri
city
Co
nsu
mp
tio
n [
kWh
]
EPS Power demand
0
1
2
3
4
5
Managementsystem
Operatingmanagement
Measurement &Record
Maintenance
Visualization ofenergy
Efforts toenergy saving
Legends5: Excellent4: Very Good3: Good2: Resonably Good1: Poor

64
Table 4.3: Evaluation on Energy Management Conditions
Items Question Answer Score Sum
Management system
Organisation in place?
Is there a designated person or post with responsibility for energy management
Under review
0.50
2.5
Announcement of main goals
Any promotion by posters, slogans etc. No action 0.00
Coordination with related posts
Are several members of personnel actively participating?
In practice 1.00
Record of activities Are energy management activities recorded? No action 0.00
Systematic training of personnel
Is training provided for personnel working on energy management?
In practice 1.00
Operating management
Operating standard Are there any operating standards for main systems?
In practice 1.25
1.9 Operation managers
Are there any designated operation managers in accordance with standards?
Under review
0.63
Peak power management
Is attention paid to peak power using demand meter etc?
No action 0.00
Review of standards Are operating standards revised on an as needed basis?
Under review
0.00
Measurement & Record
Energy consumption
Are there records (paper chits, memos etc.) of energy usage?
In practice 1.00
2.5
System operation period
Are operating times recorded for main combustion, cooling, lighting systems etc.
In practice 1.00
Separate energy measurements
Knowledge of energy usage according to different departments or application?
No action 0.00
Data on system operation conditions
Are measurements of temperature, illuminance, current etc. taken?
No action 0.00
Quality control Is there any precision management, calibration of main meters?
Under review
0.50
Maintenance
Maintenance and inspection standards
Are there any standards for maintenance and inspection of main systems?
In practice 1.25
4.4
Maintenance and inspection log
Are there any records of maintenance and inspection of main systems?
In practice 1.25
Drawing maintenance
Are as-built and system drawings maintained? Under review
0.63
Scheduling of repairs and renewals
Are scheduled repairs or renewals planned based on the inspection records?
In practice 1.25
Visualization of energy
Energy graph preparation
Are graphs showing energy data prepared? In practice 1.00
4.0
Previous year's data comparison
Is there energy data from the previous year? Under review
0.50
Distribution of data Is there internal distribution of energy usage conditions?
In practice 1.00
Energy intensity management
Is there any management of energy intensity? In practice 1.00
Data analysis Is analysis of increases or decreases in energy usage carried out?
Under review
0.50
Efforts to energy saving
Target setting Are there any target settings for energy saving? In practice 1.25
3.1 Target review Is there a review of energy saving targets? In practice 1.25
System improvement Is there any implementation or review of system improvements or remedial measures?
Under review
0.63
Results of improvement
Is there any verification of the efficacy of improvements or remedial measures?
Under review
0.00
Source: Author.
65
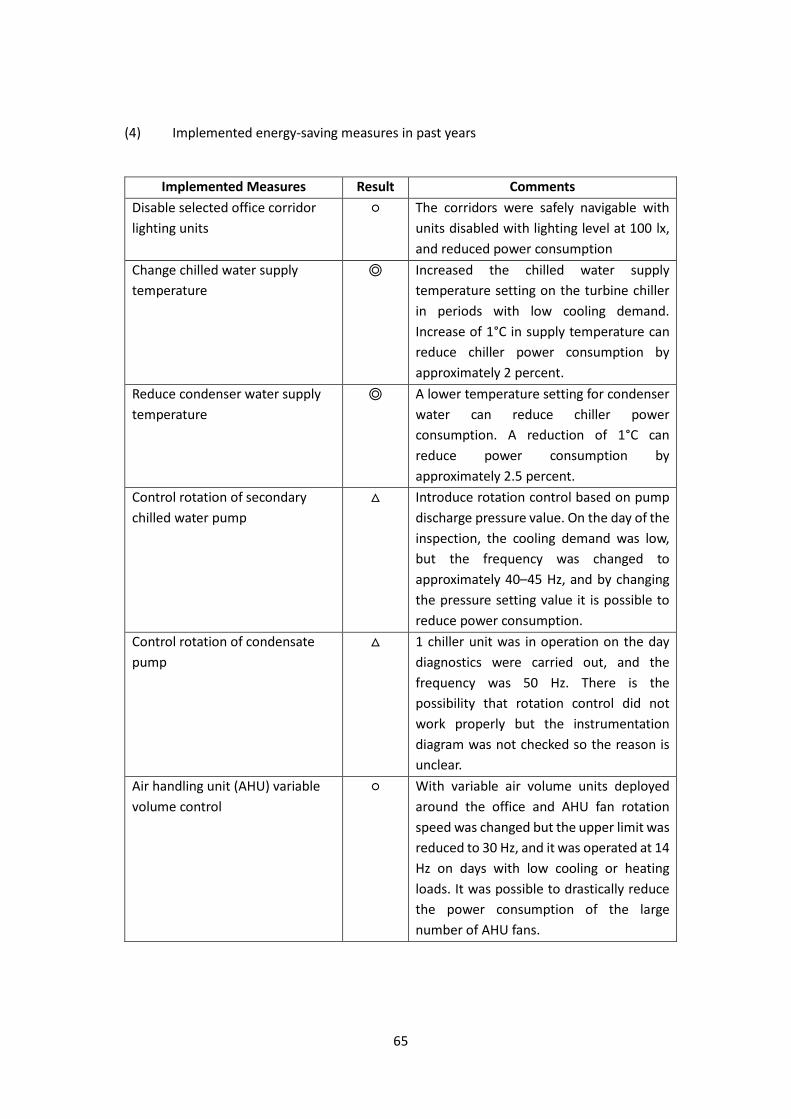
(4) Implemented energy-saving measures in past years
Implemented Measures Result Comments
Disable selected office corridor
lighting units
○ The corridors were safely navigable with
units disabled with lighting level at 100 lx,
and reduced power consumption
Change chilled water supply
temperature
◎ Increased the chilled water supply
temperature setting on the turbine chiller
in periods with low cooling demand.
Increase of 1°C in supply temperature can
reduce chiller power consumption by
approximately 2 percent.
Reduce condenser water supply
temperature
◎ A lower temperature setting for condenser
water can reduce chiller power
consumption. A reduction of 1°C can
reduce power consumption by
approximately 2.5 percent.
Control rotation of secondary
chilled water pump
△ Introduce rotation control based on pump
discharge pressure value. On the day of the
inspection, the cooling demand was low,
but the frequency was changed to
approximately 40–45 Hz, and by changing
the pressure setting value it is possible to
reduce power consumption.
Control rotation of condensate
pump
△ 1 chiller unit was in operation on the day
diagnostics were carried out, and the
frequency was 50 Hz. There is the
possibility that rotation control did not
work properly but the instrumentation
diagram was not checked so the reason is
unclear.
Air handling unit (AHU) variable
volume control
○ With variable air volume units deployed
around the office and AHU fan rotation
speed was changed but the upper limit was
reduced to 30 Hz, and it was operated at 14
Hz on days with low cooling or heating
loads. It was possible to drastically reduce
the power consumption of the large
number of AHU fans.
66
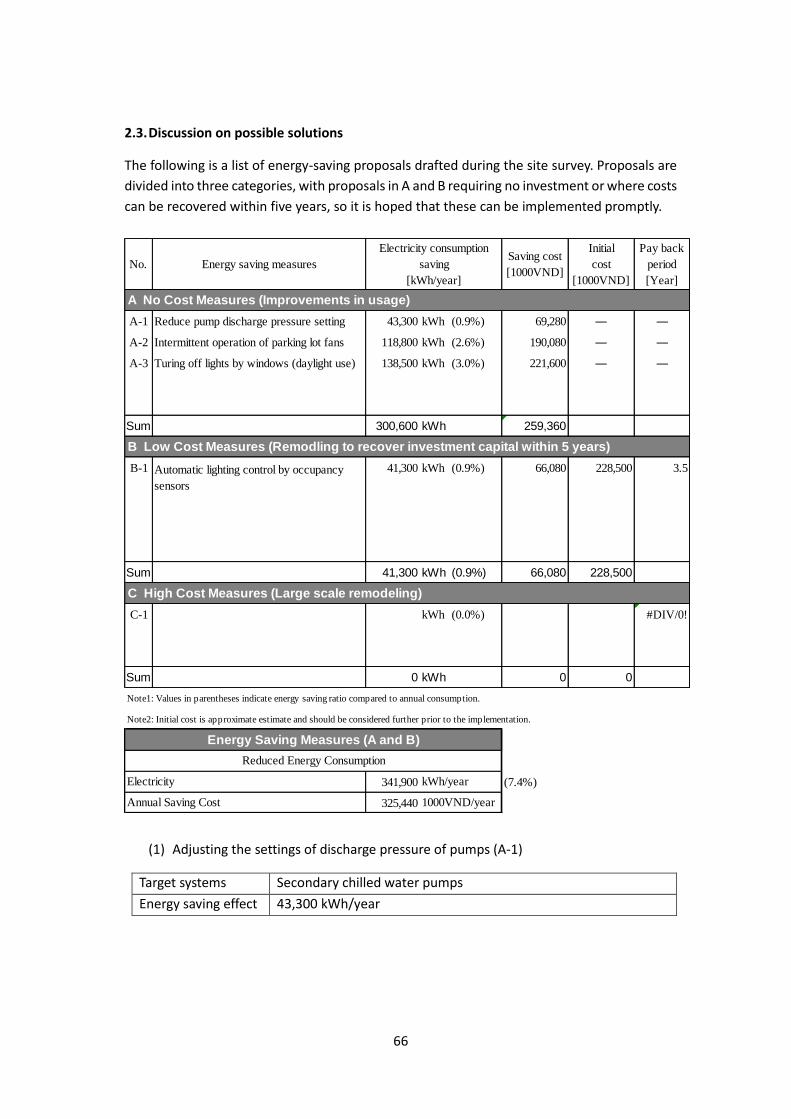
2.3. Discussion on possible solutions
The following is a list of energy-saving proposals drafted during the site survey. Proposals are
divided into three categories, with proposals in A and B requiring no investment or where costs
can be recovered within five years, so it is hoped that these can be implemented promptly.
(1) Adjusting the settings of discharge pressure of pumps (A-1)
Target systems Secondary chilled water pumps
Energy saving effect 43,300 kWh/year
No. Energy saving measuresSaving cost
[1000VND]
Initial
cost
[1000VND]
Pay back
period
[Year]
A No Cost Measures (Improvements in usage)
A-1 Reduce pump discharge pressure setting 43,300 kWh (0.9%) 69,280 ― ―
A-2 Intermittent operation of parking lot fans 118,800 kWh (2.6%) 190,080 ― ―
A-3 Turing off lights by windows (daylight use) 138,500 kWh (3.0%) 221,600 ― ―
Sum 300,600 kWh 259,360
B Low Cost Measures (Remodling to recover investment capital within 5 years)
B-1 41,300 kWh (0.9%) 66,080 228,500 3.5
Sum 41,300 kWh (0.9%) 66,080 228,500
C High Cost Measures (Large scale remodeling)
C-1 kWh (0.0%) #DIV/0!
Sum 0 kWh 0 0
Note1: Values in parentheses indicate energy saving ratio compared to annual consumption.
Note2: Initial cost is approximate estimate and should be considered further prior to the implementation.
341,900 (7.4%)
325,440
Electricity consumption
saving
[kWh/year]
Energy Saving Measures (A and B)
Reduced Energy Consumption
Electricity kWh/year
Annual Saving Cost 1000VND/year
Automatic lighting control by occupancy
sensors
67
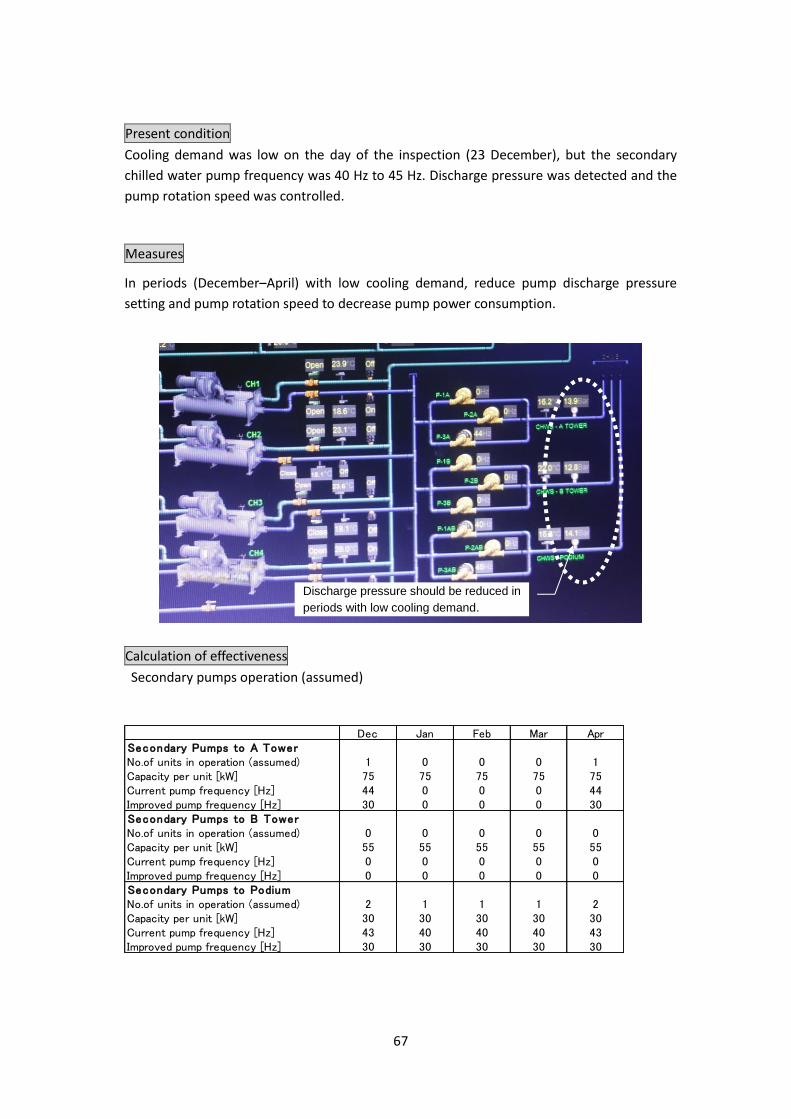
Present condition
Cooling demand was low on the day of the inspection (23 December), but the secondary
chilled water pump frequency was 40 Hz to 45 Hz. Discharge pressure was detected and the
pump rotation speed was controlled.
Measures
In periods (December–April) with low cooling demand, reduce pump discharge pressure
setting and pump rotation speed to decrease pump power consumption.
Calculation of effectiveness
Secondary pumps operation (assumed)
Dec Jan Feb Mar AprSecondary Pumps to A TowerNo.of units in operation (assumed) 1 0 0 0 1Capacity per unit [kW] 75 75 75 75 75Current pump frequency [Hz] 44 0 0 0 44Improved pump frequency [Hz] 30 0 0 0 30Secondary Pumps to B TowerNo.of units in operation (assumed) 0 0 0 0 0Capacity per unit [kW] 55 55 55 55 55Current pump frequency [Hz] 0 0 0 0 0Improved pump frequency [Hz] 0 0 0 0 0Secondary Pumps to PodiumNo.of units in operation (assumed) 2 1 1 1 2Capacity per unit [kW] 30 30 30 30 30Current pump frequency [Hz] 43 40 40 40 43Improved pump frequency [Hz] 30 30 30 30 30
Discharge pressure should be reduced in
periods with low cooling demand.

68
Electricity reduction
Electricity unit price (assumed) 1,600 VND/kWh
Annual saving cost 69,280,000 VND/year
Matters that should be noted
Inverters used for pump rotation speed control make it possible to set the frequency variable
band. To further reduce pump power consumption, the lower limit of the frequency value to
be set at approximately 30 Hz, should be checked beforehand. When this lower limit is at a
high value (e.g. 40 Hz), then the value cannot drop below 40 Hz, even if the reduce signal is
output from the control unit, and there may be no reduction in pump energy use.
Dec Jan Feb Mar Apr SumSecondary Pumps to A TowerCurrent electricity consumption [kWh] 12,778 0 0 0 12,778Improved electricyty consumption [kWh] 4,050 0 0 0 4,050Electricity reduction [kWh] 8,728 0 0 0 8,728 17,455Secondary Pumps to PodiumCurrent electricity consumption [kWh] 9,541 7,680 7,680 7,680 9,541Improved electricyty consumption [kWh] 3,240 3,240 3,240 3,240 3,240Electricity reduction [kWh] 6,301 4,440 4,440 4,440 6,301 25,922Total electricity reduction [kWh] 43,377Calculation condition ↓Operation hours: 180 hours per month (9 hours × 20 days/month) 43,300Inverter efficiency: 0.9Pump efficiency: 0.8
Fixed at 50Hz
(Full Power)

69
(2) Intermittent operation of parking lot extraction fans (A-2)
Target systems Supply fans and exhaust fans
Energy saving effect 118,800 kWh/year
Present condition
The purpose of the ventilation in the parking lot is to exhaust fumes from vehicles. Presently,
the fans operate continually during business hours.
Measures
Operate the fans only during the morning and evening commuting periods of approximately
1.5 hours each and lunch hours, providing ventilation only during cars’ arrival at and departure
from the parking lot. Shutting down the fans beyond these periods will reduce power
consumption.
Calculation of effectiveness
Supply fan capacity 11 kW×1 unit×3 floors
Exhaust fan capacity 11 kW×1 unit×3 floors
Operation hours (current) 11 hours×240 days/year
Operation hour (improved) 4 hours×240 days/year
Electricity unit price (assumed) 1,600 VND/kWh
Electricity reduction 11 kW×2 units×3 floors×(11h-4h)×240 days/year
= 118,800 kWh/year
Annual saving cost 190,080,000 VND/year
Matters that should be noted
Before implementing this proposal, the conditions during morning and evening rush hours
when vehicles are arriving or leaving should be checked and CO2 concentrations measured,
with a final check on the exhaust fan operating periods.
Current → 11h/day
Improved → 4h/day
2418 19 20 21 22 2312 13 14 15 16 176 7 8 9 10 110 1 2 3 4 5
70
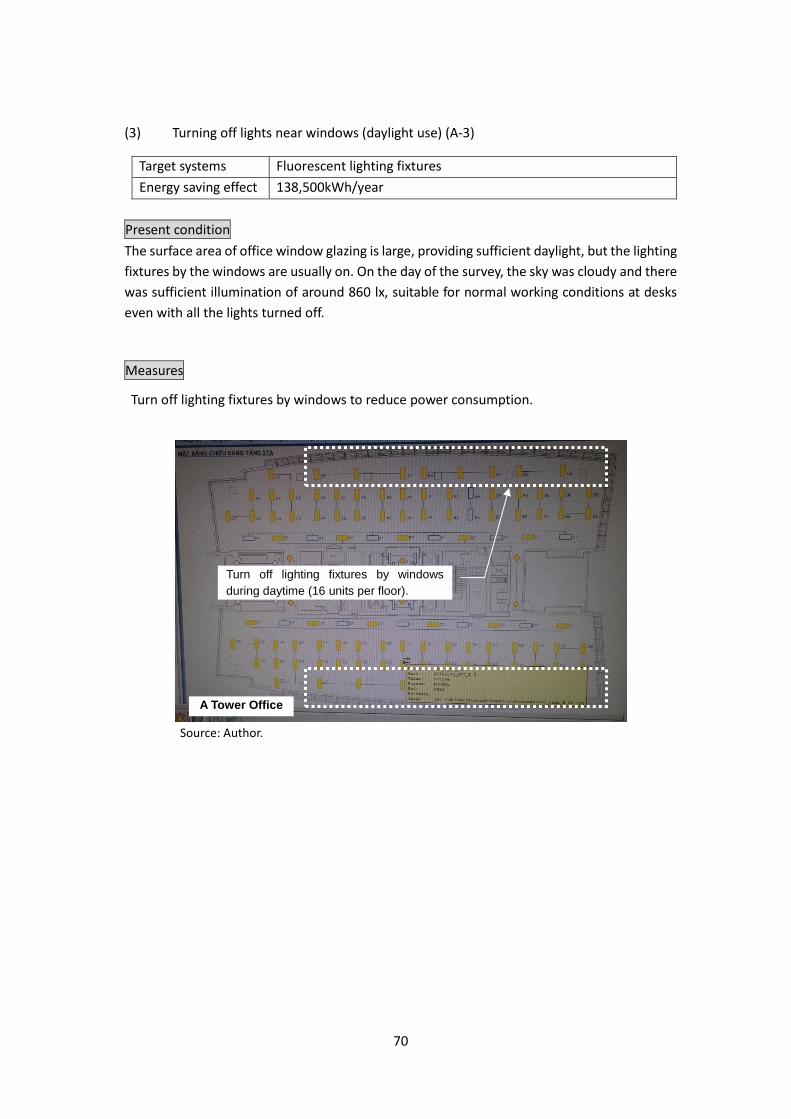
(3) Turning off lights near windows (daylight use) (A-3)
Target systems Fluorescent lighting fixtures
Energy saving effect 138,500kWh/year
Present condition
The surface area of office window glazing is large, providing sufficient daylight, but the lighting
fixtures by the windows are usually on. On the day of the survey, the sky was cloudy and there
was sufficient illumination of around 860 lx, suitable for normal working conditions at desks
even with all the lights turned off.
Measures
Turn off lighting fixtures by windows to reduce power consumption.
Source: Author.
Turn off lighting fixtures by windows
during daytime (16 units per floor).
A Tower Office

71
Source: Author.
Calculation of effectiveness
Lighting fixture by windows A Tower: (40 W×3 bulbs)×16 units×29 floors (5th to 33rd)
B Tower: (40 W×3 bulbs)×12 units×25 floors (5th to 29th)
Annual lighting hours 9 hours×240 days/year=2,160 hours/year
Usage rate of the fixtures (assumed) 70%
Electricity unit price 1,600 VND/kWh
Electricity reduction A Tower (40 W×3)×16 units×29 floors×2,160×0.7=84,100 kWh
B Tower (40 W×3)×12 units×25 floors×2,160×0.7=54,400 kWh
Sum 138,500 kWh/year
Annual saving cost 221,600,000 VND/year
Matters that should be noted
Conditions vary depending on the arrangement of the office equipment and the direction of
seats. All conditions near all windows inspected, implementation of this proposal is possible
by changing the schedule of BEMS on possible floors.
B Tower Office
B
Turn off lighting fixtures by windows
during daytime (12 units per floor).

72
Source: Author.
(4) Automatic lighting control by occupancy sensors (B-1)
Target systems Fluorescent lighting fixtures
Energy saving effect 41,300 kWh/year
Present conditions
The lighting along office corridors is normally on. In Japan, there is an increasing installation
of occupancy sensors.
Measures
Install occupancy sensors in office corridors in tower blocks to be turned on only when
occupants are present to reduce power consumption.

73
Source: Author.
Calculation of effectiveness
Lighting fixture by windows A Tower: (40 W×3 bulbs)×11units×29 floors (5th to 33rd)
Annual lighting hours 9 hours×240 days/year=2,160 hours/year
Light-out rate 50%
Electricity unit price 1,600 VND/kWh
Electricity reduction A Tower (40 W×3)×11 units×29 floors×2,160×0.5=41,300 kWh
Annual saving cost 66,080,000 VND/year
Investment cost (estimate) 228,500,000 VND
Recovery period 3.5 years
Turn off lighting fixtures in unused time
(11units per floor).
A Tower Office
74
3. Key Findings from the Case Studies
The results of the three case studies show that air-conditioning load is a major energy
consumption at office buildings in the ASEAN region and that lighting optimisation is also an
effective energy-saving measure, except uncontrollable load (i.e. personal computers and
servers). This study identified the following three main points for improving energy efficiency
for office buildings in the region.
First point: To optimise the ventilation of intake outdoor air and discharge indoor air. The
amount of energy consumption is caused by the distribution of cool and dry air in the ASEAN
region where the atmosphere is high-temperature and humid. Many buildings still cannot
control air intake and discharge. Most often, intake and discharge is set to full power even
inverter-driven motors are implemented. As a result, surplus energy is required for heat source
machine power (i.e. chillers) and cooling water transporting power (i.e. pumps) to cool and
dehumidify the outdoor air, instead of discharge cool and dry air.
To optimise ventilation, one effective measure is to monitor CO2 density in office floor.
Approximately 400 parts per million (ppm) to 700 ppm shall be excessive because the standard
CO2 density of outdoor air is around 450 ppm. It is better to find optimum value up to a ceiling
of 1000 ppm due to human health and comfort.
In addition, the intermittent operation of exhaust fans at a car park can be an energy-saving
measure because of enough apertures or because of fixed office hours. For buildings which
cannot control continuous ventilation, it is also effective to install motor dampers which
installation is relatively inexpensive compared with other energy-saving measures.
Second point: To optimise the setting of inverter frequency. Inverter-driven motors are now
installed in various places in air-conditioning system (i.e. chillers and pumps). Inverter-control
driving force can be reduced to 25 percent when rotation speed is reduced in half because
driving force is proportional to the square of the rotational speed. Moreover, electricity
consumption can be reduced to 12.5 percent (−87.5 percent) because power consumption is
the product of flow rate and driving force, This means that inverter-driven motor shall be a
key function for energy conservation at office buildings.
However, in the field, operation frequency is often set to maximum and is stable regardless of
the condition of the buildings, even if inverter-driven motors are installed. In this case,
electricity consumption shall be almost the same with or without inverter-driven motors.
Installing inverter-driven motors and setting appropriate frequency by the administrator are
necessary to recover the investment. Also, the setting should vary depending on the outdoor
temperature, season, humidity, and characteristics of the buildings. For this reason, the first
step for improving the setting is to measure the parameters by human resources or BEMS.
Third point: To optimise the office lighting by dimming lighting bulbs or continuous lux control.
In general, enough sunlight is continuously derived through the windows during the business
hour. In this case, intermittent lighting near the windows shall be considered. Use of human
sensors for lighting becomes reasonable to disseminate in recent years, which sensors

75
automatically turn on and off using infrared. These sensors are applicable along passages or in
washrooms.
Moreover, optimisation of lighting shall be performed for promoting energy conservation to
employees. Several demonstrations are carried out for implementing human sensors, LED
lightings, and lux metres to integrate acquired data by BEMS. Some of the systems have
already implemented feedback-control mechanism. However, it is effective enough for the
employees to make it a habit to turn on and off the lighting when necessary.