chapter 4 case studies on plate and connector castings...
TRANSCRIPT

49
CHAPTER 4
CASE STUDIES ON PLATE AND CONNECTOR CASTINGS
Two case studies were conducted to verify the use of simulation
software in an industry environment. The First case study was a plate
casting, weight of the casting 129kg made from alloy steel by the GS
alloy steel Castings limited, Surampalli, Krishna (Dist); Andrapradesh.
The tests conducted in this case study used ProCAST to find potential
defects in the casting at different locations and compare them with the
real casting design and to find possible outcomes and modifications
attempted to improve the existing casting design. The modification of
existing Riser and Gating Design were changed to improve the existing
casting design, riser, and gating systems with improved yield for the
casting from scratch and compare the calculated dimensions and
resulting simulations with the existing casting design, material for
casting H13 alloy steel chosen Chemical composition given
Table.6;and mould material is CO2 sand mould.
Table:4.1.Chemical Composition of H13 Steel
S No Element % Composition
1 Carbon 0.405
2 Manganese 0.35
3 Silicon 1.0
4 Chromium 5.125
5 Molybdenum 1.425
6 Vanadium 1.0

50
4.1 CASE STUDY ON PLATE CASTING
Distortion (Non uniform contraction) and hot tearing are closely
related. The forces that causes distortion can also cause hot tearing ,if
they are great enough or are applied at critical point. These forces
results from differences in the time at which various parts of a casting
freezes and start to contract, and from the resistance offered by
unyielding mould section. The solidification time differences and the
mould resistance both act to restraint normal contraction of the
metal. This restraint can result in residual stress, distortion or hot
tearing depending on the magnitudes of force and restraint. Distortion
of a casting can be caused or eliminated by the gating and risering
system used in producing the casting .When casting froze and become
rigid, the contractive forces of runner would have bowed the casting
towards the runner. This possibility of distortion was anticipated and
two short runners were used rather than one long one. No discernible
distortion occurred in second case. Gating and risering can influence
distortion in still another way. In general, the flow path of the molten
metal, as determined by the gate location controls the direction of
solidification. This has a direct bearing on the contraction of the
metal, as is shown in the Fig:4.1, which record the distortion that was
encountered in the cored holes of two investment casting. As cast the
holes were somewhat elliptical, the measurement of dimension B
being greater than those of dimension A.

51
Fig:4.1 Distortion from roundness of the cored holes in these two
casting was related to the location of gate[7].
In the present case, Plate casting with runner and riser
designed as proposed during the foundry trial by the company (Test 1)
is considered. After analyzing the plate casting in Procast, with
appropriate properties like thermal, material and process parameters.
The output indicates maximum effective stress of 263-283 MPa at the
end corners, near the hole. The end ingate also shows stresses of
magnitude around 283 MPa. The middle portion of the long edge of
plate is also showing the stress value 222-243 MPa. Effective strain is
0.0497 to 0.0348 at the end corner of a plate near hole. Hot tearing
indicator [81] value is 0.0023 at the end corner. After maximizing the
displacement magnitude the plate is showing distortion at the corner
end. The displacement of one corner is 0.3372 cm, and other corner is
0.1597 cm. and maximum shear stress is around 148 MPa at the hole
edge. (Fig:4.2 to Fig:4.5). Thus from the analysis of the above result it
is observed that the problem is at last ingate position and it is
stressed more and distortion occurs at the end corner. Hence in the

52
next analysis model ingate position is changed and it is shifted from
end corner towards the core. The new model is created with above
changes and analysis is carried out for the improved ingate position
suggested in Plate model (Test 2). Results of analysis shows that the
effective stress is reduced to 228–247 MPa. around the hole edges and
at the middle portion of the long edge of plate the stress is hardly 152
-190 MPa only. Effective strain is reduced to 0.0153 around the hole
edges and at its maximum value is 0.0332 at other location. Hot
tearing indicator value is further reduced to 0.00093 at the long edges
of plate. Maximum shear stress shows 137 -148 MPa at the end
portion of a plate. The plate is not showing any distorted corner after
magnifying the displacement magnitude but the displacement of edge
corner is 0.1322 cm and 0.1514 cm. (Fig:4.6 to Fig:4.9).
This clearly indicates that quality of cast in second case is
better, though the problem is not solved completely. Though the
model is showing the less stress value as compared to previous model
but still it is having stresses above normal value, resulting some
distortion. Now design of the runner system is changed, and two
runner one on each side of the long edges of plate is used. The
provision of ingates on both long sides of plate results metal being
flown from both directions simultaneously, resulting uniform flow
throughout. The end of plate having L shaped bend required large
material during filling as compared to the other end. Hence the area of
ingate is increased gradually.

53
For this changed design of runner and ingate (Test 3) the plate
is further analyzed. The analysis result shows maximum effective
stress as 120-130 MPa at the ingate location in plate and also at some
point around the hole edge. It is almost half of the previous model.
The middle portion of long edge of plate, having effective stress of only
51-68 MPa. against 152-190 MPa. in earlier case. This supports the
improvement of quality of casting. Only the region of junction of ingate
with plate showed a high stresses around 120-137 MPa. Maximum
shear stress in the plate is 75 MPa. The sharp corner at the ingate
and plate junction results stress concentration. The effective strain is
0.3302-0.4623 at the ingate edge indicates a new problem. After
maximizing the displacement magnitude, the plate is distorted at the
ingate junction. The distortion takes place at the junction both in
plate as well as in ingate. Hot tearing indicator shows a value of
0.0204 at the ingate corner. (Fig:4.10 to Fig:4.13).
This model shows a less stress region as compared to previous
one model but there is stress concentration at the ingate junction and
plate which results distortion and hot crack region as observed at the
junction. To avoid the sharp corner at the junction of ingate, it is
suggested to have fillet at all corners of ingate. The part is analyzed to
check the effectiveness of fillet at corner of ingate.In this improvised
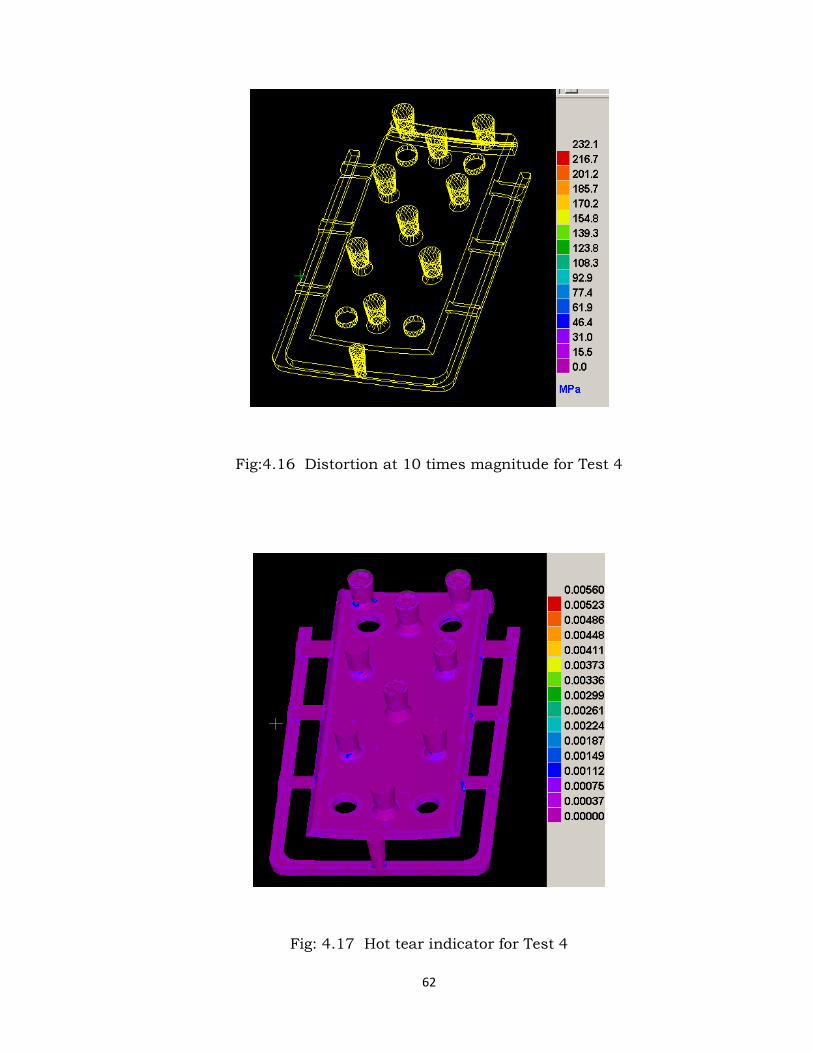
model (Test 4). The analysis result shows effective stress of 93 MPa at
the junction towards ingate side only, and towards plate side is of 77
MPa near ingate. A stress of 123 MPa is occurring over very small area

54
at some region between long edge and hole. The stress in ingate is
reduced .and effective plastic strain is 0.0000055 only. Effective shear
stress is 75 MPa around the hole, and middle edge portion shows a
25MPa against 51-68 MPa in earlier case. (Fig:4.14 to Fig:4.18). As the
effective strain is further reduced and no appreciable distortion is
observed throughout the cast plate. The casting gating system with
suggested modification (Test 4) results a better quality product. Table:
4.2 shows comparisons of all 4 Test model.
Table:4.2 Comparisons of all 4 Test model Results
TEST
Maximum Effective Stress (MPa)
Effective Plastic Strain
Hot tear Indicator
Z-Disp lacment
(cm)
Maximum Shear Stress
Yield
Test 1
283-263 (at end corner)
243-224
(at middle)
0.0497 -0.0348 (at end corner)
0.0023 (at end corner)
0.3372 (at end corner)
148
70
Test 2
247-228 (around
hole)
190-152 (at middle)
0.0332 (around
hole)
0.00093 (long edge)
0.1322 0.1514
(at corner)
148-137
70
Test 3
120-130 (at ingate)
68-51
(at middle)
0.4623 0.3302
(at ingate corner)
0.0204 (at ingate corner)
0.001
-0.860 (at ingate )
75
62
Test 4
93-71 (at ingate corner)
25-20
(at middle)
0.000055 (around
hole)
0.00075 (long edge)
0.029 (at end edge)
75
62

55
Fig:4.2 Effective Stress for Test 1
Fig:4.3. Effective Strain for Test 1

56
Fig:4.4. Distortion after Magnifying the Displacement Magnitude by 10
Fig:4.5 Displacement along Z-axis for Test 1

57
TEST 2
Fig: 4.6 Effective stress for Test 2
Fig:4.7 Effective Strain for Test 2

58
Fig:4.8 Hot Tear Indicator for Test 2
Fig: 4.9 Z Displacement for Test 2

59
TEST 3
Fig:4.10 Effective Stress for Test 3
Fig:4.11 Effective Strain for Test 3

60
Fig:4.12 Distortion after magnifying the displacement magnitude by
10 for Test 3
Fig:4.13 Z displacement for Test 3

61
TEST 4
Fig:4.14 Effective Stress for Test 4
Fig: 4.15 Effective Plastic strain for Test 4
62
Fig:4.16 Distortion at 10 times magnitude for Test 4
Fig: 4.17 Hot tear indicator for Test 4

63
Fig:4.18 Z- Displacement for Test 4
4.2 CONNECTOR CASTING
The objective of second case study was to know the features of
the ProCAST casting solidification of non ferrous metals, with the
ultimate goal of being able to help foundry men, engineers and
managers take hold of the potential benefits of using simulation
techniques for casting yield and quality improvement.
4.2.1 Illustrative Example
A relatively complex component was selected to demonstrate all
the elements of the ProCAST simulation system. The component is a
connector or bracket having weight of the casting 80Kg consisting of
two cylindrical shaft cavities perpendicular to each other and
connected by a narrow plate[89] shown in Fig:4.19 the material is an
aluminum alloy (Al-7Si-3Mg) and the component is produced by a
sand casting driven, sand mould casting process. To produce a part
with the required quality the casting system requires a pouring cup, a

64
sprue and a sprue basin, two short runners at the exit of the sprue
basin, two ceramic filters and two longer runners. Finally, two risers
are used (one for each of the shaft holes). Moreover, two sand cores
are required to form the shaft cavities and the entire assembly is
enclosed in a sandbox not shown (Fig:4.20).
The model of the casting system was built using CAD. The CAD
model was read into MeshCAST and a compatible, high quality finite
element mesh shown in Fig:4.21.was constructed for all the
components (including the sand box). Despite the considerable
technical sophistication of the software, this process can be tedious,
time consuming and labor intensive but the end result was a high
quality mesh appropriate for computation consisting of 222,167
elements and 46,976 nodes in this case. The PreCAST module was
next used to assign thermo physical properties to all the components
of the casting system. The assigned properties were extracted from the
extensive material database contained in ProCAST. Properties used
included temperature dependent thermal conductivity, density,
specific heat, latent heat of fusion and solidus and liquidus
temperatures as well as viscosity. For the specification of heat
transport at metal-mould, metal-core and core-mould interfaces,
suitable functional forms of temperature dependent heat transfer
coefficients were used and an appropriate value for the heat transfer
coefficient from the outer boundary of the sand box into the ambient
was introduced. Last, the pouring velocity and temperature of metal

65
into the pouring cup were specified as (Pouring Velocity 0.8 m/Sec,
Pouring Temperature 6900C and, as well as the initial temperature of
the sand mould and cores Temperature 300C). With the given
parameters the mould cavity became completely full with metal in
about 6 seconds and solidification was complete after about 15
minutes (940 seconds). The complete simulation took about 1 hr 15
min on a personnel computer.
4.2.2 Results
A few selected results are now presented. The computed results are
best visualized as movies. Still frames can be readily obtained as well
as precise numerical values for x-y plots. A still frame of the casting at
an intermediate stage during the mould cavity filling process is shown
in Fig:4.22 the velocity field in the molten metal is illustrated by using
vectors as well as indicating the magnitude of the velocity in the color
scale. The free surface of the melt indicates that filling is about half
way through. The goal of the gating system is to initiate the molten
metal into the cavity as quickly and as gently as possible. The area of
relatively high velocity at the cast part intake could create some
problems.
The corresponding computed melt temperatures at about the
same time are shown in Fig:4.23& Fig:4.24. The pictures shows that
some of the metal has lost its superheat and is approaching the
liquidus temperature of 6160C .The Contours of solid fractions at
different time intervals and near completion of casting solidification

66
was observed area of the bracket that is last to solidify. The location of
that hot spot is not far from the raiser intake into the casting. The
software also includes some capabilities for the calculation of some
important micro structural parameters resulting from solidification.
The computed secondary dendrite arm spacing is shown in the
Figures. Although the spacing is rather uniform on the shaft arms, it
is coarser in an area on the connecting plate near the raiser intake
(this being the latest point to solidify). This heterogeneity may have a
negative effect on the bracket properties.
In the sequel, entire simulations produced from the computed
results are included. To allow visualization of the results the sandbox
has been removed from the display. Moreover, the cores have also
been removed to facilitate the visualization. From the data stored
simulated results during the mould filling and solidification process
was studied at different time intervals. Shape of the incoming liquid
metal surface the inrushing liquid metal is illustrated by its free
surface as it moves to fill the mould cavity. Shown in Fig: 4.25 to 4.29
the calculated metal temperature is superimposed on the metal
surface as a colour maps. Shown in Figures:4.30 to 4.33 the metal
surface in the bracket has fully solidified after about 100 seconds
while that in the risers takes twice as long. After 940 seconds of
simulated time no point in the casting system is above 5000C.
The second stage results show the calculated metal velocity and
pressure. The velocity is illustrated through the use of vectors and the

67
pressure field is indicated by the colour map. Clearly, velocity is only
meaningful during the mould filling stage (the first 6-7 seconds of the
process). The Fig. 4.34 to 4.36 show how the liquid metal rushes down
the sprue and into the runners to fill the risers and then the casting
proper. A big pressure drop is noticeable as the metal flows through
the porous filters inserted along the runner paths and the pressure
becomes quite uniform during filling of both risers and the cast part
shown in Fig:4.37 and it is notice that the splashy nature of the liquid
metal surface as it flows into the risers and into the casting shown in
Fig:4.38. Subsequent to the mould filling time and nothing happens to
the pressure shown in Fig:4.39.The third stage results shows the
calculated fraction of solid phase in the bracket during the period of
time when it is solidifying. The yellow colour on the bracket
connection towards the end clearly shows that the area is the last one
to solidify shown in Fig:4.40 to 4.42.
4.2.3 Concluding Remarks
In alloy steel sand casting, and non ferrous foundries
computer simulation can be a useful tool for rapid process
development. Limitation of the conventional sand casting and gating
design has been elaborated. Advantages of computer simulation based
design were enumerated. The procedures thus described have been
demonstrated with the above case study of application of ProCAST
simulation at G.S alloy Foundry. It is demonstrated that the foundries

68
can derive mileage by resorting to FEM simulations of the casting
process for process development and optimization.
Fig:4.19. 3-D CAD Model of
casting Component.[89]
Fig:4.20. Casting component
with gating system.
Fig: 4.21.Mesh Cast [89]
Fig:4.22 Mould Filling pattern
velocity –magnitude.[89]
Fig:4.23 Mould Filling pattern
Temperature contours.
Fig:4.24.Solid fraction.[89]
Fig:4.25 initial stage of mould
filling after 0.6 sec

69
Fig: 4.26 mould filling after 3
sec
Fig:4.27 complete mould filled
after 6.5sec.
Fig:4.28 Temperature of liquid
metal after 2.8sec.
Fig:4.29 Temperature of liquid
metal after 3.6sec.
Fig:4.30 Temperature of liquid
metal after 6sec.
Fig:4.31 Temperature of liquid
metal after 0.6 sec

70
Fig:4.32 fluid velocity at .27sec
Fig:4.33 fluid velocity after
1.043sec
Fig:4.34 fluid velocity after
5.25sec
Fig:4.35 initial stage of mould
filling pressure is uniform at
0.3 sec
Fig:4.36 initial stage of mould
filling pressure is uniform at
1.8 sec
Fig:4.37 final stage of mould
filling pressure is uniform at
6.28 sec

71
Fig:4.38 Solid fraction after
19.927sec
Fig:4.39 Solid fraction after
149.92sec
Fig:4.40 Solid fraction after
209.932sec.
Fig:4.41 Solid fraction after
259.923sec[89]
Fig:4.42Solid fraction after
509.923sec[89]