chapter 3: regional information - city of alexandria, va · northern virginia hazard mitigation...
TRANSCRIPT

Northern Virginia Hazard Mitigation Plan Update
15
Chapter 3: Regional Information I. Northern Virginia Overview
A. Planning Region
The Northern Virginia planning region includes Arlington, Fairfax, Loudoun, and Prince William counties, as well as the cities and towns located within these counties (20 jurisdictions). The communities participating in the 2010 hazard mitigation plan update plan are summarized in Table 3.1 and graphically in Figure 3.1. The 2006 Hazard Mitigation Plan grouped the Northern Virginia region into four distinct planning areas within the Northern Virginia region to aggregate and summarize historical hazard events and damage figures (Table 3.1). During the kick-off meeting for the plan update it was decided that each jurisdiction should be represented individually; if no information is available it has been noted in the risk assessment.
Table 3.1. 2006 Planning Regions.
Planning Area Jurisdictions Included 1 Arlington County
2
Fairfax County City of Alexandria City of Fairfax City of Falls Church Town of Clifton Town of Herndon Town of Vienna
3
Loudoun County Town of Leesburg Town of Purcellville Town of Round Hill Town of Middleburg
4
Prince William County City of Manassas City of Manassas Park Town of Dumfries Town of Occoquan Town of Quantico Town of Haymarket
Fourteen jurisdictions participated in the 2006 Hazard Mitigation Plan. For this update, the six towns have joined the planning process and include Clifton, Middleburg, Round Hill, Haymarket, Occoquan, and Quantico.

Northern Virginia Hazard Mitigation Plan Update
16
Figure 3.1. Northern Virginia 2010 Hazard Mitigation Plan Update Region
Northern Virginia Hazard Mitigation Plan Update
17
1. County Profiles
Arlington County The area that encompasses present-day Arlington County was first settled as part of the British Colony of Virginia in the late 1690s. In 1791, George Washington surveyed the area in what was to become the District of Columbia. Congress returned the area to the Commonwealth of Virginia in 1842 as the County of Alexandria. In 1870, the City of Alexandria became independent of Alexandria County, and the county portion was officially renamed Arlington County in 1920. The 2009 census estimate for the county is 212,038, an approximately 12% increase during the past decade. Arlington is an urban county of about 26 square miles located directly across the Potomac River from Washington DC. Arlington’s central location in the Washington DC metropolitan area, its ease of access by car and public transportation, and its highly skilled labor force have attracted an increasingly varied residential and commercial mix. Arlington is one of the most densely populated communities in the nation with more than 7,315 persons per square mile.
Arlington’s high population density and its location along the banks of the Potomac River, increase the city’s vulnerability to a variety of hazards, most notably flooding. In addition to snow melt and rain-related river flooding episodes, Arlington is also subjected to tidal and storm surge flooding. As sea levels rise, permanent inundation of low lying areas along and near the river shoreline is also a threat. Additionally, winter storms pose significant threats, as evidenced during the 2009 – 2010 winter season.
Fairfax County The land that is now Fairfax County was part of the Northern Neck Proprietary granted by King Charles II in 1660 and inherited by Thomas Fairfax, Sixth Lord Fairfax of Cameron, in 1719. The county itself was formed in 1742 from Prince William County. The 2009 census population estimate for the county is 1,036,473, an approximately 7% increase during the past decade. Fairfax County comprises about 407 square miles located directly across the Potomac River from Washington, DC. The county’s location in the Washington metropolitan area, its ease of access by car and public transportation, and its highly skilled labor force have attracted an increasingly varied residential and commercial mix. Most commercial development is centered around Tysons Corner, which is the 12th largest central business district in the nation.
Due to its situation on both the Virginia piedmont and the Atlantic coastal plain, the County experiences a variety of weather. The diversity of Fairfax County’s landscape increases the County’s vulnerability to a variety of hazards, most notably flooding and severe storms. In addition to snow melt and rain-related river flooding episodes, low-lying areas of Fairfax County along the Potomac River are also subject to tidal and storm surge flooding. As sea levels rise,

Northern Virginia Hazard Mitigation Plan Update
18
permanent inundation of low lying areas along and near the river shoreline is also a threat. Additionally, winter storms pose significant threats, as evidenced during the 2009 – 2010 winter season.
Loudoun County Loudoun County was established in 1757 and was formerly part of Fairfax County. It was named after John Campbell, Fourth Earl of Loudoun and past Governor of the Commonwealth of Virginia. It was the most populous Virginia county during the time of the American Revolution. Since 1757, the county seat has always been the Town of Leesburg. In 2010, Loudoun County was ranked by Forbes as America’s wealthiest county. The County has a total area of 521 square miles, of which one square mile is water. As of the 2000 Census, it has a population density of 272 per square mile. The population was estimated to be approximately 298,113 in 2009 by the U.S. Census Bureau, a nearly 76% increase over the 2000 population of 169,599. Geographically, Loudoun County is bounded to the North by the Potomac River, to the south are Prince William and Fauquier counties, and on the west by the watershed of the Blue Ridge Mountains. The Bull Run Mountains and Catoctin Mountain run through the County. There are seven incorporated and 60 unincorporated towns within the County. Risk factors for the county are in part due to its proximity to the Nation’s capital and its growth rate. The county has a risk of flooding due to low lying areas surrounding the Potomac River and other natural hazards and risks, such as storm damage and winter weather. Winter storms pose significant threats, as evidenced during the 2009 – 2010 winter season.
Prince William County Prince William County was formed in 1730, and was named by the Virginia General Assembly to honor the son of King George II. The county seat is the City of Manassas. Prince William County has a total area of 338 square miles, of which 11 square miles are water. It has a population density of 819 per square mile. In 2009, the population was estimated at 386,934, an approximately 38% increase over the 2000 census. It was the fourth fastest growing county in the United States during that period. Prince William County has grown more than 200% over a 20-year period. This is because of its central location to the Washington, DC metropolitan area. The population growth rate poses a risk; as open land is developed flood management must be addressed with the increasing amounts of impervious surfaces. Its flood risk is also due to low lying areas surrounding the Potomac River. Other natural hazards and risks are storm damage and winter weather. Winter storms pose significant threats, as evidenced during the 2009 – 2010 winter season.
Northern Virginia Hazard Mitigation Plan Update
19
2. City Profiles
City of Alexandria What is now the City of Alexandria was first settled as part of the British Colony of Virginia in the late 1690s. In 1791, George Washington included portions of the City of Alexandria in what was to become the District of Columbia. That portion was given back to Virginia in 1846 and the City of Alexandria was re-chartered in 1852. In 1870, the City of Alexandria became independent of Alexandria County, with the remainder of the County changing its name to Arlington County in 1920. The population of the city was 128,283 per the 2000 Census and was estimated to be 141,738 in 2009. Alexandria’s high population density and its location along the banks of the Potomac River, increase the city’s vulnerability to a variety of hazards, most notably flooding. In addition to snow melt and rain-related river flooding episodes, Alexandria is also subjected to tidal and storm surge flooding. As sea levels rise, permanent inundation of low lying areas along and near the river shoreline is also a concern. Winter weather and high wind events also pose a significant threat to the city as the 2009 – 2010 winter and summer seasons have proven. City of Fairfax Named after Thomas Fairfax, Sixth Lord Fairfax of Cameron, what is now known as the City of Fairfax became an independent city in 1961. This occurred only after having been previously known as Earp’s Corner, then Town of Providence, and eventually Town of Fairfax. Its population was 21,498 as of the 2000 Census and was estimated by the Census Bureau to be 24,702 in 2009. The city’s location on the eastern edge of the Virginia Piedmont make it susceptible to natural hazards and risks, such as storm damage and winter weather, as evidenced during the 2009 – 2010 winter season. City of Falls Church It is believed that the area was first settled by Europeans in 1699. The city takes its name from what was coined The Falls Church, a building that was built in 1757. The population of the city was 10,377 as of the 2000 Census and was estimated by the Census Bureau to be 11,711 in 2009. The City of Falls Church comprises about 2.2 square miles located approximately 10 miles west of Washington, DC. The City’s proximity to the Washington metropolitan area and its ease of access by car and public transportation have allowed increasingly-varied residential and

Northern Virginia Hazard Mitigation Plan Update
20
commercial development. Falls Church is densely populated with more than 5,077 persons per square mile. The City of Falls Church experiences significant flood threats due to the presence of Four Mile Run and Tripps Run. The City’s location on the eastern edge of the Virginia Piedmont make it susceptible to other natural hazards and risks, such as damage from severe storms and winter weather, as evidenced during the 2009 – 2010 winter and summer seasons. City of Manassas The City of Manassas played an important role during the American Civil War. The First Battle of Bull Run (also called First Battle of Manassas) was fought in the vicinity in 1861. It was the first land battle of the Civil War. The Second Battle of Bull Run took place August 28-30, 1862. The Town of Manassas was incorporated in 1873 and became an independent city in 1975. The population of the city was 35,135 as of the 2000 Census and was estimated by the Census Bureau to be 36,213 in 2009. Manassas is subject to high wind events, winter weather, and flooding. Winter storms pose significant threats, as evidenced during the 2009 – 2010 winter season. City of Manassas Park The City of Manassas Park was incorporated in 1957 and became an independent city in 1975. It was the last town in Virginia to become a city before a moratorium was placed on other towns achieving similar status. The population of the city was 10,290 as of the 2000 Census and was estimated by the Census Bureau to be 14,026 in 2009.

Northern Virginia Hazard Mitigation Plan Update
21
3. Town Profiles Town of Dumfries Dumfries was chartered on May 11, 1749, and is Virginia’s oldest continuously chartered town. John Graham gave the land on which the town was founded and is named after his birthplace, Dumfrieshire, Scotland. The population of the town was 4,937 as of the 2000 Census and was estimated by the Census Bureau to be 4,954 in 2009. Town of Herndon
Incorporated in 1879, the area on which the town was built was originally granted to Thomas Culpeper by King Charles II of England in 1688. Much of the downtown was destroyed on March 22, 1917, by a fire but was rebuilt with brick instead of wood. The population of the town was 21,655 as of the 2000 Census and was estimated by the Census Bureau to be 22,579 in 2009.
Town of Leesburg Steeped in history, Leesburg is the county seat of Loudoun County. Leesburg was established in 1758, and formally became a town by signed act of the Virginia General Assembly on February 18, 1813. It is located just over 30 miles west-northwest of Washington, DC, at the base of Catoctin Mountain and adjacent to the Potomac River. The principal drainage for the town is Tuscarora Creek and its northern “Town Branch,” which empties into Goose Creek to the east of town. European settlement began in the late 1730s. After its founding, it was the location of the post office and regional courthouse. The town was originally established on 60 acres of land. The population of the town was 28,311 as of the 2000 Census and was estimated by the Census Bureau to be 40,927 in 2009. Town of Vienna Originally called Ayr Hill, the village agreed in the 1850s to change its name to Vienna at the request of William Hendrick, a medical doctor who grew up in Vienna, New York. Vienna was incorporated as a town in 1890. The population of the town was 14,453 as of the 2000 Census and was estimated by the Census Bureau to be 15,215 in 2009.

Northern Virginia Hazard Mitigation Plan Update
22
Town of Purcellville Settled in the mid 1700s, the village was first known as Purcell’s Store. The village renamed to Purcellville on July 9, 1852, and was incorporated in 1908. Many present structures in the town reflect the Victorian architecture of the turn of the century. Located in the western portion of Loudoun County, the
town has a total area of 2.6 square miles. Wine production is a thriving industry in this area, with approximately 30 wineries in the region. The Blue Ridge Mountains are just to the west and in good weather are usually visible from town. Recreation includes the WO&D bike trail, the western portion of which ends here. The population of the town was 3,584 as of the 2000 Census and was estimated by the Census Bureau to be 5,309 in 2009. Town of Clifton Formerly known as Devereux Station, Clifton became the first town in Fairfax County when it incorporated on March 9, 1902. The population of the town was 185 as of the 2000 Census and was estimated by the Census Bureau to be 216 in 2009. Town of Middleburg The population of the Town was 632 as of the 2000 Census and was estimated by the Census Bureau to be 976 in 2009. Middleburg is located in Loudoun County and covers approximately 0.6 square miles of land. The population density of the town is 1,083 people per square mile. Town of Round Hill Named after the 910 foot hill located just southwest of the town center, and part of the foothills of the Blue Ridge Mountains, Round Hill was incorporated in 1900. The population of the town was 500 as of the 2000 Census and was estimated by the Census Bureau to be 759 in 2009. Town of Haymarket
Chartered in 1799 by the Virginia General Assembly, the Town of Haymarket was incorporated in 1882. The population of the town was 879 as of the 2000 Census and was estimated by the Census Bureau to be 1,252 in 2009. Since the 1900s it has been popular for fox hunting and steeple chasing and is also known for its wineries. The town covers 0.5 square miles of land and is located in Prince William County.

Northern Virginia Hazard Mitigation Plan Update
23
Town of Occoquan Derived from a Dogue Indian word meaning ‘at the end of the water,’ Occoquan was divided into lots and streets were laid out in 1804 by Nathaniel Ellicott, James Campbell, and Luke Wheeler. The population of the town was 759 as of the 2000 Census and was estimated by the Census Bureau to be 834 in 2009. Town of Quantico Located in Prince William County and surrounded by the Marine Corps Base Quantico, the population of the town was 561 as of the 2000 Census and was estimated by the Census Bureau to be 607 in 2009.

Northern Virginia Hazard Mitigation Plan Update
24
B. Geography, Hydrology, and Climate
1. Geography The Northern Virginia planning region is located at the north-east corner of the Commonwealth of Virginia, lies across the Potomac River from the Nation’s Capital, Washington, DC, and is part of the Washington, DC-Maryland-Virginia-West Virginia Primary Metropolitan Statistical Area. Figure 3.1 above is an overview map for the Northern Virginia region including all counties, cities, and towns within the region. Northern Virginia is made up of the counties of Arlington, Fairfax, Loudoun, and Prince William; the independent cities of Alexandria, Falls Church, Fairfax, Manassas, and Manassas Park; the major towns of Dumfries (Prince William County), Herndon and Vienna (Fairfax County), and Leesburg and Purcellville (Loudoun County); and the smaller towns of Clifton (Fairfax County), Middleburg and Round Hill (Loudoun County), and Haymarket, Occoquan, and Quantico (Prince William County). Figure 3.2 is a base map overview of the Northern Virginia region including all participating county, city, and town jurisdictions, as well as the identification of interstate highways, major roads, major water bodies, and lands outside the authority of participating jurisdictions such as Dulles Airport and U.S. government property. Northern Virginia is home to numerous Federal government facilities such as the Pentagon, CIA, and U.S. Geological Survey. Historic and cultural resources include George Washington’s historic home on the Potomac, Mount Vernon; Arlington National Cemetery; and the Udvar-Hazy Center of the Smithsonian Institution's National Air and Space Museum at Washington-Dulles International Airport.

Northern Virginia Hazard Mitigation Plan Update
25
Figure 3.2. Major Features in Northern Virginia Source: 2006 Northern VA HIRA from Northern Virginia Regional Commission & PBS&J

Northern Virginia Hazard Mitigation Plan Update
26
2. Hydrology The Northern Virginia Planning District is divided by three physiographic provinces of Virginia: the Coastal Plain, the Northern Piedmont, and the Blue Ridge (Figure 3.3). The Coastal Plain lies roughly east of Interstate 95/395 including the eastern portions of the City of Alexandria, and Fairfax and Prince William Counties. The Northern Piedmont province lies roughly between I-95 and US Highway 15 in central Loudoun and western Prince William counties. It is bounded by the Blue Ridge Mountains on the west with ridges, foothills, and hollows rolling down to the Potomac River to the east. Elevations range from more than 1,950 feet above sea level in the Blue Ridge Mountains in western Loudoun County to sea level in eastern Prince William County on the Potomac River. The total land area is 1,304 square miles.
Figure 3.3 Hydrologic Regions of Virginia Source: U.S. Department of the Interior, U.S. Geological Survey, Fact Sheet 023-01
Northern Virginia lies entirely within the Potomac River watershed. After passing Harper’s Ferry, WV, the Potomac forms the border between Maryland and Virginia, flowing in a southeasterly direction. Figure 3.4 provides a general overview of the watersheds in Virginia. The topography of the upper reaches of the basin is characterized by gently sloping hills and valleys. At Great Falls, the stream elevation rapidly descends from over 200 feet to sea level. Eastward of Great Falls, the Basin enters into the Coastal Plain physiographic province. Figure 3.5 illustrates the major physiographic features of Virginia..

Northern Virginia Hazard Mitigation Plan Update
27
3. Climate The area has a moderate climate. Average temperatures are approximately 50 degrees, and range from January lows in the mid-20s to July highs in the high-80s. Annual rainfall averages above 40 inches and is supplemented with approximately 14 inches of snow. Climate change is both a present threat and a slow-onset disaster. It acts as an amplifier of existing hazards. Extreme weather events have become more frequent over the past 40 to 50 years and this trend is projected to continue.1 Rising sea levels, coupled with potentially higher hurricane wind speeds, rainfall intensity, and storm surges are expected to have a significant impact on coastal communities, including those in northern Virginia. (see Sea Level Rise Case Study in the Flood section of the HIRA) More intense heat waves may mean more heat-related illnesses, droughts, and wildfires. As climate science evolves and improves, future updates to this plan might consider including climate change as a parameter in the ranking or scoring of natural hazards.

Northern Virginia Hazard Mitigation Plan Update
28
Figure 3.4. Watersheds of Virginia (Source: Commonwealth of Virginia Emergency Operations Plan HIRA Figure 3.2-2)

Northern Virginia Hazard Mitigation Plan Update
29
Figure 3.5. Shaded Relief of Virginia (Source: Commonwealth of Virginia Emergency Operations Plan HIRA Figure 3.2-1.)

Northern Virginia Hazard Mitigation Plan Update
30
C. Demographics, Population & Economic Growth The Washington metropolitan area is projected to experience substantial growth in population, employment, and output over the next 20 years. Proximity to the Nation’s capital has been fueling population growth in Northern Virginia for more than 60 years. Since the mid-1930s, when large numbers of Federal workers moved to Washington, DC, during the New Deal and began spilling out into adjoining suburbs, people have been moving into Northern Virginia at an accelerated rate. Like a water faucet turned on and left running, the flow of people has remained vigorous and constant for most of the post-war period. Today, Northern Virginia is home to over 2 million people. As seen in Table 3.2, demographers are projecting on average, nearly 30,000 newcomers per year through the end of this decade, and approximately 28,000 per year the decade after. By 2020, the population will approach 2.5 million.
Table 3.2 Projected Population Growth in Northern Virginia, 2004-2020 (in millions)
Jurisdiction 2004 2010 2020 2004-2020 Alexandria 134.2 143.9 152.6 18.4Arlington County 193.2 212.2 233.1 39.9City of Fairfax 23.3 23.9 26.0 2.7Fairfax County 1,007.4 1,133.0 1,193.4 186.0Falls Church 11.2 12.3 14.7 3.5Loudoun County 241.8 318.1 422.9 181.1Manassas 37.0 38.0 40.2 3.2Manassas Park 12.4 15.0 16.5 4.1Prince William County
344.0 415.3 488.2 144.2
Northern Virginia
2,004.5 2,311.7 2,587.6 583.1
Source: Metropolitan Washington Council of Governments, Cooperative Forecasts
The locus of population growth, inexorably pushing outward, is now sweeping across the broad expanse of the outer rim of the Northern Virginia region. This is where the pressure to absorb new metropolitan growth is most intense, and where it will remain concentrated for decades to come. More than 60% of the more than three-quarter million projected newcomers (2000 to 2020) will settle in Prince William and Loudoun Counties. At the beginning of the 1960s, Northern Virginia was a suburban bedroom community of predominantly middle-class families with children, not dissimilar demographically from hundreds of other places. By the end of the century, it had evolved into a complex blend of urban and suburban influences, an intricate demographic composite formed by the economic growth, transformation, and prosperity of the Washington metropolitan economy, by a rising tide of immigration, aging of the baby boom generation, and other powerful agents of social and demographic change.

Northern Virginia Hazard Mitigation Plan Update
31
A second salient feature of Northern Virginia’s demography is the degree of urbanization etched in locality profiles. In many ways, American suburbs have become more urban, as traffic congestion, overcrowding, immigrants, and more diverse homes and lifestyles work their way into suburbia. But urban pressures and forms, while present everywhere, have not impacted suburbia equally. The pressures are more intense, as a general rule, in neighborhoods settled by the first wave of post-war suburbanization, as they age and become part of an expanding urban core. In Northern Virginia, impacts of urbanization can be observed in the contrasting demographic profiles of close-in and outer-fringe localities. The differences can be traced, primarily, to variations in the affordability, age, and composition of local housing inventories. As types of housing are unevenly distributed across regional and local landscapes, so too is the flow of different population streams as they seek a home in a location and at a price range suitable to their lifestyle, thereby stamping sections of the region with a distinctive demographic coloration. Listed below are some of the major demographic differences found in the close-in and outer-ring suburbs of Northern Virginia. Northern Virginia Suburbs closest to Washington, DC: (Primarily in Alexandria, Arlington County, and some inside-the-beltway Fairfax neighborhoods)
are communities that have changed during the past three decades from conventional family-centered suburbs into new-urban enclaves that, demographically, have become similar to downtown Manhattan, San Francisco, and other U.S. cities
have become “first-stop” immigrant gateways are approaching minority-majority status are distinctive and stand out nationally for their high percentage of non-family
households, single-person households, childless households, renters, and multi-unit apartment and hi-rise housing (of 50 or more units)
have among the smallest percentage of school age children, and among the largest percentage of young adults (20 to 35 year old), found anywhere in the U.S.
average household sizes also are among the smallest in the country have high population turnover, people continually moving in and out, with about half of
the population replaced every five years exhibit evidence of a widening gap between have and have-nots with large numbers at the
high end of the income ladder; and large numbers, mainly immigrants and minorities, at the low with very few in the middle.
Outer-ring suburbs of Northern Virginia: (Primarily in Prince William and Loudoun Counties and parts of Fairfax County)
are communities that are more traditionally suburban in character dominated by families with school-age children, and homeowners who are living in
detached single-family houses and townhouses have large average household sizes have growing foreign-born populations but with socio-economic backgrounds different
from those pouring into the inner core. Outer suburban immigrants, generally, have lived

Northern Virginia Hazard Mitigation Plan Update
32
in the U.S. longer, are better educated, are more affluent, and are more likely to live in homes they own
have fewer poor people, less evidence of a have, have-not divide; many affluent, well educated homes and people; with some pockets of lower income communities but less prevalent than the jurisdictions closer to Washington, DC.
1. Projected Economic Growth With a gross regional product of nearly $288 billion dollars, the Greater Washington economy is the fourth largest metro market in the United States, and the seventeenth largest in the world. While still relatively strong, the recent downturn has had significant impact on the area’s economy. The Department of Labor Statistics reported an unemployment rate of 6.6% for the region in February 2010, as compared to 5.8% in February 2009. Even with the slumping economy, the region’s unemployment rate remains considerably lower than the national rate of 9.7%. Looking further ahead, the region is expected to experience continued economic growth. George Mason University’s Center for Regional Analysis projects the Washington Metropolitan Area economy (Gross Regional Product) to grow from $352.1 billion in 2010 to $683.7 billion in 2030. The rate of economic growth is nearly double that forecast for New York City or Chicago, but lower than that expected for Dallas-Fort Worth2. A few quick facts underscore the strength, performance, and unique structure of its economy, of which Northern Virginia is an important sub-component. Greater Washington: is home to the Federal government, the largest purchaser of goods and services in the
world. The total value of Federal procurement outlays received by businesses in the National Capital region during fiscal year 2004 was $42.2 billion, up from $12.5 billion in 1990.
leads the Nation in job growth over the past 20 years, averaging 52,000 new jobs per year, with job growth over the past five years substantially surpassing numbers achieved by other metropolitan areas in the United States. During this time period, the Washington area generated a total of 305,000 new jobs. The next closest metro was Las Vegas, NV, with 150,000 new jobs (about the same number added in Northern Virginia).
has been significantly outperforming the national economy on most basic indicators of economic activity, (i.e., GRP growth, job growth, unemployment rates).
has one of the lowest unemployment rates in the country (3.1% in 2004). In 2009, its monthly unemployment rate was the lowest in the Nation, among metro areas, for 11 of 12 months
is the Nation’s third-largest center of bio-science companies; is home to 5,367 associations, the largest concentration in the Nation; and employs more people in technology occupations (76,000) than any other location
is a top U.S. tourist destination, serving as host to 18.6 million domestic and international visitors in 2002
is home to a growing list of industries and advanced technologies on the vanguard of innovation. Many of the people and companies building the global communications network, for example, are located here, such as America ONLINE, UUNET Technologies Inc., PSINet Inc, Lockheed Martin, SPRINT, Comsat, Intelsat, GTE Spacenet, and others.

Northern Virginia Hazard Mitigation Plan Update
33
Northern Virginia is a strong sub-regional component of the larger Washington economy, as are suburban Maryland and the District of Columbia. While all of the sub-regional markets are experiencing job growth, Northern Virginia is significantly outpacing the other two. During the 1990s, for each new job added in Suburban Maryland, Northern Virginia gained two. This decade, the ratio has widened to 2.3 to one. Major employers for manufacturing and non-manufacturing jobs in the Northern Virginia region are shown in Table 3.3.
Table 3.3. Major Employers in Northern Virginia. Source: Virginia Economic Development Partnership (VEDP).
Manufacturing
Company Product/Service Estimated
Employment BAE Systems Aerospace electronic systems 100 - 299 Gannett Company, Inc. Printing & publishing 1,500 - 2,499 Lockheed Martin Corporation Electronic components 5,000 - 9,999
Non-Manufacturing AOL, LLC Internet service 2,500 - 4,999
Booz, Allen & Hamilton Management & technology consulting
10,000+
CACI, Inc. Computer services 2,500 - 4,999
Computer Sciences Corporation Information technology services 10,000+
Department of Defense National security 10,000+ ExxonMobil Corporation Petroleum products 1,500 - 2,499
Federal Home Loan Mortgage Corp.
Financial services 2,500 - 4,999
General Dynamics Information System
Technology solutions 2,500 - 4,999
George Mason University Higher education 2,500 - 4,999 INOVA Health System Health care 10,000+
Northrop Grumman Professional, scientific, and technical services
5,000 - 9,999
Science Applications International Corp. (SAIC)
Information technology services 5,000 - 9,999
SRA International Technology solutions 1,000 - 1,499 Verizon Service Corp Telecommunications 1,000 - 1,499 Wal-Mart Stores, Inc. Discount retail 2,500 - 4,999
Washington Metro Area Transit Authority
Transit system 1,500 - 2,499

Northern Virginia Hazard Mitigation Plan Update
34
2. Population According to the U.S. Census Bureau, the population of the Northern Virginia region in 2000 was approximately 1.8 million. The average number of persons per square mile was 1,380, making the region one of the most densely populated in the United States. Table 3.4 shows the total population and population density per square mile, by jurisdiction. As can be seen in the table, the City of Alexandria is the densest jurisdiction while Loudoun County is the least dense. However, when the land comprising Arlington National Cemetery and Regan National Airport are considered, Arlington County is even denser than Alexandria. Figure 3.6 illustrates the distribution of population density, using 2005 estimates, across the region according to census tracts.
Table 3.4. Population Statistics in the Northern Virginia Region, by Jurisdiction (2000) Source: U.S. Census Bureau
Jurisdiction
2000 Total Population
(April 1, 2000)
2000 Population
Density (Square
Mile)
2005 Population Estimate
2005 Population
Density (Square
Mile)
2007 Census Population Estimate
2007 Population
Density (Square
Mile) Arlington County 189,453 7,315 197,806 7,573 204,568 7,838
Fairfax County 969,749 2,413 1,036,578 2,550 1,010,241 2,485
Loudoun County 169,599 272 257,240 494 278,797 535 Prince William County
280,813 819 354,039 1,016
360,411 1,034
City of Alexandria 128,283 8,385 138,004 8,955 140,024 9,092
City of Fairfax 21,498 3,467 23,059 3,626 23,349 3,706 City of Falls Church
10,377 5,189 10,648 5,324
10,948 5,474
City of Manassas 35,135 3,514 37,423 3,742 35,412 3,541 City of Manassas Park
10,290 5,717 12,561 5,106
11,426 4,570
Northern Virginia Total
1,815,197 1,357 2,067,358 1,545 2,075,176 1,551
Development Trends, described in the following section, summarize population change for the region. The Risk Assessment Methodology section summarizes the population parameters used in ranking the hazards presented in this report.

Northern Virginia Hazard Mitigation Plan Update
35
Figure 3.6 Population Density (2005).

Northern Virginia Hazard Mitigation Plan Update
36
3. Housing A general market inventory of housing in Northern Virginia shows that there is a continual demand for affordable housing, with low vacancy rates throughout the region. Housing demand is being propelled by the highest job growth in the United States. As tracked by COG, the median sales price of housing has increased 59 percent over the past six years, from $166,548 in 1997 to $265,047 in 2003. Incomes have not been keeping pace with rising housing prices. Between 1998 and 2003, incomes increased by only 17 percent, compared with a housing sales price increase of 59 percent. The Urban Institute estimates that one-quarter of the region’s households are carrying unaffordable housing cost burdens. Housing construction has been pushed to outer-ring suburban jurisdictions, where prices still remain somewhat affordable, but savings are counterbalanced to some extent by the increased cost and time of commutes.
D. Land Use, Development, & Zoning
1. Land Use
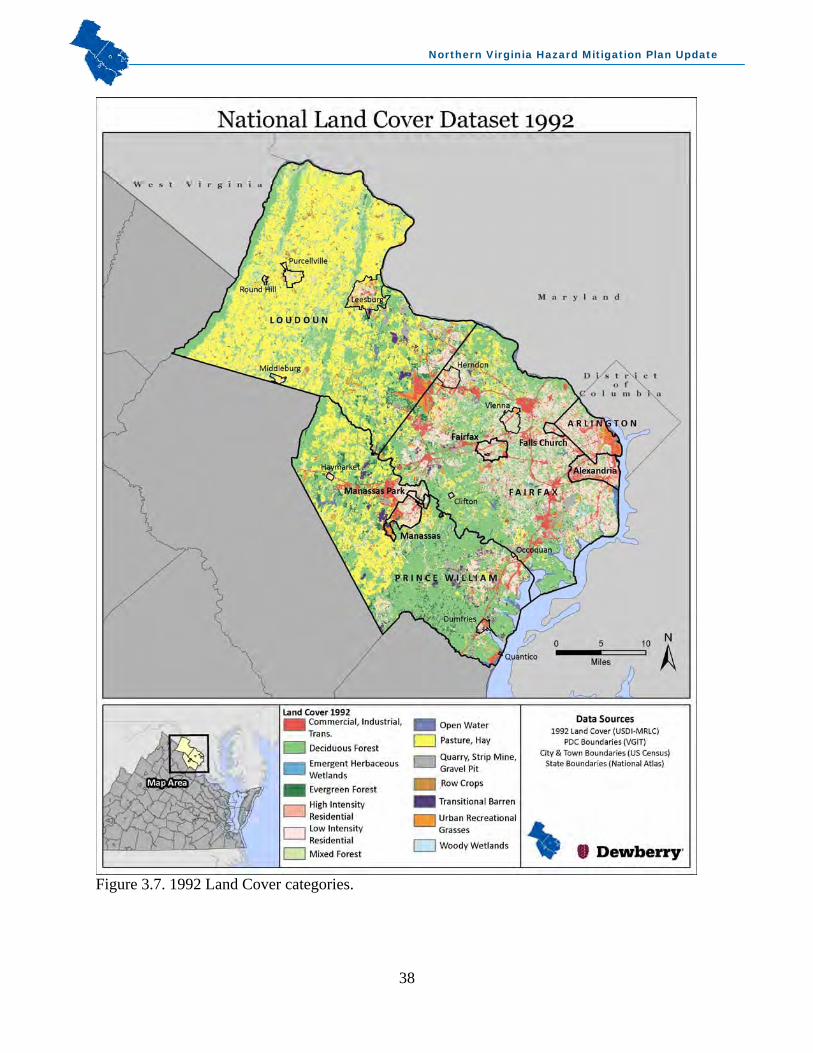
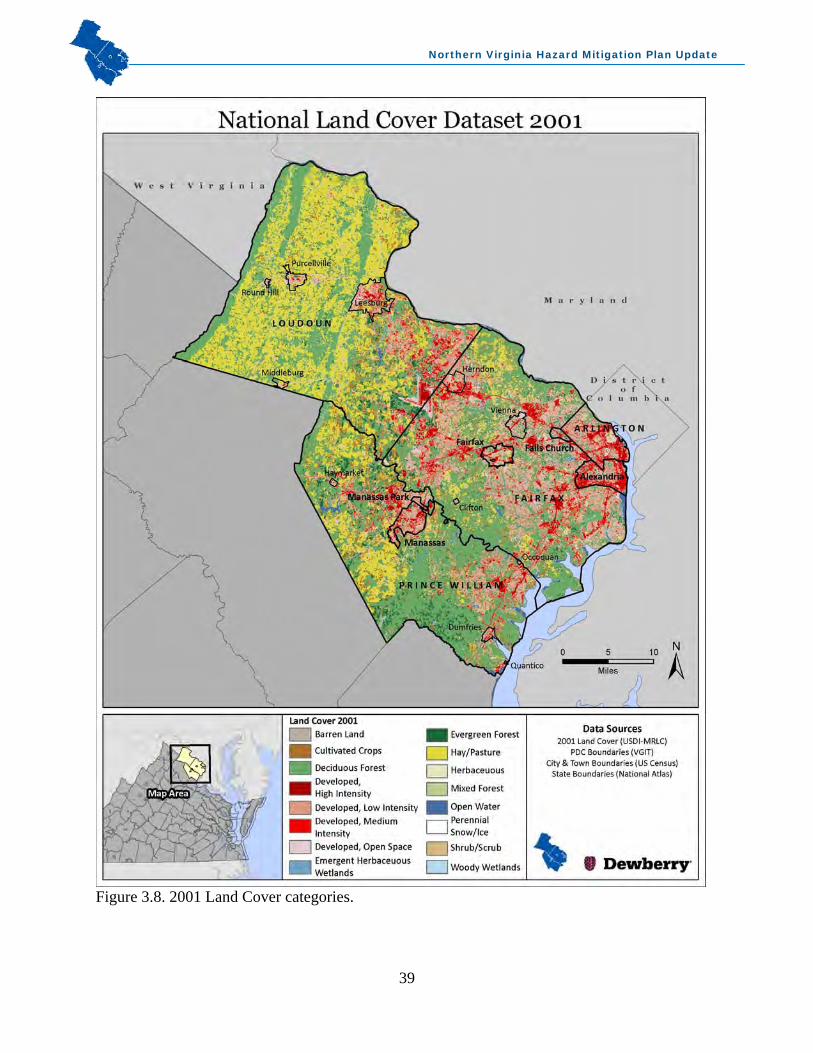
FEMA requires that State and local mitigation plans evaluate land use and development trends so that mitigation options can be considered in future land-use decisions. Changes in urban and agricultural land cover may help to highlight areas within the State that should be considered in long-term comprehensive plans. To identify these areas, land cover change was assessed using the National Land Cover Dataset. This dataset is produced by the Multi-Resolution Land Characteristics Consortium (MRLC), a collection of Federal agencies that pool resources to map land cover across the Nation. Using satellite imagery, the MRLC produced datasets for 1992 and 2001 that include 16 land cover classes for various types of urban, agricultural, forested, and other natural areas. It is important to note that the MRLC revised the classification system for 2001. In order to assess change consistently, the 1992 land cover classes were cross referenced to 2001 according to the MRLC 1992-2001 Retrofit Change Product. The majority of change in Northern Virginia has occurred in forested lands, shown in Table 3.5. From 1992 through 2001, forest land cover has decreased across the region. Each of the four counties experienced decreases, with Fairfax County showing the largest decrease of 23%. Urban land has also decreased in the region, especially in Fairfax County. Loudoun County, however, has witnessed the most urban growth, increasing by 9,838 acres. Agricultural land cover has increased in Fairfax and Prince William Counties, 54% and 17% respectively; while Loudoun County has shown a small decrease of 5%. Figures 3.7 and 3.8 show the distribution of land cover for Northern Virginia.

Northern Virginia Hazard Mitigation Plan Update
37
Table 3.5. National Land Cover Changes 1992 to 2001.
Jurisdiction
Urban Change (Acres)
Forest Change (Acres)
Agricultural Change (Acres)
Wetland Change (Acres)
Arlington County -628.49 -1,693.09 385.19 146.34
Fairfax County -16,529.25 -27,808.21 13,700.61 -1,425.55
Town of Herndon -84.73 -228.18 -72.06 -28.91
Town of Vienna -688.53 -274.21 111.2 9.56
Town of Clifton -43.59 -12.23 24.24 1.33
Loudoun County 9,838.96 -17,791.12 -8,349.58 72.95
Town of Leesburg 1,596.13 -1,517.62 -1,259.64 -15.12
Town of Purcellville 215.95 -160.57 -489.49 0
Town of Middleburg -27.8 -37.14 -52.93 0
Town of Round Hill 22.68 -38.25 -56.49 -3.11
Prince William -1,350.38 -16,364.01 8,406.07 840.43
Town of Dumfries -65.61 14.9 12.45 -41.37
Town of Haymarket -44.92 4.67 -45.59 3.78
Town of Occoquan -17.57 -4.23 -4.89 1.56
Town of Quantico -2.67 -2.22 6.23 -3.78
Alexandria -211.27 -695.65 -62.49 -39.14
Fairfax City -555.1 -640.05 245.75 23.57
Falls Church -288.89 -48.93 20.02 -0.44
Manassas -231.29 -294.45 -328.03 10.01
Manassas Park -121.65 -86.73 31.36 -1.33
Total -9,218.03 -67,677.32 12,221.91 -449.24
Northern Virginia Hazard Mitigation Plan Update
38
Figure 3.7. 1992 Land Cover categories.
Northern Virginia Hazard Mitigation Plan Update
39
Figure 3.8. 2001 Land Cover categories.

Northern Virginia Hazard Mitigation Plan Update
40
2. Development Trends
A general analysis of land uses, development trends, and zoning within the planning area is an important factor in formulating mitigation options that influence future land use and development decisions. In many cases, local development policies greatly influence the degree of future vulnerability in communities across the region. The vulnerability of future buildings, infrastructure, and critical facilities is a great concern to community leaders across the Northern Virginia region and, as discussed in the Capability Assessment section, many of the day-to-day activities in local governments in the region are designed to deal with these challenges. One of the most critical indicators to review in considering local development trends is population growth. The average rate of population change in the Northern Virginia region from 2000 to 2009 was 24.6 percent, which is significantly higher than the average growth rate for the State of Virginia during this same time period (11.4 percent). Table 3.6 shows the breakdown of population growth rates, by jurisdiction. As can be seen in the table, Fairfax County has the highest population in the region (1,036,473 people) while Loudoun County experienced the highest growth rate based upon percent change (75.78%). The region as a whole has experienced a 19% growth in the past nine years and accounts for over a quarter of the Commonwealth’s total population. Total population and population density have been used in the risk assessment ranking methodology. Refer to the Risk Assessment and Methodology section for more details on these ranking parameters.
Table 3.6. Northern Virginia Population Change (2000 – 2009).
Jurisdiction* 2000 Census
(April 1, 2000)** Provisional
2009 Percent Change
Arlington County 189,453 212,038 11.92% Fairfax County 969,749 1,036,473 6.88%
Town of Herndon 21,655 22,579 4.27% Town of Vienna 14,453 15,215 5.27% Town of Clifton 185 216 16.76%
Loudoun County 169,599 298,113 75.78% Town of Leesburg 28,311 40,927 44.56% Town of Purcellville 3,584 5,309 48.13% Town of Middleburg 632 976 54.43% Town of Round Hill 500 759 51.80%
Prince William County 280,813 386,934 37.79% Town of Dumfries 4,937 4,954 0.34% Town of Haymarket 879 1,252 42.43% Town of Occoquan 759 834 9.88% Town of Quantico 561 607 8.20%

Northern Virginia Hazard Mitigation Plan Update
41
Table 3.6. Northern Virginia Population Change (2000 – 2009).
Jurisdiction* 2000 Census
(April 1, 2000)** Provisional
2009 Percent Change
City of Alexandria 128,283 141,738 10.49% City of Fairfax 21,498 24,702 14.90% City of Falls Church 10,377 11,711 12.86% City of Manassas 35,135 36,213 3.07% City of Manassas Park 10,290 14,026 36.31% Northern Virginia Total 1,815,197 2,161,948 19.10% VIRGINIA TOTAL 7,079,030 7,882,590 11.35% *Town estimates are accounted for in County Totals. Town estimates are from the US Census Bureau June 2010
**Included all official corrections to the 2000 Census counts. Source: Weldon Cooper Center for Public Service www.coopercenter.org/demographics
3. Zoning Zoning is also a critical indicator to review in considering local development trends. Zoning Geographic Information Systems (GIS) data was provided by the majority of the jurisdictions participating in the plan update. The following section summarizes the results of this data. In some cases, zoning generalizations were made in order to compare the jurisdictions to each other. In all of the jurisdictions, residential zoning is by far the largest classification, often followed by commercial. Fairfax County has five zoning categories; residential zoning occupies approximately 82% of the total area of the county followed by planned units (12%). Commercial and Industrial make up 6% of the county land area. Arlington County has 28 zoning classifications. Close to 44% of the land area zones are considered One-Family Dwelling Districts, and 30% is in the Special District. In order to compare to the other jurisdictions, the classifications were grouped into commercial, industrial, residential, and other. This resulted in 61% residential, 31% other, 7% commercial, and less than 1% is industrial based on land area. The City of Alexandria has 32 zoning classifications. The residential single family zone on an 8,000 square foot lot represents the largest category with over 14% of the land area of the city. The coordinated development district represents almost 12% of the land area. In order to compare to the other jurisdictions, the classifications were grouped into commercial, industrial, residential, and other. This resulted in 58% residential, 24% commercial, 15% other, and less than 3% industrial based on land area. The City of Falls Church has 13 zoning classifications; low density residential represents the largest category with 48% of the land area of the city and medium density residential represents 18% of the land area. In order to compare to the other jurisdictions, the classifications were

Northern Virginia Hazard Mitigation Plan Update
42
grouped into commercial, industrial, residential, and other. This resulted in 76% residential, 14% commercial, 8% industry, and less than 3% other (or transitional) based on land area. The City of Fairfax has 16 existing zoning classifications; residential single detached represents the largest category with 45% of the land area of the city, and open space recreation and historic presents 11% of the land area. In order to compare to the other jurisdictions, the classifications were grouped into commercial, industrial, residential, institutional, and other. This resulted in 55% residential, 14% commercial, 19% other, 9% institutional, and approximately 3% other based on land area. The City of Fairfax also provided Future Zoning categories. Based on this information, the city has 14 future zoning classifications; residential low is the largest category with 34% of the land area of the city; business commercial represents 12% of the land area. In order to compare to the other jurisdictions (and existing zoning of the city), the classifications were grouped into commercial, industrial, residential, institutional, and other. This resulted in 55% residential, 12% commercial, 8% institutional and approximately 3 percent other based on land area. It appears that the future zoning for the city will result in a slight decrease in the commercial and institutional categories.
4. Transportation Northern Virginia and the Washington, DC, metropolitan area is served by an extensive transportation network. There are 12 interstates and 42 highways in the Northern Virginia region. Transportation within the Northern Virginia region is primarily dependent upon a network of major highways (VA Rt. 7, I-66, US50, US29/211, I-95/395, and US1) that radiate out from the urban core (Washington, DC, Arlington, and Alexandria); one major circumferential highway (I-495/95, the Capital Beltway); and other primary cross-county roads such as the Fairfax County Parkway and the Prince William Parkway. Figure 3.1 above provides the major overview of the highways and interstates in the planning region. The Washington Area’s Metro primarily serves the inner localities with 11 stations in Arlington County, four stations in the City of Alexandria, and five stations in Fairfax County. The Virginia Railway Express (VRE) commuter rail system serves communities to the west, cutting through central Fairfax County to the cities of Manassas and Manassas Park, and to the south in eastern Prince William County continuing to the City of Fredericksburg. Several bus systems (Metrobus, Alexandria’s DASH, Arlington’s ART, Falls Church’s George, Fairfax County’s Connector, Fairfax City’s CUE, and Prince William’s PRTC/Omniride) provide service throughout the region. Commercial air service includes the Ronald Reagan Washington National Airport and Washington Dulles International Airport. Figure 3.2 shows the location of the airports in the planning region. Nevertheless, these transportation systems are being strained by the growing population, housing, and employment patterns. From 1982 to 1997, population increased by 28.3%, but vehicle miles traveled grew by 81.5%, according to the Texas Transportation Institute. Between 1990 and 2000, the length of the average one-way, home-to-work commute increased from 28.2

Northern Virginia Hazard Mitigation Plan Update
43
minutes to 31.7 minutes, and this number has risen further since 2000. Workers are leaving home earlier and coming home later to make up the time that it takes to get where they need to go. The Texas Transportation Institute 2005 Urban Mobility Report shows the Metropolitan Washington region ranks as follows:
Number 3 in average hours lost sitting in traffic (69 – 3 hours more than previous year). Number 3 in congestion cost per commuter ($1,669 – $80 more than previous year). Number 4 in excess fuel consumed per commuter due to congestion (42 gallons/year – 2
gallons more than previous year). Number 5 in total excess gallons of fuel consumed due to congestion (88 million gallons
– 4 million more than previous year) Number 7 total regional congestion cost ($2.465 billion/year – $209 million more than
previous year). Number 7 in total delay due to congestion (145 million hours/year – 9 million more than
previous year). Total Delay due to congestion rank changed from #8 to #7 - worsened. Transportation systems are key in providing effective emergency response, but can also influence the impact of natural disasters. This can be a particularly crucial issue in Northern Virginia due to the high levels of traffic congestion. In addition to more immediate needs, businesses and employees suffer economic consequences when roads are closed due to natural disasters. Day to day traffic reports frequently report accidents or simply high volume levels that may bring a particular highway to a standstill. The attack on the Pentagon on September 11, 2001, Hurricane Isabel in 2004, and normal winter storms bring the regional highway system to a stop and taxes the transit system to the limits. Northern Virginia, the Commonwealth of Virginia, and the metropolitan area as a whole are actively addressing transportation through significant updates in regional plans; expansion of transit to areas such as Tysons Corner, Reston, and Dulles Airport; and introduction of operational measures such as HOT lanes (charging tolls on high occupancy vehicle lanes) to address congestion. However, under present development scenarios, Northern Virginia is expected to experience funding shortages for its transportation needs in the tens of billions of dollars in the next 25 years.
E. Northern Virginia Populations at Risk In the context of hazard mitigation and emergency management, when assessing populations at risk, a group’s “vulnerability” is broadly defined as the potential for increased harm or loss by the emergency or disaster. This applies to people, property, and land area. Risk to people is termed ‘social vulnerability’ by one of the most highly respected models for risk assessment, the Social Vulnerability Index created by Cutter et al (2003). It describes pre-event population vulnerability based on the characteristics and geographic location of people grouped using U.S. Census demographic categories and measurement units (tracts and blocks). Using a method such as the Social Vulnerability Index used during the Northern Virginia Hazard Mitigation planning process allows emergency managers a “first look” at populations at the highest risk due to characteristics that amplify their risk. Following further examination of population trends and

Northern Virginia Hazard Mitigation Plan Update
44
specific community needs, local emergency management departments can then direct appropriate preparedness, response, recovery, and mitigation planning and program delivery to specific communities to help them better prepare for and recover from disaster. Over the past decade, members of academia have researched and validated how to quantify and measure risk, or “social vulnerability,” which can prove difficult as most of the variables that factor into risk assessment applied to segments of society are qualitative rather than quantitative. Such an analysis can help a community increase communication approaches to different members of the community through the most appropriate communication networks. The analysis used in the 2010 Northern Virginia Hazard Mitigation Plan update closely follows a national model and method presented in the peer-reviewed and published article Cutter et al (2003)3, a groundbreaking study that defined and quantified the measures of social vulnerability. The Social Vulnerability Index has been slightly altered for the Northern Virginia analysis to accommodate available data. The analysis was conducted using data from the 2000 Census as the best available data for this study. It should be noted, it was necessary to rely upon the 2000 Census because the plan is regional, and updated, consistent population data across all metrics was not uniformly available for each of the 20 participating jurisdictions within the Northern Virginia planning region. Changes in population numbers since that time should be considered when analyzing the results. Dewberry performed this analysis to confirm that the rich diversity of Northern Virginia presented differing challenges. This analysis is meant to provide the first regional assessment of population demographics viewed in terms of specific Census-defined groups and their relative risk to natural and human-caused hazards due to various comparative societal factors. The results must be viewed through a sharper interpretive lens by the Northern Virginia Emergency Managers who have intimate knowledge of their jurisdiction. This information is provided to begin the conversation about populations at risk; it is recommended that resources be obtained to continue a more detailed assessment once the 2010 Census data, American Community Survey, and updated U.S. Department of Agriculture (USDA) Land-Use Cover Data set becomes available in 2011. An understanding of local conditions must be applied when interpreting the results of the analysis. The Northern Virginia analysis was performed at the Census tract level to provide insight into regional population trends. A total of 330 tracts were included in the analysis. It should be noted, the 2010 U.S. Census and American Community Survey categories will not change from those used in the 2000 Census available for this analysis. Census questionnaire answers are “self-determined” by each respondent, so they can be biased due to a variety of factors. There were eight major factors that influenced social vulnerability when analyzing the 30 Social Vulnerability variables for Northern Virginia, as determined by the Cutter et al article. It is important to understand that to the extent that areas in Northern Virginia have social vulnerability, these were the factors that influenced that vulnerability through the analysis. It is also important to note that most factors are largely influenced by multiple variables and that the name assigned to each factor is not necessarily reflective of one single variable, but rather the most dominant variables listed.

Northern Virginia Hazard Mitigation Plan Update
45
The eight factors were: 1. Socio-economic status; 2. Wealth; 3. Elderly populations; 4. Female heads of Large Households in densely populated areas; 5. Rural areas; 6. Female labor force; 7. Asian Population (as defined by the U.S. Census Bureau); and 8. Households living in Manufactured Housing.
The Region at a Glance The main contributors to the region’s vulnerability score provided a lens through which to begin to understand statistically-based indicators of factors which contribute to public risk. However, analysis of 2010 Census data overlaid with local knowledge of communities and societal groups is necessary to more precisely identify those most vulnerable to emergencies, hazard events, or disasters. However, the analysis did provide some interesting and relevant trends that guided the Northern Virginia MAC and participating jurisdictions in creating new mitigation strategies, such as: Assess growth and land use during the 2000 – 2010 decade to determine whether rapid
suburban expansion in the Sterling to Purcellville and Manassas corridors has challenged emergency preparedness, response, and mitigation communication in specific demographic terms for new residents – immigrant, elderly (Leisure World complex east of Leesburg), and others.
Expand code requirements to require redundant mechanical systems, especially in communities targeted at retirees.
Design and build new schools to serve as community shelters. Assess if an under-assessed Hispanic service and farm labor force is at risk due to limited
communication pathways. Determine whether school systems that rapidly expanded during the past 20 years have
adequate natural hazard monitoring systems (tornado, winter storm, severe storm); are plans in place and exercised to ensure appropriate school closures or sheltering-in-place.
Consider new multi-household housing units, especially for elderly, to have on-site generators for power redundancy.
Work with Cooperative Extensive Service/USDA agencies and Loudoun and Prince William Soil and Water Conservation Districts to determine if agricultural land owners have special hazard mitigation challenges regarding power outages and livestock feeding, access, etc.
Determine most effective emergency management and hazard mitigation notification communication networks to reach military and immigrant communities who are not familiar with the area.
Verify that targeted elderly populations can be reached through redundant communication networks.
Work with advocates for elderly populations to consider education and outreach for seniors to facilitate personal disaster preparedness plans.
Develop and distribute homeowner hazard mitigation tool kits to property owners that focus on easy mitigation actions homeowners can take.

Northern Virginia Hazard Mitigation Plan Update
46
Provide multi-language hazard mitigation tool kits through community churches and other organizations.
Work with landlords to distribute multi-cultural hazard mitigation information to renters, as appropriate, regarding renter’s insurance, what to do in an emergency, etc.
Analysis Challenges One of the great challenges in emergency management and all government support services to residents in the Northern Virginia region that is not fully captured by this vulnerability analysis, is the richness of the immigrant population. For example, children in Arlington County schools speak more than 120 languages and come from homes where English is the secondary language. While the Asian population, which includes many of Middle Eastern and Indian origin (as defined by the U.S. Census), is significant, the communication and cultural understanding challenges are the same for someone of any non-American origin. Another significant challenge in this analysis is the use of 2000 Census data. It is obvious that the region has experienced great socio-economic, population, and land-use changes during the period from 2000-2010 which are not reflected in this analysis. This analysis used the 2000 Census tract data because more recent data was not uniformly available for each jurisdiction in the region. Further demographic and cultural analysis should be considered once 2010 data sets are available to provide a more current snapshot of the region. However, the trends shown in this analysis are worth consideration in planning emergency management communication, emergency sheltering, and other support programs. It is vitally important to realize that the Census is determined by how those who responded characterized themselves. It is highly probable that someone from India or of Indian descent did categorize themselves as Native American Indian. Also, it is impossible to fully characterize the richness of the Northern Virginia area in the relatively narrow terms of the U.S. Census, so someone that is characterized as Caucasian may be a recent immigrant with multiple challenges in terms of being prepared for disasters or knowing how to mitigate against natural or human-caused hazards. However, since “Asians” did show as an indicator of populations at risk for this particular region, the term can be used as a placeholder for multiple immigrant communities as the challenges are not exclusive to just residents of Asian origin or descent. As Census 2010 and other data sets emerge, it will become increasingly apparent that Northern Virginia is experiencing change based on factors which attract thousands of new residents to the area annually. Many of the desirable factors that attract businesses and people to the area present the greatest challenges to Northern Virginia Emergency Managers and cause significant hazard mitigation challenges including: growth, dense populations, over-taxed transportation routes, communication, and knowledge of how to mitigate vulnerable buildings and prepare for disasters.