chapter 23 international asset pricing
DESCRIPTION
Chapter 23 International Asset Pricing. 23.1The Traditional Capital Asset Pricing Model (CAPM) 23.2The International Asset Pricing Model (IAPM) 23.3Roll’s Critique 23.4Factor Models and Arbitrage Pricing Theory (APT) 23.5Applications of Arbitrage Pricing Theory - PowerPoint PPT PresentationTRANSCRIPT

Kirt C. Butler, Multinational Finance, South-Western College Publishing, 2e 23-1
Chapter 23Chapter 23International Asset PricingInternational Asset Pricing
23.1 The Traditional Capital Asset Pricing Model (CAPM)
23.2 The International Asset Pricing Model (IAPM)
23.3 Roll’s Critique
23.4 Factor Models and Arbitrage Pricing Theory (APT)
23.5 Applications of Arbitrage Pricing Theory
23.6 The Currency Risk Factor in Stock Returns
23.7 Currency Risk Exposure
and MNC Hedging Activities
23.8 Summary

Kirt C. Butler, Multinational Finance, South-Western College Publishing, 2e 23-2
On asset pricing and market efficiency...On asset pricing and market efficiency...
It is the theory that decides
what can be observed.
Albert Einstein

Kirt C. Butler, Multinational Finance, South-Western College Publishing, 2e 23-3
The traditional capital asset pricing model The traditional capital asset pricing model (CAPM)(CAPM)
Perfect financial markets
» Frictionless markets
» Rational investors have equal access to costless information and market prices
Homogeneous expectations Everyone can borrow and lend at the riskless
rate of interest RF
Kirt C. Butler, Multinational Finance, South-Western College Publishing, 2e 23-4
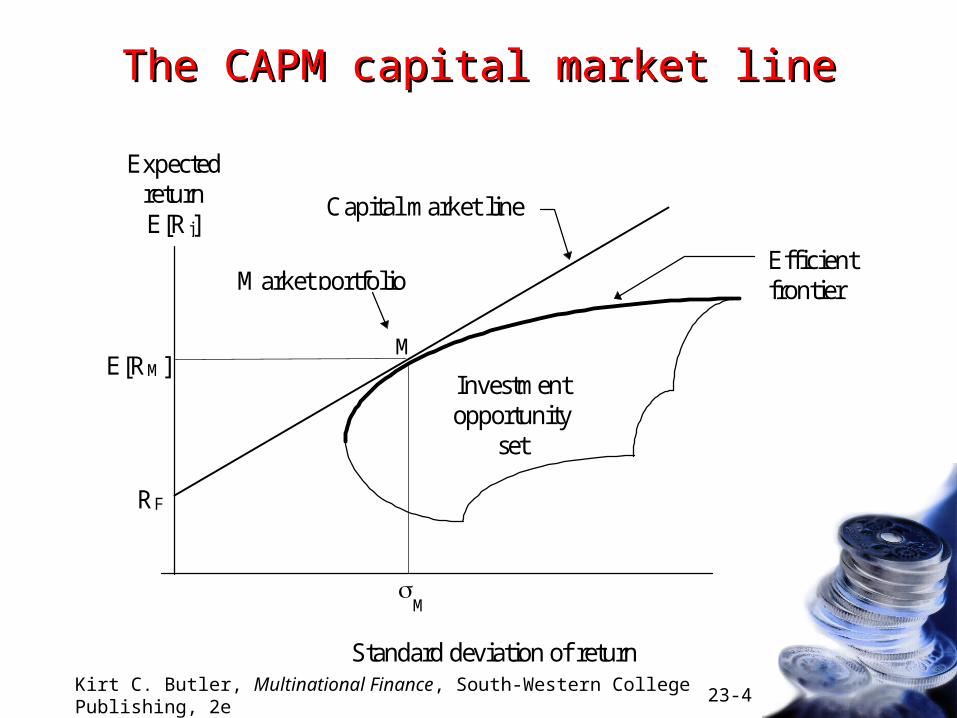
The CAPM capital market lineThe CAPM capital market line
Capital market line
Investmentopportunity
set
Efficientfrontier
ExpectedreturnE[Rj]
Standard deviation of return
RF
E[RM]
M
M
Market portfolio

Kirt C. Butler, Multinational Finance, South-Western College Publishing, 2e 23-5
The CAPM security market lineThe CAPM security market line
RF
M
1.0
Ri = RF + i (E[RM] - RF)
Security market line
E[RM]
0
ExpectedreturnE[Ri]
Systematic risk (beta i)

Kirt C. Butler, Multinational Finance, South-Western College Publishing, 2e 23-6
The International Asset Pricing Model (IAPM)The International Asset Pricing Model (IAPM)
In addition to the CAPM assumptions, suppose– Investors in each country have the same consumption
basket
– Purchasing power parity holds
This leads to an international version of the CAPM
The market portfolio includes all assets in the world weighted according to their market values
Investors also hold a hedge portfolio of domestic and foreign bonds» as a store of value (that is, as a riskfree asset)
» to hedge the currency risk of the market portfolio

Kirt C. Butler, Multinational Finance, South-Western College Publishing, 2e 23-7
Integrated vs segmented capital marketsIntegrated vs segmented capital markets
Integrated financial marketsThere are no barriers to financial flows and purchasing power parity holds across equivalent assets wherever they are traded.
Segmented financial marketsPrices are set independently in each national market.
Real-world financial markets fall somewhere between these two extremes.
Kirt C. Butler, Multinational Finance, South-Western College Publishing, 2e 23-8
Roll’s critique of the CAPMRoll’s critique of the CAPM
If performance is measured relative to an ex post efficient index, then all securities will lie along the security market line.
If performance is measured relative to an ex post inefficient index, then any ranking of portfolio performance is possible depending on the inefficient index chosen.

Kirt C. Butler, Multinational Finance, South-Western College Publishing, 2e 23-9
Roll’s critique of the CAPMRoll’s critique of the CAPM
Because of home asset bias, investors do not hold the world market portfolio.
Consequently, market beta may be of little use in measuring risk in a globally diversified portfolio.

Kirt C. Butler, Multinational Finance, South-Western College Publishing, 2e 23-10
Arbitrage pricing theory (APT)Arbitrage pricing theory (APT)
Rj = j + 1jF1 + ... + KjFK + ej
(23.5)
where Rj = the random rate of return on asset j
j = the mean or expected return on asset j
kj = the sensitivity of asset j to factor k where k=1,...,K
Fk = systematic risk factor k
ej = a random error term

Kirt C. Butler, Multinational Finance, South-Western College Publishing, 2e 23-11
The one-factor market modelThe one-factor market model
One-factor market model
Rj = j + jRM + ej (23.6)
Subtracting asset j’s mean return j = j + j M from both sides of (23.6) yields a one-factor market model in excess return form.
Rj = j + jFM + ej (23.7)
where FM = (RM - M)
Kirt C. Butler, Multinational Finance, South-Western College Publishing, 2e 23-12
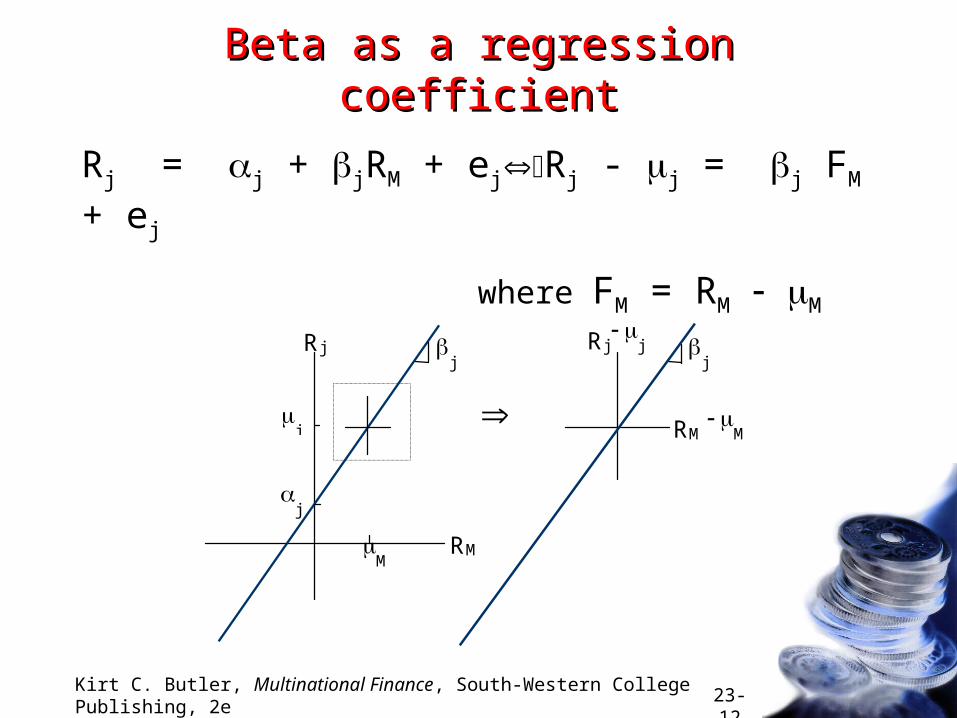
Beta as a regression coefficientBeta as a regression coefficient
Rj = j + jRM + ejRj - j = j FM + ej
where FM = RM M
RM
Rj
RM
M
j
M
j
j
Rj
j
j

Kirt C. Butler, Multinational Finance, South-Western College Publishing, 2e 23-13
The relative importance of industry, national The relative importance of industry, national and international factorsand international factors
Rj = M + CjFCj + IjFIj + ej (23.9)
where Rj = local currency excess return to stock j
M = return to the global market factor
FCj = return to stock j’s country factor
and FIj = return to stock j’s industry factor
Beckers, Connor and Curds, “National versus Global Influences on Equity Returns,” Financial Analysts Journal 52, March/April 1996.
Kirt C. Butler, Multinational Finance, South-Western College Publishing, 2e 23-14
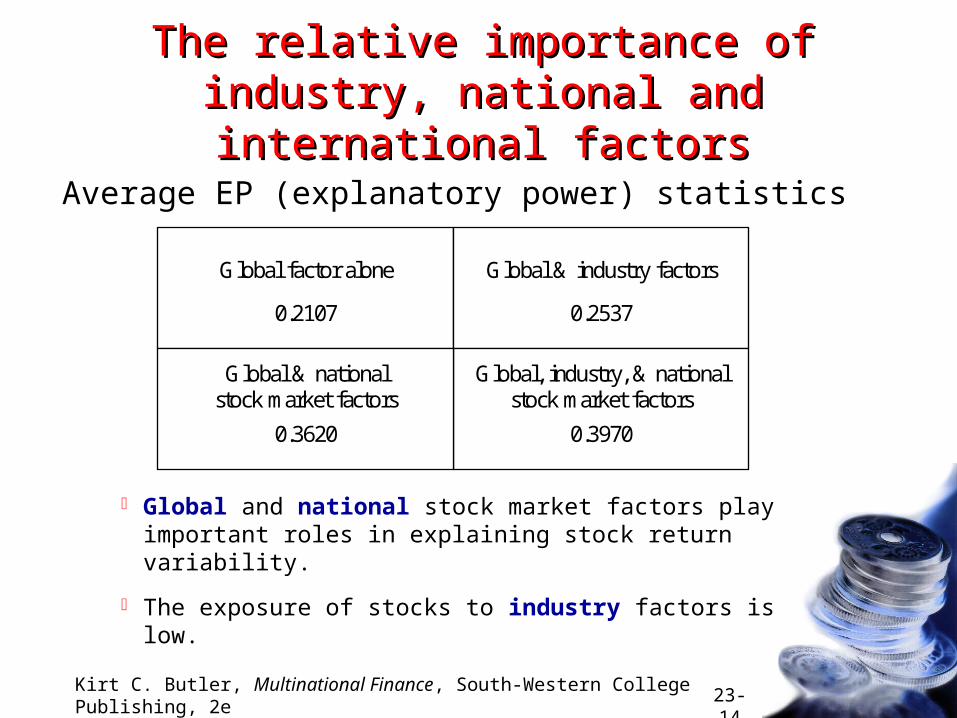
The relative importance of industry, The relative importance of industry, national and international factorsnational and international factors
Global factor alone
0.2107
Global & industry factors
0.2537
Global, industry, & nationalstock market factors
0.3970
Global & nationalstock market factors
0.3620
Average EP (explanatory power) statistics
Global and national stock market factors play important roles in explaining stock return variability.
The exposure of stocks to industry factors is low.

Kirt C. Butler, Multinational Finance, South-Western College Publishing, 2e 23-15
Exposure to currency riskExposure to currency risk
Rd = d + f sd/f + ed
Rd
sd/f
ExportersImporters

Kirt C. Butler, Multinational Finance, South-Western College Publishing, 2e 23-16
The diversifiability of currency risk exposureThe diversifiability of currency risk exposure
U.S. exporter’s Swiss importer’s Risk profile risk profile risk profile of combined position
V$/SFr V$/SFr V$/SFr
S$/SFr S$/SFr S$/SFr
SFr100,000 SFr100,000
SFr100,000 SFr100,000
+ =

Kirt C. Butler, Multinational Finance, South-Western College Publishing, 2e 23-17
APT factorsAPT factors
Chen, Roll and Ross identify five APT factors:*
Rj = j + 1jF1 + 2jF2 + 3jF3 + 4jF4 + 5jF5 +ej
Fj: industrial production
F2: risk premia (corporate government bond yield)
F3: term premia (long-term government T-bill yield)
F4: expected inflation
F5: unexpected inflation
When the market return is included as a sixth factor, its coefficient is not significant.
* Nai-Fu Chen, Richard Roll, and Stephen A. Ross, “Economic Forces
and the Stock Market,” Journal of Business, July 1986.

Kirt C. Butler, Multinational Finance, South-Western College Publishing, 2e 23-18
Does currency risk matter in U.S. markets?Does currency risk matter in U.S. markets?
Jorion added a currency risk factor to the one-factor market model and the five-factor model of Chen, Roll and Ross?*
Rjd = j
d + 1j (RMd M
d) + 2jf sd/f + ej
d (23.13)
Rjd = j
d + 1jF1d + 2jF12
d + ... + 5jF5d + 6j
fsd/f + ejd (23.14)
» In actively traded U.S. markets, the currency risk factor
is subsumed into the other factors.
» Nevertheless, there is considerable cross-sectional
variation among U.S.-based MNCs.
* Philippe Jorion, “The Pricing of Exchange Rate Risk in the Stock Market,”
Journal of Financial and Quantitative Analysis, September 1991.
Kirt C. Butler, Multinational Finance, South-Western College Publishing, 2e 23-19
Does currency risk matter in non-U.S. markets?Does currency risk matter in non-U.S. markets?
De Santis and Gérard estimated a conditional version of a two-factor (market and currency risk) model.*
– Conditional asset pricing models allow risks (ie., currency and market risks) to vary over time.
– Different national markets had different exposures to currency risks.
» Currency risk was a small fraction of total risk in the United States
» Currency risk was a significant percentage of total risk in Germany, Japan, and the United Kingdom
* Giorgio De Santis and Bruno Gérard, “How Big is the Premium for
Currency Risk,” Journal of Financial Economics 49, September 1998.

Kirt C. Butler, Multinational Finance, South-Western College Publishing, 2e 23-20
The value premium and the size effectThe value premium and the size effect
Fama and French fit a three-factor model:*
Rj = j + j (RM - M) + Zj FSize + Dj FDistress + ej
» Market factor (RM-M) = excess return on the market
» Firm size FSize = the difference in mean return between
the smallest 10% and the largest 10% of firms.
» Relative financial distress FDistress = the difference in
mean return between value stocks (high equity book-to-market ratios) and growth stocks (low equity book-to-market ratios)
* Eugene F. Fama and Kenneth R. French, “The Cross-Section of Expected Stock Returns,” Journal of Finance, June 1992.

Kirt C. Butler, Multinational Finance, South-Western College Publishing, 2e 23-21
The value premium and the size effectThe value premium and the size effect
Firm size: Small firms outperformed large firms by an average of 7 percent per year.
Relative financial distress: Value stocks (high equity book-to-market stocks) outperformed growth stocks by an average of 12 percent per year.
After controlling for size and relative financial distress, the market factor contributed nothing to the explanatory power of the regression.
* Eugene F. Fama and Kenneth R. French, “The Cross-Section of Expected Stock Returns,” Journal of Finance, June 1992.

Kirt C. Butler, Multinational Finance, South-Western College Publishing, 2e 23-22
The value premium in U.S. stocksThe value premium in U.S. stocks
0%
5%
10%
15%
20%
25%
1 2 3 4 5 6 7 8 9 10
Annualized return
Portfolios ranked on book-to-market equity
High Low
Kirt C. Butler, Multinational Finance, South-Western College Publishing, 2e 23-23
The international value premiumThe international value premium
Fama and French then extended their study to international stocks:*
» Value (low MV/BV) stocks have higher mean returns than growth (high MV/BV) stocks in 12 of 13 international markets.
» The difference in mean return is 7.60% per year.
* Eugene F. Fama and Kenneth R. French, “Value versus Growth: The International Evidence,” Journal of Finance 53 (December 1998).

Kirt C. Butler, Multinational Finance, South-Western College Publishing, 2e 23-24
The international value premiumThe international value premium
The Difference in Annual Dollar Returns in Excess of the U.S. T-Bill Rate for Value and Growth Stock Portfolios
-10%
-5%
0%
5%
10%
15%A
ustr
alia
Bel
gium
Fra
nce
Ger
man
y
Hon
g K
ong
Ital
y
Japa
n
Net
herl
ands
Sin
gapo
re
Sw
eden
Sw
itze
rlan
d
Uni
ted
Kin
gdom
Uni
ted
Sta
tes

Kirt C. Butler, Multinational Finance, South-Western College Publishing, 2e 23-25
Momentum strategiesMomentum strategies
Momentum (or relative strength) strategies selectively buy or sell securities based on their recent price performance.
Jegadeesh and Titman categorized stocks into ten equal-sized portfolios according to return over the preceding six months.*
» Winners are stocks with the highest six-month returns
» Losers are stocks with the highest six-month returns
* Narasimhan Jegadeesh and Sheridan Titman, “Returns to Buying Winners and Selling Losers: Implications for Stock Market Efficiency,” Journal of Finance, March 1993.

Kirt C. Butler, Multinational Finance, South-Western College Publishing, 2e 23-26
Momentum in U.S. stocksMomentum in U.S. stocks
United States+1.0%
12
Months relative to portfolio formation
0.0%
-1.0%
24 36
Kirt C. Butler, Multinational Finance, South-Western College Publishing, 2e 23-27
Momentum in international stocksMomentum in international stocks
Rouwenhorst examined momentum in 12 European stock markets:*
» Past Winners outperformed Losers by more than 1 percent per month after correcting for risk.
» Return continuation lasts for about one year, and then is partially reversed.
* K. Geert Rouwenhorst, “International Momentum Strategies,” Journal of Finance, February 1998.

Kirt C. Butler, Multinational Finance, South-Western College Publishing, 2e 23-28
Momentum in international stocksMomentum in international stocks(monthly returns to Winner-minus-Loser portfolios)(monthly returns to Winner-minus-Loser portfolios)
Europe+1.0%
12
Months relative to portfolio formation
0.0%
-1.0%
24

Kirt C. Butler, Multinational Finance, South-Western College Publishing, 2e 23-29
International momentumInternational momentum(cumulative returns to Winner-minus-Loser portfolios)(cumulative returns to Winner-minus-Loser portfolios)
-5%
0%
5%
10%
15%
0 12 24 36
Months relative to portfolio formation
EuropeUnited States

Kirt C. Butler, Multinational Finance, South-Western College Publishing, 2e 23-30
Momentum in international stocksMomentum in international stocks(average monthly returns to Winner-minus-Loser portfolios)(average monthly returns to Winner-minus-Loser portfolios)
0.0%
0.5%
1.0%
1.5%
Au
stria
Be
lgiu
m
De
nm
ark
Fra
nce
Ge
rma
ny
Ita
ly
Ne
the
rlan
ds
No
rwa
y
Sp
ain
Sw
ed
en
Sw
itze
rlan
d
Un
ited
Kin
gd
om