chapter 2 profiles in manufacturing 2 - uw tacoma
TRANSCRIPT
CHAPTER 2 | PROFILES IN MANUFACTURING 2 | 29
By: Jeffrey S. Dade, II
CHAPTER 2
The United States has a long history of uneven development heavily influenced by race and class divisions and intensified by the historic prevalence of systemic discrimination against people of color. Over the decades (hundreds of years for some communities) the barriers to wealth accumulation have grown into persistent economic instability for the working class and other low-income residents. In the face of projected population growth in the Puget Sound region, established patterns of employment stagnation in the economic underclass, and the country’s current trend toward a more service-based economy following the poverty-inducing effects of mass deindustrialization, blue-collar work is at risk.
INTRODUCTION
FALL 2020
PROFILES IN MANUFACTURING 2
30 | UW URBAN STUDIES PROGRAM | DADE
To the general populace, manufacturing industries are often equated with mass-production assembly lines, environmentally detrimental practices, and poor work conditions that are vestiges from earlier generations. In our ostensibly service-focused, college-centered economy these labor jobs are not seen as desirable, much less as keys to equitable urban development. However, these industries have continued to change in the post-industrial era, and they are remarkably well-suited with progressive principles that urban developers and planners espouse, such as Smart Growth and Transit-Oriented Development (Dierwechter & Pendras, 2020). Incumbent proponents of manufacturing in Tacoma must reframe industrial work as congruent with innovative urban paradigms to correct inaccurate views of industrial landscapes, challenging the presupposition of manufacturing as harmful and outdated.
In theory, planning professionals support the search for blue collars in green cities in their charge to “seek social justice by working to expand choice and opportunity for all persons, recognizing a special responsibility to plan for the needs of the disadvantaged and to promote racial and economic integration” (American Institute of Certified Planners, 2016). The research in this chapter takes a second look at local manufacturing to gauge the existence and viability of Tacoma’s manufacturing complex, while keeping the blue-collar workforce that would be using the proposed Transit-Oriented Manufacturing front and center. Tacoma’s manufacturing “ecosystem” matters because it is a significant contributor to the production of socially equitable workforce opportunities able to improve the financial stability of our most vulnerable communities.
The specific objective of this report is to assess the existence and viability of Tacoma’s manufacturing ecosystem, despite the stigmas of industrial work. In particular, workforce development pathways for local manufacturing have been associated with positive impacts that may work in tandem with modern advancements to help remediate uneven socio-economic development and allow for equity in blue-collar, urban-industrial futures (Clark & Dawson, 1995). Other themes include quality of life in the workforce pool as well as the changing nature of work from the employers’ perspectives. The disucssion is organized in three main sections. First, the Research Overview will offer relevant rationales from scholars and organizations that clarify the position of the subjects being studied. Next, the Tacoma Workforce Development Ecosystem Map (TWDEM) is a visual aid that provides a lens to help reference connectivity among the various elements and entities involved locally. Finally, the Findings area features the results of the examination and analyzes them in association with the research support in the previous sections.
INTRODUCTION (CONTINUED)
Incumbent proponents of manufacturing in Tacoma must reframe industrial work as congruent with innovative urban paradigms to correct inaccurate views of industrial landscapes, challenging the presupposition of manufacturing as harmful and outdated.
CHAPTER 2 | PROFILES IN MANUFACTURING 2 | 31
Contemporary planning professionals are charged with providing residents solutions that consider equity, economy, and environment. In the throes of transition, contemporary economic conditions continue to challenge how cities adapt these tenets to the built environment, industries, and the people therein. The resulting needs born from a changing world are complex and often multi-layered. This is exemplified in the case of workforce development connected to manufacturing. Though influenced by many authors, the primary impetus for this investigation stemmed from several articles in an issue of Progressive Planning that focused on progressive manufacturing approaches. The pieces that stood out had to do with the changing nature of manufacturing and its effects on jobs and communities. The authors were not just mentioning the death or rebirth of manufacturing. They spoke to the promise of the industry’s “development as a component of city and regional well-being” as well as “its importance for neighborhood and city growth” (Giloth, 2012). Perhaps the greatest inspiration to delve deeper came from an article called “Planners and Manufacturing: An Uneasy Alliance”.
Three statements stood out (Giloth, 2012):
• “The equity dimensions of manufacturing—the quality of jobs and the accessibility of jobs in terms of education and geographic location of firms—are consistently favorable but frequently unrecognized”
• “manufacturers are still crying loudly about skills gaps and their inability to hire”
• “…there is the perennial problem of manufacturing having a bad name—dirty jobs, unsafe work environments and inevitable layoffs and shutdowns. What parents in their right minds would urge their children to make a career in manufacturing? The reality of and prospects for these new jobs, however, is quite different from common perceptions and the word needs to get out.”
Robert Giloth’s words stimulated the core queries in this chapter. While far from a panacea, the literature appeared to point to an interesting
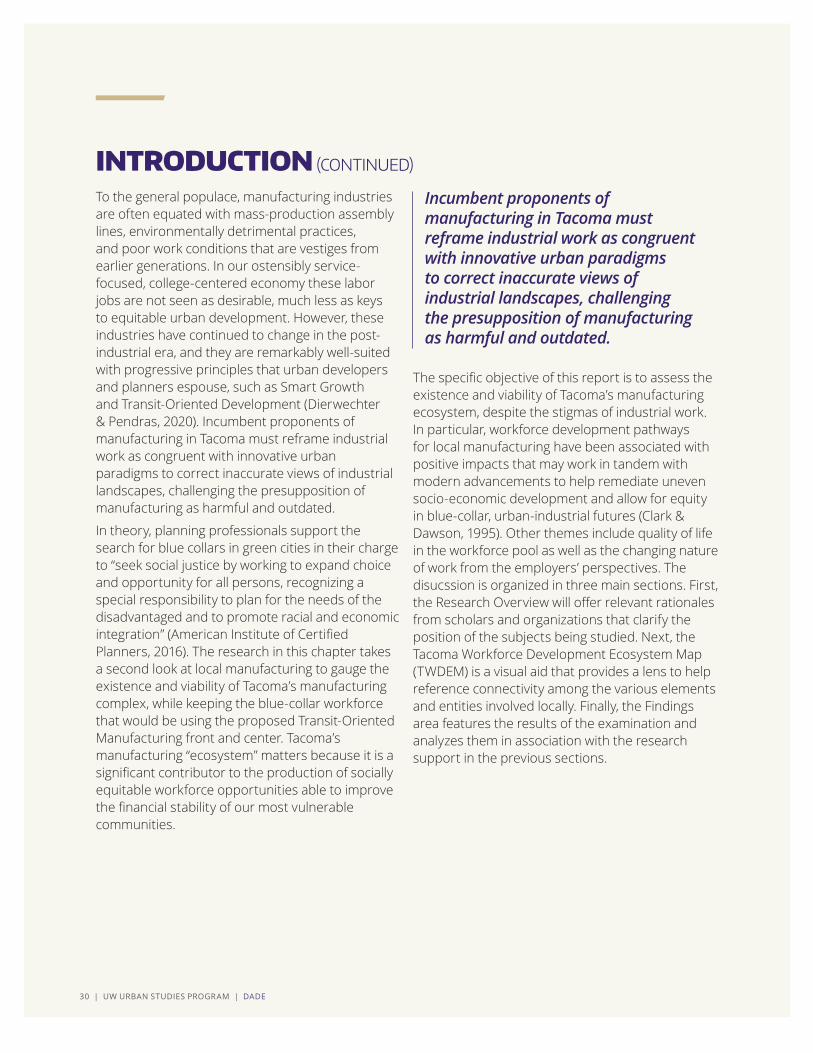
Figure 1: Author’s rendering
Figure 2: Research Approach
RESEARCH OVERVIEW
How has manufacturing changed as an industry, relevant to workforce development?
What is the current state of the manufacturing pool of labor?
Is there a way to create a useful visual inventory illustrating manufacturing ecosystem linkages?
INDUSTRY HISTORY
Decline of the Manufacturing Workforce
Economic Disposition of the Blue-Collar Labor Pool
Tacoma Workforce Development Ecosystem Map
LABOR PROFILE
LOCAL REPRESENTATION
confluence wherein the unrealized equity potential of manufacturing jobs to provide for unmet needs in local communities is being hampered by the lack of accessible workforce training as well as long-held biases, misconceptions, and a communication void.
Armed with a solid justification for the investigation (see Figure 2 below), my initial research approach was to survey national scholarship in relation to formal workforce development programming in the manufacturing space. I also explored community economic well-being indicators and information on the recent history of the industry to help identify workforce relevant changes. At this point, I began to develop more specific questions to use in the creation of the lens and tools that I would apply to comprehend Tacoma’s manufacturing workforce.
32 | UW URBAN STUDIES PROGRAM | DADE
There was a time in America when manufacturers were very common. Over the years, the national workforce has transitioned into sectors like healthcare and the retail trades as manufacturing employment has declined (Wilson, 2014). In 1953, approximately one-third of all employment was in manufacturing, but today it has fallen under 10 percent (DeSilver, 2017b). Outsourcing and offshoring (Christopherson, 2012) have been central to the fall, yet another important element was at play because “some of the manufacturing losses were the expression of definitional changes” (Clark & Clavel, 2012). Even so, after hitting and maintaining its peak through the late 1970’s when up to “42 percent of jobs were in larger plants”, much of the work of big industrial producers was outsourced to smaller businesses and “by 2009 the [large manufacturer jobs] figure was at 27 percent” (Clark & Clavel, 2012).
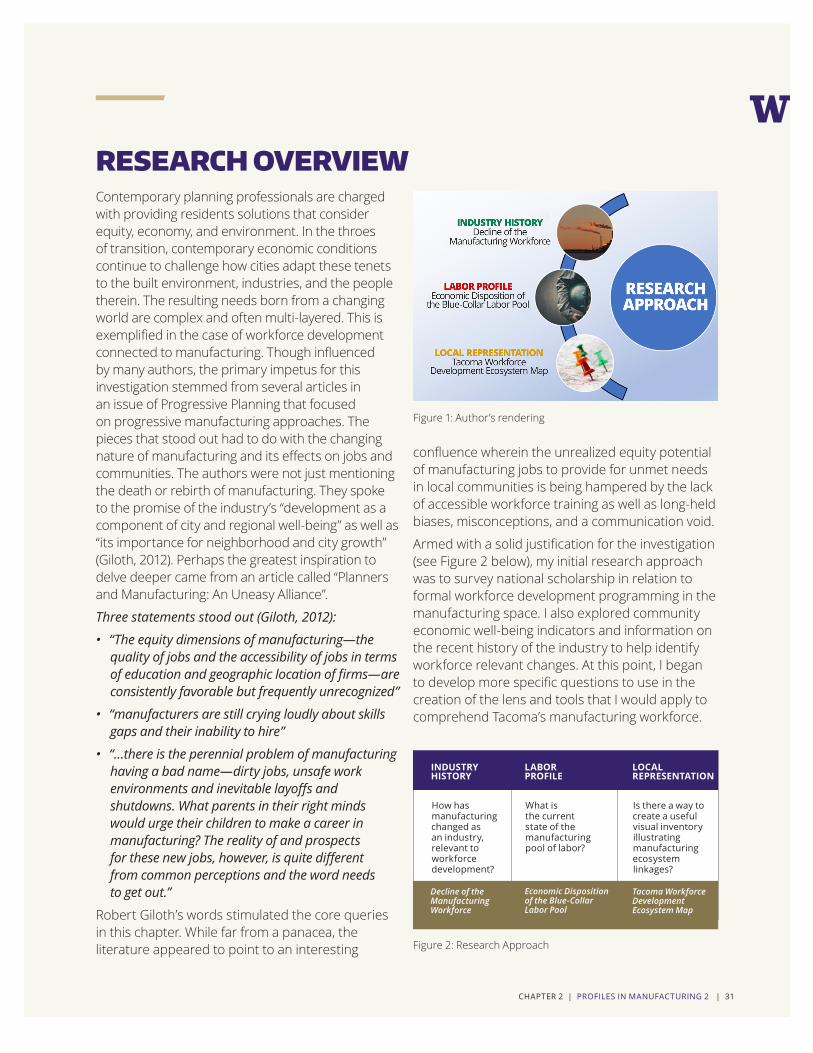
It is true that manufacturing as an industry has declined over the years, but “manufacturing output - the value of goods and products manufactured in the U.S. - has grown strongly” (DeSilver, 2017b). Recently, there has been a turnaround as domestic energy costs, previous labor costs, and the quality control abroad have softened and promoted an onshoring trend of manufacturing back to the U.S. (Christopherson, 2012). Referencing both the Bureau of Labor Statistics and the Bureau of Economic Analysis, the Pew Research Center reports that manufacturing still supports approximately 8.5 percent of the nation’s total employment and produced 18.5 percent of America’s gross output, over “5.4 trillion [dollars] worth of goods and products”, in 2016 (DeSilver, 2017b). The strength of the sector continues to be a significant stabilizing factor for American workers. In 2017, Christine Lagarde of the International Monetary Fund (IMF) remarked that the high productivity seen in manufacturing “is the most important source of higher income and rising living standards over the long term. It allows us to substantially grow the economic pie, creating
THE MANUFACTURING WORKFORCE
larger pieces for everyone” (DeSilver, 2017b). This information points to an American manufacturing industry that is not in permanent state of decline. Instead, it is a securing factor for our economy. Having identified value of manufacturing jobs, when applying these learnings to Tacoma it will be important to pay attention to the “labor supply and ‘skills mismatch’” reported by experts (Christopherson, 2012).
Figure 3: Employment to Output Comparison
CHAPTER 2 | PROFILES IN MANUFACTURING 2 | 33
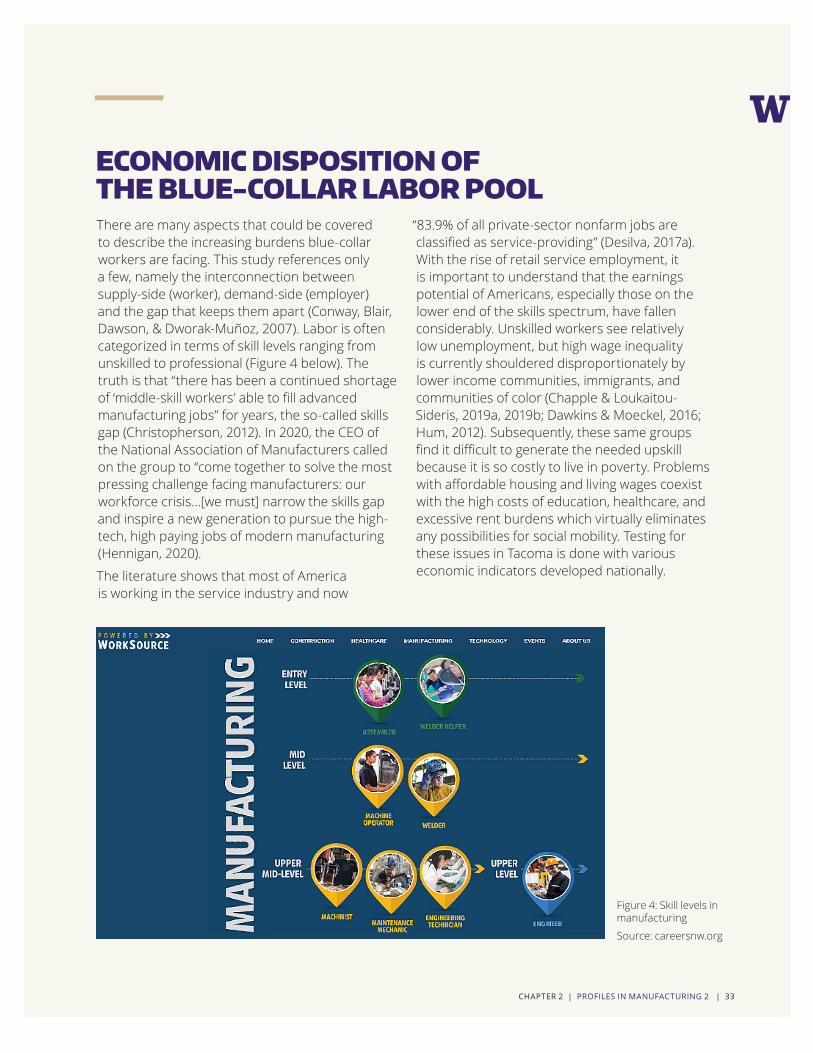
There are many aspects that could be covered to describe the increasing burdens blue-collar workers are facing. This study references only a few, namely the interconnection between supply-side (worker), demand-side (employer) and the gap that keeps them apart (Conway, Blair, Dawson, & Dworak-Muñoz, 2007). Labor is often categorized in terms of skill levels ranging from unskilled to professional (Figure 4 below). The truth is that “there has been a continued shortage of ‘middle-skill workers’ able to fill advanced manufacturing jobs” for years, the so-called skills gap (Christopherson, 2012). In 2020, the CEO of the National Association of Manufacturers called on the group to “come together to solve the most pressing challenge facing manufacturers: our workforce crisis…[we must] narrow the skills gap and inspire a new generation to pursue the high-tech, high paying jobs of modern manufacturing (Hennigan, 2020).
The literature shows that most of America is working in the service industry and now
“83.9% of all private-sector nonfarm jobs are classified as service-providing” (Desilva, 2017a). With the rise of retail service employment, it is important to understand that the earnings potential of Americans, especially those on the lower end of the skills spectrum, have fallen considerably. Unskilled workers see relatively low unemployment, but high wage inequality is currently shouldered disproportionately by lower income communities, immigrants, and communities of color (Chapple & Loukaitou-Sideris, 2019a, 2019b; Dawkins & Moeckel, 2016; Hum, 2012). Subsequently, these same groups find it difficult to generate the needed upskill because it is so costly to live in poverty. Problems with affordable housing and living wages coexist with the high costs of education, healthcare, and excessive rent burdens which virtually eliminates any possibilities for social mobility. Testing for these issues in Tacoma is done with various economic indicators developed nationally.
ECONOMIC DISPOSITION OF THE BLUE-COLLAR LABOR POOL
Figure 4: Skill levels in manufacturing
Source: careersnw.org
34 | UW URBAN STUDIES PROGRAM | DADE
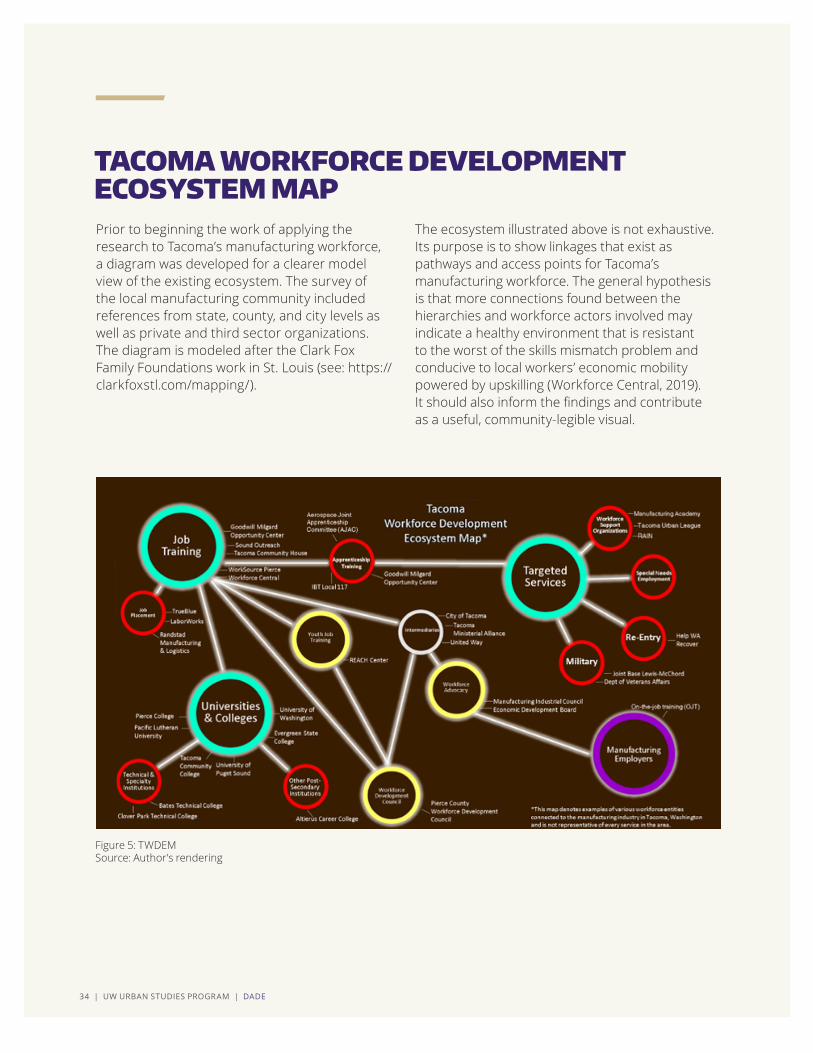
Prior to beginning the work of applying the research to Tacoma’s manufacturing workforce, a diagram was developed for a clearer model view of the existing ecosystem. The survey of the local manufacturing community included references from state, county, and city levels as well as private and third sector organizations. The diagram is modeled after the Clark Fox Family Foundations work in St. Louis (see: https://clarkfoxstl.com/mapping/).
The ecosystem illustrated above is not exhaustive. Its purpose is to show linkages that exist as pathways and access points for Tacoma’s manufacturing workforce. The general hypothesis is that more connections found between the hierarchies and workforce actors involved may indicate a healthy environment that is resistant to the worst of the skills mismatch problem and conducive to local workers’ economic mobility powered by upskilling (Workforce Central, 2019). It should also inform the findings and contribute as a useful, community-legible visual.
TACOMA WORKFORCE DEVELOPMENT ECOSYSTEM MAP
Figure 5: TWDEM Source: Author’s rendering
CHAPTER 2 | PROFILES IN MANUFACTURING 2 | 35
Scholarship emphasizes the quality of manufacturing jobs yet points to the skills gap as the shared, primary problem for the supply and demand-side groups. The samples taken to create the snapshot of Tacoma’s ecosystem showed a surprising amount of active networking. So, what is the problem exactly? Why aren’t workers emerging from training programs and instantly being hired into the good life? While searching for ways to create larger classification groups, two domains rose to the fore: Labor Equity and Workforce Connectivity.
LABOR EQUITY (SUPPLY-SIDE)The Puget Sound Regional Council (2009) notes that “...the people of the region, our economic prosperity, and our relationship to the planet are tied together in a mutually supportive and interdependent way. Social and environmental goals cannot be achieved without economic prosperity — and achieving prosperity is highly related to social well-being and environmental quality.”
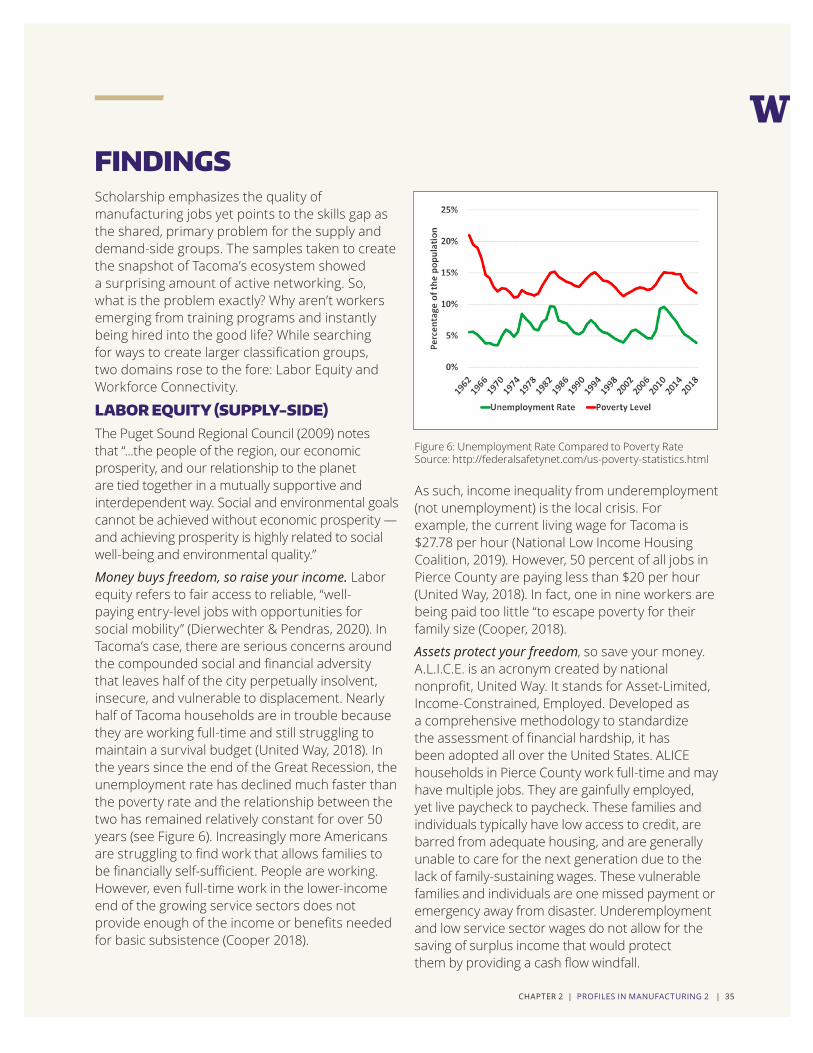
Money buys freedom, so raise your income. Labor equity refers to fair access to reliable, “well-paying entry-level jobs with opportunities for social mobility” (Dierwechter & Pendras, 2020). In Tacoma’s case, there are serious concerns around the compounded social and financial adversity that leaves half of the city perpetually insolvent, insecure, and vulnerable to displacement. Nearly half of Tacoma households are in trouble because they are working full-time and still struggling to maintain a survival budget (United Way, 2018). In the years since the end of the Great Recession, the unemployment rate has declined much faster than the poverty rate and the relationship between the two has remained relatively constant for over 50 years (see Figure 6). Increasingly more Americans are struggling to find work that allows families to be financially self-sufficient. People are working. However, even full-time work in the lower-income end of the growing service sectors does not provide enough of the income or benefits needed for basic subsistence (Cooper 2018).
As such, income inequality from underemployment (not unemployment) is the local crisis. For example, the current living wage for Tacoma is $27.78 per hour (National Low Income Housing Coalition, 2019). However, 50 percent of all jobs in Pierce County are paying less than $20 per hour (United Way, 2018). In fact, one in nine workers are being paid too little “to escape poverty for their family size (Cooper, 2018).
Assets protect your freedom, so save your money. A.L.I.C.E. is an acronym created by national nonprofit, United Way. It stands for Asset-Limited, Income-Constrained, Employed. Developed as a comprehensive methodology to standardize the assessment of financial hardship, it has been adopted all over the United States. ALICE households in Pierce County work full-time and may have multiple jobs. They are gainfully employed, yet live paycheck to paycheck. These families and individuals typically have low access to credit, are barred from adequate housing, and are generally unable to care for the next generation due to the lack of family-sustaining wages. These vulnerable families and individuals are one missed payment or emergency away from disaster. Underemployment and low service sector wages do not allow for the saving of surplus income that would protect them by providing a cash flow windfall.
FINDINGS
Figure 6: Unemployment Rate Compared to Poverty Rate Source: http://federalsafetynet.com/us-poverty-statistics.html
36 | UW URBAN STUDIES PROGRAM | DADE
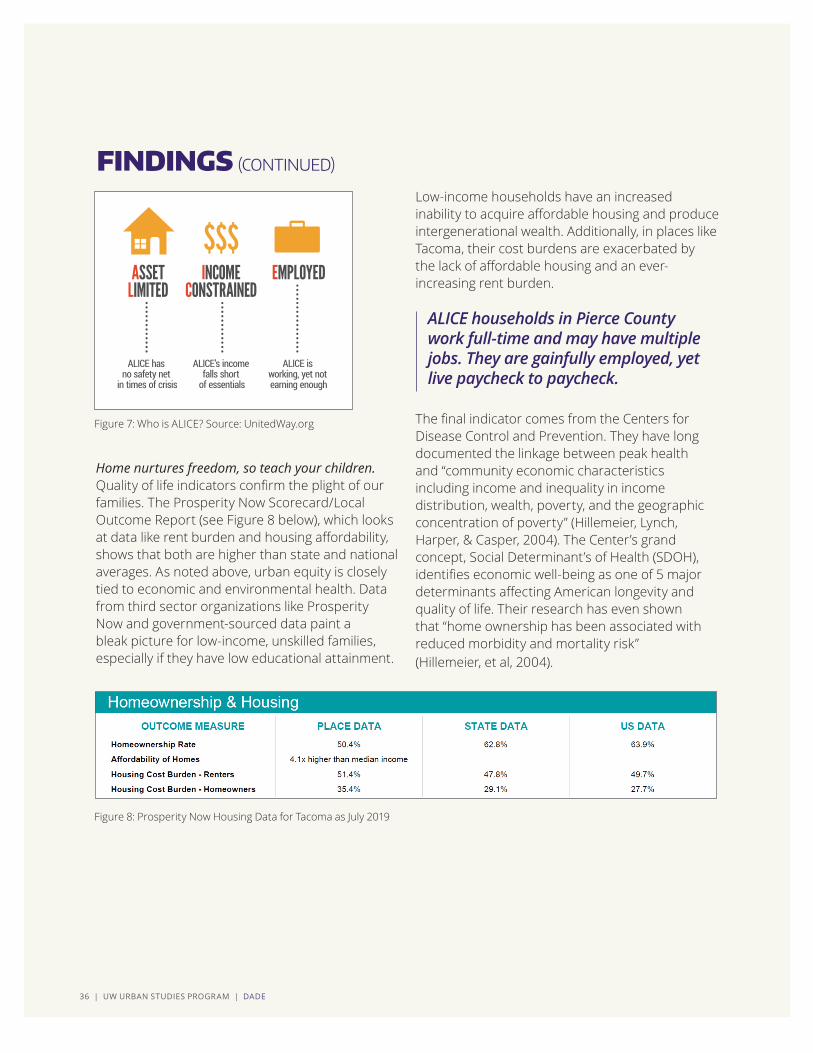
Home nurtures freedom, so teach your children. Quality of life indicators confirm the plight of our families. The Prosperity Now Scorecard/Local Outcome Report (see Figure 8 below), which looks at data like rent burden and housing affordability, shows that both are higher than state and national averages. As noted above, urban equity is closely tied to economic and environmental health. Data from third sector organizations like Prosperity Now and government-sourced data paint a bleak picture for low-income, unskilled families, especially if they have low educational attainment.
Low-income households have an increased inability to acquire affordable housing and produce intergenerational wealth. Additionally, in places like Tacoma, their cost burdens are exacerbated by the lack of affordable housing and an ever-increasing rent burden.
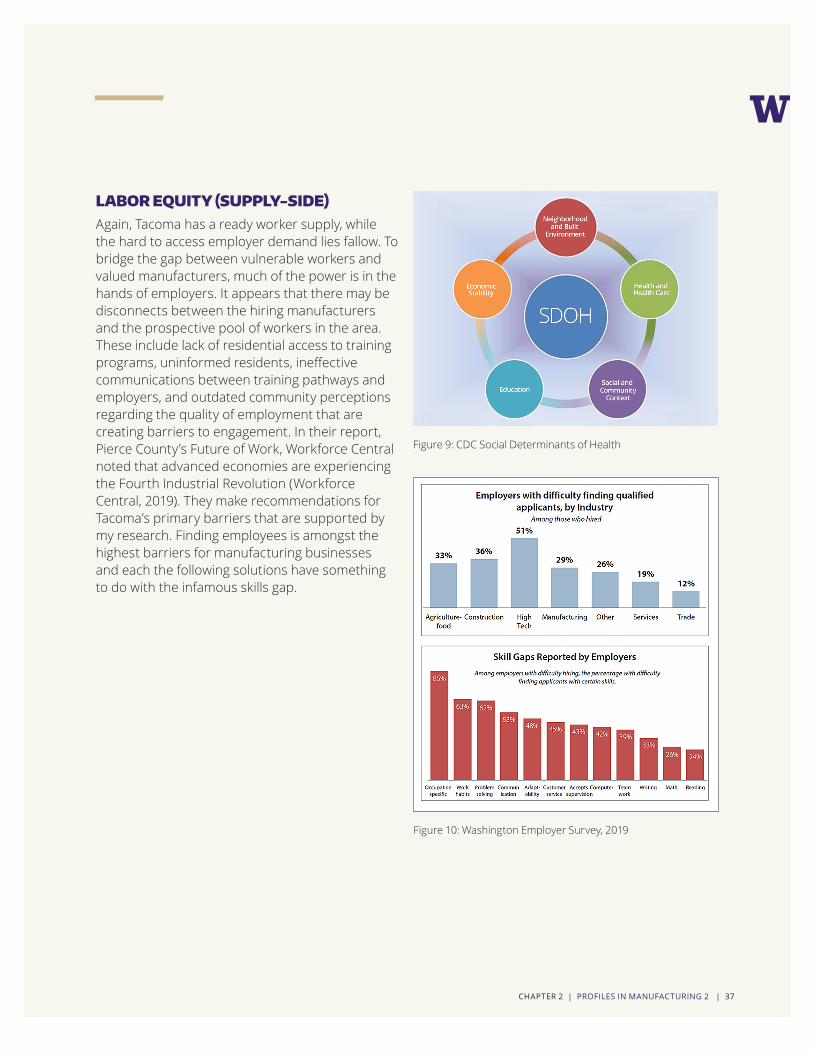
The final indicator comes from the Centers for Disease Control and Prevention. They have long documented the linkage between peak health and “community economic characteristics including income and inequality in income distribution, wealth, poverty, and the geographic concentration of poverty” (Hillemeier, Lynch, Harper, & Casper, 2004). The Center’s grand concept, Social Determinant’s of Health (SDOH), identifies economic well-being as one of 5 major determinants affecting American longevity and quality of life. Their research has even shown that “home ownership has been associated with reduced morbidity and mortality risk” (Hillemeier, et al, 2004).
FINDINGS (CONTINUED)
Figure 7: Who is ALICE? Source: UnitedWay.org
Figure 8: Prosperity Now Housing Data for Tacoma as July 2019
ALICE has no safety net
in times of crisis
ALICE’s income falls short
of essentials
ALICE is working, yet not earning enough
ASSETLIMITED
INCOMECONSTRAINED
EMPLOYED
ALICE households in Pierce County work full-time and may have multiple jobs. They are gainfully employed, yet live paycheck to paycheck.
CHAPTER 2 | PROFILES IN MANUFACTURING 2 | 37
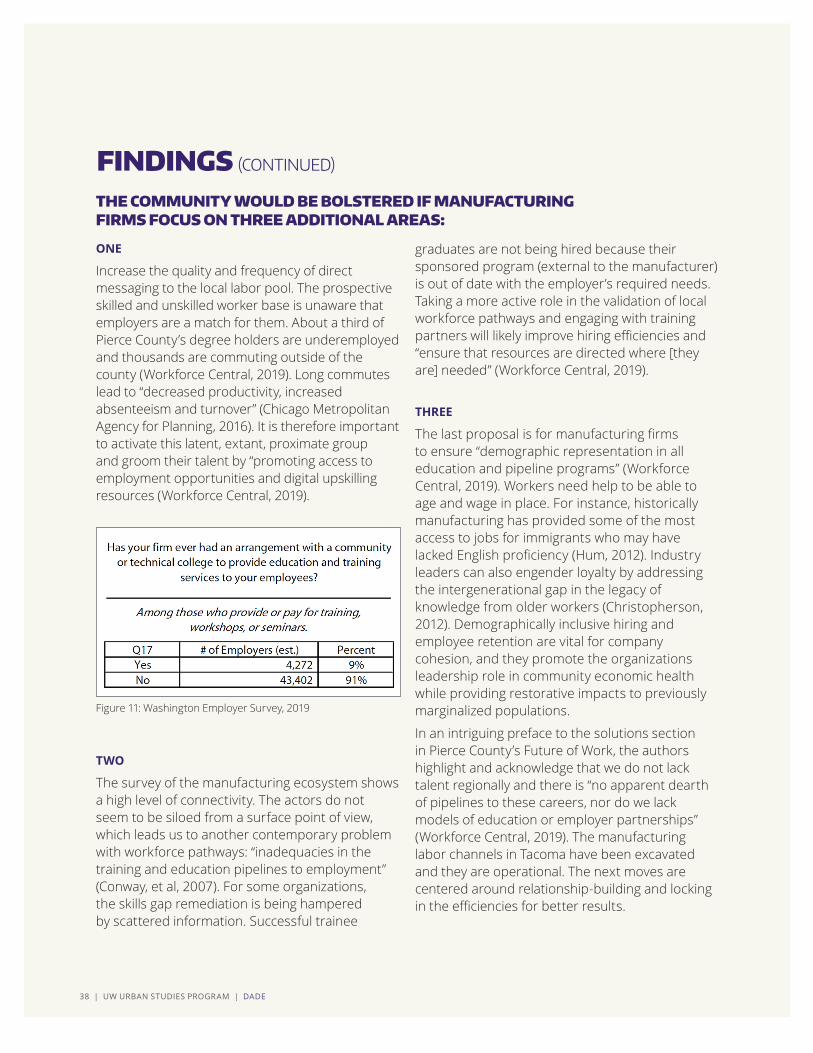
Figure 10: Washington Employer Survey, 2019
Figure 9: CDC Social Determinants of Health
LABOR EQUITY (SUPPLY-SIDE)Again, Tacoma has a ready worker supply, while the hard to access employer demand lies fallow. To bridge the gap between vulnerable workers and valued manufacturers, much of the power is in the hands of employers. It appears that there may be disconnects between the hiring manufacturers and the prospective pool of workers in the area. These include lack of residential access to training programs, uninformed residents, ineffective communications between training pathways and employers, and outdated community perceptions regarding the quality of employment that are creating barriers to engagement. In their report, Pierce County’s Future of Work, Workforce Central noted that advanced economies are experiencing the Fourth Industrial Revolution (Workforce Central, 2019). They make recommendations for Tacoma’s primary barriers that are supported by my research. Finding employees is amongst the highest barriers for manufacturing businesses and each the following solutions have something to do with the infamous skills gap.
38 | UW URBAN STUDIES PROGRAM | DADE
Figure 11: Washington Employer Survey, 2019
ONE
Increase the quality and frequency of direct messaging to the local labor pool. The prospective skilled and unskilled worker base is unaware that employers are a match for them. About a third of Pierce County’s degree holders are underemployed and thousands are commuting outside of the county (Workforce Central, 2019). Long commutes lead to “decreased productivity, increased absenteeism and turnover” (Chicago Metropolitan Agency for Planning, 2016). It is therefore important to activate this latent, extant, proximate group and groom their talent by “promoting access to employment opportunities and digital upskilling resources (Workforce Central, 2019).
TWO
The survey of the manufacturing ecosystem shows a high level of connectivity. The actors do not seem to be siloed from a surface point of view, which leads us to another contemporary problem with workforce pathways: “inadequacies in the training and education pipelines to employment” (Conway, et al, 2007). For some organizations, the skills gap remediation is being hampered by scattered information. Successful trainee
graduates are not being hired because their sponsored program (external to the manufacturer) is out of date with the employer’s required needs. Taking a more active role in the validation of local workforce pathways and engaging with training partners will likely improve hiring efficiencies and “ensure that resources are directed where [they are] needed” (Workforce Central, 2019).
THREE
The last proposal is for manufacturing firms to ensure “demographic representation in all education and pipeline programs” (Workforce Central, 2019). Workers need help to be able to age and wage in place. For instance, historically manufacturing has provided some of the most access to jobs for immigrants who may have lacked English proficiency (Hum, 2012). Industry leaders can also engender loyalty by addressing the intergenerational gap in the legacy of knowledge from older workers (Christopherson, 2012). Demographically inclusive hiring and employee retention are vital for company cohesion, and they promote the organizations leadership role in community economic health while providing restorative impacts to previously marginalized populations.
In an intriguing preface to the solutions section in Pierce County’s Future of Work, the authors highlight and acknowledge that we do not lack talent regionally and there is “no apparent dearth of pipelines to these careers, nor do we lack models of education or employer partnerships” (Workforce Central, 2019). The manufacturing labor channels in Tacoma have been excavated and they are operational. The next moves are centered around relationship-building and locking in the efficiencies for better results.
THE COMMUNITY WOULD BE BOLSTERED IF MANUFACTURING FIRMS FOCUS ON THREE ADDITIONAL AREAS:
FINDINGS (CONTINUED)
CHAPTER 2 | PROFILES IN MANUFACTURING 2 | 39
We should care about manufacturing workforce development because it has the potential to bring the stabilizing economic chops that so many locals need. Eliminating income disparities increases our economy and reduces the severity of economic downturns. Financial inclusion is both ethically and economically beneficial because healthy, sustainable communities are made up of people who have living wage jobs and feel confident about their economic futures. Layered TOD applications are beneficially synergistic in proximity to focused manufacturing activity and so TOM is born ( Jamme et al, 2019). There is also a beneficial synergy to be had for our evolving urban manufacturing businesses who are increasingly onshore and reportedly prepared to add to their teams. To attempt this utopian goal, residents need the skills to advance along a steady path of employment that permits them to manage their money outside of constant crises.
“We will become a majority people of color nation by 2044; already, 46 percent of all youth are of color. Yet those entering the workforce today have fewer opportunities for economic mobility and success than their parents, even as these young people make up the most diverse generation in our nation’s history” (Equitable Innovation Economies,2016).
There are certainly more factors, important ones like race, gender, and age, that were outside of the scope of this report. Frankly, to reach significant social justice goals, our people need to have broad access to quality employment. Locally we are seeing increases in population growth, diversity, and the cost of living with coinciding decreases in living wage work and the market share of industries, like manufacturing, that have historically supported blue-collar unskilled and skilled workers. Understanding both the localized human requirements for employment and the nature of the existing manufacturing establishment will be instrumental in strengthening a beneficial workforce praxis for the city. For our Black and indigenous people of color (BIPOC), resident low-income families, the Makers, and the large industrial manufacturers, Transit-Oriented Manufacturing is looking good. It has promise as a practical tool to protect and promote workforce social equity in the blue-collar, green cities we hope to create.
CONCLUSION“We will become a majority people of color nation by 2044; already, 46 percent of all youth are of color. Yet those entering the workforce today have fewer opportunities for economicmobility and success than their parents, even as these young people make up the most diverse generation in our nation’s history”

40 | UW URBAN STUDIES PROGRAM | MATTHEWS AND CHURCHILL