chapter 2: productivity: improving conditions for growth · the productivity-related research...
TRANSCRIPT
02PRODUCTIVITY: IMPROVING CONDITIONS FOR GROWTH
I. Identifying sources of growth
II. Productivity growth: Diagnosis1. Demographics hampering growth prospects2. Structural decomposition of productivity growth3. Germany in an international comparison4. Competitiveness and current account
III. Possible causes1. Productivity paradox of digitalisation2. Low business dynamism3. Management and technology4. Composition effects and globalisation5. The relationship between capital expenditure and productivity
IV. Concluding remarks
A differing opinion
References
This is a translated version of the original German-language chapter "Produkti-vität: Wachstumsbedingungen verbessern", which is the sole authoritative text. Please cite the original German-language chapter if any reference is made to this text.

SUMMARYProductivity growth in many advanced economies has slowed. Germany is no exception here. Aggregate productivity in this country is actually stagnating at present. As hardly any further growth stimulus can be expected to come from labour input, the key question is how the Germany economy’s growth potential can be raised through productivity growth.
Productivity is the key factor driving material prosperity over the long term. Productivity levels continue to vary significantly in some cases from one advanced economy to another. Although labour productivity within Europe has certainly converged to some extent, a few southern European countries have failed to keep up with the more productive economies. This process has been accompanied by a loss of price competitiveness that has only partially been regained.
Two key factors determining productivity growth are investment in physical capital and technologi-cal progress. Human capital and public institutions also play a crucial role. Investment and produc-tivity are interrelated. Investment in the capital stock can raise productivity and, conversely, produc-tivity improvements can lead to new investment. Other factors, such as the conditions available for funding investment, are also likely to be important. One of the government’s main duties is to create a supportive environment for businesses. This includes a functioning public infrastructure.
Given the pervasiveness of technological innovation, the sluggish performance of productivity appears to be a paradox. One of the main reasons in Germany’s case is likely to be delays in adop-ting new technologies. There has also been a broad-based decline in the numbers of business start-ups. This could be attributable to Germany’s product and labour market regulation, which remains strict compared with other countries. It would make sense to reduce barriers to market entry – especially in services. A further explanation for the lower productivity growth is our aging society. Lifelong learning could help older workers adapt to new technologies and would boost inno-vation. Action should also be taken to address existing deficits of start-up finance, especially in the provision of private venture capital.
Economies of scale are important in many areas such as research and digital services. It therefore makes sense to coordinate these at European level in line with the subsidiarity principle. Existing barriers to a completion of the common market in services should be removed. The tightening of the EU Posting of Workers Directive goes in the wrong direction. The competitiveness of the Euro-pean economy, not its protection, should be in the focus.
Productivity: Improving conditions for growth – Chapter 2
KEY MESSAGES Productivity growth has been slowing in the developed economies. This is particularly proble-
matic for Germany due to its ageing population.
Education, research and innovation are required in order to achieve higher levels of productivity growth. It is important to strenghten the transformation of knowledge into economic success.
Therefore, an environment that sets the right incentives for private investment is required. In turn, this will help to improve the German economy’s ability to innovate.

Chapter 2 – Productivity: Improving conditions for growth
86 German Council of Economic Experts – Annual Report 2019/20
I. IDENTIFYING SOURCES OF GROWTH
132. Improvements in aggregate productivity are a key factor in the growth of an economy and the associated growth in material prosperity and individual scope for development. Productivity growth in many advanced economies has slowed compared with previous decades. ITEM 157 Before effective measures to increase productivity growth can be taken, it is necessary to identify the causes of this decline.
133. The Council of the European Union (EU) has recommended that the member states set up national productivity boards (Council of the European Union, 2016). These boards have been tasked with assessing and analysing productivity trends and competitiveness. The issues that they need to address include chal-lenges in the respective member state as well as aspects of the European Eco-nomic and Monetary Union (EMU) and the EU. The German government has entrusted the German Council of Economic Experts (GCEE) with this task. In the past the GCEE has extensively examined productivity trends in Germany as part of its legal remit (most recently in GCEE Annual Report 2015 items 590 ff.). The GCEE also publishes detailed projections of the German economy’s potential output in its annual reports. ITEMS 130 FF.
134. Growth in advanced economies results in particular from knowledge, knowledge sharing and diffusion. This includes knowledge that is directly accociated with people (human capital), specialisation in research fields and institutions such that knowledge can be shared with a growing number of people allowing an ad-vantageous adaption, change and increase of economically applicable knowledge, or technologies that can be transferred between companies and economies (Giersch, 1981; Helmstädter, 2000, 2001). ITEM 199 The prosperity of an economy ultimately depends on the extent to which innovation enables new technologies to be created and productively employed. Wise economic policy therefore encourages institutions that generate and disseminate knowledge and, at the same time, creates the framework within which innovation and entre-preneurship can flourish. ITEMS 283 FF.
135. Investment in the productive capital stock plays a key role in determining levels of aggregate productivity over time. One of the government’s main duties is to create the right environment for businesses. This includes a competitive tax system and the provision of a functioning public infrastructure funded by state investment. ITEM 215 Focusing on investment in physical capital alone, howev-er, is not enough. Investment in human capital such as education and manage-ment skills also has a significant impact on productivity levels.
136. The productivity-related research conducted by the GCEE is intended to help understand the current trends and flag up economic policy measures that would enable the forces of growth to be strengthened over the long term. Detailed analysis at the disaggregated level can provide important clues as to the causes of the slowdown in productivity growth. Reallocation of production fac-tors between sectors affects aggregate productivity if productivity varies from

Productivity: Improving conditions for growth – Chapter 2
Annual Report 2019/20 – German Council of Economic Experts 87
one sector to another. ITEMS 185 FF. At the same time, analysis of productivity trends at the company level can provide information on potential factors and thus suggest possible ways of raising productivity. ITEMS 194 FF. And, last but not least, productivity is affected by demographic change and by changes in the composition of the labour force. ITEMS 200 FF.
137. Productivity is closely associated with an economy’s competitiveness, which is partly determined by supply-side conditions. ITEMS 165 FF. The EU has recom-mended that the national productivity committees examine the issue of competi-tiveness (Council of the European Union, 2016). One key factor here is non-price competitiveness (GCEE Annual Report 2014 box 7). If firms manage to operate competitively in global markets by introducing innovative products, this puts the economy on a steeper growth trajectory. The economic policy debate should therefore focus on the productivity of private actors. Governments should provide a functioning infrastructure and, where necessary, implement structural reforms in areas such as taxation and regulation in order to unleash the forces of growth.
138. Price competitiveness also plays a crucial role in economic growth and long-term prosperity. If productivity growth fails to keep pace with pay rises, this can result in a loss of price competitiveness. Although price competitiveness is a key factor in short-term economic performance, sustainable growth cannot be en-sured by internal or external devaluation. The economic policy options available are in any case limited by Germany’s system of free collective bargaining. The government can only indirectly influence this process by, for example, im-plementing labour market policies. When conducting their analysis, the national productivity boards must take account of such national wage-setting practices operating in the respective member states (Council of the European Union, 2016).
139. Discussions about Germany’s current account surplus must be separat-ed from debates on productivity and competitiveness. The amount of an econo-my’s current account balance depends on a large number of factors (GCEE An-nual Report 2014 items 400 ff.). From an economic perspective it is questiona-ble whether a target for the current account balance is desirable (GCEE Annual Report 2014 items 404 f.). Experience of crises in Latin America, Asia and, not least, the euro area has shown that excessive current account deficits can pose a risk of strong adjustment responses. This is not true of current account surplus-es to the same extent. Viewed at the global level, crises in deficit countries can impact on surplus countries.
Although national fiscal policy can influence the current account balance, it is not advisable for economic and fiscal policy to set a specific target for this balance. Rather, stabilisation policies should aim to keep economic output at its potential level. In addition, structural economic policy conditions should be adjusted in such a way that they strengthen growth potential regardless of whether they influence the current account. This can help to reduce Germa-ny’s current account surplus.

Chapter 2 – Productivity: Improving conditions for growth
88 German Council of Economic Experts – Annual Report 2019/20
II. PRODUCTIVITY GROWTH: DIAGNOSIS
140. Germany – in common with most advanced economies – is facing two major challenges. Ongoing demographic change and more modest productivity im-provements are curbing the country’s medium- and long-term growth potential. There are, however, differences between national economies. One of these re-lates to competitiveness. There was a significant divergence in the euro area dur-ing the 2000s, when many member states’ price competitiveness deteriorated substantially compared with Germany’s. Moreover, the economic recovery has ground to a halt in many places, and there remain significant variations in productivity both within Europe and between the advanced economies.
1. Demographics hampering growth prospects
141. The volume of work is likely to contribute very little to Germany’s growth potential over the medium term. ITEM 130 The main reasons for this are the retirement of growing numbers of baby boomers as a result of demographic change, the lower levels of immigration compared with previous years, and an estimated equilibrium rate of unemployment (non-accelerating inflation rate of unemployment, or NAIRU) that is already at a historically low level. CHART 26 LEFT
142. However, the participation rate is expected to rise slightly after already hav-ing increased by around 8 percentage points since the mid-1990s. Data from the Organisation for Economic Co-operation and Development (OECD) show that Germany has a high participation rate compared with other countries. Nonethe-less, there are still gender-related differences. The participation rate for women remains roughly 10 percentage points lower than that for men. Over the coming years, the higher share of 55- to 70-year-olds is likely to slow the rise in the par-ticipation rate because these age cohorts have a relatively low participation rate (Breuer and Elstner, 2017).
The number of hours worked per employee is generating slightly negative growth stimulus at present, although this decrease is less pronounced than it was in the 1990s and 2000s. The main reason for this trend back then was the sharp rise in the proportion of part-time work (Breuer and Elstner, 2017). As no further significant growth stimulus is expected to come from the labour factor in the foreseeable future, higher productivity growth is therefore needed in order to raise the German economy’s growth potential.
143. Measures of productivity relate output produced and the inputs used in the production process (GCEE Annual Report 2015 box 22). Productivity within a macroeconomic context can be expressed in terms of individual production fac-tors – especially labour and capital. Measures of labour productivity by in-dustrial sector use the ratio of price-adjusted gross value added to labour input, while productivity measures for the economy as a whole use the ratio of gross domestic product (GDP) to labour input. A distinction can also be made between

Productivity: Improving conditions for growth – Chapter 2
Annual Report 2019/20 – German Council of Economic Experts 89
productivity per hour and productivity per worker. The first of these ratios measures output divided by the number of hours worked, while the second measures output divided by the number of workers. A further single-factor measure of productivity is capital productivity, which is determined by the ratio of GDP to the capital stock.
144. Germany’s current productivity performance is extremely weak. CHART 26 RIGHT Having grown by only 0.3 % in 2018, hourly productivity is likely to stag-nate this year. This is partly attributable to the robust performance of the la-bour market, which has so far been only marginally affected by the economic slowdown, which means that the ratio of GDP to employment is declining. ITEM
94 However, productivity grew only modestly even during the previous economic upturn.
On the one hand, the increase in employment – such as the success in inte-grating immigrants into the labour market – has been an encouraging develop-ment and has helped to mitigate labour shortages in recent years (GCEE Annual Report 2018 items 285 ff.). On the other hand, the strong performance of the la-bour market has concealed the underlying weakness of productivity. Given that Germany’s labour potential is set to decline, the weakness of productivity is likely to become more evident again in GDP growth rates. In its medium-term projection for the years 2018 to 2024 the GCEE estimates that potential output will grow at an average rate of 1.3 %. By the end of the projection period, howev-er, no further growth stimulus is likely to come from the volume of work, with growth potential then falling to around 1.1 %. ITEM 130
CHART 26
Selected results of the GCEE's estimates of potential
0
3
6
9
12
57
62
67
72
77
1971 75 79 83 87 91 95 99 03 07 11 15 19 23
Participation and unemployment rate
% %
Participation rate¹ Participation rate(potential)²
Unemployment rate³(right-hand scale)
NAIRU(right-hand scale)2,4
Projection period
2024-4
-3
-2
-1
0
1
2
3
4
5
6
1971 75 79 83 87 91 95 99 03 07 11 15 19 23
Growth of productivity per working hour
Percentage points
Capital intensity Total factor productivity
Change on previous year (%)
Change of potential on previous year (%)
Projection period
2024
1 – Labour force as a percentage of total working-age population. 2 – Estimate by the GCEE; excludes refugee migration since 2014. 3 – 100*(EWP-ET)/EWP. EWP: Labour force (national concept); ET: persons in employment (domestic concept). 4 – Unemployment rate given price stability (GCEE Annual Report 2017 box 5).
Sources: Federal Statistical Office, OECD, own calculations© Sachverständigenrat | 19-332
Chapter 2 – Productivity: Improving conditions for growth
90 German Council of Economic Experts – Annual Report 2019/20
The GCEE’s medium-term projection adopts a production function approach (Breuer and Elstner, 2017). This involves decomposing potential economic output into capital and la-bour inputs as well as total factor productivity (TFP). Labour input is analysed in particular detail. A cohort model is used, for example, to take account of age- and gender-specific labour market participation rates. Analysis of the capital stock at the disaggregated level differentiates between various capital goods such as equipment and residential buildings. This takes account of differences in capital use. TFP constitutes the residual. In order to determine the potential, statistical filters are used to remove cyclical fluctuations from the time series determined in this way.
145. Total factor productivity (TFP) plays a key role in long-term growth poten-tial. It is measured as the ratio of gross value added to the aggregate factors of production inputs. TFP growth is the residual after the measured changes in the individual factors of production – weighted with their output elasticities – have been deducted from the output growth calculated. The sustained growth achieved by the industrialised nations since the Industrial Revolution – especial-ly the significant rise in gross domestic product per inhabitant – has mainly re-sulted from the increase in total factor productivity rather than from the growth in the physical capital stock.
146. The basic Solow growth model implies that the capital stock per effective unit of labour converges towards a constant level. Although it is possible for less ad-vanced economies to achieve higher growth temporarily through capital accu-mulation, the diminishing marginal product of capital ensures that they eventu-ally converge towards an equilibrium growth path. Here the growth in economic output per inhabitant equals the rate of technological progress.
Innovation is therefore crucial for sustained growth. Increases in TFP have a direct and indirect impact on productivity. Firstly, higher TFP enables existing factors of production to be used more productively. And, secondly, increases in TFP can ensure that the use of additional factors of production becomes more productive, thereby, for example, raising the profitability of investment. Recent growth theory attempts to explain technological progress in terms of a general increase in knowledge as a result of research and development as well as specific human capital. BOX 5
BOX 5 Recent growth theory and determinants of long-run productivity growth
Growth theories are designed to explain economic growth and the reasons why economic perfor-
mance varies from country to country. The Solow-Swan model devised by Solow (1956) and Swan
(1956) laid the foundations for neoclassical growth theory (Acemoglu, 2009). Its starting point is an
aggregate production function that represents the production side of an economy. The factors of
production are capital (K) and labour (L) as well as labour-saving technological progress (A). The
aggregate production (Y) follows the function = , .
If a Cobb-Douglas production function is used, the approximated per-capita growth,∆lny , can be
attributed to two different sources,

Productivity: Improving conditions for growth – Chapter 2
Annual Report 2019/20 – German Council of Economic Experts 91
∆ = ∆ + 1 − ∆ , i.e. to an increase in the per-capita capital stock, ∆ , and to technological progress ∆ . The
parameters and 1- denote the output elasticities of capital and labour. The Solow-Swan model
shows how saving, population growth and technological progress determine economic growth. If la-
bour efficiency improvements are disregarded, and given the diminishing marginal product of capital,
then sustained long-term per-capita growth can only be achieved through technological progress.
However, technological progress is exogenously determined in the Solow-Swan model, which means
that the model can only describe growth but cannot explain its causes.
In order to explain growth endogenously, Romer (1986) defined the concept of capital more broadly
to include human capital – i.e. knowledge – in particular. Unlike in the Solow-Swan model, capital in
the AK model exhibits a constant marginal product rather than a declining one (Acemoglu, 2009).
The AK model thus enables long-run growth to be represented endogenously. ‘Knowledge production’
is of great importance in understanding technological progress in this strand of research. Education
as well as research and development (R&D) play a crucial role. But knowledge is not a purely public
good here. Although the use of knowledge is non-rival, third parties can be prevented from using it for
a certain period of time, for example through patents (Romer, 1994). This knowledge advantage can
confer market power, for example when increasing returns to scale from technology are used (Romer,
1994). The resultant incentives for firms to invest in knowledge generation explain growth in terms of
the model (endogenous growth theory). This strand of recent growth theory emphasises the role of
human capital. Technological progress depends on this investment (Romer, 1986). It is what makes
lasting technological progress possible (Lucas, 1988).
Acemoglu et al. (2005) highlight the role of institutions, drawing a distinction between economic and
political institutions. Whereas the former define the economic framework, such as the protection of
property rights, the latter determine the legal system in democracies or dictatorships. It is also im-
portant to take account of the political power of societal groups that do not belong to political institu-
tions (Acemoglu and Robinson, 2012). ‘Good’ institutions that guarantee property rights and wide
access to resources are, according to Acemoglu et al. (2005), causal in ensuring strong economic
growth.
Institutions and the importance of human capital can be even more broadly defined. For example, the
relationship between economic growth and development of the financial system is emphasised (King
und Levine, 1993; Rajan und Zingales 1998; Levine, 2005). There is also a relationship between
growth and the quality of educational institutions (Hanushek and Wößmann, 2010). And, last but not
least, a differentiation with regards to the characteristics of political systems can be made, for exam-
ple in terms of the productivity discrepancies between systems based on direct and representative
democracy (Feld and Savioz, 1997; Blomberg et al., 2004) or in terms of the impact that federalism
and decentralisation have on economic growth (Baskaran et al., 2016). Given the considerable im-
portance of the institutional framework in general, economic policy plays a key role in long-run
productivity growth.
Building on Schumpeter, moreover, a branch of research has developed which views creative de-
struction as a necessary process in achieving lasting, sustainable growth (Giersch, 1984; Grossman
and Helpman, 1991; Aghion and Howitt, 1992). This theory focuses on firms that use new innovative
products to replace old technologies, thereby achieving productivity gains. A crucial role is played
here by competition policy, although the relationship between competition and productivity growth is
non-linear (Aghion et al., 2014). Productivity growth initially rises as competition increases, especially
as the entry of new firms to the market raises the pressure on established firms. Above a certain
point, however, greater competition can result in lower productivity growth. Inadequate patent protec-
tion, for example, could lead to a situation whereby it is not worthwhile for firms to invest in research
and development.

Chapter 2 – Productivity: Improving conditions for growth
92 German Council of Economic Experts – Annual Report 2019/20
2. Structural decomposition of productivity growth
147. The productivity of individual inputs can be raised by the greater use of other factors of production or by technological progress. Measured labour productivity can increase if investment yields a larger or more productive capital stock that enables the same labour input to generate more output. A decomposition of productivity growth reveals that the modest rise in capital inputs has been large-ly responsible for the trend slowdown in productivity growth since the beginning of the 1990s. CHART 26 RIGHT
The problem of weak investment has therefore repeatedly been diag-nosed for Germany in the past. Analysis of the various capital goods reveals that the poor performance of construction investment after Germany’s reunifica-tion boom had subsided had a particularly adverse impact on capital intensity (GCEE Annual Report 2015 item 639; GCEE Annual Report 2016 items 279 ff.). By contrast, construction investment in recent years has been fairly strong. CHART 27 LEFT Private construction activity is likely to have been primarily driven by higher demand for accommodation and the continued low level of interest rates (GCEE Annual Report 2018 items 656 ff.). At the same time, prices in the construction sector are rising rapidly on the back of strong demand for buildings and the current capacity constraints. ITEM 83
148. Capital spending on construction constitutes the majority of public-sector in-vestment, accounting for roughly 53 % of total government spending. However, the state accounts for only a little more than 12 % of total construction invest-ment, which is very low compared with the private sector’s share. Government spending as a proportion of GDP has recently increased slightly. Higher con-struction prices are likely to have played a role here. Further expansion of the
CHART 27
Changes in investment levels during expansion periods¹
80
90
100
110
120
130
140
150
-4 0 4 8 12 16 20 24 28 32 36 40
Construction investment
Trough = 100
Quarters since trough
80
90
100
110
120
130
140
150
-4 0 4 8 12 16 20 24 28 32 36 40
Investment in machinery and equipment²
Trough = 100
Quarters since trough
1993Q2 to 2001Q1 2003Q2 to 2008Q1 2009Q2 to 2019Q2
1 – The chart shows changes in investment levels since the relevant trough of the economic cycle. The data include all private and government in-vestment in construction, machinery and equipment and have been price adjusted as well as seasonally and calendar adjusted. 2 – Including mili-tary weapons systems.
Sources: Federal Statistical Office, own calculations© Sachverständigenrat | 19-197

Productivity: Improving conditions for growth – Chapter 2
Annual Report 2019/20 – German Council of Economic Experts 93
volume of investment will probably be hampered by the capacity constraints in the construction sector. ITEM 548
149. A consolidation also took place over many years in Germany’s corporate sector. Its investment ratio declined between the end of the 1990s and the beginning of the 2010s. Because firms were raising their equity ratios at the same time, this generated substantial funding surpluses in Germany’s corporate sector (GCEE Annual Report 2014 items 421 ff.). In addition, companies increased their foreign direct investment (FDI). Although this could be interpreted as evi-dence of Germany’s lack of appeal as an investment location, Germany compa-nies’ FDI – for example in order to tap foreign markets – might complement their domestic investment activity. Changes to tax legislation also played a role (GCEE Annual Report 2015 item 768).
CHART 28
Gross fixed capital formation in the manufacturing sector
0
10
20
30
40
50
60
70
80
1991 95 99 03 07 11 2017
Breakdown by capital goods
€ billion1
Machinery and equipment Buildings
Other investments2
0
5
10
15
20
25
30
35
40
45
50
1991 95 99 03 07 11 2017
Breakdown by selected sectors
€ billion1
0
10
20
30
40
50
60
70
80
90
100
1991 95 99 03 07 11 2017
Breakdown by capital goodsShare
%3
Machinery and equipment Buildings
Other investments2
0
5
10
15
20
25
30
35
40
45
50
1991 95 99 03 07 11 2017
Breakdown by selected sectorsRelative to gross value added
%
Automotive Mechanical engineering
Energy-intensive industries4
Electrical engineering5 Pharmaceuticals
1 – Price-adjusted. 2 – Investment in intellectual property (software and databases, research and development, copyrights, mineral exploration), livestock and crops. 3 – Percentage of total gross fixed capital formation. 4 – Production of paper, cardboard and goods made from them; coking and oil processing; manufacture of chemical products, manufacture of glass, glass goods, ceramics; processing of stones and earth; and metal production and metalworking. 5 – Manufacture of data-processing equipment, electronic and optical products, and manufacture of electrical equipment.
Sources: Federal Statistical Office, own calculations© Sachverständigenrat | 19-389
Chapter 2 – Productivity: Improving conditions for growth
94 German Council of Economic Experts – Annual Report 2019/20
150. Within the various categories, investment in intellectual property is be-coming increasingly important, whereas spending on machinery and equipment has grown more slowly in recent years. CHART 28 TOP LEFT ITEMS 293,
305 However, commercial construction investment accounts for only a small proportion of corporate capital spending. CHART 28 BOTTOM LEFT Industry has re-vealed divergent trends. The automotive industry in particular has signifi-cantly expanded its investment over the past two decades. CHART 28 TOP RIGHT This is mainly due to increased value added in the car industry. Investment in relation to value added has not changed much since the 1990s. CHART 28 BOTTOM
RIGHT By contrast, fixed capital formation by energy-intensive industries has de-creased over the same period.
151. The decline in the equipment-to-GDP ratio has been driven by price effects, es-pecially the sharp fall in the prices of data processing equipment (GCEE Annual Report 2014 items 435 ff.). Spending on machinery and equipment has grown fairly slowly during the most recent upturn which, according to the GCEE’s estimate, began in the second quarter of 2009 (GCEE Annual Report 2017 box 7). CHART 27 RIGHT One contributing factor was the euro crisis, which in-terrupted the strong upward trajectory of investment.
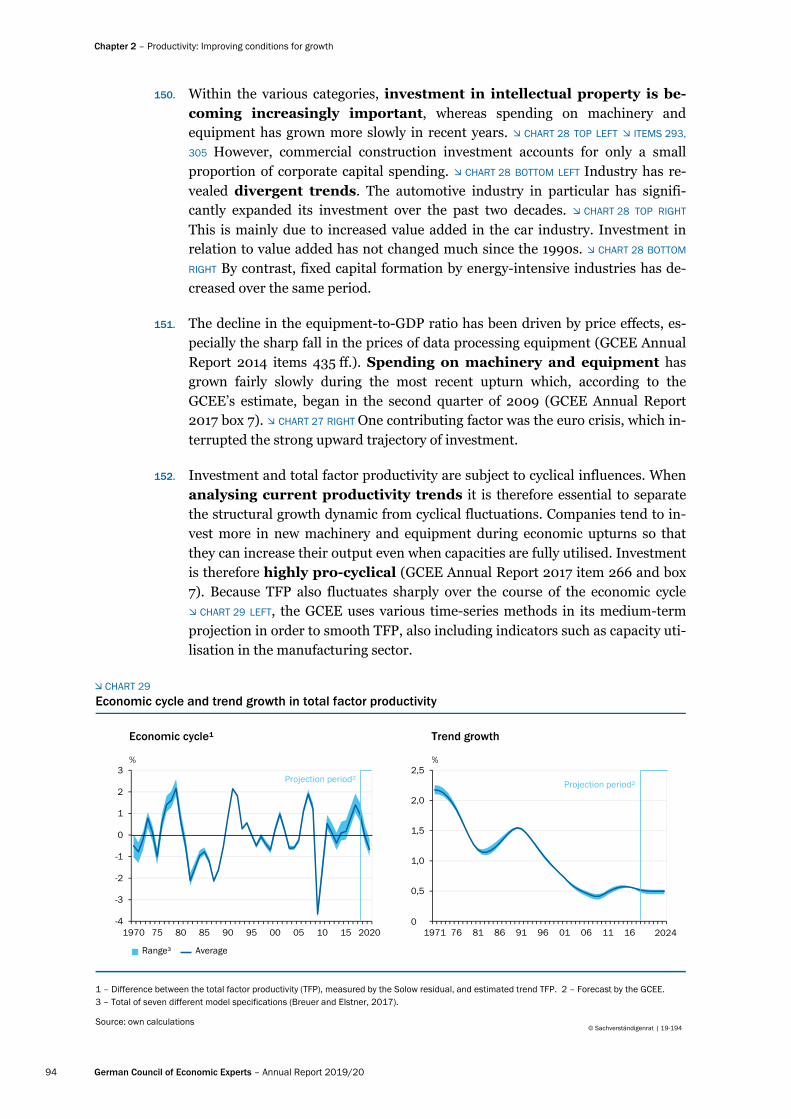
152. Investment and total factor productivity are subject to cyclical influences. When analysing current productivity trends it is therefore essential to separate the structural growth dynamic from cyclical fluctuations. Companies tend to in-vest more in new machinery and equipment during economic upturns so that they can increase their output even when capacities are fully utilised. Investment is therefore highly pro-cyclical (GCEE Annual Report 2017 item 266 and box 7). Because TFP also fluctuates sharply over the course of the economic cycle CHART 29 LEFT, the GCEE uses various time-series methods in its medium-term projection in order to smooth TFP, also including indicators such as capacity uti-lisation in the manufacturing sector.
CHART 29
Economic cycle and trend growth in total factor productivity
-4
-3
-2
-1
0
1
2
3
1970 75 80 85 90 95 00 05 10 15 2020
Economic cycle¹
%
Projection period²
0,0
0,5
1,0
1,5
2,0
2,5
1971 76 81 86 91 96 01 06 11 16 21
Trend growth
%
20240
Projection period²
Range³ Average
1 – Difference between the total factor productivity (TFP), measured by the Solow residual, and estimated trend TFP. 2 – Forecast by the GCEE. 3 – Total of seven different model specifications (Breuer and Elstner, 2017).
Source: own calculations© Sachverständigenrat | 19-194

Productivity: Improving conditions for growth – Chapter 2
Annual Report 2019/20 – German Council of Economic Experts 95
153. Germany reveals a sharp decline in total-factor productivity growth over the long term. This largely reflects a slowdown in technological progress. TFP also captures factors such as the effects of reallocation between sectors, im-provements in workers’ skills levels, and the benefits of specialisation resulting from greater integration into supply chains (GCEE Annual Report 2016 item 280). The integration of low-skilled workers into the labour market, for example, is likely to have depressed measured TFP growth (GCEE Annual Report 2016 item 286). The trend growth rate has remained relatively constant at just over half a percent since the 2000s. CHART 29 RIGHT The GCEE expects to see trend growth rates of 0.5 % for TFP and 1.3 % for capital intensity over the period from 2018 to 2024.
154. Although decomposing economic output into its individual factors of produc-tion can provide clues as to the relevant growth factors, it cannot explain why, for example, investment does not rise more sharply. Structural macroeco-nomic models can offer deeper insights. Productivity growth can, for example, be attributed to supply-side and demand-side factors.
The real business-cycle theory states that technology shocks are the main deter-minant of fluctuations in economic output (Kydland and Prescott, 1982; Long and Plosser, 1983). More recent approaches in New Keynesian theory also take account of the fact that production capacities can be overutilised or un-derutilised in the short term if rigidities prevent nominal wages and prices from flexibly adjusting immediately (Galí, 1999). Demand-side factors such as monetary policy then impact – at least in the short term – on real economic output and, consequently, on productivity. Over the long term, however, technological progress and increases in the capital stock determine potential output.
Whereas most structural macroeconomic models regard the technology process as an exogenous shock, there has been a tendency for some time now to explain this factor within the relevant models (Comin and Gertler, 2006; Anzoategui et al., 2019). A key role is played here not only by technology shocks but also in particular by investment in research and development. Less favourable funding terms and conditions – for example as a result of financial crises – can prevent new technologies from being developed and adopted, thereby depress-ing long-run productivity. ITEM 209
155. Model-based analysis suggests that technology shocks and investment shocks are largely responsible for productivity trends in Germany. BOX 6 Be-sides technological changes technology shocks in the model may also capture la-bour hoarding during recession phases and non-modelled demand factors. In-vestment shocks include changes in funding terms and conditions for compa-nies. Negative investment shocks played a key role at the beginning of the 2000s and during the euro crisis. Unlike GDP, labour productivity has recently grown only slightly. This is largely because technological progress has been below aver-age.
156. Technology shocks are also important for growth in investment and wages. On the other hand, wage mark-up shocks – which reflect frictions in wage set-
Chapter 2 – Productivity: Improving conditions for growth
96 German Council of Economic Experts – Annual Report 2019/20
ting – have played a key role in Germany’s strong employment growth. These shocks capture changes in workers’ negotiating power. Another key factor here is labour market reforms, such as those implemented as part of the Agenda 2010 policies in Germany. A negative wage mark-up shock means that wages ri-se by less than economic growth would appear to justify. The model used sug-gests that such negative wage mark-up shocks have been largely responsible for Germany’s sustained employment growth since the mid-2000s. At the same ti-me they have provided positive stimulus to investment and productivity.
BOX 6
Productivity growth in Germany and the rest of the euro area
Whereas growth models seek to explain long-term trends and their determinants, ITEM 146 the New
Keynesian approach to macroeconomics combines the long-run perspective with the medium- and
short-term perspective in order to analyse growth trends in conjunction with economic cycles. This
involves using dynamic stochastic general equilibrium (DSGE) models, which expand the neoclassi-
cal growth model to include price and wage rigidities, imperfect competition and additional assump-
tions from the field of behavioural economics. These models include technology shocks that cause
fluctuations in total factor productivity.
In order to identify the factors determining Germany’s economic performance compared with the rest
of the euro area over the past two decades, Weiske (2019) estimates a structural two-region model
of the euro area. To this end, Germany is compared with nine member states (Belgium, Finland,
France, Greece, Italy, Netherlands, Austria, Portugal and Spain). These countries plus Germany ac-
count for almost 95 % of the euro area’s total economic output. The model factors in wage and price
rigidities, potential for variable capital use, investment adjustment costs, inflation and wage indexing,
and consumption habits. A total of 14 macroeconomic time series are used to estimate the model.
A key factor affecting productivity over time is technology shocks, which explain roughly half of the
volatility in GDP per worker. A further important factor affecting productivity levels is investment
shocks. In conjunction with technology shocks they explain almost 75 % of changes in long-run
productivity. Further demand shocks, such as preference shocks, are responsible – at least in the
short term – for 15 % to 20 % of this volatility. This is caused by nominal rigidities that lead to a situa-
tion whereby output fluctuates around its normal capacity-utilisation level. Employment trends, on the
other hand, are largely driven by wage mark-up shocks, which capture changes in workers’ negotiat-
ing power.
A historical shock decomposition reveals that demand-side factors play a short-term role in productiv-
ity growth, such as during the financial crisis. CHART 30 TOP LEFT The disappointing performance of
productivity in recent years, however, can largely be attributed to negative technology shocks. The
negative technology shocks captured in the model should not necessarily be seen as an actual retro-
grade technological step. Rather, they can represent changes in the use of factors of production –
such as the hoarding of workers during a recession – or energy price shocks (Kim and Loungani,
1992; King and Rebelo, 1999). This analysis covers the euro area only. Consequently it cannot cap-
ture technological spillovers or shocks originating in the United States, for example.
The sharp economic downturn in Germany in 2008 and 2009 was probably largely attributable to a
decline in export demand. This would then be interpreted in the model as a negative technology
shock. The same applies to the hoarding of workers during the financial crisis. The model also anal-
yses the trajectory of the balanced growth path. Provided that they are not too big, negative technolo-
gy shocks can therefore emanate from positive but below-average technological progress. Other
model-based estimates for the euro area also find that technology shocks play a key role in determin-

Productivity: Improving conditions for growth – Chapter 2
Annual Report 2019/20 – German Council of Economic Experts 97
ing GDP levels over the short and long term (Smets and Wouters, 2003; Gadatsch et al., 2015; Koll-
mann et al., 2015).
CHART 30
Negative investment shocks curbed investment growth at the beginning of the 2000s and during the
financial and euro crisis CHART 30 TOP RIGHT and therefore had an adverse impact on productivity
growth. Negative investment shocks reflect, among other things, frictions in the financial sector. This
mainly involves disruptions of financial intermediation, i.e. the process of transforming private sav-
ings into new productive capital (Carlstrom and Fuerst, 1997; Justiniano et al., 2011). An approxima-
Decomposition of historical shocks1
-8
-6
-4
-2
0
2
4
6
1997 00 02 04 06 08 10 12 14 16 2018
Productivity growth2
Percentage points3
-25
-20
-15
-10
-5
0
5
10
15
1997 00 02 04 06 08 10 12 14 16 2018
Investment growth
Percentage points3
-1.5
-1.0
-0.5
0
0.5
1.0
1.5
1997 00 02 04 06 08 10 12 14 16 2018
Employment growth
Percentage points3
-4
-3
-2
-1
0
1
2
3
4
5
1997 00 02 04 06 08 10 12 14 16 2018
Wage growth4
Percentage points3
-15
-10
-5
0
5
10
15
1996 98 00 02 04 06 08 10 12 14 16 2018
Relative GDP5
Percentage points6
-20
-15
-10
-5
0
5
10
15
1996 98 00 02 04 06 08 10 12 14 16 2018
Real exchange rate7
Percentage points6
Technology shock Investment shock Wage mark-up shock Price mark-up shock Demand shocks8
Initial conditions Total (%)
1 – Based on an estimated New Keynesian two-region model of the euro area. Region 1: Germany. Region 2: Belgium, Finland, France, Greece, Italy, Netherlands, Austria, Portugal and Spain. Estimation period: second quarter of 1996 to first quarter of 2019. 2 – Per person employed. 3 – Year-on-year change; deviation from long-term growth rate. 4 – Per employee. 5 – Germany’s GDP relative to the other euro area countries. 6 – Deviation from long-term level as at year-end in each case. 7 – Based on unit labour costs. 8 – Preference shock, external risk-premium shock, expenditure shock, monetary policy shock.
Sources: Weiske (2019), own calculations© Sachverständigenrat | 19-280

Chapter 2 – Productivity: Improving conditions for growth
98 German Council of Economic Experts – Annual Report 2019/20
tion for this is the credit spread between safe and risky bonds (Justiniano et al., 2011). Both the Unit-
ed States and Germany reveal negative correlations between credit spreads and investment shocks.
For some years now investment shocks have been making a positive contribution in Germany. This is
consistent with the continuously favourable funding terms and conditions available. ITEM 81
The sharp upturn in employment since the mid-2000s can largely be attributed to wage mark-up
shocks. CHART 30 CENTRE These are the reason why employment in Germany was not affected much
by the financial crisis. Gehrke et al. (2019) come to very similar conclusions. One notable aspect is
the positive contribution that demand has made to employment since the end of the financial crisis.
The explanations provided in the literature for the sharp rise in employment in Germany are its labour
market reforms (Burda, 2016) and its institutional flexibility in setting wages (Dustmann et al., 2014).
One side effect of this encouraging trend, however, is the sluggishness of productivity growth, which is
likely to have been partly caused by the integration of low-skilled workers into the labour market
(Elstner et al., 2018).
Technology shocks and wage mark-up shocks were largely responsible for the fact that the perfor-
mance of the German economy diverged from that in the rest of the euro area before and after
2005. CHART 30 BOTTOM LEFT Demand shocks that impacted adversely on Germany also played a
role in the 2000s in particular. Technology shocks, investment shocks and wage mark-up shocks
largely explain the changes over time in terms of price competitiveness based on the relative levels of
unit labour costs. CHART 30 BOTTOM RIGHT. The positive contribution made by these initial conditions
could be an indication that the Deutsche Mark was possibly overvalued in the mid-1990s. Between
1990 and 1995 the German economy did indeed lose almost 13 % of its price competitiveness com-
pared with the rest of the euro area.
3. Germany in an international comparison
157. In recent decades the trend among the countries in the advanced economies has been that productivity growth has slowed. CHART 31 After this growth brief-ly accelerated in the United States during the 1990s, it has fallen back again here as well since the early 2000s. However, the slowdown in the growth of labour productivity per hour worked is more pronounced than it is for TFP. This is be-cause the growth in capital intensity is also slowing. The trend in Germany is more or less the same as that in the other advanced economies. However, the demographic change will dampen economic growth relatively strongly in Ger-many.
158. Within the group of G7 countries there are in some cases substantial differ-ences in the levels of material prosperity, measured in terms of GDP per inhabitant. CHART 32 TOP LEFT In particular, economic output per inhabitant in the other G7 member states is well below that in the United States. Although GDP per inhabitant rose in all countries during the period under review, no other G7 country was able to catch up with the US. Germany at least managed to narrow the gap.
159. Differences in GDP per inhabitant can be attributed either to differences in la-bour productivity or to differences in employment or in the average number of

Productivity: Improving conditions for growth – Chapter 2
Annual Report 2019/20 – German Council of Economic Experts 99
working hours per worker. A comparison of GDP per worker takes account of the differences in GDP that result from the fact that participation rates vary from one economy to another. CHART 32 TOP RIGHT In addition, differences, for exam-ple, in the number of days of annual leave mean that the average num-ber of hours worked also varies from one economy to another and is higher in the United States than in the European economies (Bick et al., 2019).
160. There are a number of factors that impact on the labour inputs in an economy and, consequently, affect GDP per inhabitant. Employment can temporarily de-crease as a result of the business cycle. The persistent differences observed, however, are likely to be caused by structural factors. These include differ-ences in the taxation system and in tax rates. Coenen et al. (2008), for example, use a model analysis to demonstrate that cutting the euro area’s tax rates to the level applicable in the United States would raise output and employment by more than 10 % each.
Alesina et al. (2006) rather emphasise how labour market regulation and the de-gree of trade union organisation are important for the number of hours worked. Bell and Freeman (2001) as well as Bowles and Park (2005) show a positive cor-relation between income inequality and the number of hours worked in an econ-omy. Blanchard (2004) points to the importance of preferences in deciding to work fewer hours.
161. The figures published by the OECD show that Germany and France have more or less attained the United States’ level of labour productivity (measured as GDP per hour worked). CHART 32 BOTTOM LEFT Given that France and Germany had still lagged some way behind in the 1970s, there had thus been some conver-gence here. Although Japan and the United Kingdom have also managed to nar-row the gap, they remain at a lower level. Canada’s relative hourly productivity compared with the United States has declined. Italy has been falling well behind
CHART 31
International comparison of productivity growth
-3
-2
-1
0
1
2
3
4
5
6
1973 78 83 88 93 98 03 08 13 2018
Labour productivity1
Five-year moving average2
%3
EU154 Germany USA Japan5
-3
-2
-1
0
1
2
3
4
5
6
1973 78 83 88 93 98 03 08 13 2018
Total factor productivityFive-year moving average2
%3
1 – GDP per hour worked. 2 – For Germany calculations by the GCEE, otherwise calculations by the European Commission. 3 – Year-on-year change. 4 – Range excluding highest and lowest values. 5 – Data available for labour productivity up to 2017 and for total-factor productivity from 1980 onwards.
Sources: European Commission, Federal Statistical Office, own calculations© Sachverständigenrat | 19-208

Chapter 2 – Productivity: Improving conditions for growth
100 German Council of Economic Experts – Annual Report 2019/20
since the end of the 1990s. ITEM 194 Additionally, its level of labour productivity has been virtually stagnating since 2001. CHART 32 BOTTOM RIGHT
162. If potential issues with the comparability of figures owing to the difficulties in-volved in capturing them statistically are ignored, the key metrics reveal signifi-cant differences between the G7 economies. At the same time, they high-light the considerable impact that the labour market situation has on GDP per inhabitant. Relatively low labour productivity can, for example, be compensated for by greater labour input. Similarly, the institutional framework determining the population’s labour market participation rate can affect measured la-bour productivity. This productivity is lower in economies in which relatively large numbers of workers with low productivity are employed than in economies in which less productive workers are not employed at all (GCEE Annual Report 2015 items 596 ff.).
163. In Europe there has been a certain amount of convergence in labour productivity since the year 2000. Economies that started from a lower base have tended to achieve higher productivity growth. CHART 33 LEFT There are, however, clear differences between the groups of countries (GCEE An-
CHART 32
GDP in the G7 economies and in the euro area¹
20
30
40
50
60
70
80
90
100
110
DE² CA UK FR JP IT EA
GDP per inhabitant relative to the US
USA = 100
0 20
30
40
50
60
70
80
90
100
110
DE² CA UK FR JP IT EA
GDP per worker relative to the US
USA = 100
0
20
30
40
50
60
70
80
90
100
110
DE² CA UK FR JP IT EA
GDP per hour worked relative to the US
USA = 100
1970 1995 2018
0 90
100
110
120
130
140
1995 99 03 07 11 15 2018
Real GDP per hour worked
1995 = 100
DE FR IT EA
1 – DE-Germany, CA-Canada, UK-United Kingdom, FR-France, JP-Japan, IT-Italy, EA-Euro area 19 (data available from 1995 onwards).2 – 1970 former West Germany.
Sources: Eurostat, OECD, own calculations© Sachverständigenrat | 19-288

Productivity: Improving conditions for growth – Chapter 2
Annual Report 2019/20 – German Council of Economic Experts 101
nual Report 2017 items 253 ff.). The observation does not apply, for example, to the southern European countries that were particularly hard hit by the euro sov-ereign debt crisis. These countries achieved only very low average productivity growth and thus failed to catch up with the more productive European econo-mies.
164. In the eastern EU member states, on the other hand, productivity has risen sharply. The convergence progress achieved in these countries can probably be attributed to factors such as their growing integration into the European sin-gle market, their improved infrastructure and the stable framework conditions associated with EU membership (Deutsche Bundesbank, 2019a). After produc-tivity in this group of countries on average grew more than real wages did until 2007, wages have risen much more sharply since. CHART 33 RIGHT Whereas work-ers have therefore benefited more significantly from the productivity gains, some price competitiveness has been lost as a result.
4. Competitiveness and current account
165. Productivity growth is essential for increasing an economy’s material prosperity over the long term. At the same time, productivity – in conjunction with wage levels – affects the international competitiveness of the products and ser-vices produced in the economy when they are sold in global markets. In a mone-tary union – in which adjustments through the exchange rate mechanism are ex-cluded – divergent trends can therefore cause divergence in current account bal-ances.
CHART 33
Real convergence in Europe
Sources: Eurostat, OECD, own calculations© 19-237Sachverständigenrat |
%7
-1
1
2
3
4
5
6
7
8
0
SE BAL MOE SOE SE BAL MOE SOE
Wage and productivity growth in southernand eastern Europe
1 – Average annual growth in GDP per total hours worked in PPP US dollars. Countries with fewer than one million inhabitants have not been included.2 – Greece, Italy, Portugal, Spain. 3 – Estonia, Latvia, Lithuania. 4 – Czech Republic, Hungary, Poland, Romania, Slovakia, Slovenia. 5 – Bulgaria,Croatia (as not all values for 2018 are available for Croatia, numbers from 2017 were used for 2018), Romania. 6 – Austria, Belgium, Denmark,Finland, France, Ireland, Netherlands, Norway, Sweden, Switzerland, United Kingdom. 8 – Average annual change. 9 – Real GDP per hourGermany,worked. Country groups weighted according to total hours worked. 10 – Compensation of employees deflated using the GDP deflator per hour worked(employees). Country groups weighted according to hours worked (employees).
Labour productivity8 Real wages9
2001 – 2007 2013 – 2018
Growth 2001 to 20181
0
1
2
3
4
5
0 20 40 60 80
Catch-up process
GDP per hour worked in 2000 in PPP US dollars2 3 4 5 2 3 4 5
Other EU/EFTA member states6
Southern Europe2 Baltic3 Central and eastern Europe4
South-eastern Europe5
Chapter 2 – Productivity: Improving conditions for growth
102 German Council of Economic Experts – Annual Report 2019/20
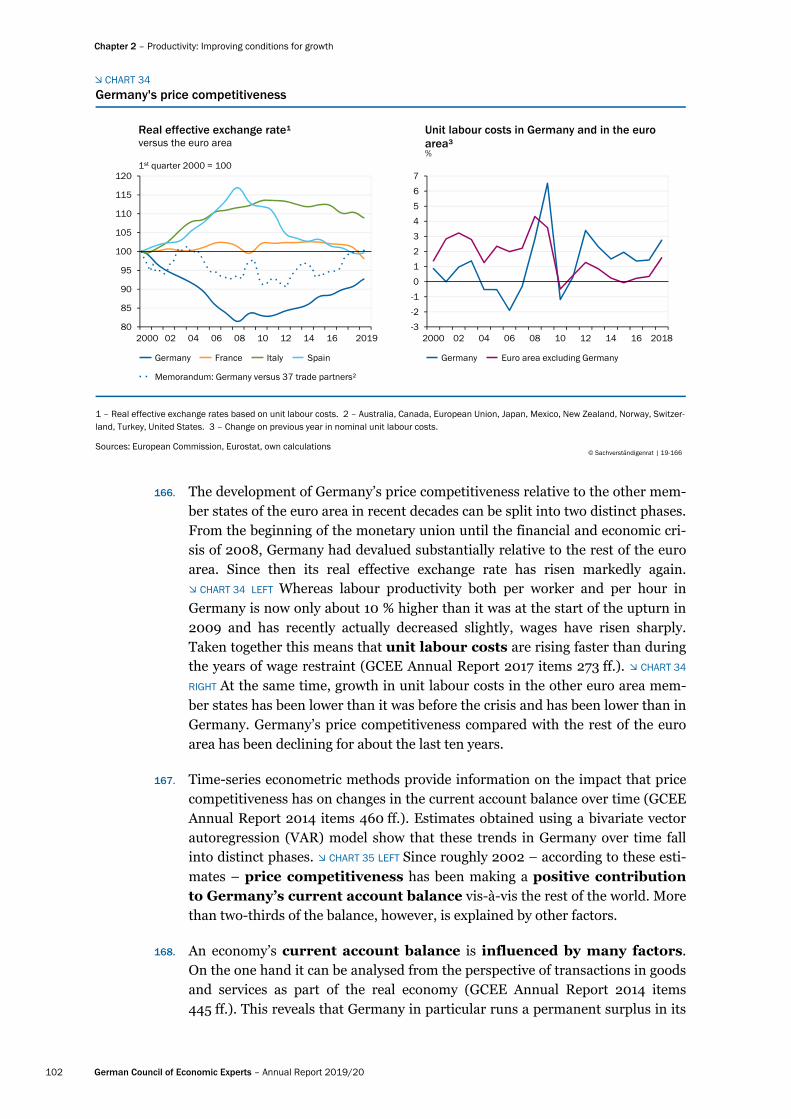
166. The development of Germany’s price competitiveness relative to the other mem-ber states of the euro area in recent decades can be split into two distinct phases. From the beginning of the monetary union until the financial and economic cri-sis of 2008, Germany had devalued substantially relative to the rest of the euro area. Since then its real effective exchange rate has risen markedly again. CHART 34 LEFT Whereas labour productivity both per worker and per hour in Germany is now only about 10 % higher than it was at the start of the upturn in 2009 and has recently actually decreased slightly, wages have risen sharply. Taken together this means that unit labour costs are rising faster than during the years of wage restraint (GCEE Annual Report 2017 items 273 ff.). CHART 34
RIGHT At the same time, growth in unit labour costs in the other euro area mem-ber states has been lower than it was before the crisis and has been lower than in Germany. Germany’s price competitiveness compared with the rest of the euro area has been declining for about the last ten years.
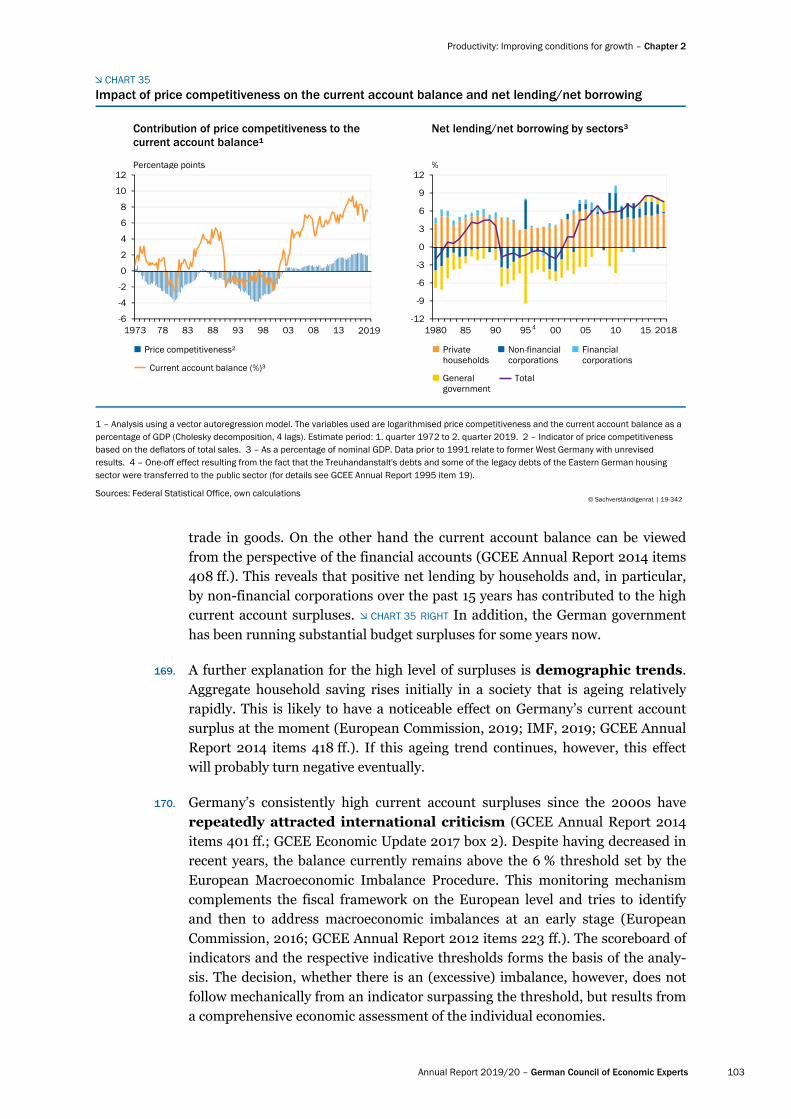
167. Time-series econometric methods provide information on the impact that price competitiveness has on changes in the current account balance over time (GCEE Annual Report 2014 items 460 ff.). Estimates obtained using a bivariate vector autoregression (VAR) model show that these trends in Germany over time fall into distinct phases. CHART 35 LEFT Since roughly 2002 – according to these esti-mates – price competitiveness has been making a positive contribution to Germany’s current account balance vis-à-vis the rest of the world. More than two-thirds of the balance, however, is explained by other factors.
168. An economy’s current account balance is influenced by many factors. On the one hand it can be analysed from the perspective of transactions in goods and services as part of the real economy (GCEE Annual Report 2014 items 445 ff.). This reveals that Germany in particular runs a permanent surplus in its
CHART 34
Germany's price competitiveness
80
85
90
95
100
105
110
115
120
2000 02 04 06 08 10 12 14 16 2019
Real effective exchange rate¹versus the euro area
1st quarter 2000 = 100
Germany France Italy Spain
Memorandum: Germany versus 37 trade partners²
-3
-2
-1
0
1
2
3
4
5
6
7
2000 02 04 06 08 10 12 14 16 2018
Unit labour costs in Germany and in the euro area³%
Germany Euro area excluding Germany
1 – Real effective exchange rates based on unit labour costs. 2 – Australia, Canada, European Union, Japan, Mexico, New Zealand, Norway, Switzer-land, Turkey, United States. 3 – Change on previous year in nominal unit labour costs.
Sources: European Commission, Eurostat, own calculations© Sachverständigenrat | 19-166
Productivity: Improving conditions for growth – Chapter 2
Annual Report 2019/20 – German Council of Economic Experts 103
trade in goods. On the other hand the current account balance can be viewed from the perspective of the financial accounts (GCEE Annual Report 2014 items 408 ff.). This reveals that positive net lending by households and, in particular, by non-financial corporations over the past 15 years has contributed to the high current account surpluses. CHART 35 RIGHT In addition, the German government has been running substantial budget surpluses for some years now.
169. A further explanation for the high level of surpluses is demographic trends. Aggregate household saving rises initially in a society that is ageing relatively rapidly. This is likely to have a noticeable effect on Germany’s current account surplus at the moment (European Commission, 2019; IMF, 2019; GCEE Annual Report 2014 items 418 ff.). If this ageing trend continues, however, this effect will probably turn negative eventually.
170. Germany’s consistently high current account surpluses since the 2000s have repeatedly attracted international criticism (GCEE Annual Report 2014 items 401 ff.; GCEE Economic Update 2017 box 2). Despite having decreased in recent years, the balance currently remains above the 6 % threshold set by the European Macroeconomic Imbalance Procedure. This monitoring mechanism complements the fiscal framework on the European level and tries to identify and then to address macroeconomic imbalances at an early stage (European Commission, 2016; GCEE Annual Report 2012 items 223 ff.). The scoreboard of indicators and the respective indicative thresholds forms the basis of the analy-sis. The decision, whether there is an (excessive) imbalance, however, does not follow mechanically from an indicator surpassing the threshold, but results from a comprehensive economic assessment of the individual economies.
CHART 35
Impact of price competitiveness on the current account balance and net lending/net borrowing
-6
-4
-2
0
2
4
6
8
10
12
1973 78 83 88 93 98 03 08 13 18
Contribution of price competitiveness to the current account balance¹
Percentage points
Price competitiveness²
Current account balance (%)³
2019-12
-9
-6
-3
0
3
6
9
12
1980 85 90 95 00 05 10 15
Net lending/net borrowing by sectors³
%
Private households
Non-financial corporations
Financial corporations
General government
Total
20184
1 – Analysis using a vector autoregression model. The variables used are logarithmised price competitiveness and the current account balance as a percentage of GDP (Cholesky decomposition, 4 lags). Estimate period: 1. quarter 1972 to 2. quarter 2019. 2 – Indicator of price competitiveness based on the deflators of total sales. 3 – As a percentage of nominal GDP. Data prior to 1991 relate to former West Germany with unrevised results. 4 – One-off effect resulting from the fact that the Treuhandanstalt's debts and some of the legacy debts of the Eastern German housing sector were transferred to the public sector (for details see GCEE Annual Report 1995 item 19).
Sources: Federal Statistical Office, own calculations© Sachverständigenrat | 19-342

Chapter 2 – Productivity: Improving conditions for growth
104 German Council of Economic Experts – Annual Report 2019/20
171. The GCEE is of the view, however, that it should not be a specific aim of economic policy per se to stabilise the current account balance at a certain level. Economic policy should rather focus on raising growth potential, which ultimately determines the level of material prosperity in an economy over time. Politicians can assist in this process by creating the right conditions so that firms do business in Germany, invest more there and help to boost growth by introducing innovation and new technology. Up to now, the expected returns from investments in Germany are apparently too small from the perspective of a potential investor to direct the substantial German savings to domestic invest-ments. If economic policy is successful in countering this impression by growth-friendly reforms, this should help to reduce the current account balance.
To what extent past German investment abroad has been a good deal is disputed (Deutsche Bundesbank, 2018; Fiedler et al., 2018; Hünnekes et al., 2019a; GCEE Annual Report 2014 items 475 ff.). In any case, foreign direct investments by German firms in the process of the expansion of global value chains have delivered an important contribution to the increase of productivity and econom-ic growth in the past years. If a large share of the past investment had been in-vested in Germany instead of abroad, this investment probably would have had to go to projects with lower returns.
172. In addition, certain policy areas and measures affecting the current account do not lie within the government’s remit. Wage policy in Germany, for example, is the responsibility of the parties to the collective bargaining process and is usually not directly decided by the government, which neverthesless has some influence, for example by statutatory extensions of collective bargaining agreements or as employer. As a member of Europe’s currency union, moreover, Germany cannot pursue its own monetary policy. The monetary policy set by the European Central Bank (ECB) takes account of developments throughout the euro area. Given the euro’s exchange rate, the highly expansionary stance adopt-ed in recent years is likely to have helped to improve the German economy’s price competitiveness.
173. By contrast, the effects of fiscal policy measures on the current account balance are usually reckoned to be fairly moderate (BMWi, 2017; Alloza et al., 2019; GCEE Annual Report 2014 items 466 ff.). Generally, such measures should not be aimed at reducing the current account balance. The common monetary policy pursued within a currency union can respond to only a limited extent to divergent trends in the member states. Fiscal policy therefore performs a special stabilising function at national level (GCEE Annual Report 2018 items 418 ff.). Any additional focus on the current account here could be counterpro-ductive. In recent years the German economy has been characterised by excess capacity utilisation. ITEM 91 Any attempt to boost government demand in order to reduce Germany’s current account surplus would have intensified this excess capacity utilisation and would have been counterproductive from an economic stabilisation perspective.

Productivity: Improving conditions for growth – Chapter 2
Annual Report 2019/20 – German Council of Economic Experts 105
III. POSSIBLE CAUSES
174. In order to introduce appropriate economic policies to support aggregate productivity improvements, it is necessary to conduct a thorough analysis of the causes of the weak productivity growth observed in recent years. Against this backdrop and building on the analysis presented above, this section discuss-es various possible explanations.
1. Productivity paradox of digitalisation
175. The worldwide decline in productivity growth appears to be inconsistent with the hopes that have been placed in the productivity-enhancing effects of increasing computerisation and the development of new applications in infor-mation and communication technologies (ICT) such as cloud computing, machine learning and artificial intelligence. It is indeed the case that ICT-intensive industries were responsible for the temporary acceleration of produc-tivity growth in the United States between 1995 and 2005 (Jorgenson and Stiroh, 2000). Given the further progress made in ICT in recent years, however, the current weakness of productivity growth appears to be a paradox. Four possible explanations for this paradox are discussed below.
176. First, there might be delays in adaptation (Brynjolfsson et al., 2018). Exploit-ing the potential offered by new information technologies requires things such as complementary investment in human capital and adjustments to corporate organisational structures (Bresnahan et al., 2002). Such adap-tation delays have in the past also affected technologies that brought about fun-damental changes in production structures and yielded considerable productivi-ty gains (Comin and Hobijn, 2010). For example, it took more than 40 years from the invention of electric drives until 25 % of US factories’ output was gen-erated electrically and this translated into higher productivity gains (Atkeson and Kehoe, 2007). Consequently there might also be some delay before we see the productivity-enhancing effects of computerisation.
177. The second assessment, on the other hand, is much more pessimistic. The productivity improvements expected to come from new information tech-nologies might be much smaller than those produced by previous general-purpose technologies. Many applications around Big Data might be primarily used to acquire market share rather than to create new products. Moreover, despite the advance of digitalisation it seems to be becoming increasingly ex-pensive and time-consuming to research new technologies. For exam-ple, the speed at which there have been improvements in computing power or the yield of agricultural crops has remained virtually constant over the past 40 years despite a considerable increase in the research staff used (Bloom et al., 2017). This has given rise to the assessment that the technologies that are easy to research have already been researched (Cowen, 2011).
Chapter 2 – Productivity: Improving conditions for growth
106 German Council of Economic Experts – Annual Report 2019/20
178. A third explanation for the fact that digital technologies are having little impact on measured productivity growth might be increasing measurement prob-lems. The provision of free digital products and services, for example, could mean that although consumer benefit increases, the measured value added re-mains constant. The difference between GDP and aggregate welfare would then grow as a consequence (Brynjolfsson and McAfee, 2014). It is also possible that the rate at which new products and services are brought to market has risen. Given the problem of accurately capturing quality improvements and including them in inflation measurements, this could result in inflation rates being overes-timated and real GDP growth being underestimated (Aghion et al., 2019).
However, various authors have cast doubt on these arguments. Aghion et al. (2019) show that the rate at which new products come to market or new markets are entered has not increased in the United States. Syverson (2017) questions the link between the measurement problem and ICT technologies and also casts doubt on the quantitative relevance of the measurement problem. On the one hand, he shows that the decline in productivity growth is no higher in coun-tries with greater value added in ICT industries. On the other hand, even the most optimistic estimates of ICT’s added benefits for consumers would explain no more than one-third of the decrease in productivity growth. At the same time, these optimistic estimates would implausibly require excessively strong produc-tivity growth from the ICT industries themselves.
179. Elstner et al. (2018) suggest that improvements in ICT have had two mutually offsetting effects in Germany. On the one hand, labour productivity has risen for a given labour input. On the other hand, this generates additional demand for labour, which in turn reduces average labour productivity as a result of di-minishing marginal returns. Past improvements in ICT have thus increased both GDP and labour inputs, which means that, on balance, there has been no signifi-cant productivity effect. These two effects have therefore cancelled each other out.
180. Delays in adaptation are also likely to be highly relevant to Germany. Compared with other advanced economies Germany is fairly average in terms of its use of digital technologies and the expansion of its digital infrastructure, which suggests that there are significant delays in its adaptation to such technol-ogy (OECD, 2019a). In addition, the proportion of ICT capital is much lower in Germany than it is in the United States, for example (Strauss and Samkharadze, 2011), which is why higher productivity in ICT would be expected to have a smaller positive impact on overall productivity. This also means that the estima-tion methodology used by Syverson (2017) for Germany would imply far smaller measurement errors than it would for the United States because the quantitative role of measurement problems grows as ICT-industries’ share of value added increases.
The extent to which the hopes placed in ICT-driven productivity growth have been exaggerated has not yet been investigated in the case of Germany. It is equally unclear whether the greater complexity of research and development has pushed up innovation costs in Germany. Studies conducted for the OECD,

Productivity: Improving conditions for growth – Chapter 2
Annual Report 2019/20 – German Council of Economic Experts 107
however, suggest that this could indeed be the case (Bloom et al., 2017). An ad-verse impact on Germany’s productivity growth due to spillover effects would al-so be expected if the level of innovation in other advanced economies were to fall.
2. Low business dynamism
181. Productivity levels vary significantly between countries and between firms within countries (Hsieh and Klenow, 2009, 2014; Syverson, 2011; Restuccia and Rogerson, 2017). Some of the reasons for this are differences in manage-ment skills at companies and the gradual adoption of new technologies and pro-duction processes. The overall productivity of individual industries or of the na-tional economy as a whole thus depends on the allocation of the factors of pro-duction, labour and capital, to the firms. An efficient allocation of these fac-tors is characterised by the fact that it is not possible to increase the gross value added any further by reallocating the factors of production. Deviations from this efficient allocation are labelled as a misallocation, which results in lower aggregate productivity.
182. Differences in the degree of misallocation are a major reason why productivity levels vary from country to country (Hsieh and Klenow, 2009; Restuccia and Rogerson, 2017). In addition, reallocating factors of pro-duction to more productive firms can play a crucial role in productivity growth (Baily et al., 1992; Foster et al., 2008). And, vice versa, the falling levels of productivity growth in the United States since the 1980s could be partly ex-plained by the declining reallocation rate over the same period (Decker et al., 2017).
183. Factors of production are reallocated between existing firms – for example as a result of the hiring and firing of workers – as well as to newly established busi-nesses and away from closing ones. There is a strong correlation – both at re-gional level and in comparisons of different industries – between the realloca-tion rate and the numbers of start-ups and closures of firms and estab-lishments (Foster et al., 2001, 2006, 2008). A major reason for the falling real-location rate in the United States is believed to be the declining business start-up rate (Decker et al., 2014). New jobs created in Germany as a result of business start-ups and closures are responsible for roughly 20 to 25 % of job reallocation. Young businesses, set up less than five years ago, are especially dynamic as they exhibit higher closure rates and – provided they do not close – higher growth rates. They are responsible for roughly 30 to 35 % of job reallocation in Germany although they account for only around 12 % of jobs.
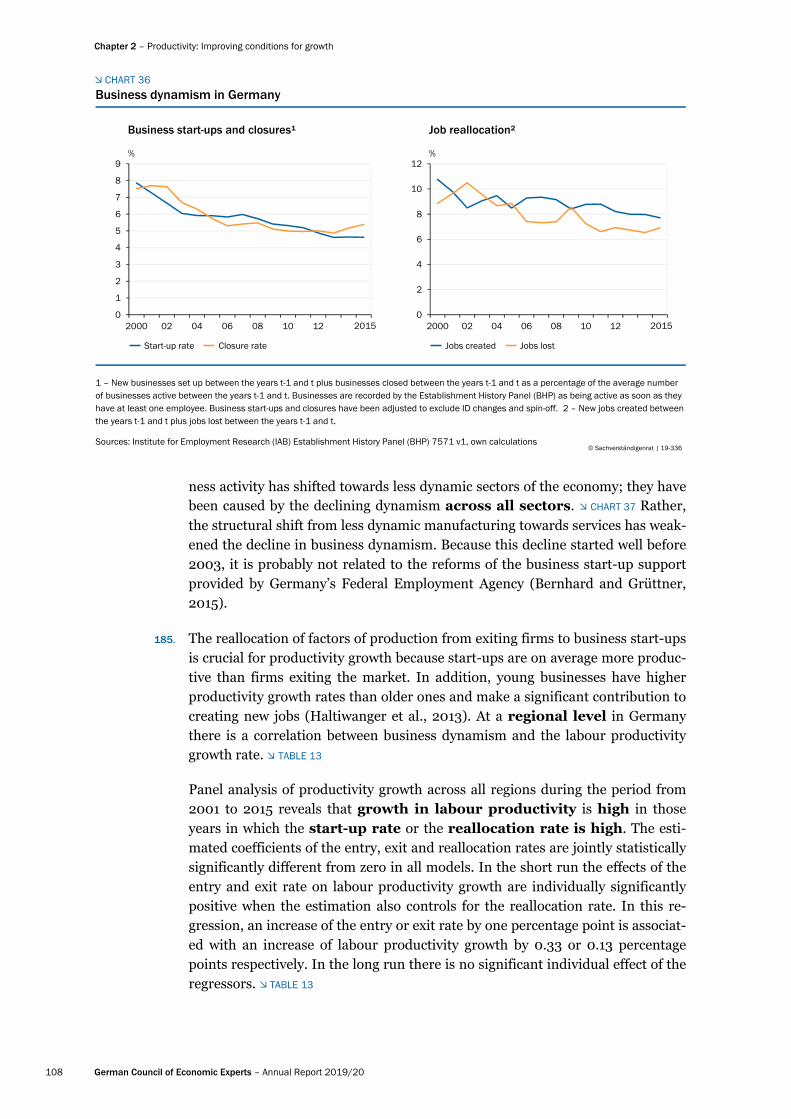
184. A broad-based decline in business dynamism has been observed in Germa-ny since the start of this century. The Establishment History Panel of the Insti-tute for Employment Research (IAB) (Schmucker et al., 2018) can be used to show that establishment entry and exit rates have fallen by more than one-third. CHART 36 LEFT Moreover, the amount of job creation and destruction has declined sharply. CHART 36 RIGHT These trends cannot be attributed to the fact that busi-
Chapter 2 – Productivity: Improving conditions for growth
108 German Council of Economic Experts – Annual Report 2019/20
ness activity has shifted towards less dynamic sectors of the economy; they have been caused by the declining dynamism across all sectors. CHART 37 Rather, the structural shift from less dynamic manufacturing towards services has weak-ened the decline in business dynamism. Because this decline started well before 2003, it is probably not related to the reforms of the business start-up support provided by Germany’s Federal Employment Agency (Bernhard and Grüttner, 2015).
185. The reallocation of factors of production from exiting firms to business start-ups is crucial for productivity growth because start-ups are on average more produc-tive than firms exiting the market. In addition, young businesses have higher productivity growth rates than older ones and make a significant contribution to creating new jobs (Haltiwanger et al., 2013). At a regional level in Germany there is a correlation between business dynamism and the labour productivity growth rate. TABLE 13
Panel analysis of productivity growth across all regions during the period from 2001 to 2015 reveals that growth in labour productivity is high in those years in which the start-up rate or the reallocation rate is high. The esti-mated coefficients of the entry, exit and reallocation rates are jointly statistically significantly different from zero in all models. In the short run the effects of the entry and exit rate on labour productivity growth are individually significantly positive when the estimation also controls for the reallocation rate. In this re-gression, an increase of the entry or exit rate by one percentage point is associat-ed with an increase of labour productivity growth by 0.33 or 0.13 percentage points respectively. In the long run there is no significant individual effect of the regressors. TABLE 13
CHART 36
Business dynamism in Germany
0
1
2
3
4
5
6
7
8
9
2000 02 04 06 08 10 12 14
Business start-ups and closures¹
%
Start-up rate Closure rate
20150
2
4
6
8
10
12
2000 02 04 06 08 10 12 14
Job reallocation²
%
Jobs created Jobs lost
2015
1 – New businesses set up between the years t-1 and t plus businesses closed between the years t-1 and t as a percentage of the average number of businesses active between the years t-1 and t. Businesses are recorded by the Establishment History Panel (BHP) as being active as soon as they have at least one employee. Business start-ups and closures have been adjusted to exclude ID changes and spin-off. 2 – New jobs created between the years t-1 and t plus jobs lost between the years t-1 and t.
Sources: Institute for Employment Research (IAB) Establishment History Panel (BHP) 7571 v1, own calculations© Sachverständigenrat | 19-336

Productivity: Improving conditions for growth – Chapter 2
Annual Report 2019/20 – German Council of Economic Experts 109
186. The decline in the reallocation rate and the decrease in productivity growth are global phenomena (Calvino et al., 2019). There is no consensus on the causes of this trend yet. It is also unclear to what extent the declining realloca-tion rate is responsible for the weaker productivity growth in recent years. Many attempts to explain this phenomenon see a link between the growing dominance of large corporations and the decline in business dynamism. The impact on productivity growth varies according to the explanation given.
187. In the United States in particular there has been an observable trend towards large corporations playing a more dominant role, which has resulted in higher market concentration (Autor et al., 2017). This could raise barriers to market entry for new businesses and reduce business dynamism. Concerns about ad-verse consequences for productivity growth would be justified especially if this trend were being caused by a weakening of competition policy. This is indi-cated by the increasing mark-up on the marginal cost of production in recent decades (De Loecker and Eeckhout, 2017). It should, however, be noted that growing market concentration at the national level does not necessarily mean less competition at the local level, which is the level primarily relevant to compe-tition in services (Rossi-Hansberg et al., 2019).
Competition policies appear to work better in Germany and Europe than they do in the United States (Gutiérrez and Philippon, 2018). In addition, price mark-ups have risen less sharply (Weche and Wambach, 2018). Market concentration – calculated as the average of the Herfindahl-Hirschman-Indices across all sec-tors – has not risen significantly in Germany (Monopolies Commission, 2018).
CHART 37
Business dynamism in Germany by sectorChange compared to the year 2000
-5
-4
-3
-2
-1
0
2000 02 04 06 08 10 12 14
Start-up rate1
Percentage points
2015-10
-8
-6
-4
-2
0
2
2000 02 04 06 08 10 12 14
Reallocation rate2
Percentage points
2015
Manufacturing Construction Retail, transportation, accommodation, information and communication3
Financial and business services4 Public and other services, education and healthcare5
1 – New businesses set up between the years t-1 and t plus businesses closed between the years t-1 and t as a percentage of the average number of businesses active between the years t-1 and t. Businesses are recorded by the Establishment History Panel (BHP) as being active as soon as they have at least one employee. Business start-ups and closures have been adjusted to exclude ID changes and spin-off. 2 – Including maintenance and servicing of vehicles as well as storage. 3 – Including insurance services, real estate and housing, freelance, research and technical services as well as other commercial services. 4 – Public administration, defence, social security, education, healthcare, welfare, art, entertainment and recreation, other services, households with staff. 5 – Sum total of the new jobs created between the years t-1 and t plus the jobs lost over the same period as a percentage of the average number of jobs between the years t-1 and t.
Sources: Institute for Employment Research (IAB) Establishment History Panel (BHP) 7571 v1, own calculations© Sachverständigenrat | 19-337

Chapter 2 – Productivity: Improving conditions for growth
110 German Council of Economic Experts – Annual Report 2019/20
Nonetheless, the total share of revenues generated by the largest companies in manufacturing and trade has grown since the mid-1990s. In the services sector, on the other hand, this proportion has decreased slightly (Monopolies Commis-sion, 2018).
188. However, the growing market dominance of large corporations is not necessarily due to weaker competition controls and could simply be caused by new tech-nologies which are yielding higher returns to scale (Autor et al., 2017). ITEMS 305 FF. For example, production processes based on intangible factors of production, which are playing an increasingly important role in the econo-my, are characterised by high fixed costs combined with low variable costs and, consequently, large economics of scale (Haskel and Westlake, 2017). In the past, in particular, innovations in ICT have often tended to primarily benefit larger companies, as suggested by significantly higher usage rates of Enterprise Re-source Planning (ERP) and Customer Relationship Management (CRM) systems (OECD, 2019a). If the shift of economic activity towards larger companies and the decline in business dynamism can be attributed to new technologies, this would have much more positive implications for productivity growth than a weakening of competition controls would.
TABLE 13
Regressions at county level
Independent variable
Start-up rate40.290 *** 0.326 ***
(4.03) (3.86)
Exit rate50.094 0.128 **
(1.55) (2.10)
Reallocation rate60.064 *** – 0.040
(2.94) (–1.21)
∆ Start-up rate3,40.078 0.051
(0.41) (0.27)
∆ Exit rate3,50.182 0.058
(1.05) (0.30)
∆ Reallocation rate3,6 0.108 *** 0.082
(2.72) (1.52)
Fixed effects (counties)
R² 0.043 0.037 0.044 0.014 0.018 0.020
F-statistic737.71 *** 8.64 *** 24.89 *** 2.79 * 7.42 *** 2.64 **
Observations
1 – Figures in brackets denote t-statistics. Level of significance: * p-value<0.1; ** p-value<0.05; *** p-value<0.01. 2 – Pooled dataset for the years2001 to 2015. Standard errors clustered at county level. 3 – Difference between the average for the years 2001 to 2003 and the average for the years 2013 to 2015. 4 – New businesses set up between the years t-1 and t as a percentage of the average number of businesses active between the years t-1 and t. Businesses are recorded by the Establishment History Panel (BHP) as being active as soon as they have at least one employee. Business start-ups have been adjusted to exclude ID changes and spin-offs. 5 – Closed enterprises between years t-1 and t as a percentage of the average number of businesses active between the years t-1 and t. Businesses are recorded by the Establishment History Panel (BHP) as being active as soon as they have at least one employee. Closures have been adjusted to exclude ID changes and spin-offs. 6 – Sum total of the new jobs creat-ed between the years t-1 and t plus the jobs lost over the same period as a percentage of the average number of jobs between the years t-1 and t. 7 – Statistic of the F-test for joint significance of the regressors.
Sources: Institute for Employment Research (IAB) Establishment History Panel (BHP) 7517 v1, Regional Accounts, own calculations© Sachverständigenrat | 19-338
399 5,985 5,985 5,985 399 399
Growth in labour productivity and business dynamism1
Productivity growth2 Δ Productivity growth3
X X X

Productivity: Improving conditions for growth – Chapter 2
Annual Report 2019/20 – German Council of Economic Experts 111
189. Relative to smaller companies, large companies might also benefit from the high fixed costs of product and labour market regulation. Regulation directly leads to greater rigidities in factor markets, which restricts the realloca-tion rate (Hopenhayn and Rogerson, 1993). Moreover, it favours larger compa-nies, which further reduces the start-up rate. In the United States there is cur-rently a debate about the extent to which growing regulation is responsible for the decline in the reallocation rate (Davis and Haltiwanger, 2014; Gutiérrez and Philippon, 2018). On the one hand there is an observable trend that companies are reacting to demand shocks and productivity shocks much less than they did in the past (Decker et al., 2018). This indicates an increase in rigidities. At indus-try level, on the other hand, there is no discernible link between stronger prod-uct market regulation and any decline in business dynamism (Goldschlag and Tabarrok, 2018).
Although network industries have been deregulated in Germany since the end of the 1990s, regulatory requirements in the service sector are still relatively strict compared to other countries (Deutsche Bundesbank, 2019b). The labour mar-ket has tended to become more deregulated (during the 2000s, at least), and the OECD’s product market regulation index as well as the German govern-ment’s cost-of-bureaucracy index have been falling since the mid-2000s. How-ever, the bureaucratic costs of starting a business (World Bank, 2019) as well as the individual employment protection still remain high (OECD, 2013).
Trends towards stricter regulation – such as the more stringent access re-strictions on individual professions – should be resisted. The recent expansion of the so-called Meisterzwang (requirement for certain professions in Germany to hold a master craftsman’s license) is counterproductive. Researchers in the United States have identified a correlation between occupational licensing and a decline in the reallocation rate (The White House, 2015; Johnson and Kleiner, 2017).
190. A further explanation is offered by the crowding-out effect of advancing globalisation. On the one hand, an increase in imports could strengthen com-petition in product markets. This would crowd existing firms out of the mar-ket and it would be less attractive to set up new businesses. On the other hand, an increase in exports could intensify competition in factor markets (especial-ly the labour market). This makes it more attractive for potential entrepreneurs to remain in their respective jobs. This also raises the factor costs for new busi-nesses. Colantone and Sleuwaegen (2010) show for eight EU member states that an increase in export intensity reduces business start-up activity, while an in-crease in import intensity causes more firms to exit the market without being re-placed by new businesses. The significant rise in import and export intensities since the mid-1990s – especially between 2000 and 2008 – could therefore cer-tainly be linked to the decline in start-up rates. It is questionable, however, to what extent this explains the sharp decrease in less trade-intensive sectors.
191. Liu et al. (2019) argue that the declines in reallocation rates and in productivity growth are linked to the decline in interest rates over recent decades. They show that, in a low interest-rate environment, a further fall in interest rates in-

Chapter 2 – Productivity: Improving conditions for growth
112 German Council of Economic Experts – Annual Report 2019/20
creases the level of market concentration. Although low interest rates boost the investment incentives for both market leaders and less productive firms alike, the market leaders’ investments increase more. Lower interest rates mean that the discounted value of firms’ future earnings rises. Because the market leader’s anticipated future earnings are higher, its investment incentives rise particularly sharply. This means that the productivity gap between the market leader and the less productive firms grows, which in turn reduces the less productive firms’ in-vestment incentives. In a long-run equilibrium this leads to higher market concentration, a falling reallocation rate and lower aggregate productivity growth.
192. The low level of interest rates could also lead to a situation where banks continue to lend to firms that are technically insolvent and merely use these loans to meet their outstanding liabilities. Banks are thus delaying writing off these loans. Such zombie firms, whose exit from the market is artificially delayed, tie up factors of production and thus prevent resources from being reallocated to more productive firms (GCEE Annual Report 2017 item 252). This mechanism might also be responsible for the growing productivity divergence between the leading firms at the upper limit of the productivity distribution (‘frontier firms’) and the struggling, unproductive firms at the lower limit of the distribu-tion (‘laggard firms’). Despite this categorisation, however, it should be noted that laggard firms in particular constitute a highly diverse group and that many young businesses are located at the lower limit of the distribution (Berlingeri et al., 2019). These firms presumably achieve lower revenue productivity, especial-ly as a result of their lower prices. However, young businesses deliberately use this pricing strategy in order to win customers and establish themselves in the market (Foster et al., 2006).
193. A further potential explanation attributes the decline in business dynamism to demographic factors. Karahan et al. (2019) show that regions of the United States in which the decline in population growth is especially pronounced exhibit the sharpest decreases in start-up rates and reallocation rates. This can partly be explained by the fact that lower growth in the working population causes stronger competition for workers (Karahan et al., 2019). In addition, a decline in population growth leads to an ageing population, which has further adverse effects on start-up rates and reallocation rates (Engbom, 2019).
These demographic trends are especially pronounced in Germany. Population growth here fell by roughly one percentage point between the begin-ning of the 1990s and the end of the 2000s. Population growth in recent years has risen by around 0.5 percentage points and, owing to the migration of refu-gees in 2015 and 2016, and has even returned to the level it had reached at the beginning of the 1990s. At the same time, the average age of workers has risen by around four years over the past 20 years. Compared with other countries, es-pecially the United States, Germany’s lower population growth might at least partly explain its lower start-up rate.

Productivity: Improving conditions for growth – Chapter 2
Annual Report 2019/20 – German Council of Economic Experts 113
3. Management and technology
194. A further explanation for the varying productivity levels between countries and firms are differences in management skills. Compared with other countries Germany has a relatively large proportion of firms that achieve high ‘manage-ment scores’. Based on the management skills metric developed by Bloom and Van Reenen (2007), Germany is ranked second behind the United States. CHART 38 LEFT Southern European countries, the United Kingdom and France have larger numbers of firms with very low management scores. CHART 38 RIGHT
One reason for the larger number of poorly managed firms in the United King-dom and France is the traditional system of succession applied at family-run businesses. The share of German firms in which the family is the largest share-holder does not differ from the corresponding share in the United Kingdom and France. For traditional reasons, however, these two countries have a larger share of firms in which the family is the largest shareholder and, in addition, the eld-est son is running the business (primogeniture). Evidence shows that these firms tend to possess poorer management skills. This result is driv-en by a smaller talent pool, lower educational incentives for the future manager, and adverse incentive effects on employees, especially those in management po-sitions (Bloom et al., 2011).
195. Inefficient management is also a reason for low ICT adoption rates at firm level. In order to exploit the full potential of ICT capital, firms need to make complementary adjustments to their organisational structures and corporate culture (Brynjolfsson and Hitt, 2000). The poorer management skills in south-
CHART 38
Sources: World Management Survey, own calculations
International comparison of management skills1
© 9 289Sachverständigenrat | 1 -
1 – The data are based on manufacturing firms. Average management score based on 18 questions about monitoring, setting goals and offeringincentives at firms. Waves for the years 2004, 2006, 2009 and 2014. 2 – Spain, Greece, Portugal, Italy.
1 2 3 4
USAGermanySwedenJapanCanadaFranceAustraliaUnited.KingdomSingaporeItalyMexicoZealandPortugalIrelandSpainTurkeyGreeceArgentinaBrazilChinaIndia
Distribution of management scores by countryManagement by country
Management Score
0.2
0.4
0.6
0.8
1.0
01 2 3 4 5
0.2
0.4
0.6
0.8
1.0
0
China Southern Europe2
1 2 3 4 5
0.2
0.4
0.6
0.8
1.0
01 2 3 4 5
0.2
0.4
0.6
0.8
1.0
0
United Kingdom USA
1 2 3 4 5
Density Germany
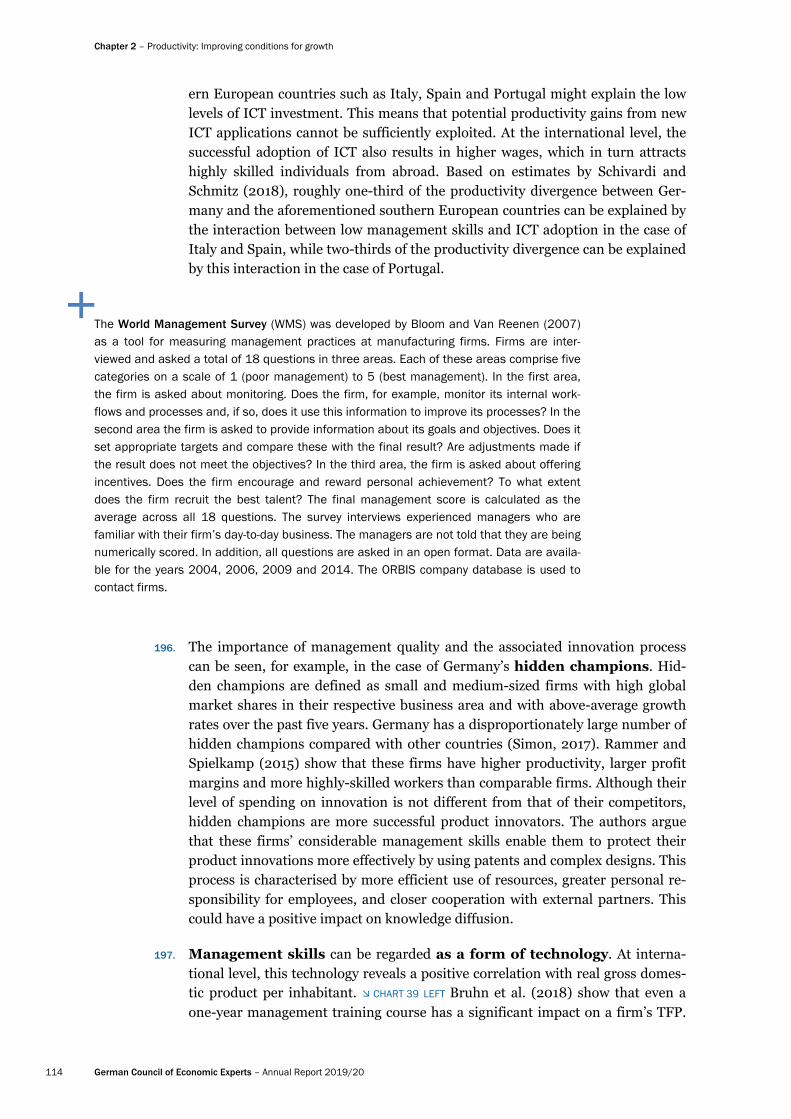
Chapter 2 – Productivity: Improving conditions for growth
114 German Council of Economic Experts – Annual Report 2019/20
ern European countries such as Italy, Spain and Portugal might explain the low levels of ICT investment. This means that potential productivity gains from new ICT applications cannot be sufficiently exploited. At the international level, the successful adoption of ICT also results in higher wages, which in turn attracts highly skilled individuals from abroad. Based on estimates by Schivardi and Schmitz (2018), roughly one-third of the productivity divergence between Ger-many and the aforementioned southern European countries can be explained by the interaction between low management skills and ICT adoption in the case of Italy and Spain, while two-thirds of the productivity divergence can be explained by this interaction in the case of Portugal.
The World Management Survey (WMS) was developed by Bloom and Van Reenen (2007) as a tool for measuring management practices at manufacturing firms. Firms are inter-viewed and asked a total of 18 questions in three areas. Each of these areas comprise five categories on a scale of 1 (poor management) to 5 (best management). In the first area, the firm is asked about monitoring. Does the firm, for example, monitor its internal work-flows and processes and, if so, does it use this information to improve its processes? In the second area the firm is asked to provide information about its goals and objectives. Does it set appropriate targets and compare these with the final result? Are adjustments made if the result does not meet the objectives? In the third area, the firm is asked about offering incentives. Does the firm encourage and reward personal achievement? To what extent does the firm recruit the best talent? The final management score is calculated as the average across all 18 questions. The survey interviews experienced managers who are familiar with their firm’s day-to-day business. The managers are not told that they are being numerically scored. In addition, all questions are asked in an open format. Data are availa-ble for the years 2004, 2006, 2009 and 2014. The ORBIS company database is used to contact firms.
196. The importance of management quality and the associated innovation process can be seen, for example, in the case of Germany’s hidden champions. Hid-den champions are defined as small and medium-sized firms with high global market shares in their respective business area and with above-average growth rates over the past five years. Germany has a disproportionately large number of hidden champions compared with other countries (Simon, 2017). Rammer and Spielkamp (2015) show that these firms have higher productivity, larger profit margins and more highly-skilled workers than comparable firms. Although their level of spending on innovation is not different from that of their competitors, hidden champions are more successful product innovators. The authors argue that these firms’ considerable management skills enable them to protect their product innovations more effectively by using patents and complex designs. This process is characterised by more efficient use of resources, greater personal re-sponsibility for employees, and closer cooperation with external partners. This could have a positive impact on knowledge diffusion.
197. Management skills can be regarded as a form of technology. At interna-tional level, this technology reveals a positive correlation with real gross domes-tic product per inhabitant. CHART 39 LEFT Bruhn et al. (2018) show that even a one-year management training course has a significant impact on a firm’s TFP.
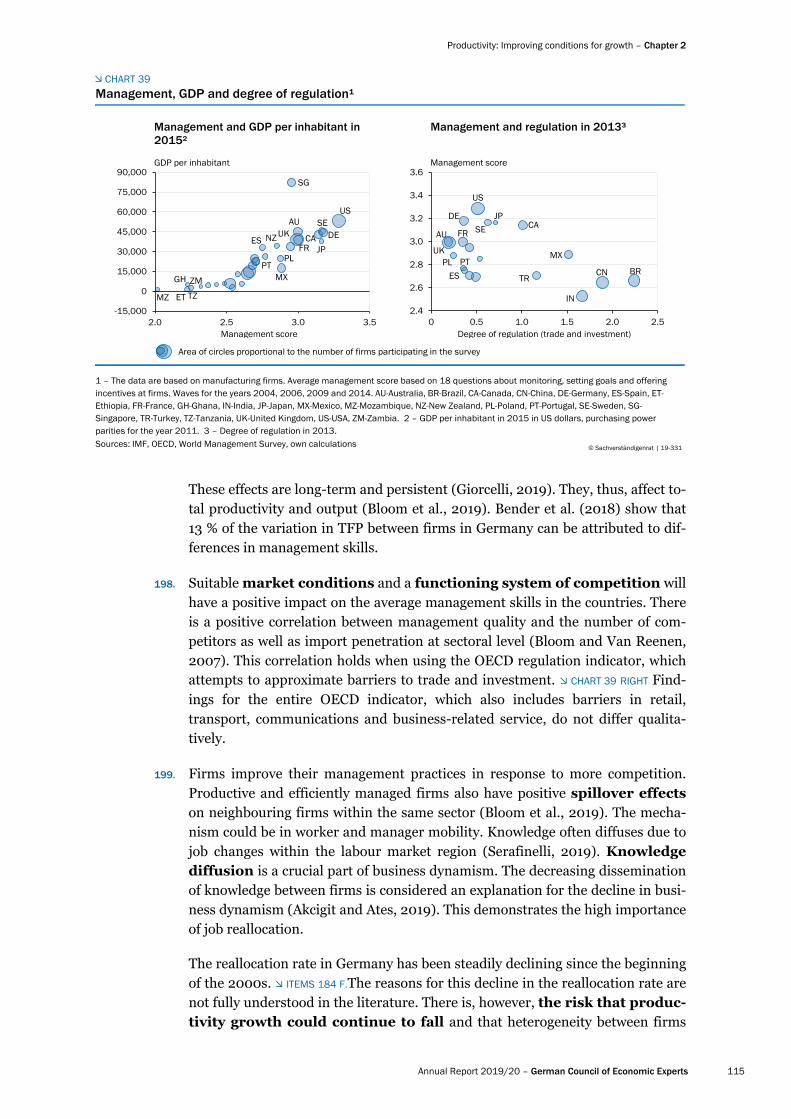
Productivity: Improving conditions for growth – Chapter 2
Annual Report 2019/20 – German Council of Economic Experts 115
These effects are long-term and persistent (Giorcelli, 2019). They, thus, affect to-tal productivity and output (Bloom et al., 2019). Bender et al. (2018) show that 13 % of the variation in TFP between firms in Germany can be attributed to dif-ferences in management skills.
198. Suitable market conditions and a functioning system of competition will have a positive impact on the average management skills in the countries. There is a positive correlation between management quality and the number of com-petitors as well as import penetration at sectoral level (Bloom and Van Reenen, 2007). This correlation holds when using the OECD regulation indicator, which attempts to approximate barriers to trade and investment. CHART 39 RIGHT Find-ings for the entire OECD indicator, which also includes barriers in retail, transport, communications and business-related service, do not differ qualita-tively.
199. Firms improve their management practices in response to more competition. Productive and efficiently managed firms also have positive spillover effects on neighbouring firms within the same sector (Bloom et al., 2019). The mecha-nism could be in worker and manager mobility. Knowledge often diffuses due to job changes within the labour market region (Serafinelli, 2019). Knowledge diffusion is a crucial part of business dynamism. The decreasing dissemination of knowledge between firms is considered an explanation for the decline in busi-ness dynamism (Akcigit and Ates, 2019). This demonstrates the high importance of job reallocation.
The reallocation rate in Germany has been steadily declining since the beginning of the 2000s. ITEMS 184 F.The reasons for this decline in the reallocation rate are not fully understood in the literature. There is, however, the risk that produc-tivity growth could continue to fall and that heterogeneity between firms
CHART 39
1 – The data are based on manufacturing firms. Average management score based on 18 questions about monitoring, setting goals and offering incentives at firms. Waves for the years 2004, 2006, 2009 and 2014. AU-Australia, BR-Brazil, CA-Canada, CN-China, DE-Germany, ES-Spain, ET-Ethiopia, FR-France, GH-Ghana, IN-India, JP-Japan, MX-Mexico, MZ-Mozambique, NZ-New Zealand, PL-Poland, PT-Portugal, SE-Sweden, SG-Singapore, TR-Turkey, TZ-Tanzania, UK-United Kingdom, US-USA, ZM-Zambia. 2 – GDP per inhabitant in 2015 in US dollars, purchasing power parities for the year 2011. 3 – Degree of regulation in 2013.Sources: IMF, OECD, World Management Survey, own calculations © Sachverständigenrat | 19-331
Area of circles proportional to the number of firms participating in the survey
Management, GDP and degree of regulation¹
-15,000
0
15,000
30,000
45,000
60,000
75,000
90,000
2.0 2.5 3.0 3.5
Management and GDP per inhabitant in 2015²
GDP per inhabitant
Management score
CA
SEDE
US
MZ ET
GH
TZ
ZM
ES
PT
NZ
PL
MX
UKAU
FR JP
SG
2.4
2.6
2.8
3.0
3.2
3.4
3.6
0 0.5 1.0 1.5 2.0 2.5
Management and regulation in 2013³
Management score
Degree of regulation (trade and investment)
AU
UKPL
FR
PT
DE
US
BRCN
IN
MX
TR
CAJP
SE
ES
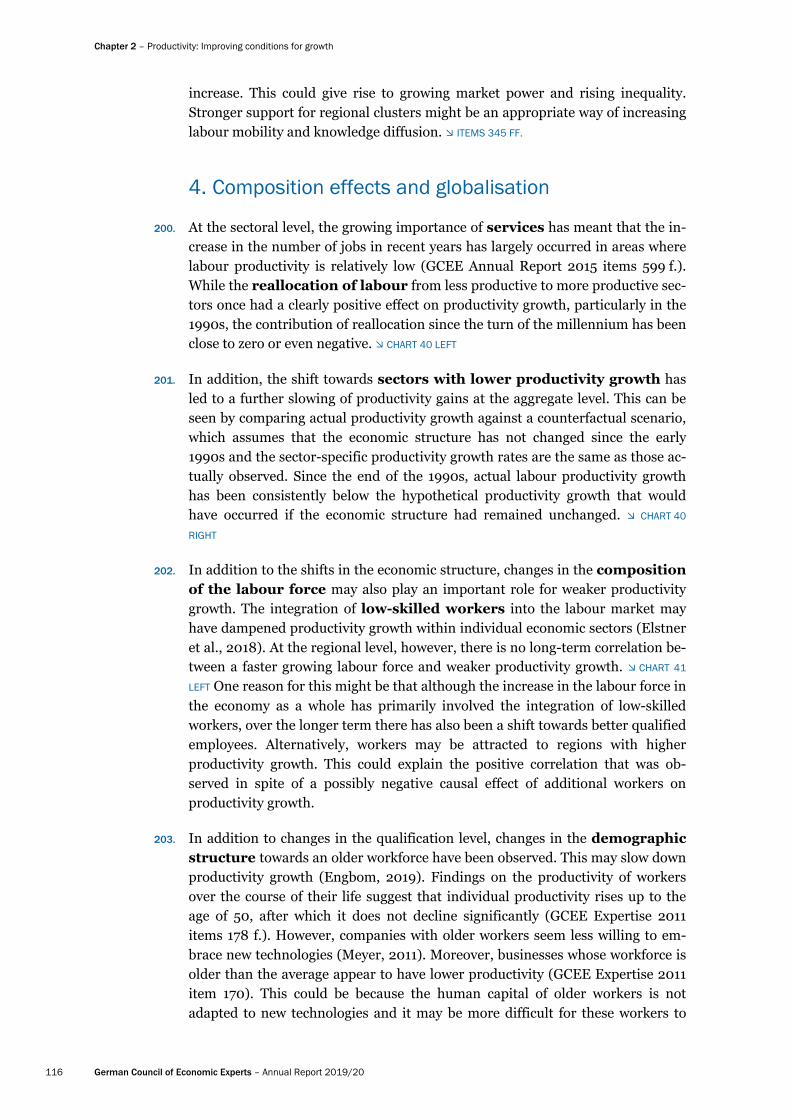
Chapter 2 – Productivity: Improving conditions for growth
116 German Council of Economic Experts – Annual Report 2019/20
increase. This could give rise to growing market power and rising inequality. Stronger support for regional clusters might be an appropriate way of increasing labour mobility and knowledge diffusion. ITEMS 345 FF.
4. Composition effects and globalisation
200. At the sectoral level, the growing importance of services has meant that the in-crease in the number of jobs in recent years has largely occurred in areas where labour productivity is relatively low (GCEE Annual Report 2015 items 599 f.). While the reallocation of labour from less productive to more productive sec-tors once had a clearly positive effect on productivity growth, particularly in the 1990s, the contribution of reallocation since the turn of the millennium has been close to zero or even negative. CHART 40 LEFT
201. In addition, the shift towards sectors with lower productivity growth has led to a further slowing of productivity gains at the aggregate level. This can be seen by comparing actual productivity growth against a counterfactual scenario, which assumes that the economic structure has not changed since the early 1990s and the sector-specific productivity growth rates are the same as those ac-tually observed. Since the end of the 1990s, actual labour productivity growth has been consistently below the hypothetical productivity growth that would have occurred if the economic structure had remained unchanged. CHART 40
RIGHT
202. In addition to the shifts in the economic structure, changes in the composition of the labour force may also play an important role for weaker productivity growth. The integration of low-skilled workers into the labour market may have dampened productivity growth within individual economic sectors (Elstner et al., 2018). At the regional level, however, there is no long-term correlation be-tween a faster growing labour force and weaker productivity growth. CHART 41
LEFT One reason for this might be that although the increase in the labour force in the economy as a whole has primarily involved the integration of low-skilled workers, over the longer term there has also been a shift towards better qualified employees. Alternatively, workers may be attracted to regions with higher productivity growth. This could explain the positive correlation that was ob-served in spite of a possibly negative causal effect of additional workers on productivity growth.
203. In addition to changes in the qualification level, changes in the demographic structure towards an older workforce have been observed. This may slow down productivity growth (Engbom, 2019). Findings on the productivity of workers over the course of their life suggest that individual productivity rises up to the age of 50, after which it does not decline significantly (GCEE Expertise 2011 items 178 f.). However, companies with older workers seem less willing to em-brace new technologies (Meyer, 2011). Moreover, businesses whose workforce is older than the average appear to have lower productivity (GCEE Expertise 2011 item 170). This could be because the human capital of older workers is not adapted to new technologies and it may be more difficult for these workers to

Productivity: Improving conditions for growth – Chapter 2
Annual Report 2019/20 – German Council of Economic Experts 117
learn new working methods (Weinberg, 2004). At regional level, a sharper rise in the proportion of older workers in Germany between 2001 and 2016 coincid-ed with a steeper decline in productivity growth. CHART 41 RIGHT
204. Another significant factor in productivity growth may be outsourcing in the manufacturing sector (GCEE Annual Report 2015 items 605 ff.). This now appears to have leveled off. Until the late 2000s, companies in Germany had in-creasingly concentrated on the final production of highly specialised products, with labour-intensive and less productive stages of the value chain being out-sourced. This process of outsourcing has now slowed. Reasons include the ef-fects of the financial crisis, companies having reached the limits of outsourcing in the production process, an increase in the cost of manufacturing abroad, and an increase in final production processes in countries abroad.
205. The importance of outsourcing for productivity growth at the company and the economic sector level is however disputed. Ademmer et al. (2017) show that at the sectoral level, the intensity of outsourcing has no effect on productivi-ty. The intensity of outsourcing in more productive economic sectors is higher, but a change in intensity within an economic sector over time does not correlate with a change in productivity.
More recent studies at the company level show that – in accordance with the ac-ademic literature (Antràs et al., 2006; Grossman and Rossi-Hansberg, 2008) – a higher degree of offshoring, i.e. the procurement of intermediate goods or services from other countries, leads to an increase in productivity (Bandick, 2015). Using a larger, updated sample, Constantinescu et al. (2019) find that
CHART 40
Effect of economic structure on the growth of hourly productivity1
-1.0
-0.5
0
0.5
1.0
1.5
2.0
2.5
1993 96 99 02 05 08 11 14 2017
Components of productivity growth
%
Within economic sectors2 Reallocation3
-1.0
-0.5
0
0.5
1.0
1.5
2.0
2.5
1993 96 99 02 05 08 11 14 2017
Counterfactual growth comparison
%
Actual productivity growth4
Hypothetical productivity growth5 Difference6
1 – Moving three-month average growth in hourly productivity. 2 – Growth of hourly productivity through increased productivity within economic sectors. 3 – Growth of hourly productivity through changes in the economic structure. 4 – Average hourly productivity growth of the economic sec-tors weighted by the hourly share of the economic sectors. 5 – Assuming a constant economic structure with the same proportion of total hours worked as the average in the period 1991 to 1995. 6 – Difference between actual growth in hourly productivity and hypothetical growth in hourly productivity.
Sources: Federal Statistical Office, own calculations© Sachverständigenrat | 19-346
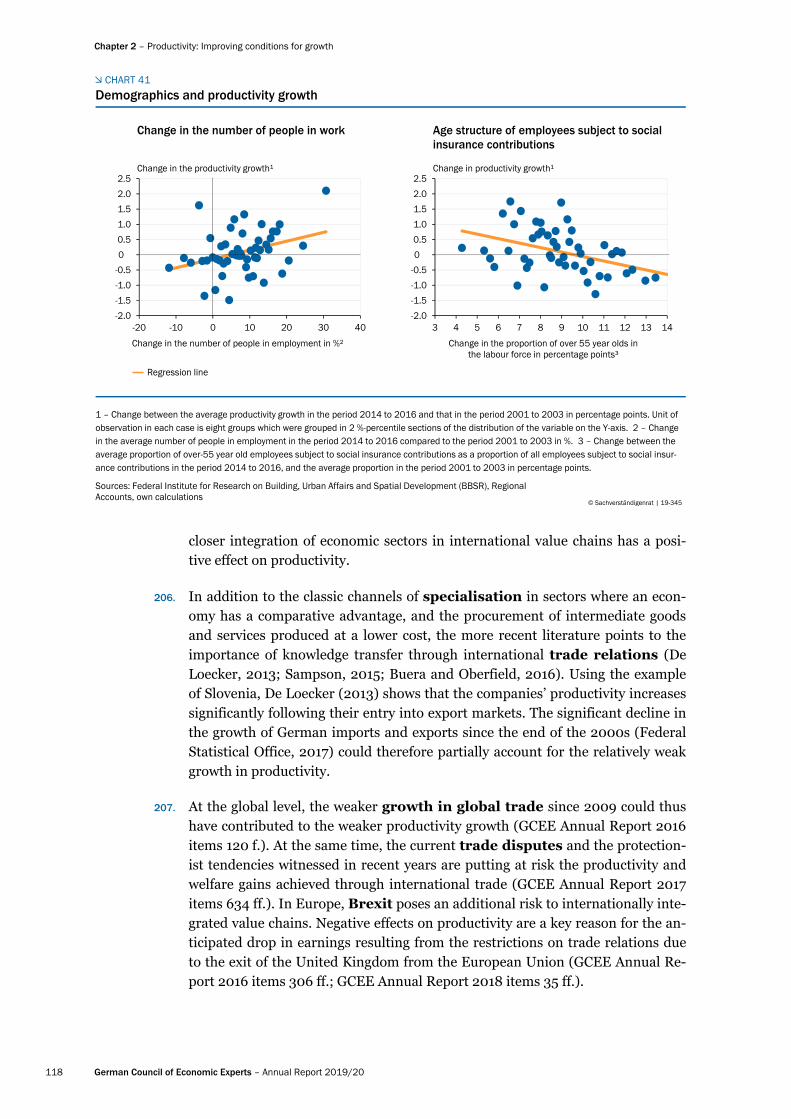
Chapter 2 – Productivity: Improving conditions for growth
118 German Council of Economic Experts – Annual Report 2019/20
closer integration of economic sectors in international value chains has a posi-tive effect on productivity.
206. In addition to the classic channels of specialisation in sectors where an econ-omy has a comparative advantage, and the procurement of intermediate goods and services produced at a lower cost, the more recent literature points to the importance of knowledge transfer through international trade relations (De Loecker, 2013; Sampson, 2015; Buera and Oberfield, 2016). Using the example of Slovenia, De Loecker (2013) shows that the companies’ productivity increases significantly following their entry into export markets. The significant decline in the growth of German imports and exports since the end of the 2000s (Federal Statistical Office, 2017) could therefore partially account for the relatively weak growth in productivity.
207. At the global level, the weaker growth in global trade since 2009 could thus have contributed to the weaker productivity growth (GCEE Annual Report 2016 items 120 f.). At the same time, the current trade disputes and the protection-ist tendencies witnessed in recent years are putting at risk the productivity and welfare gains achieved through international trade (GCEE Annual Report 2017 items 634 ff.). In Europe, Brexit poses an additional risk to internationally inte-grated value chains. Negative effects on productivity are a key reason for the an-ticipated drop in earnings resulting from the restrictions on trade relations due to the exit of the United Kingdom from the European Union (GCEE Annual Re-port 2016 items 306 ff.; GCEE Annual Report 2018 items 35 ff.).
CHART 41
Demographics and productivity growth
-2.0
-1.5
-1.0
-0.5
0
0.5
1.0
1.5
2.0
2.5
-20 -10 0 10 20 30 40
Change in the number of people in work
Change in the productivity growth¹
Change in the number of people in employment in %²
-2.0
-1.5
-1.0
-0.5
0
0.5
1.0
1.5
2.0
2.5
3 4 5 6 7 8 9 10 11 12 13 14
Age structure of employees subject to social insurance contributions
Change in productivity growth¹
Change in the proportion of over 55 year olds in the labour force in percentage points³
Regression line
1 – Change between the average productivity growth in the period 2014 to 2016 and that in the period 2001 to 2003 in percentage points. Unit of observation in each case is eight groups which were grouped in 2 %-percentile sections of the distribution of the variable on the Y-axis. 2 – Change in the average number of people in employment in the period 2014 to 2016 compared to the period 2001 to 2003 in %. 3 – Change between the average proportion of over-55 year old employees subject to social insurance contributions as a proportion of all employees subject to social insur-ance contributions in the period 2014 to 2016, and the average proportion in the period 2001 to 2003 in percentage points.
Sources: Federal Institute for Research on Building, Urban Affairs and Spatial Development (BBSR), Regional Accounts, own calculations
© Sachverständigenrat | 19-345

Productivity: Improving conditions for growth – Chapter 2
Annual Report 2019/20 – German Council of Economic Experts 119
5. The relationship between capital expenditure and productivity
208. One possible explanation for the noticeable decline in productivity growth is the slowdown in the rate of capital intensity growth. ITEMS 147 FF. However, capital goods are not a homogeneous group and they differ in terms of their effect on increasing productivity and growth. So, for example, the macroeconomic productivity gains from investment in housing, which are the reason for the decline in investment intensity, CHART 42 are likely to be fairly low in comparison to capital expenditure on information and communications technol-ogies or R&D (GCEE Annual Report 2015 item 636). As productivity growth in the construction sector is relatively weak (Corrado et al., 2007; GCEE Annual Report 2015 items 710 ff.), an increase in the importance of the construction sec-tor could even have a negative impact on productivity growth, due to composi-tion effects. Furthermore, an analysis of investment activity should not be re-stricted to the physical capital stock, as other factors such as human capital or intangible capital assets are equally important for productivity growth.
209. Greater investment in the physical capital stock could lead to an increase in productivity growth. The technological advancement embodied in capital plays a role here and is reflected, for example, in falling prices for capital assets (Greenwood et al., 1997). But this, in turn, requires innovation in the capital goods sector.
Other factors such as lending conditions are also important for private invest-ing activities and thus for productivity growth. The restricted lending during the financial crisis and the crisis in the euro area probably depressed investment growth for years (ECB, 2016; Antoshin et al., 2017; Gilchrist and Mojon, 2018). Demand-side shocks that cause a contraction in capital expenditure, partic-
CHART 42
Effect of economic structure on investment intensity1
Sources: Federal Statistical Office, own calculations
Total gross fixed capital formation in relationto gross value added
© 9 374Sachverständigenrat | 1 -
Gross fixed capital formation excludingconstruction in relation to gross value added
%%
1 – Moving three-year average. 2 – Average value weighted with the share of gross value added in the economic sector. 3 – Assuming a constanteconomic structure with the same proportion of gross value added as the weigted average during the period 1991 to 1995. 4 – Difference betweenactual and hypothetical investment intensity.
Actual2
-5
5
0
20
25
30
1992 95 98 01 04 07 10 13 162017-1
1
2
0
11
12
13
14
1992 95 98 01 04 07 10 13 162017
Hypothetical3 Difference4

Chapter 2 – Productivity: Improving conditions for growth
120 German Council of Economic Experts – Annual Report 2019/20
ularly in information and communications technologies and R&D, can also act as a lasting brake on productivity growth (hysteresis). Studies for the USA show that companies cut their research activities as a result of the more restrictive lending during the financial crisis and that consequently the crisis had a lasting impact on productivity (de Ridder, 2017; Anzoategui et al., 2019).
210. Conversely, favourable lending conditions do not necessarily lead to higher productivity gains. Productivity had been almost stagnating in southern Europe even before the financial crisis, despite more favourable borrowing conditions. ITEM 163 The reason for this could have been a lack of complementary human capital or management capabilities. ITEM 195 Studies even suggest that the de-cline in interest rates that followed the introduction of the euro and the huge imports of capital may have led to a fall in productivity growth. Channels of im-pact include the misallocation of capital (Gopinath et al., 2017; GCEE Spe-cial Report 2015 items 328 ff.) and the reduced incentives for economic re-form (Fernández-Villaverde et al., 2013; GCEE Annual Report 2015 items 328 ff.).
211. There are interdependencies between capital expenditure and produc-tivity (GCEE Annual Report 2015 items 641 ff.). Capital expenditure affects more than just productivity growth. The neutral technological progress that occurs when productivity increases without any change in production factors such as labour and capital may also lead to an expansion of investment. Here, the direction of causality is from higher productivity to greater capital expendi-ture. Therefore, the trend towards slower investment growth in many advanced economies may be less the cause of lower productivity growth than the conse-quence of it.
212. The moderate growth in capital expenditure could also be caused by de-mographic change. If one accepts the complementarity of the production fac-tors capital and labour, as posited for example by neoclassical growth theory, slower growth in the population would mean lower returns on capital, which in turn will act as a brake on investment activity. There may be a high degree of complementarity between capital and highly skilled workers (Krusell et al., 2000). Measures that increase human capital may therefore be capable of achieving higher capital expenditure. Like physical capital, accumulated knowledge frequently loses economic value over time as new technologies are in-troduced (Chari and Hopenhayn, 1991). An ageing population with a low stock of new human capital is therefore likely to inhibit investment in modern physical capital. ITEM 203 Lifelong learning could counteract this.
213. The increasing importance of the service sector, which tends to be more labour-intensive, may also affect the growth of spending on capital equipment (Strobel, 2015). However, in contrast to many other advanced economies, the size of the manufacturing industry as a proportion of gross value added in Ger-many has remained almost unchanged since the mid-1990s. There are no nega-tive composition effects between industry and services for capital spending on plant and equipment overall or for investment in equipment. CHART 42
Productivity: Improving conditions for growth – Chapter 2
Annual Report 2019/20 – German Council of Economic Experts 121
214. Surveys at company level suggest there are structural barriers to investment caused by bureaucracy and regulation, a shortage of skilled workers and a high cost burden (Bardt and Grömling, 2017). However, the surveys show that these barriers change over time. In 2014, around 45 % of companies cited demand-side problems caused by the weak economy in Europe as one of the important barriers to investment. In 2017, this figure was only just over 10 %. One important factor governing private investment activity may be the un-certainty concerning economic and regulatory policy. This applies with re-gard to the future of global free trade and to climate and energy policy. As some investment cycles are extremely long, long-term planning with regard to state regulation is likely to be crucial, particularly for energy-intensive industries (GCEE Special Report 2019 item 164).
215. Functioning public infrastructure is an essential precondition for pri-vate-sector economic activity. Public-sector investment is therefore signifi-cant for the growth of an economy’s potential output (Expertise 2007 Box 4). Ar-ticles reviewing the empirical literature by Romp and de Haan (2007) and Bom and Ligthart (2013) find positive output elasticity of the public capital stock.
This observation alone does however not justify the demand for comprehensive state investment programmes in Germany or special legislation stipulating min-imum volumes of state investment. ITEMS 531 FF. Not all government investment promotes growth, let alone productivity. At the same time, government’s con-sumption expenditure, which includes spending on items such as maintenance, is also very important for the quality of public infrastructure. Spending on public education, not least to ensure the quality of teaching staff, also counts as consumption expenditure and is likely to contribute to the growth potential via the increase in human capital.
216. It is therefore necessary to identify and prioritise spending that promotes growth on a case-by-case basis. This includes creating a modern digital admin-istration (GCEE Annual Report 2018 items 144 ff.), and raises the question of how far the state should be held accountable for the provision of infrastruc-ture such as charging points for electric cars (GCEE Special Report 2019 item 252) or the expansion of the broadband network (GCEE Annual Report 2017 items 61 ff.). An alternative to the direct provision of infrastructure would be to set the economic conditions via regulatory measures so as to facilitate private-sector activity.
IV. CONCLUDING REMARKS
217. In Germany, as in other advanced economies, productivity growth is persis-tently weak. Demographic change will lead to a reduction of the number of people in the workforce and an increasing shortage of skilled workers that will have a significant detrimental impact on the growth prospects of the German

Chapter 2 – Productivity: Improving conditions for growth
122 German Council of Economic Experts – Annual Report 2019/20
economy. The question, then, is how the trend growth rate can be boosted by a turnaround in productivity growth. ITEMS 141 FF.
218. The weak productivity growth in many developed economies appears to contradict the productivity increases anticipated through the revolution in in-formation and communication technologies (ICT). Although potential measure-ment errors as a result of the increased use of ICT may be less relevant for Ger-many, adaptation delays may be an important explanatory factor. Germany is lagging behind in the use of ICT innovations, ITEM 180 even though the man-agement capabilities required for their effective use are in fact likely to exist. ITEM 194
Investment in intangible production factors is weak, particularly in the service sector. Alongside ICT investment in software and databases, these in-clude complementary spending on research and development. ITEM 305 Fur-thermore, Germany is lagging behind in terms of investment in complementary digital infrastructure (GCEE Annual Report 2018 items 144 ff.).
219. Productivity is also affected by demographic factors. Alongside composition ef-fects relating to the qualification levels of the workforce ITEM 202, one of the most important of these factors is the rate of new business start-ups, which is still falling in Germany. ITEM 184 This is reflected in a reduced reallocation rate. Production factors are therefore not utilised efficiently from a macroeco-nomic perspective. This could be due to regulation in the labour market an in the service sector that is still elevated by international comparison. In the service sector, in particular, the further dismantling of market access barriers is required (GCEE Annual Report 2015 items 616 ff.). However, a number of measures have recently been introduced that prevent such removal of barriers, such as the tightening of the EU Posting of Workers Directive and the extension of the Meisterzwang (requirement in Germany for a master craftsman’s qualifi-cation).
220. In an ageing society it is particularly important to strengthen entrepreneurial ac-tivity and to create the right conditions so that more potential entrepreneurs are willing to take the necessary risks. Demographic change may also inhibit capital expenditure. Businesses with a larger proportion of older workers invest less in innovative equipment. One reason may be that older workers have often built up human capital that is less complementary to new capital. ITEM 203 Lifelong learning can help older workers to adjust to new technologies and increase so-ciety’s capacity to innovate (Expertise 2011 items 185 f.).
221. Education institutes also play an important role in increasing equality of opportunities across the generations. ITEM 705 Lack of educational mobility not only entrenches existing social structures, but may also be a barrier to growth. If, in contrast, society succeeds in getting more people qualified and into the job market, the build-up of human capital would increase the potential for growth. In Germany there is a strong correlation between children’s education level and that of their parents (OECD, 2019b). It is therefore important to make further improvements, particularly in the area of early years education, (OECD, 2019b; GCEE Annual Report 2017 item 854). In addition, equality of
Productivity: Improving conditions for growth – Chapter 2
Annual Report 2019/20 – German Council of Economic Experts 123
opportunity may be improved by making it easier for learners to move between different educational paths and by the introduction of a mandatory pre-school year (GCEE Annual Report 2016 item 63).
222. Another means of boosting productivity lies in increased investment activity. From an economic policy perspective, the primary objective is to create a relia-ble business and regulatory environment for companies. ITEM 224 An internationally competitive tax system is hugely important. International tax competition has been intensifying for a number of years (GCEE Annual Report 2018 items 589 ff.). In many countries, profit tax rates have been on a downward trajectory. The challenge for fiscal policy is therefore to create an attractive busi-ness and regulatory environment for private investment in Germany while at the same time providing a functioning public infrastructure.
223. Government infrastructure policy needs to identify and prioritise growth-promoting spending. This includes energy supply, digital infrastructure and the modernisation of the transport infrastructure as well as local public services. It is important to ensure that existing infrastructure is maintained and not to undermine the individual responsibility of private households and companies. This could play a role in respect of charging points for electric cars (GCEE Spe-cial Report 2019 item 252) or the expansion of the broadband network (GCEE Annual Report 2017 items 61 ff.). Then there are the many regulatory and bu-reaucratic obstacles, including the scepticism of the general population towards the expansion of public infrastructure. ITEM 556
224. Access to capital is an important requirement for corporate investment. ITEM 155 In particular, deficits in the provision of private venture capital for companies in the start-up and growth phase need to be overcome. ITEMS 284
FF. By international comparison bank funding is particularly dominant in Germany while capital market funding, most notably in the form of equity capital, is underdeveloped, particularly compared to the US. One reason may be the privileged tax treatment given to borrowed capital in Germany, as in most EU member states. The German Council of Economic Experts has therefore called many times for an allowance for corporate equity (GCEE Annual Report 2012 items 385 ff.; Annual Report 2015 items 714 ff.; Annual Report 2018 items 640 ff.) Given the structural change within the financial system, the challenge for the banking and financial supervisory authorities is likely to lie in regulating the activities of new market players appropriately while not stifling innova-tion. ITEMS 423 FF.
225. The long-term prosperity of an economy hinges on its ability to innovate. ITEM 146 This refers firstly to the creation of knowledge and technical innova-tion. Research and innovation policy is extremely important, primarily due to externalities. ITEMS 291 FF. As the decline in productivity is an interna-tional phenomenon, the need for a change in economic policy is not restrict-ed to Germany. In all economies, national economic policy is required to take ac-tion, as it would not be advisable to accept slowing productivity growth just be-casust this is taking place elsewhere, too. In addition, international solutions should be sought to increase productivity growth.

Chapter 2 – Productivity: Improving conditions for growth
124 German Council of Economic Experts – Annual Report 2019/20
226. In many areas such as research and digital services, economies of scale are significant. Coordination at the European level, taking account of the principle of subsidiarity, is therefore desirable (GCEE Annual Report 2018 items 50 ff.). This could mean: (i) the creation of a digital single market, (ii) the reallo-cation of financial resources to fundamental research, (iii) alignment of climate policy and energy policy, in particular deeper integration of the electricity mar-ket, and (iv) the expansion of the European capital markets union. ITEMS 288,
298, 313
Strengthening European competition policy with a focus on standardised regulation and low barriers to entry could also boost the benefits of a single market with around 500 million consumers. However, there should not be any promotion or creation of national or European champions. ITEMS 313 FF.
227. Germany is a very open economy and is tightly integrated into the global econo-my, which has brought it considerable prosperity gains (GCEE Annual Report 2017 items 657 ff.). Since the financial crisis, however, the ongoing process of in-tegrating the global economy has faltered. ITEM 207 The positive contribution to productivity growth brought about by this integration is likely to have reduced accordingly. The objective must therefore be to strengthen the multilateral trading system in order to further boost the productivity and prosperity gains achieved by the international division of labour (GCEE Annual Report 2018 items 8 ff.). ITEM 206
A protectionist trade and competition policy that might provoke other countries to introduce reciprocal measures should be avoided at all costs. ITEMS 318 FF. Germany should instead be made more attractive as a place to do busi-ness, not least for foreign investors (GCEE Annual Report 2018 item 18).
228. Alongside the efforts to increase productivity growth, there is a need to lever-age untapped labour market potential and thereby increase the trend growth rate. That means getting more people into employment, particularly women and older people, reducing long-term unemployment (GCEE Annual Re-port 2018 items 89 ff.) and encouraging the immigration of skilled workers (GCEE Annual Report 2018 items 96 ff.). A reform of the tax system could provide greater incentives to those currently not in employment. ITEMs 648 ff. In view of the ageing population and the associated burden on social security sys-tems, a longer working life may be unavoidable. One option would be to make the retirement age more flexible, particularly by linking it to future life ex-pectancy (GCEE Annual Report 2018 items 108 f.).

Productivity: Improving conditions for growth – Chapter 2
Annual Report 2019/20 – German Council of Economic Experts 125
A differing opinion
229. One member of the Council, Achim Truger, does not agree with the majority po-sition of the GCEE on the subject of ‘Productivity: improving the conditions for growth’. His differing opinion relates to the statements on current account imbalances, some of the economic policy implications for productivity growth and the approach of looking at productivity growth almost exclusively through the lens of increasing (potential) GDP growth.
230. The majority of Council members do not regard Germany’s current account sur-plus as a major problem that needs to be addressed through economic policy, and consequently do not believe that a specific value for the current ac-count balance is a useful target for economic and fiscal policy. They state that experience from recent crises, not least in the euro area, showed that excessive current account deficits could be accompanied by the risk of sharp correc-tions, but that this is not true to the same extent for current account surpluses. In addition, the current account balance is said to be dependent on a number of factors and is hard to influence through economic policy.
231. However, Hünnekes et al. (2019a, 2019b) argue that the German proclivity for current account surpluses is an anomaly when set in a long-term his-torical context. They point out that the high level of capital export that has been a virtually permanent feature of Germany’s economy since 1950 has not been good for Germany. Firstly, the returns on German foreign capital are considerably lower than the returns achieved by other economies on their ex-ported capital. Secondly, returns generated abroad are lower than those in Germany, so greater capital expenditure domestically would make more sense. Thirdly, the foreign investments do not provide effective hedging against risk. In their summary, they say: “[…It] is […] not about questioning German industry’s focus on exports or about curbing export volumes. It is about exploring new ways of investing the substantial German savings to produce hig-her private and social returns at home, instead of continually accepting substan-tial write-downs on foreign assets” (Hünnekes et al., 2019b).
232. But the German current account surpluses are not just a problem from an isola-ted national perspective. They also have a major destabilising effect on the euro area and the global economy. Current account surpluses and deficits need to be looked at symmetrically. As the French National Productivity Board ar-gues, a combination of permanently relatively slow domestic economic growth and relatively low growth in unit labour costs creates permanent pressure on partner countries, particularly within the euro area where there is no longer an exchange rate mechanism that can be used to adjust real effective exchange rates. The resulting tendency towards substantial current account surpluses throughout the entire euro area will have two negative external effects on the member states: firstly, it will cause the euro to appreciate and create disinflatio-nary pressure that is increasingly hard for the ECB to counter as interest rates approach or reach zero. Secondly, the current account surpluses in individual
Chapter 2 – Productivity: Improving conditions for growth
126 German Council of Economic Experts – Annual Report 2019/20
member states within the eurozone could lead to trade policy conflicts – particu-larly during the administration of US president Donald Trump (Conseil National de Productivité, 2019, pages 109 ff.).
233. The IMF (2019) also concludes in its external balance assessment, which calculates internationally compatible current account balances in medium-term equilibrium, that in 2018, Germany had an equilibrium current account surplus of 2.5 % of GDP, while the actual surplus was 7.3 % of GDP. Accordingly, the real effective exchange rate was found to be undervalued by 13 %. The calculated equilibrium balance also includes a demographic component that the Council majority discusses as an explanatory factor for the high German surplus. How-ever, according to the IMF, the demographic component only accounts for a sur-plus of less than 1 % of GDP. The majority of the Council themselves come to the conclusion that the real effective exchange rate can explain an additional two percentage points or so of the German economy’s current account surplus.
234. Both the IMF and the French National Productivity Board draw the conclusion that an overly restrictive fiscal policy has contributed to the surpluses. Accordin-gly, a more expansionary fiscal policy in countries that run a current account surplus could play an important role in countering current ac-count imbalances. According to the IMF (2019, pages 17 f.), within the euro area where accommodative monetary conditions remain necessary to support the return of area-wide inflation to its target, fiscal policy in key creditor econo-mies (Germany and the Netherlands) could be used to boost potential growth through infrastructure investments and greater support for innovation. And in Germany, where the current account surplus is associated with rising top in-come inequality, further tax relief for low-income households could boost their disposable income and support domestic demand, while property and inheritance tax reform could help reduce excess saving and wealth concent-ration.
235. The Council majority is proposing some very specific measures to increase productivity growth. In some cases it is not clear how the above diagnosis and analysis has led the Council to propose these particular measures, and why and to what extent they would be capable of increasing productivity in Germany. As frequently mentioned in the text, the productivity slowdown is part of a long-term global trend affecting all developed economies. Moreover, the growth in labour productivity and total factor productivity (TFP) in Germany was not particularly remarkable by international comparison. Almost none of the rolling five-year averages are at the bottom end of the EU range; since the financial crisis (in the case of TFP) and since 2012 (labour productivi-ty) they have even tended to be at the upper end. CHART 31
236. The causal analysis discusses a wide range of approaches, which is a very in-structive exercise. However, because of the large number of views represented in the literature, including some fairly controversial ones, there is no persuasive explanation for the productivity paradox or the differences in the productivity growth of different economies. Such an uncertain basis is hardly appropriate for drawing clear economic policy implications for structural reforms in Ger-

Productivity: Improving conditions for growth – Chapter 2
Annual Report 2019/20 – German Council of Economic Experts 127
many promising a perceptible productivity boost. If structural reforms could ea-sily unleash productivity growth, then why does no developed economy appear to have succeeded in decoupling itself from the international downward trend in productivity growth with any of a wide variety of structural factors.
237. The majority view of the Council is that the slowdown in the rate of new business start-ups in Germany could be due to product and labour market regulati-on. Although this is decreasing, it is still said to be high by international compa-rison. The Council therefore believes a further reduction of market access bar-riers is called for, especially in the service sector. Aside from general doubts with regard to the assumed mechanisms by which this would work, many of the usual OECD indicators for labour market regulation (protection against dismissal, amount and duration of earnings replacement benefits, trade union density, col-lective pay bargaining coverage), place Germany in the middle of the EU rankings. The same applied in 2013 for the overall indicator for product market regulation, which shows a low level of regulation (GCEE Annual Report 2015 Chart 94). Only in the area of business services was the indicator significantly higher; here it was at the top end of the middle of the table. According to the OECD, the indicator for administrative hurdles to business start-ups is significantly below the OECD average.
238. The Council majority argues that deficits in the provision of private venture capi-tal for companies in the start-up and growth phase need to be overcome. One reason for this relates to the privileged tax treatment of debt capital. The Council therefore repeats its call for its previously developed concept of interest-rate-based tax exemption for share capital in connection with corporation taxa-tion. However, that would further promote the dualisation of income tax and would violate the principle of horizontal equity, i.e. equal tax treatment of all types of income, even more severely than the flat rate withholding tax.
239. The interest-rate-based tax exemption for share capital would reduce government revenues in the short term by between €2.8 and 5.6 billion and in the long term by between €3.5 and 7 billion, depending on the underlying im-puted interest rate (GCEE Annual Report 2018 table 25). Ninety per cent of such tax relief on company profits would benefit the top 10 % of taxpayers (Bach and Buslei, 2017, table 3, 4). The redistribution of the tax burden from top to bottom, which has been going on since the start of the new millennium, if not before, ITEM 719 would thus continue. In the coalition agreement, the parties of government however agreed to scrap flat-rate withholding tax on interest income with the aim of creating taxation that is neutral in terms of investment decisions. If interest rates were to rise in future, this could lead to a slight rise in tax revenues. Around 60 % of the additional tax burden is likely to fall on the top 20 % of taxpayers, and would therefore be progressive (Bach and Buslei, 2017, table 3, 4).
240. The Council majority believes that an internationally competitive tax system is very important for private-sector investment activity. The increase in inter-national tax competition and decreasing rates of tax on profit means that fis-cal policymakers face the challenge of creating an attractive business and regula-

Chapter 2 – Productivity: Improving conditions for growth
128 German Council of Economic Experts – Annual Report 2019/20
tory environment for private-sector investment in Germany while at the same time providing a functioning public infrastructure. The first thing to say here is that Germany does not have to simply accept international tax competition, as Peter Bofinger argued in his differing opinion last year on the fiscal policy position of the Council majority (GCEE Annual Report 2018 items 645 ff.): “Rather, Germany should do everything it can at European level to prevent tax competition and its draining effect.”
241. When emphasising the importance of an internationally competitive tax system for private investment activity, however, it must be borne in mind that high quality public infrastructure is also a key factor for private-sector capital investment. Cuts to corporate tax rates on the scale under discussion are fiscally expensive: the Advisory Board to the Federal Ministry of Finance (2019) calculates that its proposal to reduce corporation tax from 15 % to 10 % would reduce tax revenues by just under €14 billion, before taking into account any adjustments in reaction to the cuts. Unquantifiable negative effects arising from tax relief for individuals trading as a company have to be added to this sum. The complete abolition of the solidarity surcharge and introduction of the interest-rate-based tax exemption proposed by the Council majority would cost €13 to €17 billion (GCEE Annual Report 2018 items 639 ff.). This type of struc-tural burden on the government budget poses major risks to public finances in view of the debt brake and the reduced tax revenues expected as a result of cyclical effects combined with a procyclical economic correction. This would make it more difficult to fund a high quality infrastructure programme.
242. The Council majority opinion does not systematically pursue explanations that try to account for the growth of TFP in part via the long-term effects of short-term shocks (total factor productivity hysteresis). Ball (2014), for exa-mple, examines the long-term effect of the great recession in OECD countries. Adler et al. (2017) see expansionary macroeconomic policy, in particular in the form of public infrastructure investment, as a means of increasing produc-tivity growth primarily in the European countries badly affected by the financial crisis.
243. Ultimately, the approach of the majority of Council members – which examines the increase in macroeconomic productivity almost exclusively through the lens of the rise in the trend growth rate – is by no means the only possible viewpoint. Productivity growth does not necessarily only have to be used to increase growth – it can also be used to reduce working hours and thus increase intangible prosperity in the form of more leisure time. This is why it is prob-lematic to use the USA’s very high per capita income as a benchmark for other economies and thus implicitly hold it up as a model. The high per capita income of the United States – particularly in comparison to Germany and France – is based not on being significantly better in terms of productivity per person hour, but first and foremost on longer working hours per worker.
244. Accordingly, the use of high productivity per person hour to enable shorter wor-king hours for each worker in Germany can – as the Council majority also men-tions – be regarded as an expression of a greater preference for leisure ti-

Productivity: Improving conditions for growth – Chapter 2
Annual Report 2019/20 – German Council of Economic Experts 129
me (Blanchard, 2004). A greater degree of labour market regulation and trade union organisation is an important factor in this regard (Alesina et al., 2006). Furthermore, the lower income inequality in comparison to the US may mean that individuals are less exposed to social consumption norms that are associated with inequality (Bowles and Park, 2005; Oh et al., 2012). The con-clusion that an ageing population makes a longer working life inevitable is there-fore far from compelling.

Chapter 2 – Productivity: Improving conditions for growth
130 German Council of Economic Experts – Annual Report 2019/20
REFERENCES
Acemoglu, D. (2009), Introduction to modern economic growth, Princeton University Press.
Acemoglu, D., S. Johnson and J.A. Robinson (2005), Institutions as a fundamental cause of long-run growth, in: Aghion, P. and S. N. Durlauf (Eds.), Handbook of Economic Growth, Vol. 1, Elsevier, Amster-dam, 385–472.
Acemoglu, D. and J.A. Robinson (2012), Why nations fail: The origins of power, prosperity, and poverty, Crown Publishing Group, New York.
Ademmer, M. et al. (2017), Produktivität in Deutschland: Messbarkeit und Entwicklung, Kieler Beiträge zur Wirtschaftspolitik No. 12, Kiel Institute for the World Economy (IfW).
Adler, G., R. Duval, D. Furceri, S.K. Çelik, K. Koloskova and M. Poplawski-Ribeiro (2017), Gone with the headwinds: Global productivity, IMF Staff Discussion Note SDN/17/04, International Monetary Fund, Washington, DC.
Advisory Board to the Federal Ministry of Finance (2019), Zur US‑Steuerreform 2018: Steuerpolitische
Folgerungen für Deutschland, Statement des unabhängigen Wissenschaftlichen Beirats beim BMF, Ber-lin.
Aghion, P., U. Akcigit and P. Howitt (2014), What do we learn from Schumpeterian growth theory?, in: Aghion, P. and S. N. Durlauf (Eds.), Handbook of Economic Growth, Vol. 2B, Elsevier, Amsterdam, 515–563.
Aghion, P., A. Bergeaud, T. Boppart, P.J. Klenow and H. Li (2019), Missing growth from creative destruc-tion, American Economic Review 109 (8), 2795–2822.
Aghion, P. and P. Howitt (1992), A model of growth through creative destruction, Econometrica 60 (2), 323–351.
Akcigit, U. and S.T. Ates (2019), What happened to U.S. business dynamism?, NBER Working Paper 25756, National Bureau of Economic Research, Cambridge, MA.
Alesina, A.F., E.L. Glaeser and B. Sacerdote (2006), Work and leisure in the U.S. and Europe: Why so dif-ferent?, NBER Macroeconomics Annual 2005, Vol. 20, National Bureau of Economic Research, Cam-bridge, MA, 1–100.
Alloza, M., B. Cozmanca, M. Ferdinandusse and P. Jacquinot (2019), Fiscal spillovers in a monetary un-ion, EZB Economic Bulletin 1/2019, European Central Bank, Frankfurt am Main, 59–69.
Antoshin, S., M. Arena, N. Gueorguiev, T. Lybek, J. Ralyea and E.B. Yehoue (2017), Credit growth and economic recovery in Europe after the global financial crisis, IMF Working Paper WP/17/256, Interna-tional Monetary Fund, Washington, DC.
Antràs, P., L. Garicano and E. Rossi-Hansberg (2006), Offshoring in a knowledge economy, Quarterly Journal of Economics 121 (1), 31–77.
Anzoategui, D., D. Comin, M. Gertler and J. Martinez (2019), Endogenous technology adoption and R&D as sources of business cycle persistence, American Economic Journal: Macroeconomics 11 (3), 67–110.
Atkeson, A. and P.J. Kehoe (2007), Modeling the transition to a new economy: Lessons from two techno-logical revolutions, American Economic Review 97 (1), 64–88.
Autor, D.H., D. Dorn, L.F. Katz, C. Patterson and J. Van Reenen (2017), The fall of the labor share and the rise of superstar firms, NBER Working Paper 23396, National Bureau of Economic Research, Cam-bridge, MA.
Bach, S. and H. Buslei (2017), Aufkommens- und Verteilungswirkungen von Reformen der Abgeltungs-teuer: Analyse mit dem Einkommensteuer-Simulations-Modell (EStM) auf Grundlage der Lohn- und Ein-kommensteuerstatistik 2007/2008, Politikberatung kompakt 124, German Institute for Economic Re-search, Berlin.
Baily, M.N., C. Hulten, D. Campbell, T. Bresnahan and R.E. Caves (1992), Productivity dynamics in manu-facturing plants, Brookings Papers on Economic Activity 23 (1992 Microeconomics), 187–267.
Ball, L. (2014), Long-term damage from the Great Recession in OECD countries, European Journal of Economics and Economic Policies: Intervention 11 (2), 149–160.
Productivity: Improving conditions for growth – Chapter 2
Annual Report 2019/20 – German Council of Economic Experts 131
Bandick, R. (2015), The effect of offshoring on productivity and export growth, Conference paper, ETSG 2015 Seventeenth Annual Conference, Paris, 12 September.
Bardt, H. and M. Grömling (2017), Hausgemachte Investitionshemmnisse reduzieren, Wirtschaftsdienst 97 (12), 896–898.
Baskaran, T., L.P. Feld and J. Schnellenbach (2016), Fiscal federalism, decentralization and economic growth: A meta-analysis, Economic Inquiry 54 (3), 1445–1463.
Bell, L.A. and R.B. Freeman (2001), The incentive for working hard: Explaining hours worked differences in the US and Germany, Labour Economics 8 (2), 181–202.
Bender, S., N. Bloom, D. Card, J. Van Reenen and S. Wolter (2018), Management practices, workforce selection, and productivity, Journal of Labor Economics 36 (S1), S371–S409.
Berlingeri, G., S. Calligaris, C. Criscuolo and R. Verlhac (2019), Last but not least: Laggard firms, tech-nology diffusion and its structural and policy determinants, Progress Report DSTI/CIIE(2018)11, Organi-sation for Economic Co-operation and Development, Paris.
Bernhard, S. and M. Grüttner (2015), Der Gründungszuschuss nach der Reform: Eine qualitative Imple-mentationsstudie zur Umsetzung der Reform in den Agenturen, IAB Forschungsbericht 4/2015, Institute for Employment Research of the German Federal Employment Agency, Nuremberg.
Bick, A., B. Brüggemann and N. Fuchs‐Schündeln (2019), Hours worked in Europe and the United States: New data, new answers, Scandinavian Journal of Economics 121 (4), 1381–1416.
Blanchard, O. (2004), The economic future of Europe, Journal of Economic Perspectives 18 (4), 3–26.
Blomberg, S.B., G.D. Hess and A. Weerapana (2004), The impact of voter initiatives on economic activi-ty, European Journal of Political Economy 20 (1), 207–226.
Bloom, N. et al. (2019), What drives differences in management practices?, American Economic Review 109 (5), 1648–1683.
Bloom, N., C. Jones, J. Van Reenen and M. Webb (2017), Are ideas getting harder to find?, NBER Work-ing Paper 23782, National Bureau of Economic Research, Cambridge, MA.
Bloom, N., R. Sadun and J. Van Reenen (2011), Keeping family-owned firms family-run from one genera-tion to the next can be bad for business, http://eprints.lse.ac.uk/41003/1/blogs.lse.ac.uk-Keep-ing_familyowned_firms_familyrun_from_one_generation_to_the_next_can_be_bad_for_business.pdf, retrieved 22 October 2019.
Bloom, N. and J. Van Reenen (2007), Measuring and explaining management practices across firms and countries, Quarterly Journal of Economics 122 (4), 1351–1408.
BMWi (2017), Zur Diskussion: Stabilisierung im Euroraum durch expansive Fiskalpolitik in Deutschland? Ausstrahlungswirkung öffentlicher Investitionen in Deutschland auf die Wirtschaftsleistung in anderen Mitgliedstaaten des Euroraums, Schlaglichter der Wirtschaftspolitik 03/2017, Federal Ministry for Eco-nomic Affairs and Energy, Berlin, 15–23.
Bom, P.R.D. and J.E. Ligthart (2014), What have we learned from three decades of research on the productivity of public capital?, Journal of Economic Surveys 28 (5), 889–916.
Bowles, S. and Y. Park (2005), Emulation, inequality, and work hours: Was Thorsten Veblen right?, Eco-nomic Journal 115 (507), F397–F412.
Bresnahan, T.F., E. Brynjolfsson and L.M. Hitt (2002), Information technology, workplace organization, and the demand for skilled labor: Firm-level evidence, Quarterly Journal of Economics 117 (1), 339–376.
Breuer, S. and S. Elstner (2017), Die Wachstumsperspektiven der deutschen Wirtschaft vor dem Hinter-grund des demografischen Wandels – Die Mittelfristprojektion des Sachverständigenrates, Working Pa-per 07/2017, German Council of Economic Experts, Wiesbaden.
Bruhn, M., D.S. Karlan and A. Schoar (2018), The impact of consulting services on small and medium enterprises: Evidence from a randomized trial in Mexico, Journal of Political Economy 126 (2), 635–687.
Brynjolfsson, E. and L.M. Hitt (2000), Beyond computation: Information technology, organizational trans-formation and business performance, Journal of Economic Perspectives 14 (4), 23–48.
Brynjolfsson, E. and A. McAfee (2014), The second machine age: Work, progress, and prosperity in a time of brilliant technologies, W. W. Norton & Company, New York.

Chapter 2 – Productivity: Improving conditions for growth
132 German Council of Economic Experts – Annual Report 2019/20
Brynjolfsson, E., D. Rock and C. Syverson (2018), Artificial intelligence and the modern productivity par-adox: A clash of expectations and statistics, in: Agarwal, A., J. S. Gans and A. Goldfarb (Eds.), The Eco-nomics of Artificial Intelligence: An Agenda, National Bureau of Economic Research, Cambridge, MA, 23–57.
Buera, F.J. and E. Oberfield (2016), The global diffusion of ideas, NBER Working Paper 21844, National Bureau of Economic Research, Cambridge, MA.
Burda, M.C. (2016), The German labor market miracle, 2003-2015: An assessment, SFB 649 Discussi-on Paper 2016–005, Humboldt-Universität zu Berlin.
Calvino, F., C. Criscuolo and R. Verlhac (2019), Declining business dynamism: A progress report, Pro-gress Report DSTI/CIIE(2019)8, Organisation for Economic Co-operation and Development, Paris.
Carlstrom, C.T. and T.S. Fuerst (1997), Agency costs, net worth, and business fluctuations: A computable general equilibrium analysis, American Economic Review 87 (5), 893–910.
Chari, V.V. and H. Hopenhayn (1991), Vintage human capital, growth, and the diffusion of new technolo-gy, Journal of Political Economy 99 (6), 1142–1165.
Coenen, G., P. McAdam and R. Straub (2008), Tax reform and labour-market performance in the euro area: A simulation-based analysis using the New Area-Wide Model, Journal of Economic Dynamics and Control 32 (8), 2543–2583.
Colantone, I. and L. Sleuwaegen (2010), International trade, exit and entry: A cross-country and industry analysis, Journal of International Business Studies 41 (7), 1240–1257.
Comin, D. and M. Gertler (2006), Medium-term business cycles, American Economic Review 96 (3), 523–551.
Comin, D. and B. Hobijn (2010), An exploration of technology diffusion, American Economic Review 100 (5), 2031–2059.
Conseil National de Productivité (2019), First report - Productivity and competitiveness: Where does France stand in the Euro zone?, Paris.
Constantinescu, C., A. Mattoo and M. Ruta (2019), Does vertical specialisation increase productivity?, World Economy 42 (8), 2385–2402.
Corrado, C., P. Lengermann, E.J. Bartelsman and J.J. Beaulieu (2007), Sectoral productivity in the United States: Recent developments and the role of IT, German Economic Review 8 (2), 188–210.
Council of the European Union (2016), Empfehlung des Rates zur Einrichtung nationaler Ausschüsse für Produktivität, 2016/C 349/01, Brussels, 20 September.
Cowen, T. (2011), The great stagnation: How America ate all the low-hanging fruit of modern history, got sick, and will (eventually) feel better, Penguin Books, London.
Davis, S.J. and J. Haltiwanger (2014), Labor market fluidity and economic performance, NBER Working Paper 20479, National Bureau of Economic Research, Cambridge, MA.
De Loecker, J. (2013), Detecting learning by exporting, American Economic Journal: Microeconomics 5 (3), 1–21.
De Loecker, J. and J. Eeckhout (2017), The rise of market power and the macroeconomic implications, NBER Working Paper 23687, National Bureau of Economic Research, Cambridge, MA.
Decker, R.A., J. Haltiwanger, R.S. Jarmin and J. Miranda (2018), Changing business dynamism and productivity: Shocks vs. responsiveness, NBER Working Paper 24236, National Bureau of Economic Re-search, Cambridge, MA.
Decker, R.A., J. Haltiwanger, R.S. Jarmin and J. Miranda (2017), Declining dynamism, allocative efficien-cy, and the productivity slowdown, American Economic Review 107 (5), 322–326.
Decker, R.A., J. Haltiwanger, R.S. Jarmin and J. Miranda (2014), The role of entrepreneurship in US job creation and economic dynamism, Journal of Economic Perspectives 28 (3), 3–24.
Deutsche Bundesbank (2019a), Fortschritte im Konvergenzprozess der mittel- und osteuropäischen EU-Mitgliedsländer, Monatsbericht August 2019, Frankfurt am Main, 16–18.
Deutsche Bundesbank (2019b), Strukturreformen im Euroraum, Monatsbericht Oktober 2019, Frankfurt am Main, 83–106.
Deutsche Bundesbank (2018), Die deutsche Auslandsposition: Höhe, Rentabilität und Risiken der grenzüberschreitenden Vermögenswerte, Monatsbericht Dezember 2018, Frankfurt am Main, 47–68.
Productivity: Improving conditions for growth – Chapter 2
Annual Report 2019/20 – German Council of Economic Experts 133
Dustmann, C., B. Fitzenberger, U. Schönberg and A. Spitz-Oener (2014), From sick man of Europe to economic superstar: Germany’s resurgent economy, Journal of Economic Perspectives 28 (1), 167–188.
ECB (2016), Business investment developments in the euro area since the crisis, Economic Bulletin 7/16, European Central Bank, Frankfurt am Main, 48–70.
Elstner, S., L.P. Feld and C.M. Schmidt (2018), The German productivity paradox: Facts and explana-tions, CESifo Working Paper 7231, Munich.
Engbom, N. (2019), Firm and worker dynamics in an aging labor market, Working Paper 756, Federal Reserve Bank of Minneapolis.
European Commission (2019), Country report Germany 2019: Including an in-depth review on the pre-vention and correction of macroeconomic imbalances, Commission Staff Working Document SWD(2019) 1004 final, Brussels.
European Commission (2016), The macroeconomic imbalance procedure – Rationale, process, applica-tion: A compendium, Institutional Paper 039, Directorate-General for Economic and Financial Affairs, Luxembourg.
Federal Statistical Office (2017), Deutscher Aussenhandel: Export und Import im Zeichen der Globalisie-rung, Wiesbaden.
Feld, L.P. and M.R. Savioz (1997), Direct democracy matters for economic performance: An empirical in-vestigation, Kyklos - International Review for Social Sciences 50 (4), 507–538.
Fernández-Villaverde, J., L. Garicano and T. Santos (2013), Political credit cycles: The case of the euro-zone, Journal of Economic Perspectives 27 (3), 145–166.
Fiedler, S. et al. (2018), Direktinvestitionen im Ausland – Effekte auf die deutsche Leistungsbilanz und Spillovers in den Empfängerländern, Kieler Beiträge zur Wirtschaftspolitik No. 16, Kiel Institute for the World Economy (IfW).
Foster, L., J. Haltiwanger and C.J. Krizan (2006), Market selection, reallocation, and restructuring in the U.S. retail trade sector in the 1990s, Review of Economics and Statistics 88 (4), 748–758.
Foster, L., J. Haltiwanger and C.J. Krizan (2001), Aggregate productivity growth: Lessons from microeco-nomic evidence, in: Hulten, C. R., E. R. Dean and M. J. Harper (Eds.), New developments in productivity analysis, University of Chicago Press, 303–372.
Foster, L., J. Haltiwanger and C. Syverson (2008), Reallocation, firm turnover, and efficiency: Selection on productivity or profitability?, American Economic Review 98 (1), 394–425.
Gadatsch, N., K. Hauzenberger and N. Stähler (2015), German and the rest of euro area fiscal policy during the crisis, Discussion Paper 05/2015, Deutsche Bundesbank, Frankfurt am Main.
Galí, J. (1999), Technology, employment, and the business cycle: Do technology shocks explain aggre-gate fluctuations?, American Economic Review 89 (1), 249–271.
Gehrke, B., W. Lechthaler and C. Merkl (2019), The German labor market during the Great Recession: Shocks and institutions, Economic Modelling 78, 192–208.
Giersch, H. (1984), The age of Schumpeter, American Economic Review 74 (2), 103–109.
Giersch, H. (1981), Wie Wissen und Wirtschaft wachsen, List Forum für Wirtschafts- und Finanzpolitik 11 (3), 143–162.
Gilchrist, S. and B. Mojon (2018), Credit risk in the euro area, Economic Journal 128 (608), 118–158.
Giorcelli, M. (2019), The long-term effects of management and technology transfers, American Econom-ic Review 109 (1), 121–152.
Goldschlag, N. and A. Tabarrok (2018), Is regulation to blame for the decline in American entrepreneur-ship?, Economic Policy 33 (93), 5–44.
Gopinath, G., Ş. Kalemli-Özcan, L. Karabarbounis and C. Villegas-Sanchez (2017), Capital allocation and productivity in South Europe, Quarterly Journal of Economics 132 (4), 1915–1967.
Greenwood, J., Z. Hercowitz and P. Krusell (1997), Long-run implications of investment-specific techno-logical change, American Economic Review 87 (3), 342–362.
Grossman, G.M. and E. Helpman (1991), Quality ladders in the theory of growth, Review of Economic Studies 58 (1), 43–61.
Grossman, G.M. and E. Rossi-Hansberg (2008), Trading tasks: A simple theory of offshoring, American Economic Review 98 (5), 1978–1997.

Chapter 2 – Productivity: Improving conditions for growth
134 German Council of Economic Experts – Annual Report 2019/20
Gutiérrez, G. and T. Philippon (2018), How EU markets became more competitive than US markets: A study of institutional drift, NBER Working Paper 24700, National Bureau of Economic Research, Cam-bridge, MA.
Haltiwanger, J., R. Jarmin and J. Miranda (2013), Who creates jobs? Small versus large versus young, Review of Economics and Statistics 95 (2), 347–361.
Hanushek, E.A. and L. Wößmann (2010), Education and economic growth, in: Peterson, P., E. Baker and B. McGaw (Eds.), International Encyclopedia of Education, Vol. 2, Elsevier, Oxford, 245–252.
Haskel, J. and S. Westlake (2017), Capitalism without capital: The rise of the intangible economy, Princeton University Press.
Helmstädter, E. (2001), Wissensteilung: Thünen-Vorlesung bei der Jahrestagung 2000 des Vereins für Socialpolitik, Berlin 20. September 2000, Perspektiven der Wirtschaftspolitik 2 (4), 445–465.
Helmstädter, E. (2000), Arbeitsteilung und Wissensteilung – Zur Institutionenökonomik der Wissensge-sellschaft, in: Nutzinger, H. G. and M. Held (Eds.), Geteilte Arbeit und ganzer Mensch: Perspektiven der Arbeitsgesellschaft, Campus Verlag, Frankfurt am Main, 118–141.
Hopenhayn, H. and R. Rogerson (1993), Job turnover and policy evaluation: A general equilibrium analy-sis, Journal of Political Economy 101 (5), 915–938.
Hsieh, C.-T. and P.J. Klenow (2014), The life cycle of plants in India and Mexico, Quarterly Journal of Economics 129 (3), 1035–1084.
Hsieh, C.-T. and P.J. Klenow (2009), Misallocation and manufacturing TFP in China and India, Quarterly Journal of Economics 124 (4), 1403–1448.
Hünnekes, F., M. Schularick and C. Trebesch (2019a), Exportweltmeister: The low returns on Germany’s capital exports, CEPR Discussion Paper DP13863, Centre for Economic Policy Research, London.
Hünnekes, F., M. Schularick and C. Trebesch (2019b), Gastbeitrag: Kapitalexport ist ein Milliardengrab, FAZ, 5 September.
IMF (2019), External sector report: The dynamics of external adjustment, July 2019, International Mone-tary Fund, Washington, DC.
Johnson, J.E. and M.M. Kleiner (2017), Is occupational licensing a barrier to interstate migration?, NBER Working Paper 24107, National Bureau of Economic Research, Cambridge, MA.
Jorgenson, D.W. and K.J. Stiroh (2000), Raising the speed limit: U.S. economic growth in the information age, Brookings Papers on Economic Activity 31 (1), 125–236.
Justiniano, A., G.E. Primiceri and A. Tambalotti (2011), Investment shocks and the relative price of in-vestment, Review of Economic Dynamics 14 (1), 101–121.
Karahan, F., B. Pugsley and A. Şahin (2019), Demographic origins of the startup deficit, NBER Working Paper 25874, National Bureau of Economic Research, Cambridge, MA.
Kim, I.-M. and P. Loungani (1992), The role of energy in real business cycle models, Journal of Monetary Economics 29 (2), 173–189.
King, R.G. and R. Levine (1993), Finance and growth: Schumpeter might be right, Quarterly Journal of Economics 108 (3), 717–737.
King, R.G. and S.T. Rebelo (1999), Resuscitating real business cycles, in: Taylor, J. B. and M. Woodford (Eds.), Handbook of Macroeconomics, Vol. 1, Elsevier, Amsterdam, 927–1007.
Kollmann, R., M. Ratto, W. Roeger, J. in ’t Veld and L. Vogel (2015), What drives the German current ac-count? And how does it affect other EU member states?, Economic Policy 30 (81), 47–93.
Krusell, P., L.E. Ohanian, J.-V. Rìos-Rull and G.L. Violante (2000), Capital‐skill complementarity and ine-quality: A macroeconomic analysis, Econometrica 68 (5), 1029–1054.
Kydland, F.E. and E.C. Prescott (1982), Time to build and aggregate fluctuations, Econometrica 50 (6), 1345–1370.
Levine, R. (2005), Finance and growth: Theory and evidence, in: Aghion, P. and S. N. Durlauf (Eds.), Handbook of Economic Growth, Vol. 1A, Elsevier, Amsterdam, 865–934.
Liu, E., A. Mian and A. Sufi (2019), Low interest rates, market power, and productivity growth, NBER Working Paper 25505, National Bureau of Economic Research, Cambridge, MA.
Long, J.B. and C.I. Plosser (1983), Real business cycles, Journal of Political Economy 91 (1), 39–69.

Productivity: Improving conditions for growth – Chapter 2
Annual Report 2019/20 – German Council of Economic Experts 135
Lucas, R.E. (1988), On the mechanics of economic development, Journal of Monetary Economics 22 (1), 3–42.
Meyer, J. (2011), Workforce age and technology adoption in small and medium-sized service firms, Small Business Economics 37 (3), 305–324.
Monopolies Commission (2018), Wettbewerb 2018, 22. Hauptgutachten, Bonn.
OECD (2019a), Measuring the digital transformation: A roadmap for the future, OECD Publishing, Orga-nisation for Economic Co-operation and Development, Paris.
OECD (2019b), Education at a glance 2019: OECD indicators, OECD Publishing, Organisation for Eco-nomic Co-operation and Development, Paris.
OECD (2013), OECD Employment Outlook 2013, OECD Publishing, Organisation for Economic Co-operation and Development, Paris.
Oh, S.-Y., Y. Park and S. Bowles (2012), Veblen effects, political representation, and the reduction in working time over the 20th century, Journal of Economic Behavior & Organization 83 (2), 218–242.
Rajan, R.G. and L. Zingales (1998), Financial dependence and growth, American Economic Review 88 (3), 559–586.
Rammer, C. and A. Spielkamp (2015), Hidden champions – driven by innovation: Empirische Befunde auf Basis des Mannheimer Innovationspanels, ZEW-Dokumentation 15–03, Centre for European Eco-nomic Research, Mannheim.
Restuccia, D. and R. Rogerson (2017), The causes and costs of misallocation, Journal of Economic Per-spectives 31 (3), 151–174.
de Ridder, M. (2017), Investment in productivity and the long-run effect of financial crisis on output, CESifo Working Paper 6243, Munich.
Romer, P.M. (1994), The origins of endogenous growth, Journal of Economic Perspectives 8 (1), 3–22.
Romer, P.M. (1986), Increasing returns and long-run growth, Journal of Political Economy 94 (5), 1002–1037.
Romp, W. and J. de Haan (2007), Public capital and economic growth: A critical survey, Perspektiven der Wirtschaftspolitik 8 (SI), 6–52.
Rossi-Hansberg, E., P.-D. Sarte and N. Trachter (2019), Diverging trends in national and local concentra-tion, Working Paper 18–15R, Federal Reserve Bank of Richmond.
Sampson, T. (2015), Dynamic selection: An idea flows theory of entry, trade, and growth, Quarterly Jour-nal of Economics 131 (1), 315–380.
Schivardi, F. and T. Schmitz (2019), The IT revolution and southern Europe’s two lost decades, Journal of the European Economic Association, in press, https://doi.org/10.1093/jeea/jvz048.
Schmucker, A., A. Ganzer, J. Stegmaier and S. Wolter (2018), Betriebs-Historik-Panel 1975-2017, FDZ-Datenreport 9/2018, Research Data Centre of the Federal Employment Agency at the Institute for Employment Research, Nuremberg.
Serafinelli, M. (2019), “Good” firms, worker flows, and local productivity, Journal of Labor Economics 37 (3), 747–792.
Simon, H. (2017), Hidden Champions – Ein Kernelement des deutschen Mittelstandes, Speech, Stutt-gart, 21 February.
Smets, F. and R. Wouters (2003), An estimated dynamic stochastic general equilibrium model of the eu-ro area, Journal of the European Economic Association 1 (5), 1123–1175.
Solow, R.M. (1956), A contribution to the theory of economic growth, Quarterly Journal of Economics 70 (1), 65–94.
Strauss, H. and B. Samkharadze (2011), ICT capital and productivity growth, EIB Papers 16 (2), Euro-pean Investment Bank, Luxembourg, 8–28.
Strobel, T. (2015), Schwache Investitionen und Tertiärisierung der Wirtschaftsstruktur in Deutschland, ifo Schnelldienst 1/2015, 43–49.
Swan, T.W. (1956), Economic growth and capital accumulation, Economic Record 32 (2), 334–361.
Syverson, C. (2017), Challenges to mismeasurement explanations for the US productivity slowdown, Journal of Economic Perspectives 31 (2), 165–186.

Chapter 2 – Productivity: Improving conditions for growth
136 German Council of Economic Experts – Annual Report 2019/20
Syverson, C. (2011), What determines productivity?, Journal of Economic Literature 49 (2), 326–365.
The White House (2015), Occupational licensing: A framework for policymakers, Washington, DC.
Weche, J.P. and A. Wambach (2018), The fall and rise of market power in Europe, ZEW Discussion Paper 18–003, Centre for European Economic Research, Mannheim.
Weinberg, B.A. (2004), Experience and technology adoption, IZA Discussion Paper 1051, Institute of La-bor Economics, Bonn.
Weiske, S. (2019), From the sick man to Europe’s growth engine, and back? – A model-based investiga-tion, Working paper, German Council of Economic Experts, Wiesbaden, in press.
World Bank (2019), Doing Business 2020: Comparing business regulation in 190 economies, World Bank Publications.