chapter 2 functions and linear functions · chap ter 2 functions and linear functions section 2.1...
TRANSCRIPT
Intermediate Algebra for College Students 7th Edition Blitzer SOLUTIONS
MANUAL
Full download at:
https://testbankreal.com/download/intermediate-algebra-for-college-students-7th-
edition-blitzer-solutions-manual/
Intermediate Algebra for College Students 7th Edition Blitzer TEST BANK
Full download at:
https://testbankreal.com/download/intermediate-algebra-for-college-students-7th-
edition-blitzer-test-bank/
Chapter 2 Functions and Linear Functions
2.1 Check Points
1. The domain is the set of all first components. The
domain is {0, 10, 20, 30, 40}.
The range is the set of all second components. The
range is {9.1, 6.7, 10.7, 13.2, 21.2}.
2. a. The relation is not a function because an
element, 5, in the domain corresponds to two
elements in the range.
b. The relation is a function.
3. f, x
4. r, 2
2.1 Exercise Set
1. The relation is a function.
The domain is {1, 3, 5}.
The range is {2, 4, 5}.
2. The relation is a function.
3. a.
b.
c.
d.
f ( x) 4 x 5
f (6) 4(6) 5
f (6) 29
g ( x) 3x
2 10
g (5) 3(5)2
10
g (5) 65
h(r) r
2 7r 2
h(4) (4)2
7(4) 2
h(4) 46
F ( x) 6 x 9
F (a h) 6(a h) 9
F (a h) 6a 6h 9
The domain is {4,6,8}.
The range is {5,7,8}.
3. The relation is not a function.
The domain is {3, 4}.
The range is {4, 5}.
4. The relation is not a function.
The domain is {5, 6}.
The range is {6, 7}.
5. The relation is a function.
The domain is {-3, -2, -1, 0}.
The range is {-3, -2, -1, 0}.
6. The relation is a function. The domain is {–7, –5, –3, 0}.
The range is {–7, –5, –3, 0}.
7. The relation is not a function.
4. a. Every element in the domain corresponds to
exactly one element in the range.
b. The domain is {0, 1, 2, 3, 4}.
The range is {3, 0, 1, 2}.
The domain is {1}.
The range is {4, 5,
6}.
8. The relation is a function.
The domain is {4, 5, 6}.
The range is {1}.
c. g (1) 0
d. g (3) 2
e. x 0 and x 4.
9. a.
b.
c.
f (0) 0 1 1
f (5) 5 1 6
f (8) 8 1 7
2.1 Concept and Vocabulary Check
1. relation; domain; range
2. function
d. f (2a) 2a 1
e. f (a 2) a 2 1
a 2 1 a 3

Chapter 2 Functions and Linear Functions Section 2.1 Introduction to Functions
10. f ( x) x 3 d. h(3) 33
2 5 39 5
a. f (0) 0 3 3
b. f (5) 5 3 8
c. f (8) 8 3 5
27 5 32
e. h(4b) 34b2
5 316b2 5
48b2
5
2
d. f (2a) 2a 3 14. h( x) 2 x 4
e.
11. a.
b.
c.
f (a 2) a 2 3
a 2 3 a 5
g (0) 30 2 0 2 2 g 5 35 2
15 2 17
g 2
3 2
2 2 2 0
a. h 0 2 02
4 2 0 4
0 4 4
b. h 1 2 12
4 2 1 4
2 4 2
c. h 5 2 52
4 2 25 4
50 4 46
3 3 d. h 3 2 32
4 2 9 4
d. g 4b 34b 2 12b 2 18 4 14
e. g b 4 3b 4 2 e. h 5b 2 5b
2 4 2 25b
2 4
3b 12 2 3b 10 50b2
4
12. g ( x) 4 x 3 15. a. f (0) 2 02
30 1
0 0 1 1a. g 0 4 0 3 0 3 3
b. g 5 4 5 3 20 3 23
c. g 3
4 3
3 3 3 0
b. f (3) 2 32
33 1
2 9 9 1
18 9 1 26
4 4 c. f (4) 2 4
2 34 1
d. g 5b 4 5b 3 20b 3
e. g (b 5) 4 b 5 3
4b 20 3 4b 17
2 16 12 1
32 12 1 19
d. f (b) 2 b2
3b 1
2
13. a. h(0) 302
5 30 5 2b 3b 1
0 5 5
b. h(1) 312
5 31 5
3 5 8
c. h(4) 342
5 316 5
48 5 53

Chapter 2 Functions and Linear Functions Section 2.1 Introduction to Functions
e. f (5a ) 2 5a 2
35a 1
2 25a 2 15a 1
50a 2
15a 1
Chapter 2 Functions and Linear Functions Section 2.1 Introduction to Functions
16. f ( x) 3x2
4 x 2
a. f 0 302
4 0 2
30 0 2
0 0 2 2
b. f 3 332
4 3 2
39 12 2
27 12 2 37
c. f 5 352
4 5 2
325 20 2
75 20 2 53
d. f b 3b2
4 b 2
3b2
4b 2
e. f 5a 35a 2
4 5a 2
325a 2 20a 2
75a 2
20a 2
17. a. f (0) (0)3
(0)2
(0) 7
7
b. f (2) (2)3
(2)2
(2) 7
7
c. f (2) (2)3
(2)2
(2) 7
13
d. f (1) f (1) (1)3
(1)2
(1) 7 (1)3
(1)2
(1) 7
4 8
12
18. a. f (0) (0)3
(0)2
(0) 10
10
b. f (2) (2)3
(2)2
(2) 10
4
c. f (2) (2)3
(2)2
(2) 10
16

Chapter 2 Functions and Linear Functions Section 2.1 Introduction to Functions
d.
19. a.
b.
f (1) f (1) (1)3
(1)2
(1) 10 (1)3
(1)2
(1) 10
7 11
18
203 0 3 f (0)
0 4 0 4
3
3
4 4
233 6 3 f (3)
3 4 3 4
3 3 1
2 43 c. f (4)
4 4
11
11
8 8
2 53 d. f (5)
5 4
13
13
9 9
8 3
8
10 3
9
e. f (a h)
2 a h 3
a h 4
2a 2h 3
a h 4
20.
f. Four must be excluded from the domain, because four would make the denominator zero. Division by zero is
undefined.
f ( x) 3x 1
x 5
301 0 1 1 1 a. f 0
0 5 5 5 5
331 9 1 8 b. f 3 4
3 5 2 2
3 31 9 1 c. f 3
3 5 8
10
5
8 4
3101 30 1 29 d. f 10
10 5 5 5
Chapter 2 Functions and Linear Functions Section 2.1 Introduction to Functions
3 a h 1 e. f a h
a h 5
3a 3h 1
29. f x f x
x 3
x 5 x3
x 5
3 3
a h 5 x x 5 x x 5
f. Five must be excluded from the domain, because 5 would make the denominator zero. Division
by zero is undefined.
30.
2 x3
2 x
f x f x
x 2
3 x 7 x2 3x 7
21. a.
b.
f (2) 6
f (2) 12
x2
3x 7 x2
3x 7
6 x
c.
22. a.
b.
c.
23. a.
b.
c.
24. a.
b.
c.
25.
x 0 f (3) 8 f
(3) 16 x 0
h(2) 2
h(1) 1
x 1 and x 1 h(2) 2
h(1) 1
x 1 and x 1
g 1 31 5 3 5 2
31. a.
b.
c.
d.
32. a.
b.
c.
d.
f 2 32 5 6 5 1 f 0 4 0 7 0 7 7 f 3 4 3 7 12 7 19 f 100 f 100 3100 5 4 100 7
300 5 400 7 112
f 3 6 3 1 18 1 19 f 0 7 0 3 0 3 3 f 4 7 4 3 28 3 31 f 100 f 100 6 100 1 7 100 3
26.
27.
f g 1 f 2 22
2 4
4 2 4 10
g 1 31 5 3 5 8
f g 1 f 8 82
8 4
64 8 4 76
3 1 62
6 6 4
600 1 700 3
100 2 102
33. a. {(Iceland, 9.7), (Finland, 9.6), (New Zealand, 9.6),
(Denmark, 9.5)}
b. Yes, the relation is a function because each
country in the domain corresponds to exactly
one corruption rating in the range.
c. {(9.7, Iceland), (9.6, Finland), (9.6, New Zealand),
3 1 36 1 4
4 36 4 2 36 4 38
(9.5, Denmark)}
d. No, the relation is not a function because 9.6 in
the domain corresponds to two countries in the
28. 4 1 32
3 3 6
4 1 9 3 3 6
3 9 1 6
3 9 6 6 6 0
Chapter 2 Functions and Linear Functions Section 2.1 Introduction to Functions
rang
e,
Finl
and
and
Ne
w
Zeal
and.
Chapter 2 Functions and Linear Functions Section 2.1 Introduction to Functions
2
2 2
2
34. a. {(Bangladesh, 1.7), (Chad, 1.7), (Haiti, 1.8),
(Myanmar, 1.8)} 51. It is given that
and f (1) 3 .
f ( x y ) f ( x) f ( y)
b. Yes, the relation is a function because each
country in the domain corresponds to exactly
one corruption rating in the range.
c. {(1.7, Bangladesh), (1.7, Chad), (1.8, Haiti),
(1.8, Myanmar)}
d. No, the relation is not a function because 1.7 in
the domain corresponds to two countries in the
To find f (2) , rewrite 2 as 1 + 1.
f (2) f (1 1) f (1) f (1)
3 3 6
Similarly: f (3) f (2 1) f (2) f (1)
6 3 9
f (4) f (3 1) f (3) f (1)
9 3 12
range, Bangladesh and Chad. While f ( x y ) f ( x) f ( y) is true for this
35. – 38. Answers will vary.
39. makes sense
function, it is not true for all functions. It is not true
for f x x2 , for example.
2
40. makes sense
41. makes sense
52. 24 4 2 5 2 6
24 4 2 3 6 2
42. does not make sense; Explanations will vary.
Sample explanation: The range is the chance of
divorce.
43. false; Changes to make the statement true will vary.
24 4 1 6
24 4 1 6
6 1 6 6 6 0
A sample change is: All functions are relations. 3x2 y2 2 3x y5 y10
53.
44. false; Changes to make the statement true will vary.
A sample change is: Functions can have ordered
pairs with the same second component. It is the
y3
x
y5
3x2
3x
9 x4
first component that cannot be duplicated. 54. 4 3 5
45. true 15 x
15 3x
4
3 546. true
x 3x
15 15 15 4
47. true
48. false;
g (4) f (4)
(1) (1)
2
3 5
5x 33x 60
5x 9 x 60
5x 9 x 9 x 9 x 60
4 x 60
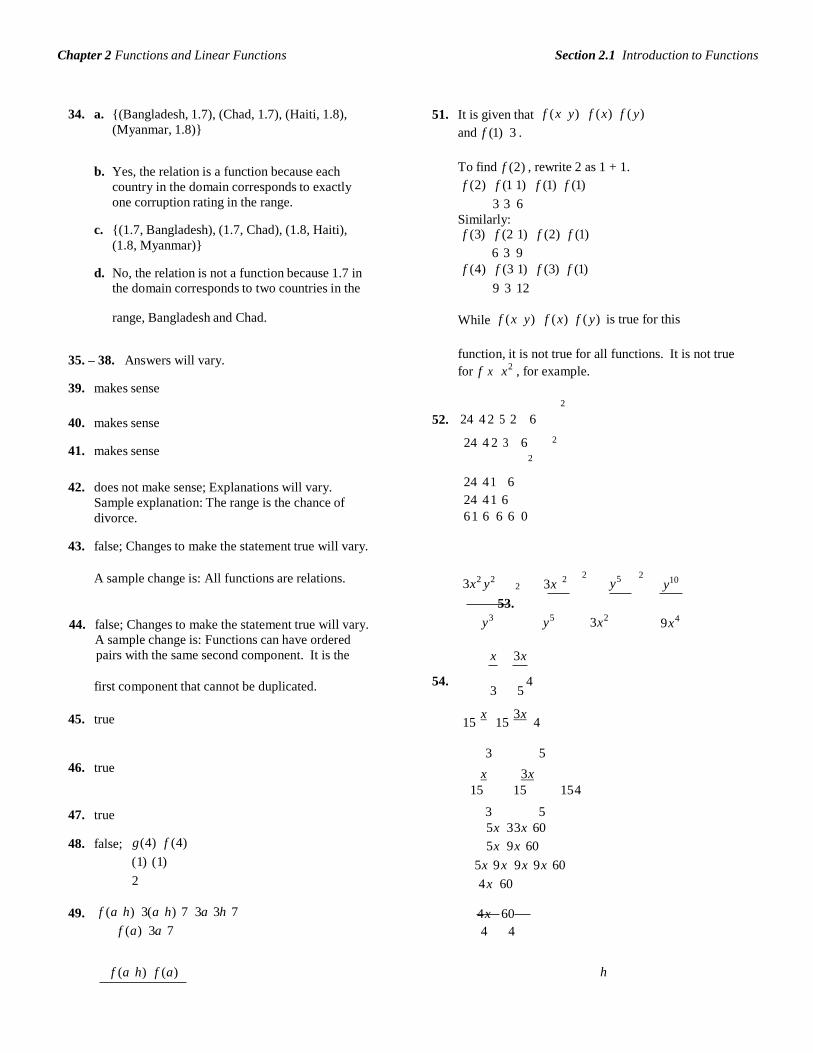
49. f (a h) 3(a h) 7 3a 3h 7
f (a) 3a 7
4 x 60
4 4
f (a h) f (a) h
Chapter 2 Functions and Linear Functions Section 2.1 Introduction to Functions
3a 3h 73a 7
h
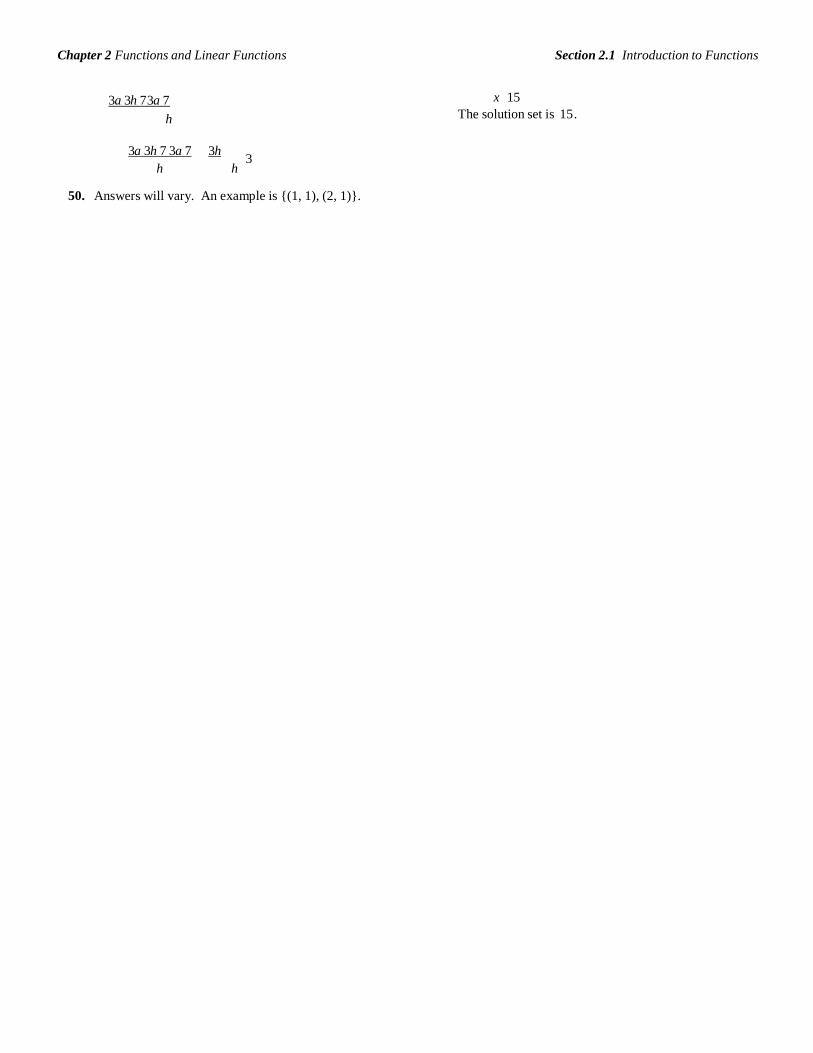
x 15
The solution set is 15 .
3a 3h 7 3a 7 3h 3
h h
50. Answers will vary. An example is {(1, 1), (2, 1)}.
Section 2.2 Graphs of Functions Chapter 2 Functions and Linear Functions
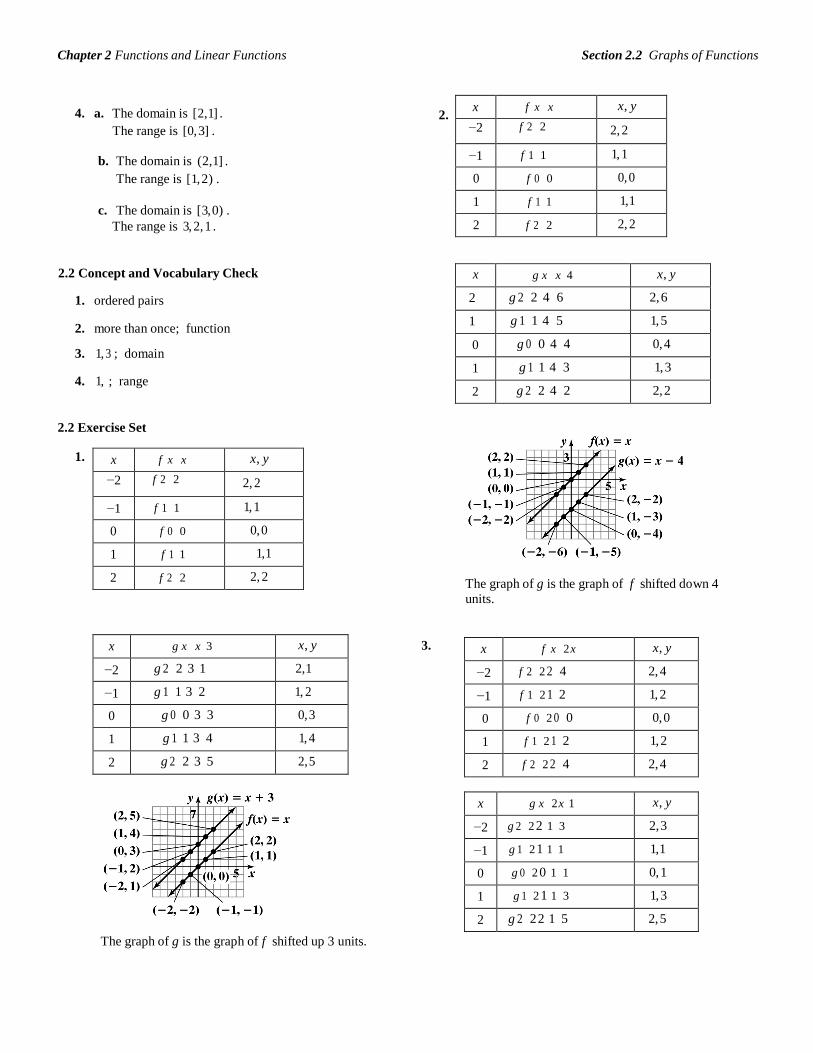
x f x 2 x x, y
−2 f 2 2(2) 4 2, 4
−1 f 1 2(1) 2 1, 2
0 f 0 2(0) 0 0, 0
1 f 1 2(1) 2 1, 2
2 f 2 2(2) 4 2, 4
x g x 2 x 3 ( x, y)
2 g 2 2(2) 3 7 2, 71 g 1 2(1) 3 5 1, 50 g 0 2(0) 3 3 0, 31 g 1 2(1) 3 1 1, 12
x f x 2 x 4 x, y
−2 f 2 2(2) 4 0 2, 0
−1 f 1 2(1) 4 2 1, 2
0 f 0 2(0) 4 4 0, 4
1 f 1 2(1) 4 6 1, 6
2 f 2 2(2) 4 8 2, 8
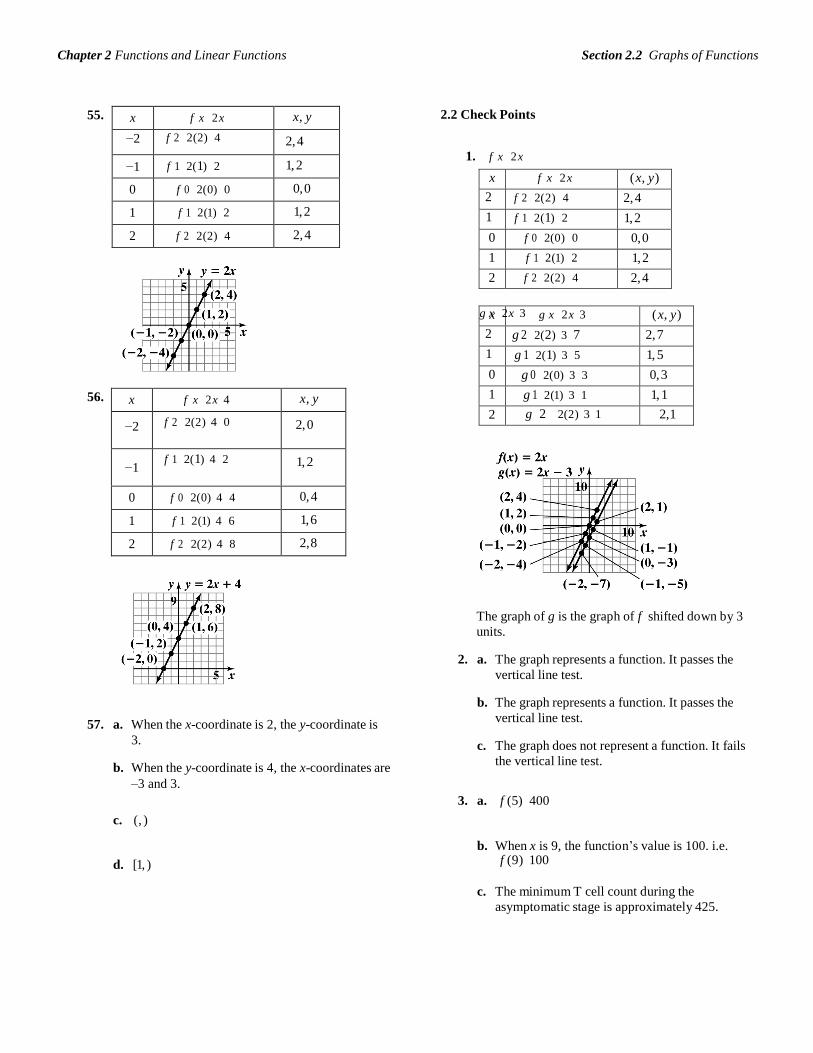
55. 2.2 Check Points
1. f x 2 x
x f x 2 x ( x, y)
2 f 2 2(2) 4 2, 41 f 1 2(1) 2 1, 20 f 0 2(0) 0 0, 01 f 1 2(1) 2 1, 22 f 2 2(2) 4 2, 4
g x 2 x 3
56. g 2 2(2) 3 1
2,1
57. a. When the x-coordinate is 2, the y-coordinate is
3.
b. When the y-coordinate is 4, the x-coordinates are
–3 and 3.
The graph of g is the graph of f shifted down by 3
units.
2. a. The graph represents a function. It passes the
vertical line test.
b. The graph represents a function. It passes the
vertical line test.
c. The graph does not represent a function. It fails
the vertical line test.
c. (, )
3. a. f (5) 400
d. [1, )
b. When x is 9, the function’s value is 100. i.e. f (9) 100
c. The minimum T cell count during the
asymptomatic stage is approximately 425.
Section 2.2 Graphs of Functions Chapter 2 Functions and Linear Functions
x f x x x, y
−2 f 2 2 2, 2
−1 f 1 1 1, 1
0 f 0 0 0, 0
1 f 1 1 1,1
2 f 2 2 2, 2
x f x x x, y
−2 f 2 2 2, 2
−1 f 1 1 1, 1
0 f 0 0 0, 0
1 f 1 1 1,1
2 f 2 2 2, 2
x g x x 3 x, y
−2 g 2 2 3 1 2,1
−1 g 1 1 3 2 1, 2
0 g 0 0 3 3 0, 3
1 g 1 1 3 4 1, 4
2 g 2 2 3 5 2, 5
x f x 2 x x, y
−2 f 2 2 2 4 2, 4
−1 f 1 2 1 2 1, 2
0 f 0 2 0 0 0, 0
1 f 1 2 1 2 1, 2
2 f 2 2 2 4 2, 4
x g x 2 x 1 x, y
−2 g 2 2 2 1 3 2, 3
−1 g 1 2 1 1 1 1,1
0 g 0 2 0 1 1 0, 1
1 g 1 2 1 1 3 1, 3
2 g 2 2 2 1 5 2, 5
4. a. The domain is [2,1] .
The range is [0, 3] .
b. The domain is (2,1] .
The range is [1, 2) .
c. The domain is [3, 0) .
The range is 3, 2, 1 .
2.2 Concept and Vocabulary Check
1. ordered pairs
2. more than once; function
3. 1, 3 ; domain
4. 1, ; range
2.2 Exercise Set
1.
2.
x g x x 4 x, y
2 g 2 2 4 6 2, 6
1 g 1 1 4 5 1, 5
0 g 0 0 4 4 0, 4
1 g 1 1 4 3 1, 3
2 g 2 2 4 2 2, 2
The graph of g is the graph of f shifted down 4
units.
3.
The graph of g is the graph of f shifted up 3 units.
Section 2.2 Graphs of Functions Chapter 2 Functions and Linear Functions
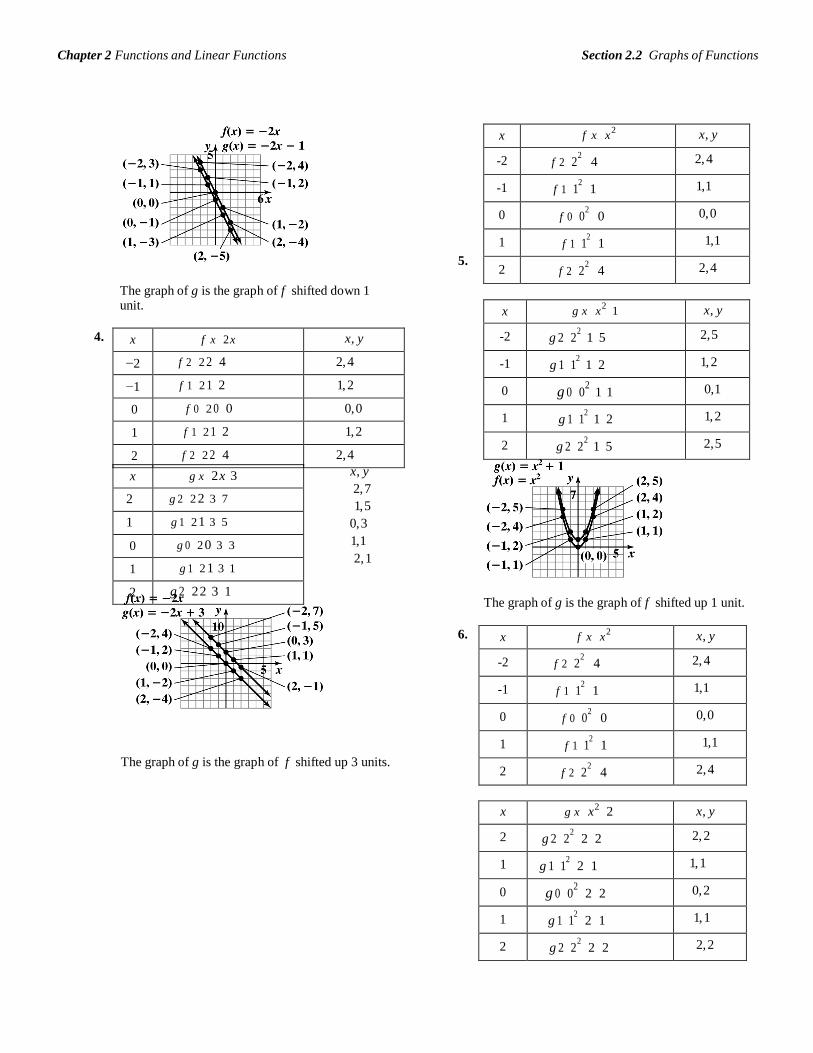
x f x x 2 x, y
-2 f 2 22
4 2, 4
-1 f 1 12
1 1,1
0 f 0 02
0 0, 0
1 f 1 12
1 1,1
2 f 2 22
4 2, 4
x g x x2 1 x, y
-2 g 2 22
1 5 2, 5
-1 g 1 12
1 2 1, 2
0 g 0 02
1 1 0,1
1 g 1 12
1 2 1, 2
2 g 2 22
1 5 2, 5
x f x 2 x x, y
−2 f 2 2 2 4 2, 4
−1 f 1 2 1 2 1, 2
0 f 0 2 0 0 0, 0
1 f 1 2 1 2 1, 2
2 f 2 2 2 4 2, 4
x g x 2 x 3
2 g 2 2 2 3 7
1 g 1 2 1 3 5
0 g 0 2 0 3 3
1 g 1 2 1 3 1
2 g 2 2 2 3 1
x f x x 2
x, y
-2 f 2 22
4 2, 4
-1 f 1 12
1 1,1
0 f 0 02
0 0, 0
1 f 1 12
1 1,1
2 f 2 22
4 2, 4
5.
The graph of g is the graph of f shifted down 1 unit.
4.
x, y 2, 71, 5
0, 31,12, 1
The graph of g is the graph of f shifted up 1 unit.
6.
The graph of g is the graph of f shifted up 3 units.
x g x x2
2 x, y
2 g 2 22
2 2 2, 2
1 g 1 12
2 1 1, 1
0 g 0 02
2 2 0, 2
1 g 1 12
2 1 1, 1
2 g 2 22
2 2 2, 2
Section 2.2 Graphs of Functions Chapter 2 Functions and Linear Functions
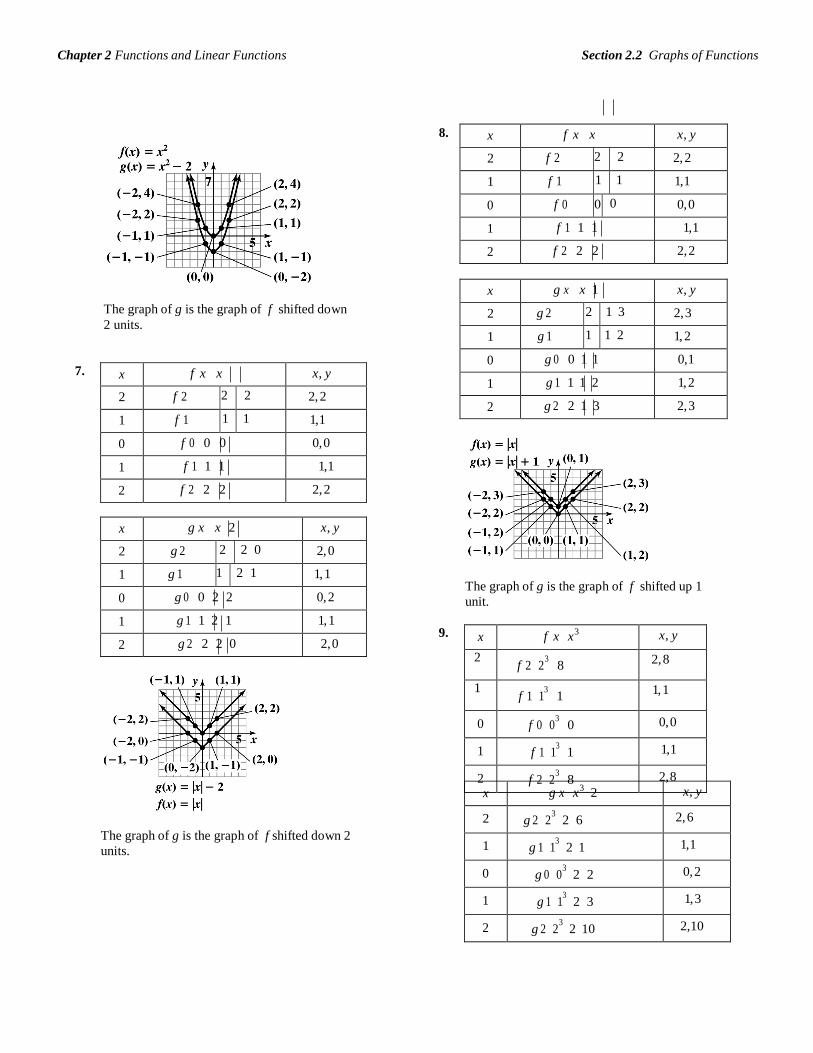
x f x x x, y
2 f 2 2 2 2, 2
1 f 1 1 1 1,1
0 f 0 0 0 0, 0
1 f 1 1 1 1,1
2 f 2 2 2 2, 2
x g x x 1 x, y
2 g 2 2 1 3 2, 3
1 g 1 1 1 2 1, 2
0 g 0 0 1 1 0,1
1 g 1 1 1 2 1, 2
2 g 2 2 1 3 2, 3
x f x x x, y
2 f 2 2 2 2, 2
1 f 1 1 1 1,1
0 f 0 0 0 0, 0
1 f 1 1 1 1,1
2 f 2 2 2 2, 2
x g x x 2 x, y
2 g 2 2 2 0 2, 0
1 g 1 1 2 1 1, 1
0 g 0 0 2 2 0, 2
1 g 1 1 2 1 1, 1
2 g 2 2 2 0 2, 0
x f x x3 x, y
2 f 2 2
3 8
2, 8
1 f 1 1
3 1
1, 1
0 f 0 03
0 0, 0
1 f 1 13
1 1,1
2 f 2 23
8 2, 8
x g x x3
2 x, y
2 g 2 23
2 6 2, 6
1 g 1 13
2 1 1,1
0 g 0 03
2 2 0, 2
1 g 1 13
2 3 1, 3
2 g 2 23
2 10 2,10
8.
The graph of g is the graph of f shifted down
2 units.
7.
The graph of g is the graph of f shifted up 1
unit.
9.
The graph of g is the graph of f shifted down 2
units.
Section 2.2 Graphs of Functions Chapter 2 Functions and Linear Functions
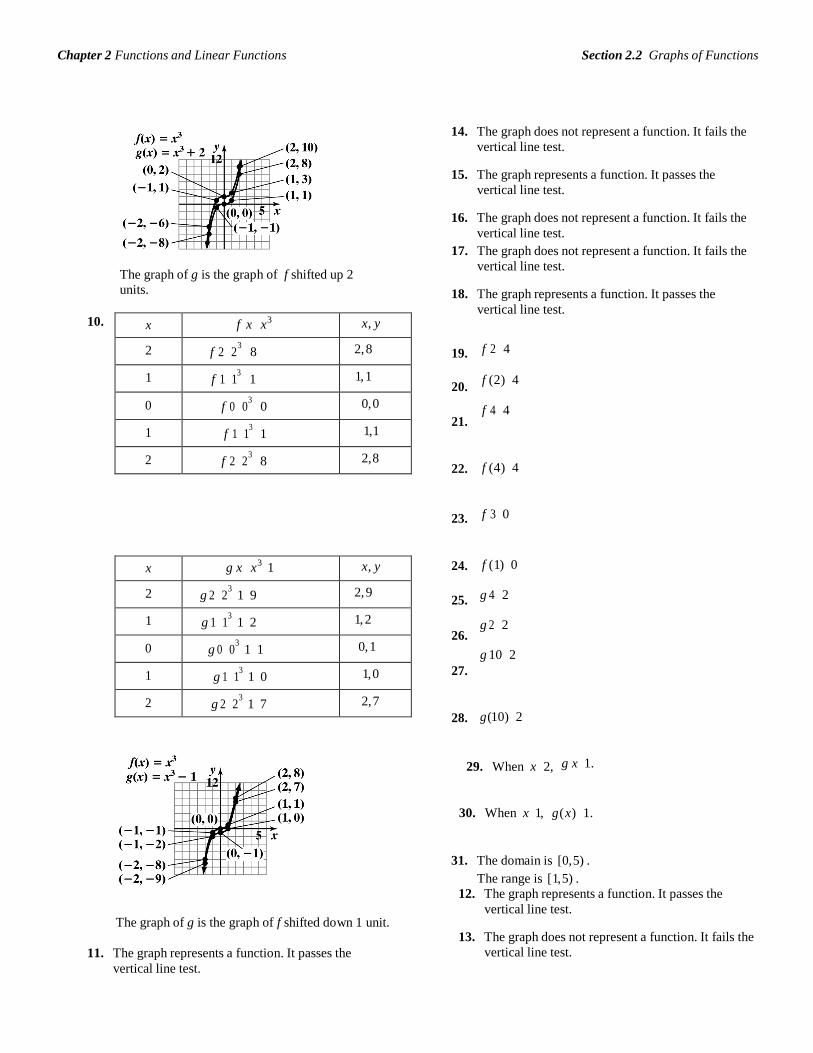
x f x x3 x, y
2 f 2 23
8 2, 8
1 f 1 13
1 1, 1
0 f 0 03
0 0, 0
1 f 1 13
1 1,1
2 f 2 23
8 2, 8
x g x x3 1 x, y
2 g 2 23
1 9 2, 9
1 g 1 13
1 2 1, 2
0 g 0 03
1 1 0, 1
1 g 1 13
1 0 1, 0
2 g 2 23
1 7 2, 7
14. The graph does not represent a function. It fails the
vertical line test.
15. The graph represents a function. It passes the
vertical line test.
16. The graph does not represent a function. It fails the
vertical line test.
10.
The graph of g is the graph of f shifted up 2
units.
17. The graph does not represent a function. It fails the
vertical line test.
18. The graph represents a function. It passes the
vertical line test.
19.
20.
21.
f 2 4
f (2) 4
f 4 4
22. f (4) 4
23. f 3 0
24.
25.
26.
27.
f (1) 0
g 4 2 g 2 2 g 10 2
28. g (10) 2
29. When x 2, g x 1.
30. When x 1, g ( x) 1.
31. The domain is [0, 5) .
The range is [1, 5) .
The graph of g is the graph of f shifted down 1 unit.
11. The graph represents a function. It passes the
vertical line test.
12. The graph represents a function. It passes the
vertical line test.
13. The graph does not represent a function. It fails the
vertical line test.
Section 2.2 Graphs of Functions Chapter 2 Functions and Linear Functions
32. The domain is (5, 0] .
The range is [3, 3) .
33. The domain is [0, ) .
The range is [1, ) .
34. The domain is [0, ) .
The range is [0, ) .
Section 2.2 Graphs of Functions Chapter 2 Functions and Linear Functions
35. The domain is [2, 6] .
The range is [2, 6] .
36. The domain is [3, 2] .
The range is [5, 5] .
37. The domain is (, )
The range is (, 2]
38. The domain is (, ) .
The range is [0, ) .
39. The domain is 5, 2, 0,1, 3 .
43. a.
b.
44. a.
b.
G(30) 0.01(30)2
(30) 60 81
In 2010, the wage gap was 81%. This is
represented as (30, 81) on the graph.
G(30) underestimates the actual data shown by
the bar graph by 2%.
G(10) 0.01(10)2
(10) 60 69
In 1990, the wage gap was 69%. This is
represented as (10, 69) on the graph.
G(10) underestimates the actual data shown by
the bar graph by 2%.
2
The range is 2. 45. f (20) 0.4 20 36 20 1000
40. The domain is {5, 2, 0,1, 4} .
The range is {2} .
41. a. The domain is (, ) .
b. The range is [4, )
46.
0.4 400 720 1000
160 720 1000
560 1000 440
Twenty-year-old drivers have 440 accidents per 50
million miles driven.
This is represented on the graph by point (20,440).
f (50) 0.4 502
36 50 1000
c. f (3) 4
0.4 2500 1800 1000
d. 2 and 6; i.e. f (2) f (6) 2 1000 1800 1000 200
Fifty-year-old drivers have 200 accidents per 50
e. f crosses the x-axis at (1, 0) and (7, 0).
f. f crosses the y-axis at (0, 4).
million miles driven.
This is represented on the graph by point (50,200).
47. The graph reaches its lowest point at x 45.
g. f ( x) 0 on the interval (1, 7).
h. f (8) is positive.
42. a. The domain is (, 6].
b. The range is (,1].
c. f (4) 1
f (45) 0.4 452
36 45 1000
0.4 2025 1620 1000
810 1620 1000
810 1000
190
Drivers at age 45 have 190 accidents per 50 million
miles driven. This is the least number of accidents
for any driver between ages 16 and 74.
d. –6 and 6; i.e.
f (6) f (6) 3
48. Answers will vary.
One possible answer is age 16 and age 74.
e. f crosses the x-axis at (3,0) and (3,0).
f. f crosses the y-axis at (0,1).
f (16) 0.4 162
36 16 1000
0.4 256 576 1000
102.4 576 1000 526.4 2
g. f ( x) 0 on the interval (3, 3). f (74) 0.4 74 36 74 1000
h. f (2) is positive.
0.4 5476 2664 1000
Section 2.2 Graphs of Functions Chapter 2 Functions and Linear Functions
2190.4 2664 1000
526.4 Both 16-year-olds and 74-year-olds have approximately 526.4 accidents per 50 million miles driven.
Section 2.2 Graphs of Functions Chapter 2 Functions and Linear Functions
49. f (3) 0.91
The cost of mailing a first-class letter weighing 3 ounces is $0.91.
50. f (3.5) 1.12
The cost of mailing a first-class letter weighing 3.5 ounces is $1.12.
51. The cost to mail a letter weighing 1.5 ounces is $0.70.
52. The cost to mail a letter weighing 1.8 ounces is $0.70.
53. – 56. Answers will vary.
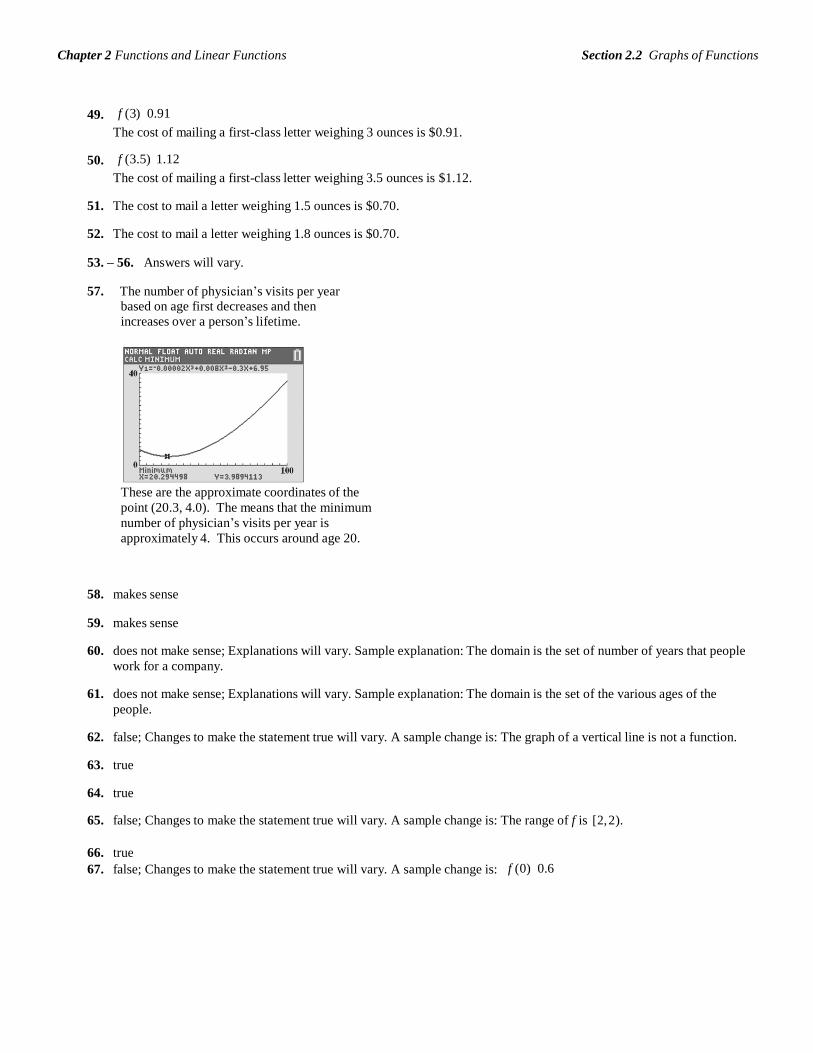
57. The number of physician’s visits per year based on age first decreases and then
increases over a person’s lifetime.
These are the approximate coordinates of the
point (20.3, 4.0). The means that the minimum
number of physician’s visits per year is
approximately 4. This occurs around age 20.
58. makes sense
59. makes sense
60. does not make sense; Explanations will vary. Sample explanation: The domain is the set of number of years that people
work for a company.
61. does not make sense; Explanations will vary. Sample explanation: The domain is the set of the various ages of the
people.
62. false; Changes to make the statement true will vary. A sample change is: The graph of a vertical line is not a function.
63. true
64. true
65. false; Changes to make the statement true will vary. A sample change is: The range of f is [2, 2).
66. true
67. false; Changes to make the statement true will vary. A sample change is: f (0) 0.6
Section 2.2 Graphs of Functions Chapter 2 Functions and Linear Functions
2
2
68. f (1.5) f (0.9) [ f (π )]2 f (3) f (1) f (π )
1 0 [4]2
2 (2)(3)
1 16 (1)(3)
1 16 3
15 3
18
69. f (2.5) f (1.9) [ f (π )]2 f (3) f (1) f (π )
2 (2) [3]2
2 (2)(4)
4 9 (1)(4)
2 9 4
3
70. The relation is a function. Every element in the domain corresponds to exactly one element in the range.
71. 12 2(3x 1) 4 x 5
12 6 x 2 4 x 5
10 6 x 4 x 5
6 x 4 x 5 10
10 x 15
10 x
15
10 10
x 3
The solution set is 3 .
72. Let x = the width of the rectangle.
Let 3x 8 length of the rectangle.
P 2l 2w
624 2(3x 8) 2 x
624 6 x 16 2 x
624 8x 16
8x 608
x 76
3x 8 236 The dimensions of the rectangle are 76 yards by 236 yards.
73. 3 must be excluded from the domain of f because it would cause the denominator, x 3, to be equal to zero. Division by
0 is undefined.
74.
75.
f (4) g(4)
f (4) g (4) (42
4) (4 5)
20 (1)
19
2.6 x2
49 x 3994 (0.6 x2
7 x 2412)
2.6 x2
49 x 3994 0.6 x2
7 x 2412
2 x2
42 x 1582
Section 2.3 The Alglebra of Functions Chapter 2 Functions and Linear Functions
2
2
2.3 Check Points
1. a. The function contains neither division nor a square root. For every real number, x, the algebraic expression 1 x 3 is
a real number. Thus, the domain of f is the set of all real numbers. Domain of f is (, ) .
b. The function g ( x) 7 x 4 x 5
contains division. Because division by 0 is undefined, we must exclude from the
domain the value of x that causes x 5
Domain of g is (, 5) or (5, ) .
2. a. f g ( x) f ( x) g ( x)
3x2 4 x 1 2 x 7
3x2
4 x 1 2 x 7
3x2
6 x 6
b. f g ( x) 3x2
6 x 6
f g (4) 3(4)2
6(4) 6
78
3. a. f g ( x) 5
7
x x 8
to be 0. Thus, x cannot equal –5.
b. The domain of f - g is the set of all real numbers that are common to the domain of f and the domain of g. Thus, we
must find the domains of f and g.
Note that f ( x) 5 x
is a function involving division. Because division by 0 is undefined, x cannot equal 0.
The function g ( x) 7
x 8
is also a function involving division. Because division by 0 is undefined, x cannot equal
8.
To be in the domain of f - g, x must be in both the domain of f and the domain of g.
This means that x 0 and x 8.
Domain of f g = (, 0) or (0, 8) or (8, ) .
4. a. f g 5 f 5 g 5 [52 2 5] [5 3] 23
b. f g x f x g x [ x2 2 x] [ x 3] x
2 3x 3
f g 1 (1)2
3(1) 3 1
c. f
f x
x 2 x
x
3
g g x x
f
(7)2
2(7) 35 7
7 g (7) 3 10 2
Section 2.3 The Alglebra of Functions Chapter 2 Functions and Linear Functions
d. fg 4 f 4 g 4
(4)2 2(4)(4) 3 241 24
5. a. B D x B x D x
(2.6 x2
49 x 3994) (0.6 x2
7 x 2412)
2.6 x2
49 x 3994 0.6 x2
7 x 2412
3.2 x2
56 x 6406
b. B D x 3.2 x2
56 x 6406
B D 5 3.2(3)2
56(3) 6406
6545.2
The number of births and deaths in the U.S. in 2003 was 6545.2 thousand.
c. B D x overestimates the actual number of births and deaths in 2003 by 7.2 thousand.
2.3 Concept and Vocabulary Check
1. zero
2. negative
3. f ( x) g ( x)
4. f ( x) g ( x)
5. f ( x) g ( x)
6. f ( x)
; g ( x)
g ( x)
7. (, )
8. (2, )
9. (0, 3) ; (3, )
2.3 Exercise Set
1. Domain of f is (, ).
2. Domain of f is (, ).
3. Domain of g is (, 4) or (4, ) .
Section 2.3 The Alglebra of Functions Chapter 2 Functions and Linear Functions
4. Domain of g is (, 5) or (5, ) .
5. Domain of f is (, 3) or (3, ) .
6. Domain of f is (, 2) or (2, ) .
7. Domain of g is (, 5) or (5, ) .
8. Domain of g is (, 6) or (6, ) .
9. Domain of f is (, 7) or (7, 9) or (9, ) .
10. Domain of f is (, 8) or (8,10) or (10, ) .
11. f g ( x) 3x 1 2 x 6
3x 1 2 x 6
5x 5
f g (5) 5 5 5
25 5 20
12. f g ( x) 4 x 2 2 x 9 4 x 2 2 x 9
6 x 7
f g 5 6 5 7 30 7 23
13. f g ( x) x 5 3x2
x 5 3x2
3x2
x 5
f g (5) 352
5 5
325 75
14. f g ( x) x 6 2 x2
x 6 2 x2
2 x2
x 6
f g 5 2 52
5 6
2 25 5 6
50 5 6 49
15. f g ( x)
2 x2 x 3 x 1
2 x2
x 3 x 1
2 x2
2
Section 2.3 The Alglebra of Functions Chapter 2 Functions and Linear Functions
f g (5) 2 52
2
2 25 2
50 2 48
16. f g ( x) 4 x2
x 3 x 1
4 x2
x 3 x 1
4 x2
2
f g 5 4 52
2 4 25 2
100 2 98
17. f g ( x) 5x 2 x 3 5x 2 x 3
3x 3
f g ( x) 5x 2 x 3 5x 2 x 3
7 x 3
fg ( x) 5x 2 x 3
10 x2
15x
f
( x) 5x
g 2 x 3
18. f g ( x) 4 x 3x 5 4 x 3x 5
7 x 5
f g ( x) 4 x 3x 5 4 x 3x 5
x 5
fg ( x) 4 x 3x 5
12 x2
20 x
f
( x) 4 x
g 3x 5
19. Domain of f g = (, ).
20. Domain of f g = (, ).
21. Domain of f g =(, 5) or (5, ).
22. Domain of f g =(, 6) or (6, ).

Section 2.3 The Alglebra of Functions Chapter 2 Functions and Linear Functions
23. Domain of f g =(, 0) or (0, 5) or (5, ) .
24. Domain of f g =(, 0) or (0, 6) or (6, ) .
25. Domain of f g = f g =(, 3) or (3, 2) or (2, ).
26. Domain of f g = f g =(, 8) or (8, 4) or (4, ).
27. Domain of f g =(, 2) or (2, ).
28. Domain of f g =(, 4) or (4, ).
29. Domain of f g = (, ).
30. Domain of f g = (, ).
31. ( f g )( x) f ( x) g ( x)
x2
4 x 2 x
x2
3x 2
( f g )(3) 32
33 2 20
32.
33.
34.
( f g )( x) f ( x) g ( x)
x2
4 x 2 x
x2
3x 2
( f g ) 4 42
34 2 30
f (2) g (2) 22
4 2 2 2 4 4 0
f 3 g 3 32
4 3 2 3 3 5 2
35. ( f g )( x) f ( x) g ( x)
x2 4 x 2 x
x2
4 x 2 x
x2
5x 2
( f g ) 5 52
5 5 2
25 25 2 48
36. ( f g )( x) f ( x) g ( x)
x2 4 x 2 x
x2
4 x 2 x
Section 2.3 The Alglebra of Functions Chapter 2 Functions and Linear Functions
x2
5
x
2
( f
g ) 6
62
5
6 2
3
6
3
0
2
6
4
Section 2.3 The Alglebra of Functions Chapter 2 Functions and Linear Functions
37.
38.
f (2) g (2) 22
4 2 2 2 4 4 8
f 3 g 3 32
4 3 2 3 3 5 8
39. fg 2 f 2 g 2 22
4 2 2 2 4 4 16
40. fg 3 f 3 g 3 32
4 3 2 3 35 15
41. fg 5 f 5 g 5 52
4 5 2 5 45 3 135
42. fg 6 f 6 g 6 62
4 6 2 6 60 4 240
43.
f f x x 2 4 x
g x
g x
2
2 x
f 1
1 4 1 1 4
5
5
44.
g
f
xg
2 1
f x
g x
1 1
x
2 4 x
2 x
2
f 3
3 4 3 9 12
21
21
45.
g
f
2 3
f x
1 1
x 2 4 x
g x
g x
2
2 x
f 1
1 4 1g 2 1
1 4 3 1 3 3
46. f
f x x 2 4 x
g x
g x
2
2 x
f 0
0 4 0 0 0
0
0 g 2 0 2 2
47. Domain of f g = (, ).
48. Domain of f g = (, ).
49. f
f x x 2 4 x
g x
g x
2 x
Section 2.3 The Alglebra of Functions Chapter 2 Functions and Linear Functions
Domain of f
(, 2) or (2, ) . g
Section 2.3 The Alglebra of Functions Chapter 2 Functions and Linear Functions
50. fg x f x g x x2 4 x 2 x
Domain of fg (, ) .
51. f g 3 f 3 g 3 4 1 5
52. g f 2 g 2 f 2 2 3 1
53. fg 2 f 2 g 2 1 1 1
54. g
3 g 3
0
0
f f 3 3
55. The domain of f g is [4, 3] .
56. The domain of f
is (4, 3) . g
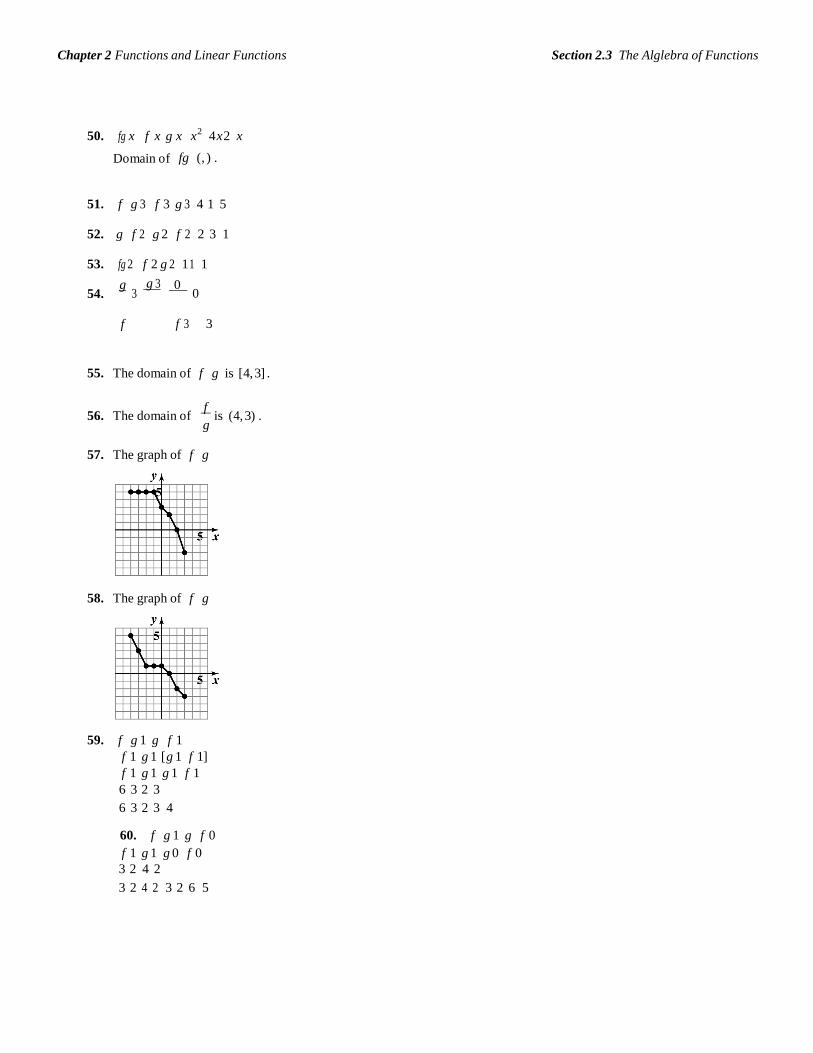
57. The graph of f g
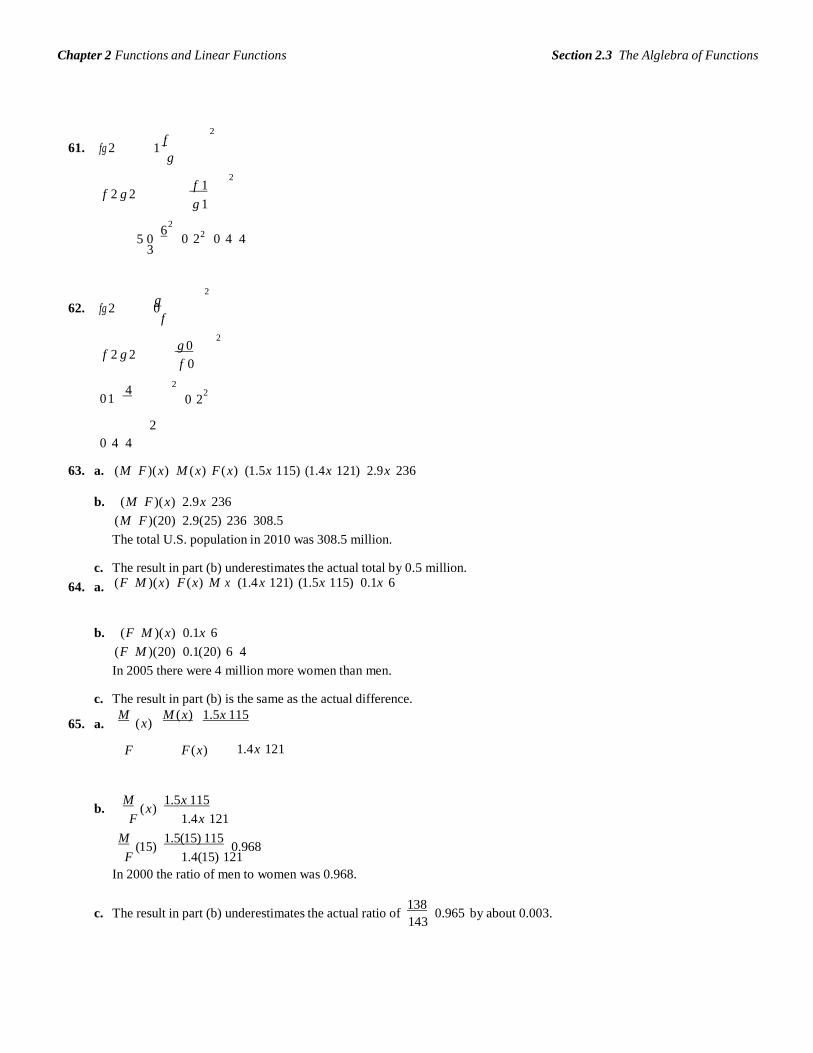
58. The graph of f g
59. f g 1 g f 1 f 1 g 1 [g 1 f 1]
f 1 g 1 g 1 f 1 6 3 2 3
6 3 2 3 4
60. f g 1 g f 0 f 1 g 1 g 0 f 0
3 2 4 2
3 2 4 2 3 2 6 5
Section 2.3 The Alglebra of Functions Chapter 2 Functions and Linear Functions
3
2
2
2
2
f 61. fg 2 1
g
f 1 f 2 g 2
g 1
5 0 6
0 22
0 4 4
2
g 62. fg 2 0
f
g 0 f 2 g 2
f 0 2
0 1 4 0 2
2
2
0 4 4
63. a. ( M F )( x) M ( x) F ( x) (1.5x 115) (1.4 x 121) 2.9 x 236
b. ( M F )( x) 2.9 x 236
( M F )(20) 2.9(25) 236 308.5
The total U.S. population in 2010 was 308.5 million.
c. The result in part (b) underestimates the actual total by 0.5 million.
64. a. ( F M )( x) F ( x) M x (1.4 x 121) (1.5x 115) 0.1x 6
b. ( F M )( x) 0.1x 6
( F M )(20) 0.1(20) 6 4
In 2005 there were 4 million more women than men.
c. The result in part (b) is the same as the actual difference.
65. a. M
( x) M ( x)
1.5x 115
F F ( x) 1.4 x 121
b. M
( x) 1.5x 115
F 1.4 x 121
M (15)
1.5(15) 115 0.968
F 1.4(15) 121
In 2000 the ratio of men to women was 0.968.
c. The result in part (b) underestimates the actual ratio of 138
0.965 by about 0.003. 143
Section 2.3 The Alglebra of Functions Chapter 2 Functions and Linear Functions
66. First, find R C x . ( R C )( x) 65x (600, 000 45x)
65x 600, 000 45x
20 x 600, 000 ( R
C )(20, 000)
20 20, 000 600, 000
400, 000 600, 000 200, 000
This means that if the company produces and sells
20,000 radios, it will lose $200,000.
( R C )(30, 000)
73.
74.
y1 x y2 x 4
y1 x2
2 x y2 x
y3 y1 y2
20 30, 000 600, 000
600, 000 600, 000 0
If the company produces and sells 30,000 radios, it
will break even with its costs equal to its revenue.
( R C )(40, 000)
20 40, 000 600, 000
800, 000 600, 000 200, 000
This means that if the company produces and sells
40,000 radios, it will make a profit of $200,000.
67. – 70. Answers will vary.
75.
y1
y3 y2
No y-value is displayed because
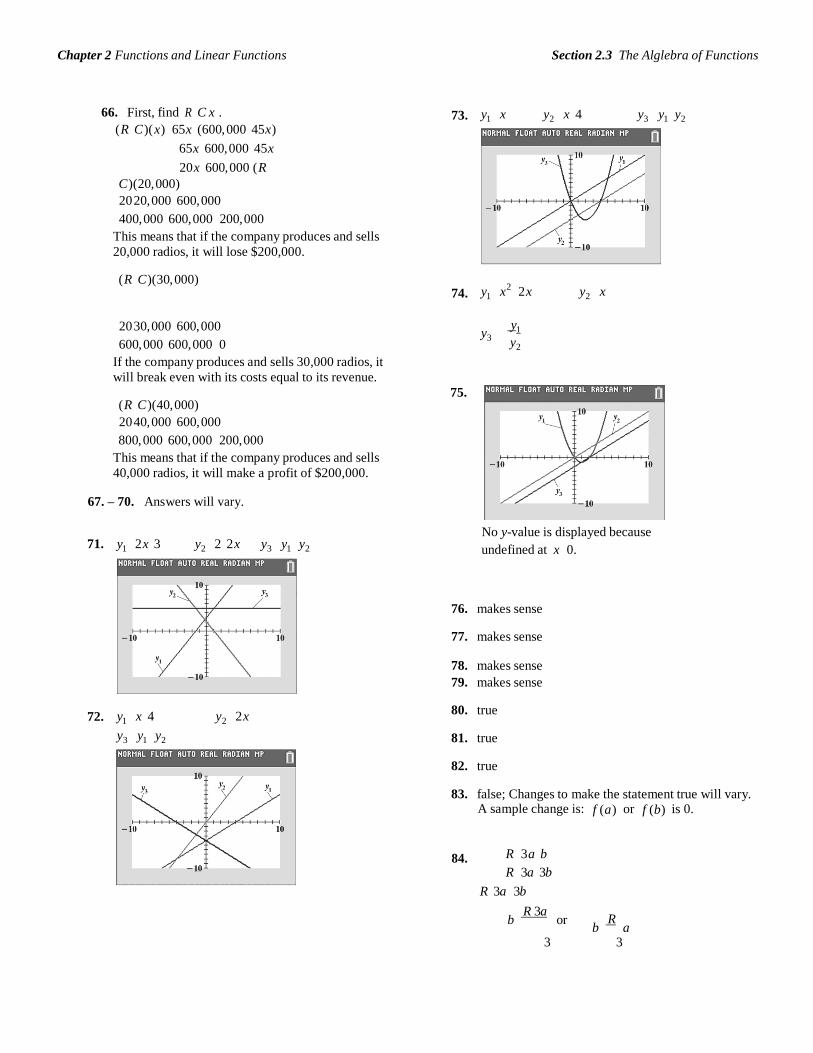
71. y1 2 x 3 y2 2 2 x y3 y1 y2 undefined at x 0.
76. makes sense
77. makes sense
78. makes sense
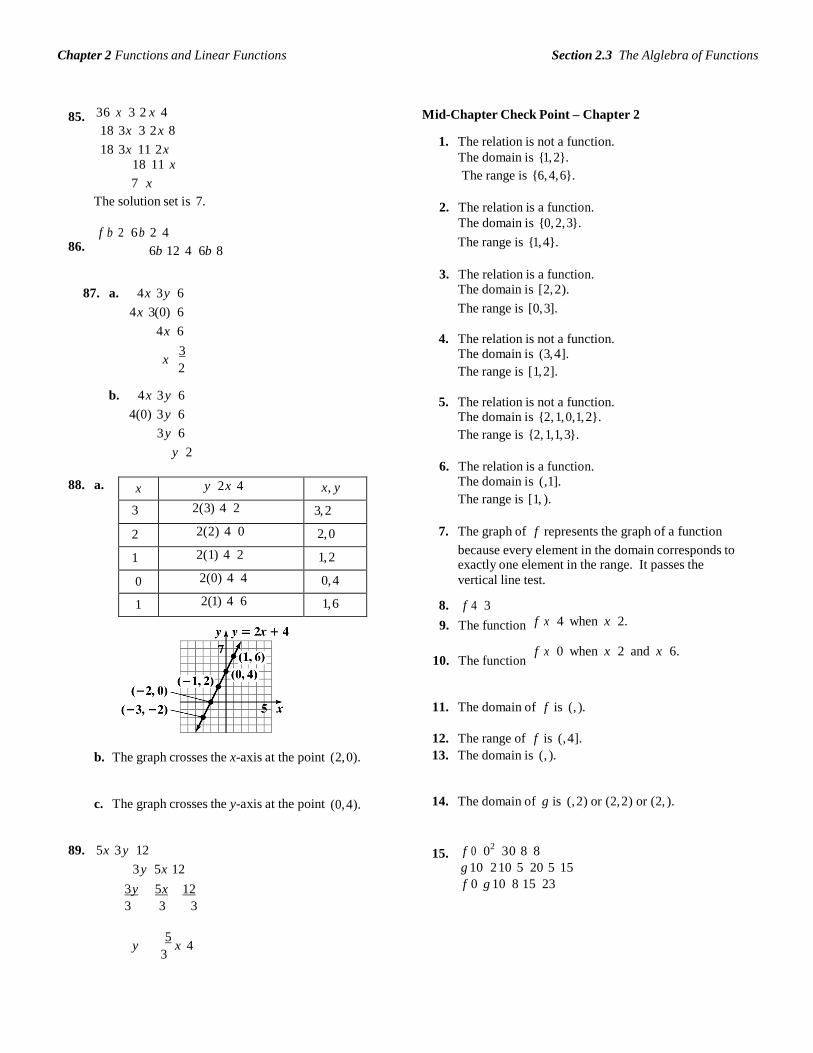
72.
y1 x 4
y3 y1 y2
y2 2 x
79. makes sense
80. true
81. true
82. true
83. false; Changes to make the statement true will vary.A sample change is: f (a) or f (b) is 0.
84. R 3a bR 3a 3b
R 3a 3b
b R 3a
or
b R
a3 3
Section 2.3 The Alglebra of Functions Chapter 2 Functions and Linear Functions
x y 2 x 4 x, y
3 2(3) 4 2 3, 2
2 2(2) 4 0 2, 0
1 2(1) 4 2 1, 2
0 2(0) 4 4 0, 4
1 2(1) 4 6 1, 6
85.
86.
36 x 3 2 x 418 3x 3 2 x 8
18 3x 11 2 x 18 11 x
7 x
The solution set is 7.
f b 2 6 b 2 4
6b 12 4 6b 8
Mid-Chapter Check Point – Chapter 2
1. The relation is not a function.
The domain is {1, 2}.
The range is {6, 4, 6}.
2. The relation is a function.
The domain is {0, 2, 3}.
The range is {1, 4}.
3. The relation is a function.
87. a. 4 x 3 y 6
4 x 3(0) 6
4 x 6
x 3 2
b. 4 x 3 y 6
4(0) 3 y 6
3 y 6
y 2
88. a.
The domain is [2, 2).
The range is [0, 3].
4. The relation is not a function.
The domain is (3, 4].
The range is [1, 2].
5. The relation is not a function.
The domain is {2, 1, 0,1, 2}.
The range is {2, 1,1, 3}.
6. The relation is a function.
The domain is (,1].
The range is [1, ).
7. The graph of f represents the graph of a function
because every element in the domain corresponds to exactly one element in the range. It passes the vertical line test.
8. f 4 3
9. The function
10. The function
f x 4 when x 2. f x 0 when x 2 and x 6.
11. The domain of f is (, ).
12. The range of f is (, 4].
b. The graph crosses the x-axis at the point (2, 0). 13. The domain is (, ).
c. The graph crosses the y-axis at the point (0, 4). 14. The domain of g is (, 2) or (2, 2) or (2, ).
89. 5x 3 y 12
3 y 5x 12
3 y 5x 12
3 3 3
15. f 0 02 30 8 8
g 10 2 10 5 20 5 15
f 0 g 10 8 15 23
y 5
x 4 3
Section 2.4 Linear Functions and Slope Chapter 2 Functions and Linear Functions
2 1
2 1
16.
17.
f 1 12
31 8 1 3 8 12
g 3 2 3 5 6 5 11
f 1 g 3 12 11 12 11 23
f a a 2
3a 8
g a 3 2 a 3 5
2a 6 5 2a 11
f a g a 3 a 2
3a 8 2a 11
a2
5a 3
2.4 Check Points
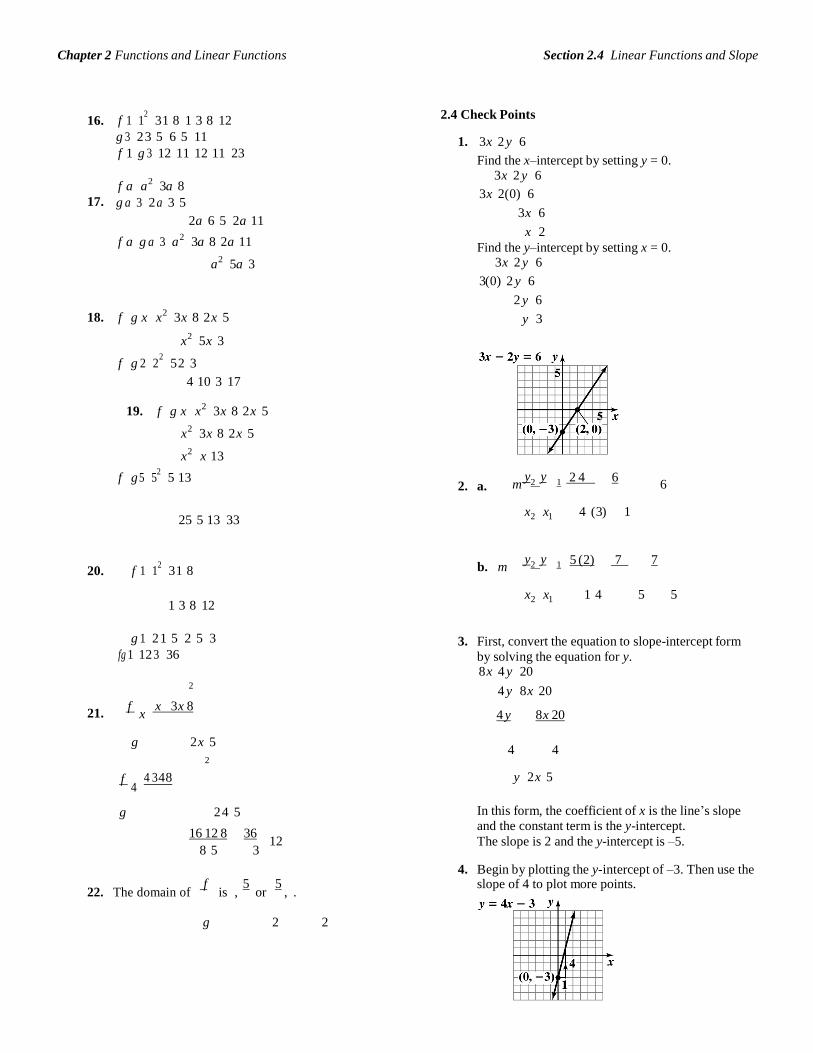
1. 3x 2 y 6
Find the x–intercept by setting y = 0. 3x 2 y 6
3x 2(0) 6
3x 6
x 2
Find the y–intercept by setting x = 0. 3x 2 y 6
3(0) 2 y 6
2 y 6
18. f g x x2 3x 8 2 x 5
x2
5x 3
f g 2 22
5 2 3
4 10 3 17
19. f g x x2 3x 8 2 x 5
x2
3x 8 2 x 5
x2
x 13
f g 5 52
5 13
2. a.
y 3
y y 2 4 6 m 6
25 5 13 33 x2 x1 4 (3) 1
20.
f 1 12
31 8
y y 5 (2) 7 7 b. m
1 3 8 12 x2 x1 1 4 5 5
g 1 2 1 5 2 5 3
fg 1 12 3 36
2
3. First, convert the equation to slope-intercept form
by solving the equation for y. 8 x 4 y 20
4 y 8 x 20
21. f
x x 3x 8
4 y
8 x 20
g 2 x 5
2
4 4
f 4
4 348 y 2 x 5
g 2 4 5
16 12 8 36 12
8 5 3
In this form, the coefficient of x is the line’s slope
and the constant term is the y-intercept.
The slope is 2 and the y-intercept is –5.
4. Begin by plotting the y-intercept of –3. Then use the
22. The domain of f is
,
5 or
5
, .
slope of 4 to plot more points.
g 2 2

Section 2.4 Linear Functions and Slope Chapter 2 Functions and Linear Functions
2 1
2 1
2 1
5. Begin by plotting the y-intercept of 0. Then use the 10. a. We will use the line segment passing through
slope of 2
3
to plot more points. (60, 390) and (0, 310) to obtain a model. We
need values for m, the slope, and b, the
y-intercept.
y y 390 310 80 m 1.33
x2 x1 60 0 60
The point (0, 310) gives us the y-intercept of 310.
Thus, C( x) mx b
C( x) 1.33x 310
6. y 3 is a horizontal line.
7. x 3 is a vertical line.
b. C ( x) 1.33x 310
C(100) 1.33(100) 310
443
The model predicts the average atmospheric
concentration of carbon dioxide will be 443
parts per million in 2050.
2.4 Concept and Vocabulary Check
1. scatterplot; regression
2. standard
3. x-intercept; zero
4. y-intercept; zero
y2 y1 y y 4.4 4.65 0.25 8. m 0.05 5.
x x
x2 x1 2010 2005 5 2 1
From 2005 through 2010, the average waste
produced per person in the U.S. decreased by 0.05
pound per day each year.
y y 0.05 0.03 0.02 9. m 0.01
6. positive
7. negative
8. zero
x2 x1 3 1 2
9. undefined
The average rate of change between 1 hour and 3 hours is 0.01. This means that the drug’s concentration is increasing at an average rate of 0.01 milligram per 100 milliliters per hour.
10. y mx b
11. (0, 3) ; 2; 5
12. horizontal
13. vertical 14. y; x
Section 2.4 Linear Functions and Slope Chapter 2 Functions and Linear Functions
2.4 Exercise Set
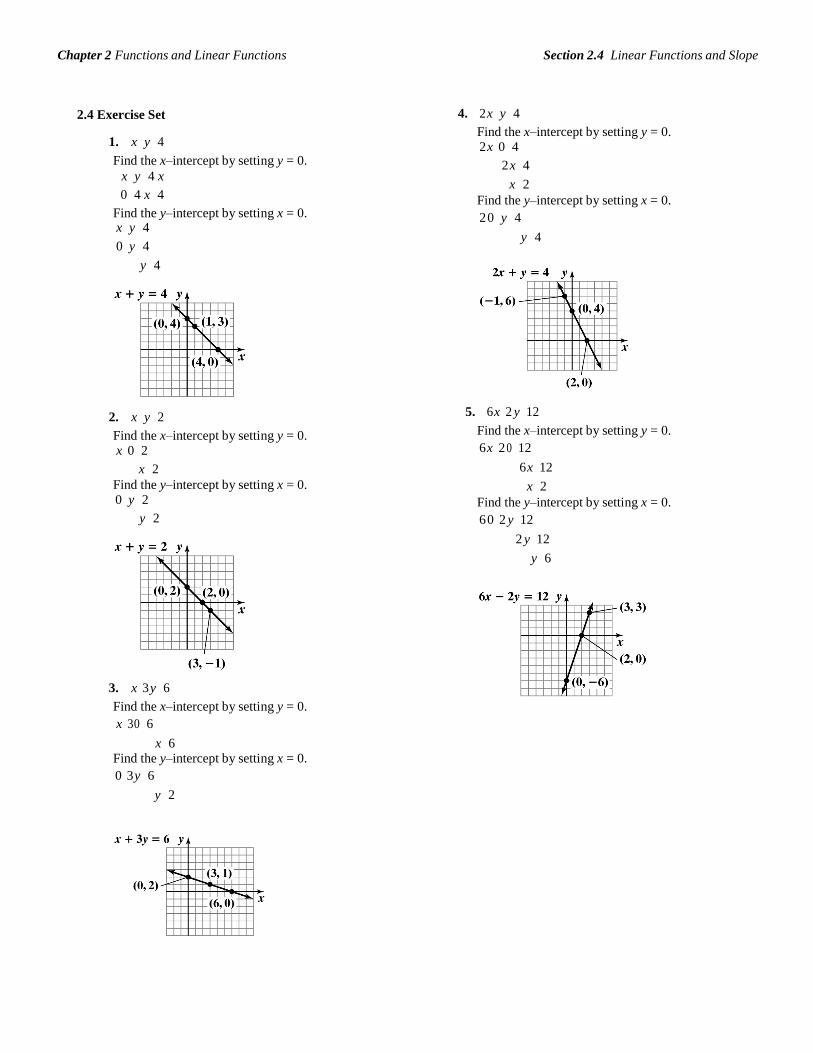
1. x y 4
Find the x–intercept by setting y = 0.
x y 4 x
0 4 x 4
Find the y–intercept by setting x = 0. x y 4
0 y 4
y 4
2. x y 2
Find the x–intercept by setting y = 0. x 0 2
x 2
Find the y–intercept by setting x = 0. 0 y 2
y 2
3. x 3 y 6
Find the x–intercept by setting y = 0.
x 30 6
x 6 Find the y–intercept by setting x = 0.
0 3 y 6
y 2
4. 2 x y 4
Find the x–intercept by setting y = 0. 2 x 0 4
2 x 4
x 2
Find the y–intercept by setting x = 0.
2 0 y 4
y 4
5. 6 x 2 y 12
Find the x–intercept by setting y = 0.
6 x 2 0 12
6 x 12
x 2
Find the y–intercept by setting x = 0.
6 0 2 y 12
2 y 12
y 6
Section 2.4 Linear Functions and Slope Chapter 2 Functions and Linear Functions
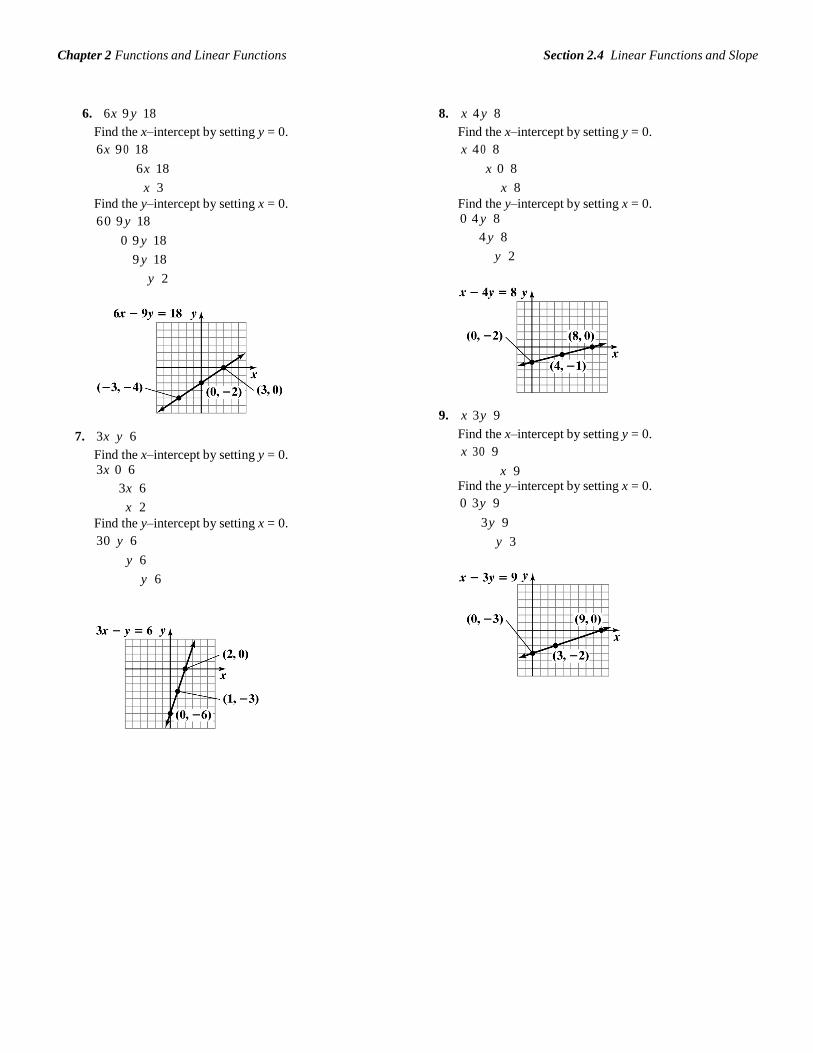
6. 6 x 9 y 18
Find the x–intercept by setting y = 0.
6 x 9 0 18
6 x 18
x 3
Find the y–intercept by setting x = 0.
6 0 9 y 18
0 9 y 18
9 y 18
y 2
7. 3x y 6
Find the x–intercept by setting y = 0. 3x 0 6
3x 6
x 2
Find the y–intercept by setting x = 0.
30 y 6
y 6
y 6
8. x 4 y 8
Find the x–intercept by setting y = 0.
x 4 0 8
x 0 8
x 8
Find the y–intercept by setting x = 0. 0 4 y 8
4 y 8
y 2
9. x 3 y 9
Find the x–intercept by setting y = 0.
x 30 9
x 9 Find the y–intercept by setting x = 0.
0 3 y 9
3 y 9
y 3
Section 2.4 Linear Functions and Slope Chapter 2 Functions and Linear Functions
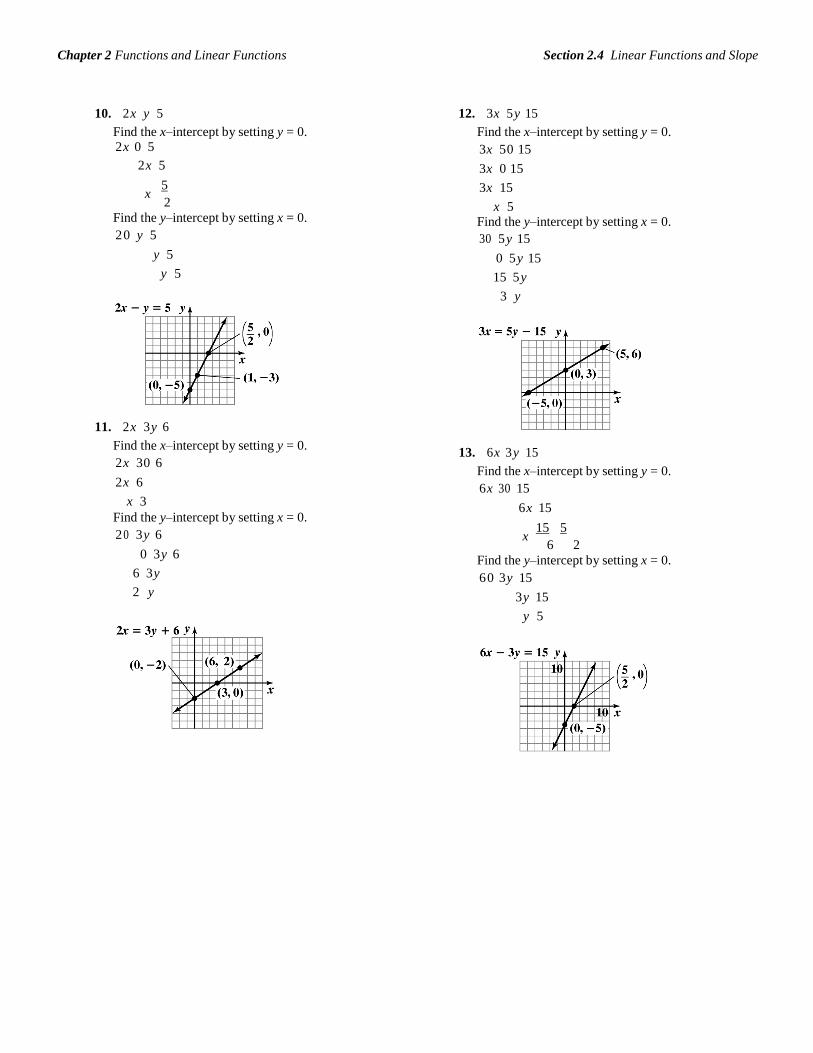
10. 2 x y 5
Find the x–intercept by setting y = 0. 2 x 0 5
2 x 5
x 5 2
Find the y–intercept by setting x = 0.
2 0 y 5
y 5
y 5
11. 2 x 3 y 6
Find the x–intercept by setting y = 0.
2 x 30 6
2 x 6
x 3
Find the y–intercept by setting x = 0.
2 0 3 y 6
0 3 y 6
6 3 y
2 y
12. 3x 5 y 15
Find the x–intercept by setting y = 0.
3x 5 0 15
3x 0 15
3x 15
x 5 Find the y–intercept by setting x = 0.
30 5 y 15
0 5 y 15
15 5 y
3 y
13. 6 x 3 y 15
Find the x–intercept by setting y = 0.
6 x 30 15
6 x 15
x 15
5
6 2 Find the y–intercept by setting x = 0.
6 0 3 y 15
3 y 15
y 5

Section 2.4 Linear Functions and Slope Chapter 2 Functions and Linear Functions
14. 8 x 2 y 12 3 − ( −1) 3 + 1 4 1
Find the x–intercept by setting y = 0. 22. m = =
−6 − 2 = = −
−8 −8 2
8 x 2 0 12
8x 12
The line falls.
6 − (−4) 10 5
x 12
8
x 3
23. m = = = −3 − (−7) 4 2
The line rises.
2
Find the y–intercept by setting x = 0.
8 0 2 y 12
2 y 12
24. m = 6 − (−4)
= 10
= 5 −1 − (−3) 2
The line rises.
1 1
y 6 25.
− ( −2 ) 4
+ 2 4 undefined
m = 7 7
= =
− 0
2 2 undefined slope; The line is vertical.
1 − ( −6)
1 + 6
26. m = 6 = 6 = undefined 3
− 3 0
2 2
15.
m 8 4
4
4 5 2 5 2 7
16.
3 2 1 The line rises.
m 4 1
3
5 3 2 The line rises.
undefined sl m ope; The line 2 3 2 3 5
is vertical.
27. Line 1 goes through 3, 0 and 0, 2.
m 2 0
2
0 3 3
17. m 5 4
1
1 Line 2 goes through 2, 0 and 0,4.
2 1The line rises.
2 1 3
m 4 0
4
2
0 2 2
5 2 5 2 7 Line 3 goes through 0, 3 and 2, 4.
18. m
2 3 2 3 5 4 3 4 3 1 1
19.
The line rises.
m = 5 − 5
= 0
= 0
28.
m 2 0 2 2 2
L1 passes through 1, 0 and 0, 1.
−1 − 2 −3 1 0 1
The line is horizontal. m 0 1
1 1
Section 2.4 Linear Functions and Slope Chapter 2 Functions and Linear Functions
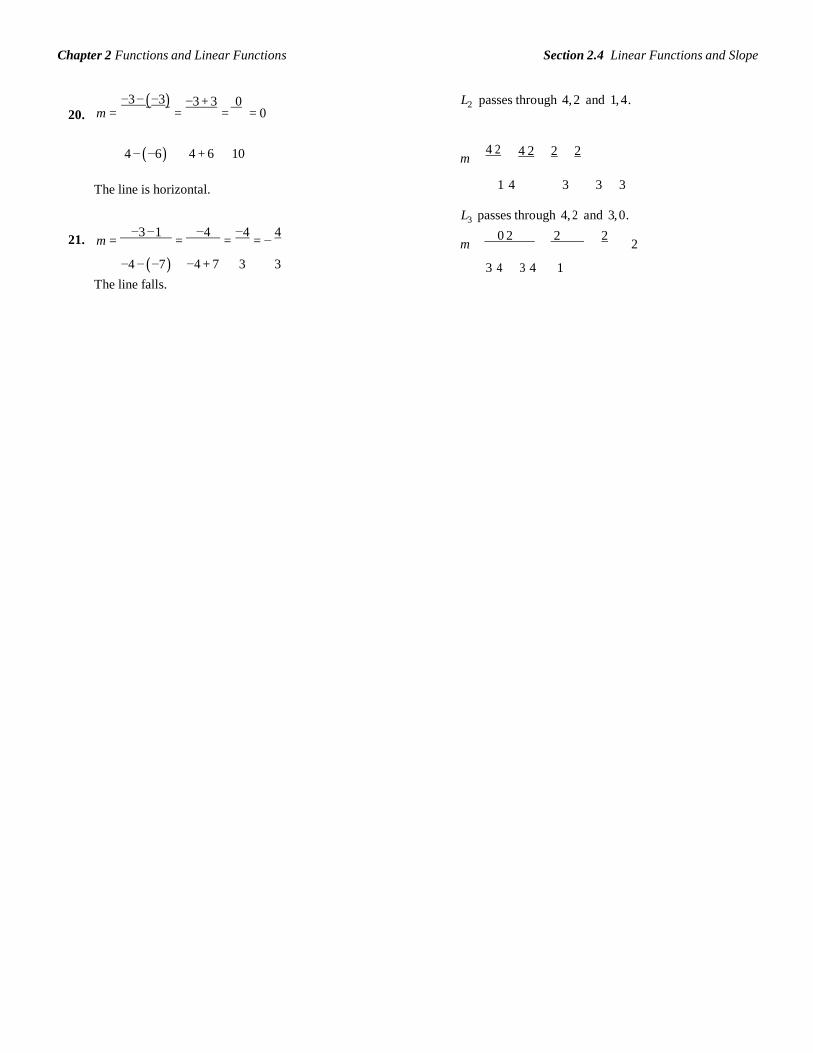
20.
−3 − ( −3) −3 + 3 0
m = = = = 0 L2 passes through 4, 2 and 1, 4.
4 − (−6) 4 + 6 10 4 2 4 2 2 2 m
The line is horizontal. 1 4 3 3 3
L3 passes through 4, 2 and 3, 0.
21.
m = −3 − 1
= −4
= −4
= − 4
m 0 2 2 2
2
−4 − ( −7 ) The line falls.
−4 + 7 3 3
3 4 3 4 1
Section 2.4 Linear Functions and Slope Chapter 2 Functions and Linear Functions
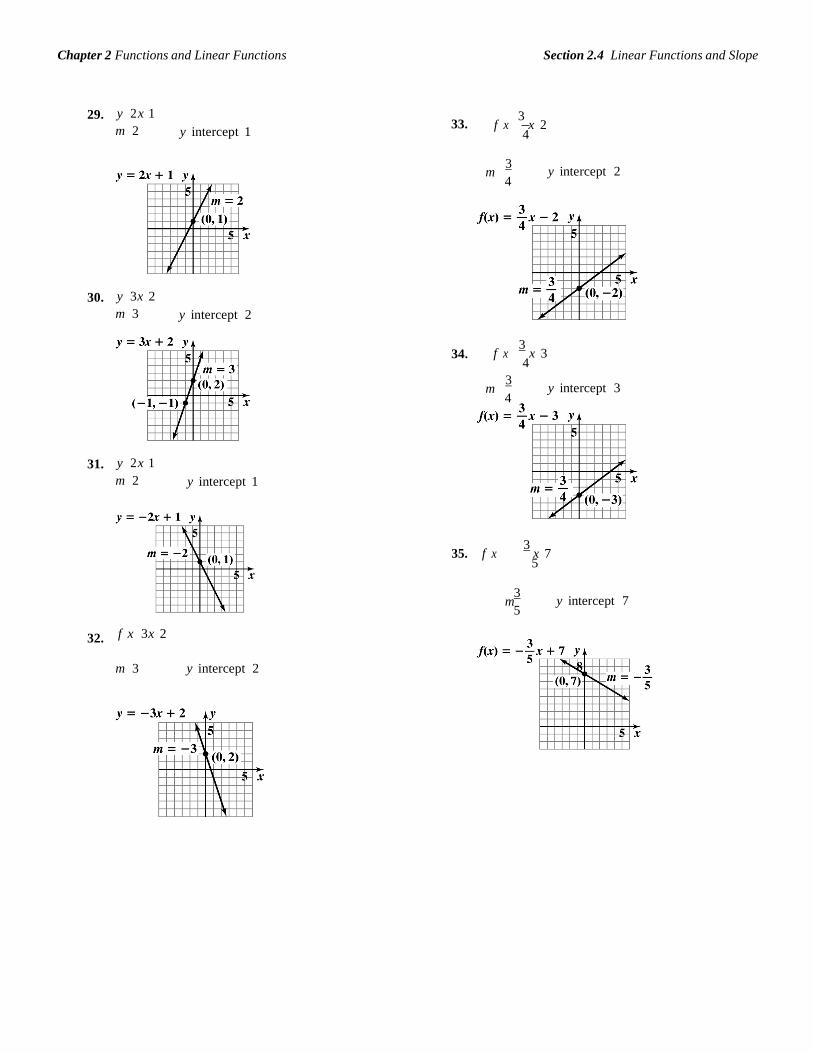
29. y 2 x 1
m 2
y intercept 1
33. f x 3
x 2 4
m 3 4
y intercept 2
30. y 3x 2
m 3
y intercept 2
34.
f x 3
x 3 4
m 3 4
y intercept 3
31. y 2 x 1
m 2
y intercept 1
35. f x 3
x 7 5
32.
f x 3x 2
3 m
5
y intercept 7
m 3 y intercept 2
Section 2.4 Linear Functions and Slope Chapter 2 Functions and Linear Functions
x
x
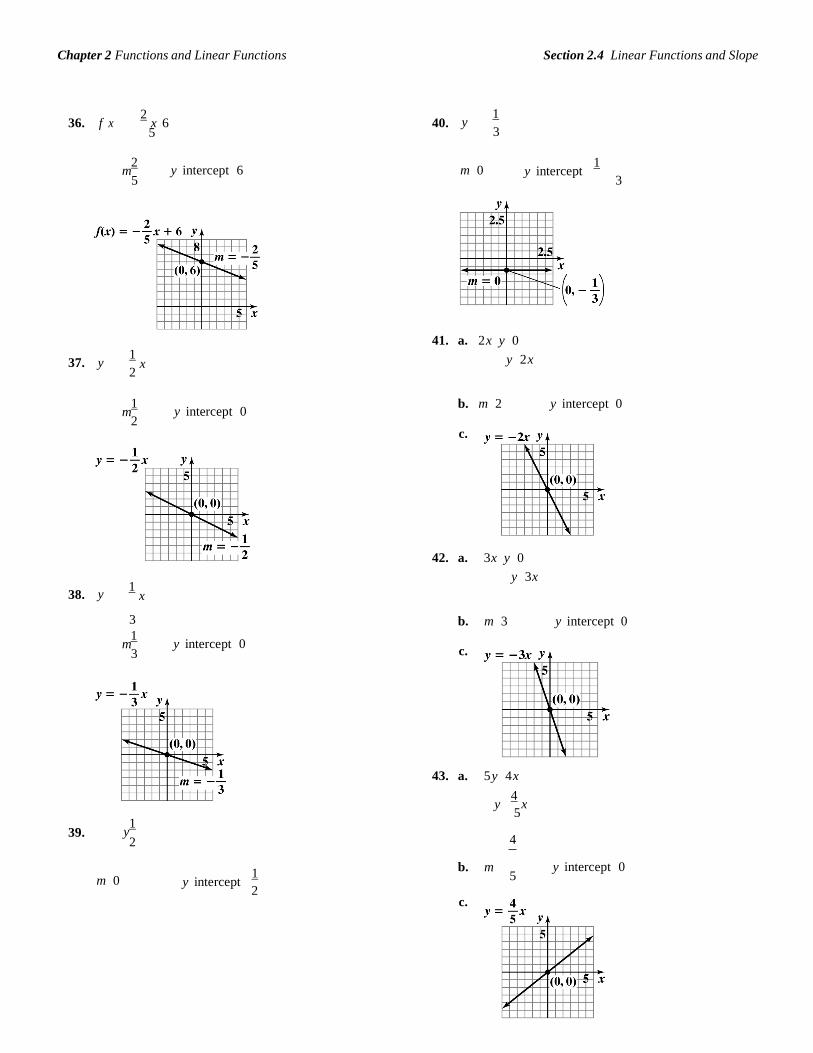
36. f x 2
x 6 5
40. 1
y 3
2 m
5
y intercept 6
m 0 y intercept 1
3
37.
1
y 2
41. a. 2 x y 0
y 2 x
1 m
2
y intercept 0 b. m 2
c.
y intercept 0
38.
1
y
42. a. 3x y 0
y 3x
3
1 m
3
y intercept 0
b. m 3 c.
y intercept 0
39.
1 y 2
43. a. 5 y 4 x
y 4
x 5
4
m 0 y intercept 1 2
b. m 5
c.
y intercept 0

Section 2.4 Linear Functions and Slope Chapter 2 Functions and Linear Functions
Section 2.4 Linear Functions and Slope Chapter 2 Functions and Linear Functions
c.
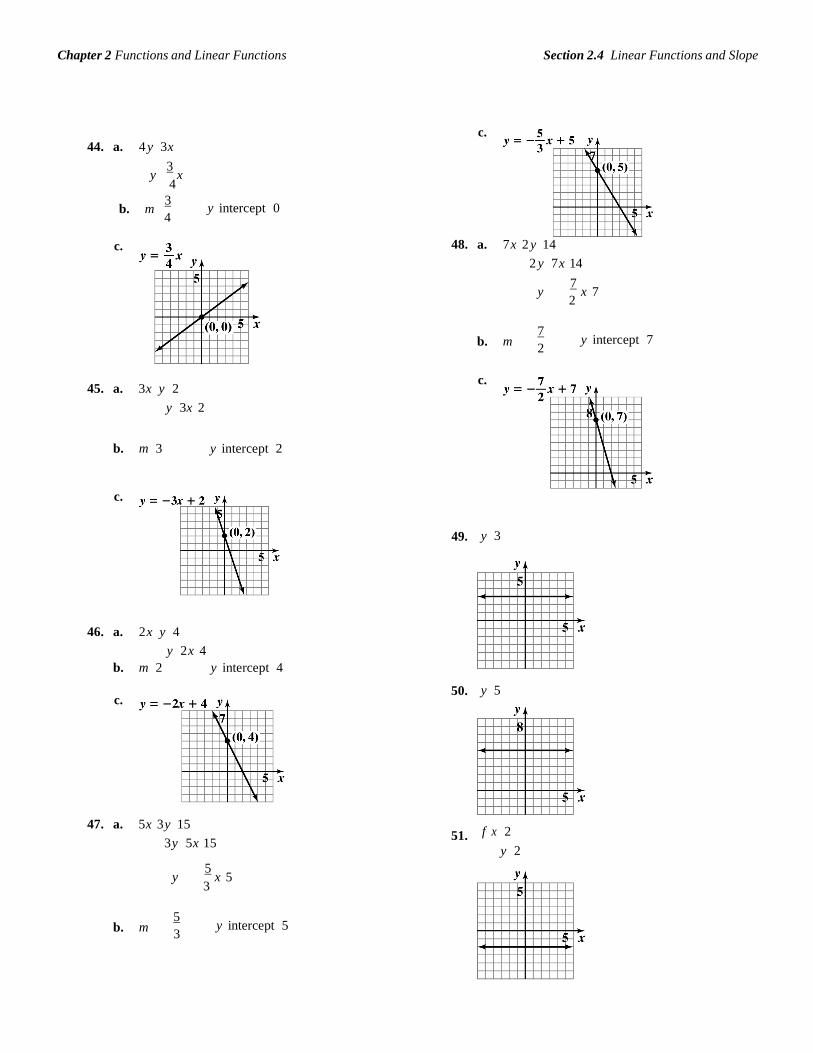
44. a. 4 y 3x
y 3
x 4
b. m 3 4
c.
y intercept 0
48. a. 7 x 2 y 14
2 y 7 x 14
45. a. 3x y 2
y 3x 2
b. m
c.
y 7
x 7 2
7
y intercept 7 2
b. m 3 y intercept 2
c.
49.
y 3
46. a. 2 x y 4
y 2 x 4
b. m 2
c.
y intercept 4 50.
y 5
47. a. 5x 3 y 15
3 y 5x 15
51.
f x 2
y 2
b. m
y 5
x 5 3
5
y intercept 5 3
Section 2.4 Linear Functions and Slope Chapter 2 Functions and Linear Functions
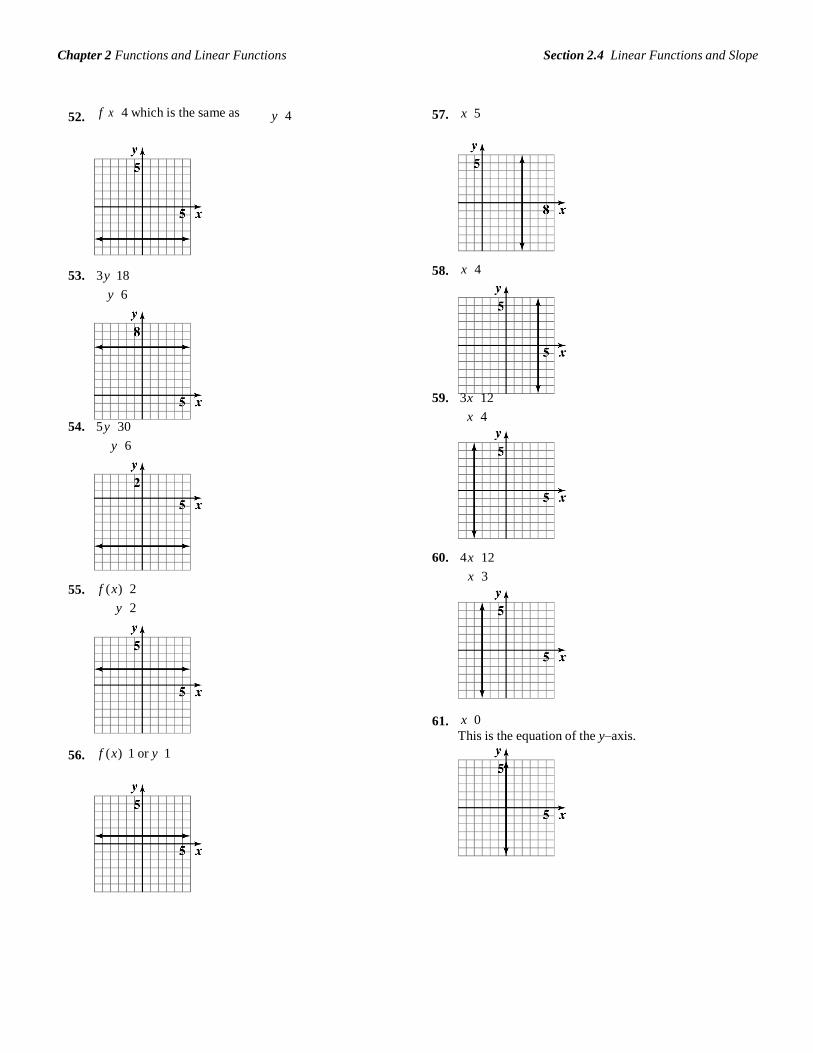
52. f x 4 which is the same as y 4 57. x 5
53. 3 y 18
y 6
58. x 4
54. 5 y 30
y 6
59. 3x 12
x 4
55.
f ( x) 2
y 2
60. 4 x 12
x 3
56.
f ( x) 1 or y 1
61. x 0
This is the equation of the y–axis.
Section 2.4 Linear Functions and Slope Chapter 2 Functions and Linear Functions
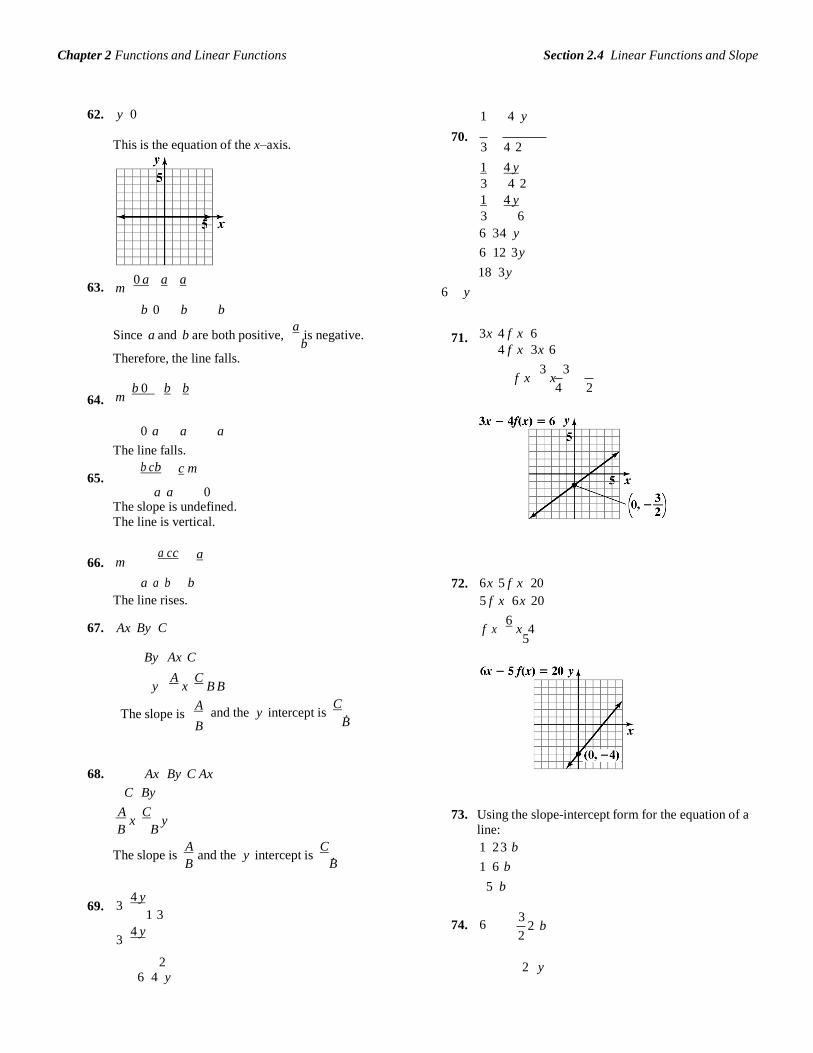
62. y 0 1 4 y
This is the equation of the x–axis. 70.
3 4 21 4 y
3 4 2
1 4 y
3 6
6 34 y 6 12 3 y
18 3 y
63.
m 0 a
a
a
6 y
b 0 b b
64.
Since a and b are both positive, a
is negative. b
Therefore, the line falls.
m b 0
b
b
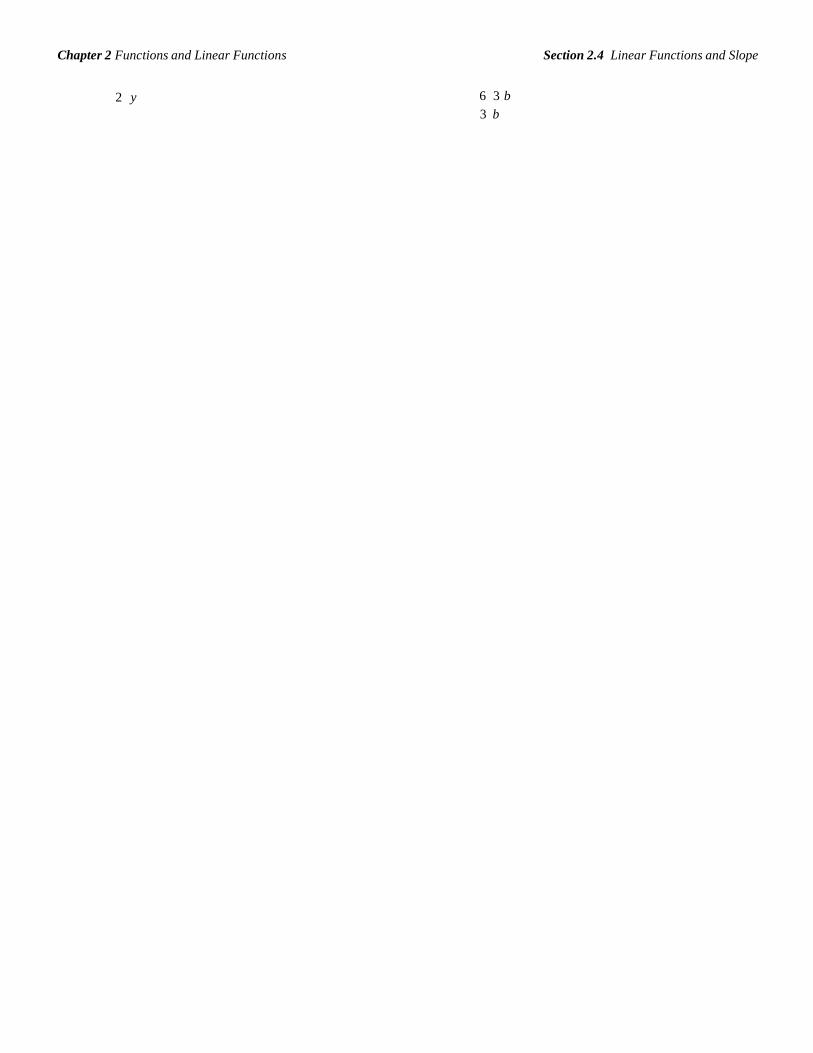
71.
3x 4 f x 6
4 f x 3x 6
f x 3
x 3
4 2
0 a a a
The line falls.
65.
b cb c m
a a 0
66.
The slope is undefined.
The line is vertical.
a cc a m
a a b b
The line rises.
67. Ax By C
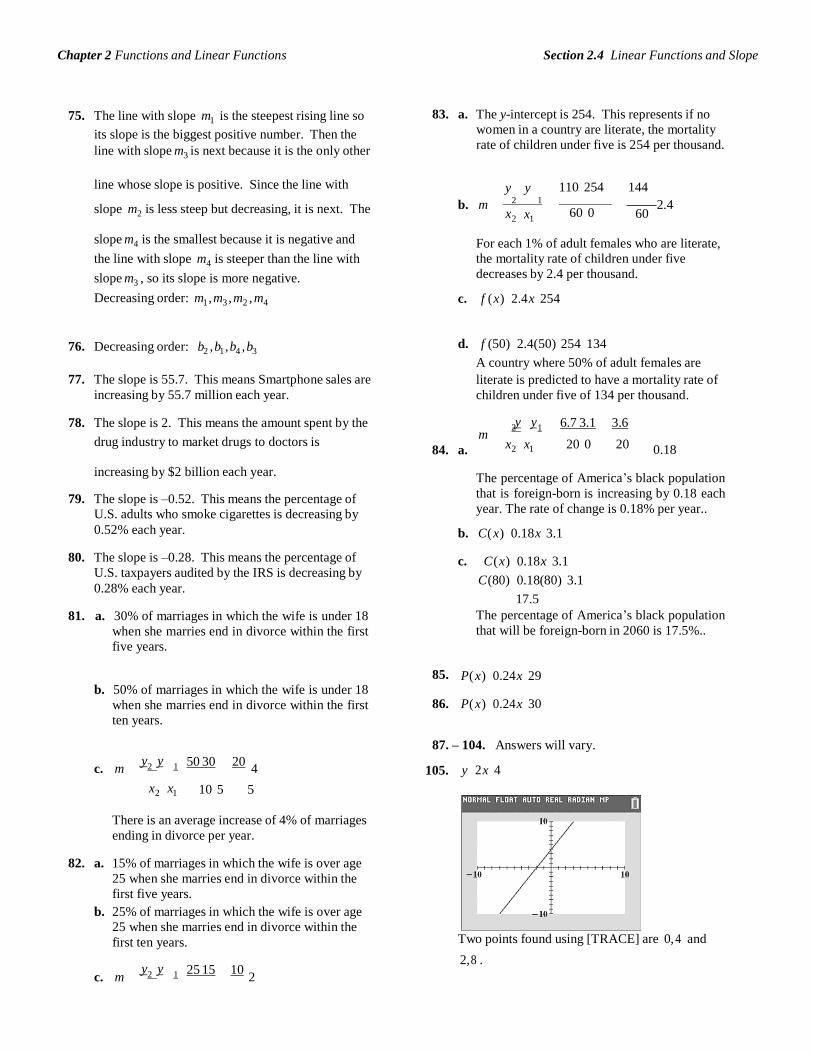
72. 6 x 5 f x 20
5 f x 6 x 20
f x 6
x 4 5
By Ax C
y A
x C
B B
The slope is A
B and the y intercept is
C . B
68. Ax By C Ax
C By
A x
C y
B B
The slope is A
and the y intercept is C
. B B
73. Using the slope-intercept form for the equation of a
line:
1 2 3 b
1 6 b
5 b
69. 3 4 y
1 3
3 4 y
74.
6
3
2 b 2
2 6 4 y
2 y
Section 2.4 Linear Functions and Slope Chapter 2 Functions and Linear Functions
2 y 6 3 b
3 b
Section 2.4 Linear Functions and Slope Chapter 2 Functions and Linear Functions
2 1
2 1
2 1
75. The line with slope m1 is the steepest rising line so
its slope is the biggest positive number. Then the
line with slope m3 is next because it is the only other
83. a. The y-intercept is 254. This represents if no
women in a country are literate, the mortality
rate of children under five is 254 per thousand.
line whose slope is positive. Since the line with y y
110 254
144 2 1
slope m2 is less steep but decreasing, it is next. The b. m x
2 x1
60 0 2.4
60
slope m4 is the smallest because it is negative and
the line with slope m4 is steeper than the line with
slope m3 , so its slope is more negative.
Decreasing order: m1 , m3 , m2 , m4
For each 1% of adult females who are literate,
the mortality rate of children under five
decreases by 2.4 per thousand.
c. f ( x) 2.4 x 254
76. Decreasing order: b2 , b1 , b4 , b3 d. f (50) 2.4(50) 254 134
A country where 50% of adult females are
77. The slope is 55.7. This means Smartphone sales are
increasing by 55.7 million each year.
78. The slope is 2. This means the amount spent by the
literate is predicted to have a mortality rate of
children under five of 134 per thousand.
y y 6.7 3.1 3.6 m
drug industry to market drugs to doctors is 84. a. x2 x1 20 0 20 0.18
increasing by $2 billion each year.
79. The slope is –0.52. This means the percentage of
U.S. adults who smoke cigarettes is decreasing by
0.52% each year.
80. The slope is –0.28. This means the percentage of
U.S. taxpayers audited by the IRS is decreasing by
0.28% each year.
81. a. 30% of marriages in which the wife is under 18
when she marries end in divorce within the first
five years.
The percentage of America’s black population
that is foreign-born is increasing by 0.18 each
year. The rate of change is 0.18% per year..
b. C( x) 0.18x 3.1
c. C ( x) 0.18x 3.1
C(80) 0.18(80) 3.1
17.5
The percentage of America’s black population
that will be foreign-born in 2060 is 17.5%..
b. 50% of marriages in which the wife is under 18
when she marries end in divorce within the first
ten years.
85. 86.
P( x) 0.24 x 29 P( x) 0.24 x 30
87. – 104. Answers will vary.
y y 50 30 20 c. m 4
105.
y 2 x 4
x2 x1 10 5 5
There is an average increase of 4% of marriages
ending in divorce per year.
82. a. 15% of marriages in which the wife is over age
25 when she marries end in divorce within the
first five years.
b. 25% of marriages in which the wife is over age
25 when she marries end in divorce within the
first ten years.
Two points found using [TRACE] are 0, 4 and
2, 8 . y y 25 15 10
c. m 2
Section 2.4 Linear Functions and Slope Chapter 2 Functions and Linear Functions
x2 x1 10 5 5 m
8 4 4
2
There is an average increase of 2% of marriages
ending in divorce per year.
2 0 2 This is the same as the coefficient of x in the line’s equation.
Section 2.4 Linear Functions and Slope Chapter 2 Functions and Linear Functions
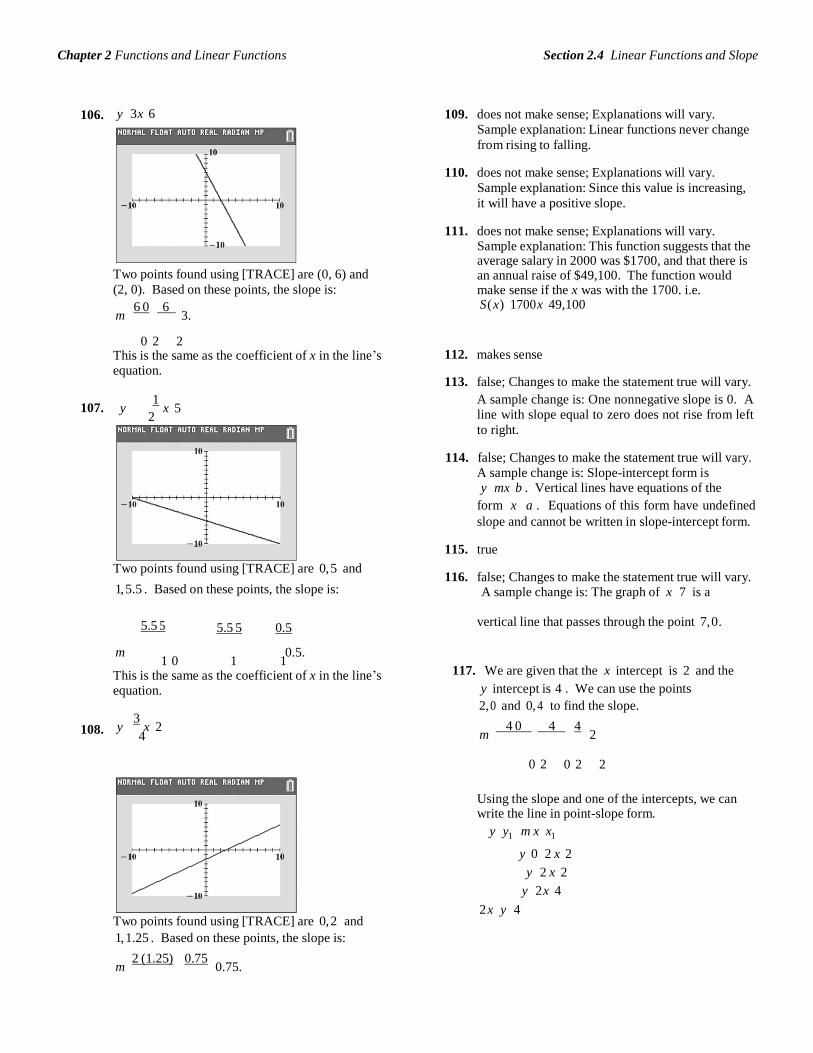
106. y 3x 6 Two points found using [TRACE] are (0, 6) and
(2, 0). Based on these points, the slope is:
m 6 0
6
3.
109. does not make sense; Explanations will vary.
Sample explanation: Linear functions never change
from rising to falling.
110. does not make sense; Explanations will vary.
Sample explanation: Since this value is increasing,
it will have a positive slope.
111. does not make sense; Explanations will vary. Sample explanation: This function suggests that the average salary in 2000 was $1700, and that there is an annual raise of $49,100. The function would make sense if the x was with the 1700. i.e. S ( x) 1700 x 49,100
0 2 2This is the same as the coefficient of x in the line’s equation.
112. makes sense
113. false; Changes to make the statement true will vary.
107. y 1
x 5 2
A sample change is: One nonnegative slope is 0. A
line with slope equal to zero does not rise from left
to right.
114. false; Changes to make the statement true will vary.
A sample change is: Slope-intercept form is y mx b . Vertical lines have equations of the
form x a . Equations of this form have undefined
slope and cannot be written in slope-intercept form.
Two points found using [TRACE] are 0, 5 and
1, 5.5 . Based on these points, the slope is:
115. true
116. false; Changes to make the statement true will vary. A sample change is: The graph of x 7 is a
5.5 5 5.5 5 0.5 vertical line that passes through the point 7, 0.
108.
m 0.5. 1 0 1 1
This is the same as the coefficient of x in the line’s equation.
y 3
x 2 4
117. We are given that the x intercept is 2 and the
y intercept is 4 . We can use the points
2, 0 and 0, 4 to find the slope.
m 4 0
4
4
2
0 2 0 2 2
Two points found using [TRACE] are 0, 2 and
1, 1.25 . Based on these points, the slope is:
m 2 (1.25)
0.75
0.75.
Using the slope and one of the intercepts, we can write the line in point-slope form.
y y1 m x x1
y 0 2 x 2y 2 x 2
y 2 x 4
2 x y 4
Section 2.4 Linear Functions and Slope Chapter 2 Functions and Linear Functions
0 1 1 This is equivalent to the coefficient of x in the line’s
equation.
Section 2.4 Linear Functions and Slope Chapter 2 Functions and Linear Functions
2
2 2 2
Find the x– and y–coefficients for the equation of
the line with right-hand-side equal to 12. Multiply 121. 8 107 4 103 32 104
both sides of 2 x y 4 by 3 to obtain 12 on the 3.2 101 10
4
right-hand-side. 2 x y 4 3.2 10
3
32 x y 346 x 3 y 12
The coefficients are –6 and 3.
122.
5 3 x 4 6 x
5 3x 12 6 x 5 3x 12 6 x
3x 17
118. We are given that the
slope is 1
. 2
y intercept is 6 and the 123.
y 5 7( x 4) y 5
7 x 28 y 7 x 33
So the equation of the line is y 1
x 6. 2
We can put this equation in the form ax by c to
find the missing coefficients.
y 1
x 6 2
y 1
x 6 2
124. y 3 7
( x 1) 3
y 3 7
x 7
3 3
y 3 3 7
x 7
3 3 3
7 2
2 y
1 x
2 6
y x
2 3 3
2 y x 12
x 2 y 12
125. a.
x 4 y 8 0
4 y x 8
Therefore, the coefficient of x is 1 and the coefficient of y is 2.
4 y 4
y
x 8
4
1 x 2
119. a.
b.
f x1 x2 m x1 x2 b
mx1 mx2 b
f x1 f x2
4
The slope is 1
. 4
mx1 b mx2 b
mx1 mx2 2b
1 b.
4 m2
1 m
1
1
c. no 4 2
m2 4
120.
4 x2 y 3
4 x2
y3 42 x2 y3 The slope of the second line is 4.
16 x4
y6
Section 2.5 The Point-Slope Form of the Equation of a Line Chapter 2 Functions and Linear Functions
2.5 Check Points Answers vary due to rounding and choice of point.
If point (40, 79.7) is chosen, f ( x) 0.17 x 72.9
1. Slope 2, passing through (4, 3) and the life expectancy of American women in 2020
Point-Slope Form is predicted to be 83.1 years.
y y1 m x x1 4. Since the line is parallel to
y 3x 1, we know it
y (3) 2 x 4 will have slope m 3. We are given that it passes
y 3 2 x 4Slope-Intercept Form
y 3 2 x 4y 3 2 x 8
y 2 x 5
f x 2 x 5
2. a. Passing through (6, 3) and (2, 5)
First, find the slope.
m 5 (3)
8
2
through (2, 5). We use the slope and point to write
the equation in point-slope form.
y y1 m x x1
y 5 3 x 2y 5 3 x 2
Solve for y to obtain slope-intercept form.
y 5 3 x 2y 5 3x 6
y 3x 11
f ( x) 3x 11
2 6 4Then use the slope and one of the points to write the equation in point-slope form.
y y1 m x x1 y 5 2 x 2
or
5. a. Solve the given equation for y to obtain slope-
intercept form. x 3 y 12
3 y x 12
1
y y1 m x x1 y x 4
3
y (3) 2 x 6y 3 2 x 6
b. Slope-Intercept Form
y 5 2 x 2y 5 2 x 4
y 2 x 9
f x 2 x 9
3. First, find the slope.
m 79.7 74.7
5
0.17 40 10 30
Then use the slope and one of the points to write the equation in point-slope form.
Using the point (10, 74.7):
y y1 m x x1 y 74.7 0.17 x 10
y 0.17 x 73
f ( x) 0.17 x 73
Since the slope of the given line is 1
, the 3
slope of any line perpendicular to the given line is 3.
b. We use the slope of 3 and the point (2, 6) to
write the equation in point-slope form.
y y1 m x x1
y 6 3 x 2y 6 3 x 2
Solve for y to obtain slope-intercept form.
y 6 3 x 2y 6 3x 6
y 3x f
( x) 3x
2.5 Concept and Vocabulary Check

Section 2.5 The Point-Slope Form of the Equation of a Line Chapter 2 Functions and Linear Functions
Next, since 2020 is 60 years after 1960, substitute 1. y y1 m( x x1 )
60 into the function: f (60) 0.17(60) 73 83.2.
This means that the life expectancy of American
women in 2020 is predicted to be 83.2 years.
2. equal/the same
3. 1
Section 2.5 The Point-Slope Form of the Equation of a Line Chapter 2 Functions and Linear Functions
1 4.
4. Slope 8, passing through (4,1)
5
5. 5 3
Point-Slope Form
y 1 8 x 4y 1 8 x 4
Slope-Intercept Form
6. 4 ; 4 y 1 8x 32
y 8x 33
7. 1
; 2 2
f x 8x 33
5. Slope 4, passing through (3, 2)
2.5 Exercise Set
Point-Slope Form
y y1 m x x1
1. Slope 3, passing through (2, 5) y 2 4 x 3
Point-Slope Form
y y1 m x x1 y 5 3 x 2
Slope-Intercept Form
y 5 3 x 2y 5 3x 6
y 2 4 x 3Slope-Intercept Form
y 2 4 x 3y 2 4 x 12
y 4 x 14
f x 4 x 14
y 3x 1 6. Slope 6, passing through (2, 4)
f x 3x 1 Point-Slope Form
y 4 6 x 22. Slope 4, passing through (3,1)
Point-Slope Form
y 1 4 x 3Slope-Intercept Form
y 1 4 x 3y 1 4 x 12
y 4 6 x 2Slope-Intercept Form y 4 6 x 12
y 6 x 16
f x 6 x 16
y 4 x 11
7. Slope 5, passing through (2, 0)
f x 4 x 11 Point-Slope Form
3. Slope
5, passing through (2, 6) y y1 m x x1
Point-Slope Form
y y1 m x x1
y 6 5 x 2y 6 5 x 2 Slope-
Intercept Form y 6 5 x 2y 6 5x 10
y 5x 16
f x 5x 16
Section 2.5 The Point-Slope Form of the Equation of a Line Chapter 2 Functions and Linear Functions
y 0 5 x 2y 0
5 x 2 Slope
-
Interc
ept
Form
y 0 5 x 2
y
5 x
2y 5x 10
f x 5x 10
Section 2.5 The Point-Slope Form of the Equation of a Line Chapter 2 Functions and Linear Functions
4
4
4
4
2 5
2
2 5
5
3
3
3
4
3
4 3
4 3
5
4
5
5
5
8. Slope
4, passing through (0, 3)
11. 1Slope
4 , passing through (0, 0)
Point-Slope Form
y 3 4 x 0 y 3 4 x 0 Slope-Intercept Form
y 3 4 x
y 4 x 3
f x 4 x 3
Point-Slope Form
y y1 m x x1 y 0 1 x 0
Slope-Intercept Form
y 0 1 x 0y 1 x f
x 1 x
9. Slope 1, passing through 2, 1
12.
Slope 1 , passing through 0, 0
Point-Slope Form
y y1 m x x1
Point-Slope Form
1 y 0
5 x 0
y 1 1 x 2y 1 1 x 2
Slope-Intercept Form
y 1
1 x 2
Slope-Intercept Form
y 1 x f
x 1 x
2 13. Slope 2 , passing through (6, 4)
y 1
x 2 2
y x 5
2
f x x 5
2
Point-Slope Form
y y1 m x x1 y 4 2 x 6 y 4 2 x 6
Slope-Intercept Form
10.
Slope 1, passing through 1 , 4 y 4 2 x 6
y 4 2 x 4Point-Slope Form
y 4 1x 1 y 4 1 x 1
3
y 2 x f
x 2 x
Slope-Intercept Form
y 4 x 1
14.
Slope
2 , passing through (15, 4)
4 Point-Slope Formy x 1 4
2 4
y x 17 y 4
5
2
x 15
4
f x x 17
y 4 5 x 15
Slope-Intercept Form
y 4 2 x 6
y 2 x 2
f x 2 x 2
Section 2.5 The Point-Slope Form of the Equation of a Line Chapter 2 Functions and Linear Functions
15. Passing through (6, 3) and (5, 2)
First, find the slope.
m 2 3
1
1
18. Passing through (2, 0) and (0, 1)
First, find the slope.
m 1 0
1
1
5 6 1 0 2 2 2
Then use the slope and one of the points to write the
equation in point-slope form. Then use the slope and one of the points to write the
equation in point-slope form.
y y1 m x x1 y 0 1
x 2 or y 1 1
x 0
y 3 1 x 6or
y 2 1 x 5Slope-Intercept Form
y 2 1 x 5y 2 x 5
y x 3
f x x 3
16. Passing through (1, 3) and (2, 4)
First, find the slope.
2 2
y 1 1
x 02
Slope-Intercept Form
y 1
x 1 2
f x 1
x 1 2
19. Passing through (6,13) and (2, 5)
First, find the slope.
m 5 13
8
8
22 6 2 6 4
m 4 3
1
1 2 1 1
Then use the slope and one of the points to write the
equation in point-slope form.
Then use the slope and one of the points to write the
equation in point-slope form.
y y1 m x x1
y 4 1 x 2 or y 3 1 x 1 y 5 2 x 2
Slope-Intercept Form y 4 1x 2
y x 2
f x x 2
17. Passing through (2, 0) and (0, 4)
First, find the slope.
m 4 0
4
2
y 5 2 x 2or
y 13 2 x 6y 13 2 x 6
Slope-Intercept Form
y 13 2 x 6y 13 2 x 12
0 2 2 y 2 x 1
Then use the slope and one of the points to write the
equation in point-slope form.
y y1 m x x1 y 4 2 x 0
f x 2 x 1 20. Passing through (3, 2) and (2, 8)
First, find the slope.
or m 8 2 10
10
2
y 0 2 x 2 2 3 2 3 5
y 0 2 x 2 Slope-Intercept Form y 0 2 x 2
Section 2.5 The Point-Slope Form of the Equation of a Line Chapter 2 Functions and Linear Functions
y 2 x 4
f x 2 x 4
Then use the slope and one of the points to write the equation in point-slope form.
y 8 2 x 2y 8 2 x 2
or
y 2 2 x (3)y 2 2 x 3
Section 2.5 The Point-Slope Form of the Equation of a Line Chapter 2 Functions and Linear Functions
x
x
Slope-Intercept Form
y 8 2 x 2y 8 2 x 4
Slope-Intercept Form
y 3 5
x 10 4 5
y 2 x 4 y x 13 4
f x 2 x 4
21. Passing through (1, 9) and (4, 2)
First, find the slope.
m 2 9
11
11
4 1 3 3
f x 5
x 13 4
23. Passing through (2, 5) and (3, 5)
First, find the slope.
5 5 0 m 0
Then use the slope and one of the points to write the equation in point-slope form.
y y1 m x x1
y 2 11
x 43
y 2 11
x 43
or
y 9 11
x 13
Slope-Intercept Form
y 9 11
x 13
y 9 11
x 11
3 3
y 11 38
3 2 5
Then use the slope and one of the points to write the
equation in point-slope form.
y y1 m x x1 y 5 0 x 3
y 5 0 x 3or
y 5 0 x 2y 5 0 x 2
Slope-Intercept Form
y 5 0 x 2y 5 0
y 5
f x 5
f x
3 3
11 38
3 3
24. Passing through (1, 4) and (3, 4)
First, find the slope.
4 4 0 m 0
22. Passing through (4, 8) and (8, 3) 3 1 4
First, find the slope. Then use the slope and one of the points to write the
3 8 3 8 5 equation in point-slope form.
m 8 4 4 4
Then use the slope and one of the points to write the equation in point-slope form.
y 3 5
x 84
y 3 5
x 84
or
y 8 5
x 44
y 8 5
x 44
y 4 0 x 1y 4 0 x 1
or
y 4 0 x 3y 4 0 x 3
Slope-Intercept Form
y 4 0
y 4
f x 4
Section 2.5 The Point-Slope Form of the Equation of a Line Chapter 2 Functions and Linear Functions
25. Passing through (7, 8) with x intercept 3 Then use the slope and one of the points to write the
If the line has an x intercept 3, it passes through
the point 3, 0.
First, find the slope.
m 8 0
8
2 7 3 4
Then use the slope and one of the points to write the equation in point-slope form.
equation in point-slope form.
y y1 m x x1
y 0 1
x 22
or
y 1 1
x 02 1
y y1 m x x1 y 1 x 02
y 0 2 x 3y 0 2 x 3
or
y 8 2 x 7Slope-Intercept Form
y 8 2 x 7y 8 2 x 14
y 2 x 6
f x 2 x 6
28.
Slope-Intercept Form
y 1 1
x 02
y 1 1
x 2
y 1
x 1 2
f x 1
x 1 2
x-intercept 2 and
y-intercept 4
26. Passing through (4, 5) and with y-intercept 3 If the line has an x-intercept 2, it passes through
If the line has a y-intercept 3, it passes through the point 2, 0. If the line has a y-intercept 4,
0, 3.
First, find the slope.
m 3 5
8
8
2
it passes through 0, 4.
First, find the slope.
m 4 0
4
2
0 4 0 4 4 0 2 2
Then use the slope and one of the points to write the
equation in point-slope form.
y 3 2 x 0y 3 2 x 0
or
y 5 2 x (4)y 5 2 x 4 Slope-
Intercept Form y 3 2
x
y 2 x 3
Then use the slope and one of the points to write the equation in point-slope form.
y 4 2 x 0
or
y 0 2 x (2)y 0 2 x 2 Slope-
Intercept Form y 4 2
x
y 2 x 4
f x 2 x 4
f x 2 x 3 29. For
y 5x,
m 5.
27.
x-intercept 2 and
y-intercept 1 a. A line parallel to this line would have the same
If the line has an x-intercept 2, it passes through slope, m 5.
Section 2.5 The Point-Slope Form of the Equation of a Line Chapter 2 Functions and Linear Functions
the point 2, 0. If the line has a
it passes through 0, 1.
y-intercept 1, b. A line perpendicular to it would have slope
1
First, find the slope.
m 1 0
1
1
m . 5
0 2 2 2
Section 2.5 The Point-Slope Form of the Equation of a Line Chapter 2 Functions and Linear Functions
.
.
30. a. Parallel: m 3 37. To find the slope, we rewrite the equation in slope-
intercept form.
b. Perpendicular: 1
m 3
4 x y 7
y 4 x 7
So, m 4.31. For y 7 x, m 7.
a. A line parallel to this line would have the samea. A line parallel to this line would have the same
slope, m 7.
b. A line perpendicular to it would have slope
m 1
. 7
slope, m 4.
b. A line perpendicular to it would have slope
m 1
. 4
38. 8 x y 1132. a. Parallel: m 9
y 8x 11
b. Perpendicular:
m 1 9
a. Parallel:
m 8
1
33. For y 1
x 3, 2
m 1
. 2
b. Perpendicular: m 8
a. A line parallel to this line would have the same
slope, m 1
. 2
39. To find the slope, we rewrite the equation in slope-
intercept form. 2 x 4 y 8
4 y 2 x 8
b. A line perpendicular to it would have slope m 2.
So, m
y 1
x 2 2
1 .
34. a. Parallel: m 1 4
2
a. A line parallel to this line would have the sameb. Perpendicular: m 4
slope, m 1
. 2
35. For y 2
x 1, 5
2 m
5 b. A line perpendicular to it would have slope
m 2.a. A line parallel to this line would have the same
slope, m 2 5
b. A line perpendicular to it would have slope
m 5
. 2
40. 3x 2 y 6
2 y 3x 6
y 3
x 3 2
3
36. a. Parallel:
3
m 7
a. Parallel: m 2
2
b. Perpendicular:
m 7 3
b. Perpendicular: m 3
Section 2.5 The Point-Slope Form of the Equation of a Line Chapter 2 Functions and Linear Functions
.
.
41. To find the slope, we rewrite the equation in slope- 45. Since L is parallel to y 2 x, we know it will have
intercept form. slope m 2. We are given that it passes through
2 x 3 y 5
3 y 2 x 5
y 2
x 5
3 3
So, m 2
. 3
a. A line parallel to this line would have the same
slope, m 2
. 3
b. A line perpendicular to it would have slope
(4, 2). We use the slope and point to write the
equation in point-slope form.
y y1 m x x1 y 2 2 x 4
Solve for y to obtain slope-intercept form.
y 2 2 x 4y 2 2 x 8
y 2 x 6
In function notation, the equation of the line is
f x 2 x 6.
3 m 46. L will have slope m 2 . Using the point and the
2 slope, we have y 4 2 x 3. Solve for y to
42. 3x 4 y 7
4 y 3x 7
y 3
x 7
4 4
obtain slope-intercept form. y 4 2 x 6
y 2 x 10
f x 2 x 10
a. Parallel: m
3 47. Since L is perpendicular to y 2 x, we know it will
4
b. Perpendicular: m 4
have slope m 1
2 through
We are given that it passes
43. We know that
3
x 6 is a vertical line with
(2, 4). We use the slope and point to write the equation in point-slope form.
y y1 m x x1
undefined slope.
a. A line parallel to it would also be vertical with
undefined slope.
b. A line perpendicular to it would be horizontal with slope m 0.
y 4 1
x 22
Solve for y to obtain slope-intercept form.
y 4 1
x 22
1
44.
y 9 is a horizontal line with slope m 0. y 4
2 x 1
a. Parallel:
m 0
y 1
x 5 2
b. Perpendicular:
m is undefined
In function notation, the equation of the line is
1
f x 2
x 5.
Section 2.5 The Point-Slope Form of the Equation of a Line Chapter 2 Functions and Linear Functions
5
48. L will have slope m 1
. 2
The line passes through y y1 m x x1
y 3 5 x 2
(–1, 2). Use the slope and point to write the equation in point-slope form.
y 2 1
x 12
y 2 1
x 12
Solve for y to obtain slope-intercept form.
y 2 1
x 1
2 2
y 3 5 x 2Solve for y to obtain slope-intercept form.
y 3 5 x 2y 3 5x 10
y 5x 7
In function notation, the equation of the line is
f x 5x 7.
y 1
x 1
2
52. L will have slope m 3.
The line passes through
2 2
y 1
x 5
2 2
f x 1
x 5
2 2
49. Since the line is parallel to
y 4 x 3, we know it
(–4, 2 ). We use the slope and point to write the
equation in point-slope form.
y 2 3 x 4y 2 3 x 4
Solve for y to obtain slope-intercept form. y 2 3x 12
will have slope m 4. We are given that it passes y 3x 10
through (–8, –10). We use the slope and point to
write the equation in point-slope form.
y y1 m x x1
y 10 4 x 8y 10 4 x 8
Solve for y to obtain slope-intercept form.
y 10 4 x 8y 10 4 x 32
f x 3x 10
53. To find the slope, we rewrite the equation in slope-
intercept form. 2 x 3 y 7
3 y 2 x 7
y 2
x 7
3 3
2 7
y 4 x 42
In function notation, the equation of the line is
Since the line is parallel to
2
y x , we know it 3 3
f x 4 x 42. will have slope m .
3 We are given that it passes
50. L will have slope m 5. The line passes through
through (–2, 2). We use the slope and point to write the equation in point-slope form.
(–2, –7). Use the slope and point to write the equation in point-slope form.
y 7 5 x 2y 7 5 x 2
Solve for y to obtain slope-intercept form. y 7 5x 10
y 5x 17
f x 5x 17
y y1 m x x1
y 2 2
x 23
y 2 2
x 23
Solve for y to obtain slope-intercept form.
y 2 2
x 23
y 2 2
x 4
3 3
51. Since the line is perpendicular to
y 1
x 6, we 2 10
y x
Section 2.5 The Point-Slope Form of the Equation of a Line Chapter 2 Functions and Linear Functions
3 3know it will have slope m 5. We are given that In function notation, the equation of the line is
it passes through (2, –3). We use the slope and point to write the equation in point-slope form. f x
2 x
10 .
3 3
Section 2.5 The Point-Slope Form of the Equation of a Line Chapter 2 Functions and Linear Functions
x
.
54. Find the slope. 3x 2 y 5
2 y 3x 5
y 3
x 5
2 2
56. Find the slope. x 7 y 12
7 y x 12
y 1 12
7 7
Since the lines are parallel, it will have slope Since the lines are perpendicular, the slope is m 7.
m 3
. 2
The line passes through (–1, 3 ). Use the The line passes through (5, –9). Use the slope and
point to write the equation in point-slope form.
slope and point to write the equation in point-slope
form.
y 3 3 x 12
y 3 3
x 12
Solve for y to obtain slope-intercept form.
y 3 3
x 3
2 2
y 3
x 3
3 2 2
y 3
x 9
y 9 7 x 5y 9 7 x 5
Solve for y to obtain slope-intercept form.
y 9 7 x 5y 9 7 x 35
y 7 x 44
f x 7 x 44 57. Since the line is perpendicular to x 6 which is a
vertical line, we know the graph of f is a horizontal
line with 0 slope. The graph of f passes through
2 2
f x 3
x 9
1, 5 , so the equation of f is f x 5.
2 2
55. To find the slope, we rewrite the equation in slope-
intercept form.
58. Since the line is perpendicular to x 4 which is a
vertical line, we know the graph of f is a horizontal
line with 0 slope. The graph of f passes through
x 2 y 3
2 y x 3
2, 6 , so the equation of f is f x 6.
59. First we need to find the slope of the line with
y 1
x 3 x intercept of 2 and y intercept of 4. This
2 2
Since the line is perpendicular to
know it will have slope m 2.
y 1
x 3
, we 2 2
We are given that
line will pass through 2, 0 and 0, 4.
these points to find the slope.
m 4 0
4
2
We use
it passes through (4, –7). We use the slope and point to write the equation in point-slope form.
y y1 m x x1 y 7 2 x 4
0 2 2 Since the graph of f is perpendicular to this line, it
will have slope m 1 2
y 7 2 x 4Solve for y to obtain slope-intercept form.
y 7 2 x 4y 7 2 x 8
y 2 x 1
In function notation, the equation of the line is
f x 2 x 1.
Use the point 6, 4 and the slope 1
2 equation of the line.
to find the
Section 2.5 The Point-Slope Form of the Equation of a Line Chapter 2 Functions and Linear Functions
.
x
x
y y1 m x x1
y 4 1 x 6
2
y 4 1
x 62
y 4 1
x 3 2
62. First put the equation 4 x y 6 in slope-intercept
form. 4 x y 6
y 4 x 6
y 4 x 6
The equation of f will have slope 1
since it is 4
y
f x
1 x 1
2
1 x 1
perpendicular to the line above and the same y intercept 6.
1
So the equation of f is 2
f x 4
x 6.
60. First we need to find the slope of the line with 63. The graph of f is just the graph of g shifted down
x intercept of 3 and y intercept of 9. This 2 units. So subtract 2 from the equation of g x to
line will pass through 3, 0 and 0, 9. We use obtain the equation of f x.
these points to find the slope.
m 9 0
9
3
f x g x 2 4 x 3 2 4 x 5
0 3 3 Since the graph of f is perpendicular to this line, it
64. The graph of f is just the graph of g shifted up 3
units. So add 3 to the equation of g x to obtain
will have slope m 1
3
the equation of
f x.
Use the point 5, 6 and the slope 1
3 equation of the line.
y y1 m x x1
to find the f x g x 3 2 x 5 3 2 x 2
65. To find the slope of the line whose equation is
Ax By C, put this equation in slope-intercept
y 6 1 x 5
3
y 6 1
x 5
form by solving for y.
Ax By C
By Ax C
3
y 6 1
x 5
3 3
y 1 13 3 3
y A
x C
B B
The slope of this line is m A
so the slope of the B
A
f x 1 13
3 3
line that is parallel to it is the same, . B
66. From exercise 65, we know the slope of the line is
61. First put the equation 3x 2 y 4 in slope-intercept
form.
3x 2 y 4
A
. So the slope of the line that is perpendicular B
2 y 3x 4

Section 2.5 The Point-Slope Form of the Equation of a Line Chapter 2 Functions and Linear Functions
y 3
x 2 2
The equation of f will have slope 2 3
since it is
would be B
. A
perpendicular to the line above and the same y intercept 2.
So the equation of f is f x
2 x 2. 3
Section 2.5 The Point-Slope Form of the Equation of a Line Chapter 2 Functions and Linear Functions
67. a. First, find the slope using 20, 38.9 and
30, 47.8.
m 47.8 38.9
8.9
0.89 30 20 10
Then use the slope and one of the points to write the equation in point-slope form.
y y1 m x x1 y 47.8 0.89 x 30
or
y 38.9 0.89 x 20
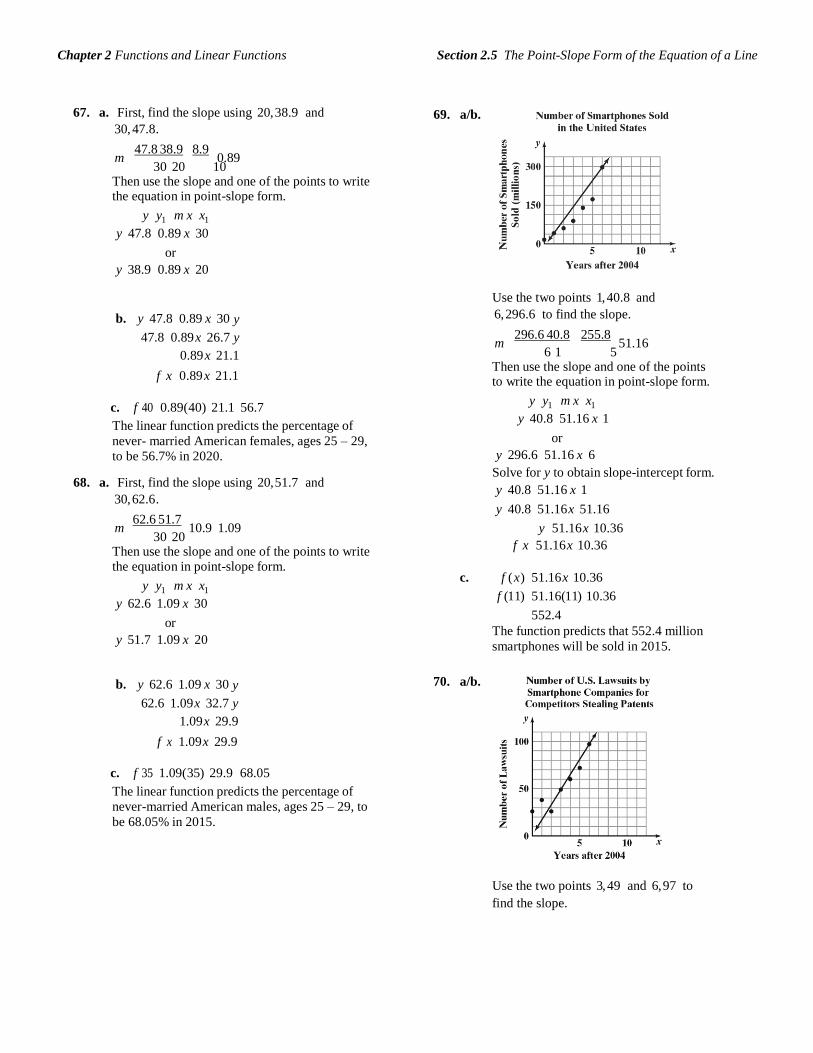
69. a/b.
Use the two points 1, 40.8 and
b. y 47.8 0.89 x 30 y
47.8 0.89 x 26.7 y
0.89 x 21.1
f x 0.89 x 21.1
c. f 40 0.89(40) 21.1 56.7
The linear function predicts the percentage of
never- married American females, ages 25 – 29,
to be 56.7% in 2020.
68. a. First, find the slope using 20, 51.7 and
30, 62.6.
m 62.6 51.7
10.9 1.09 30 20
Then use the slope and one of the points to write the equation in point-slope form.
y y1 m x x1 y 62.6 1.09 x 30
or
y 51.7 1.09 x 20
6, 296.6 to find the slope.
m 296.6 40.8
255.8
51.16 6 1 5
Then use the slope and one of the points to write the equation in point-slope form.
y y1 m x x1 y 40.8 51.16 x 1
or
y 296.6 51.16 x 6Solve for y to obtain slope-intercept form.
y 40.8 51.16 x 1y 40.8 51.16 x 51.16
y 51.16 x 10.36
f x 51.16 x 10.36
c. f ( x) 51.16 x 10.36
f (11) 51.16(11) 10.36
552.4
The function predicts that 552.4 million
smartphones will be sold in 2015.
b. y 62.6 1.09 x 30 y
62.6 1.09 x 32.7 y
1.09 x 29.9
f x 1.09 x 29.9
c. f 35 1.09(35) 29.9 68.05
The linear function predicts the percentage of
never-married American males, ages 25 – 29, to
be 68.05% in 2015.
70. a/b.
Use the two points 3, 49 and 6, 97 to
find the slope.
Section 2.5 The Point-Slope Form of the Equation of a Line Chapter 2 Functions and Linear Functions
m 97 49
48
16 6 3 3
Then use the slope and one of the points to write the equation in point-slope form.
y y1 m x x1 y 49 16 x 3
or
y 97 16 x 6Solve for y to obtain slope-intercept form. y 49 16( x 3)
y 49 16 x 48
y 16 x 1
f ( x) 16 x 1
73. – 79. Answers will vary.
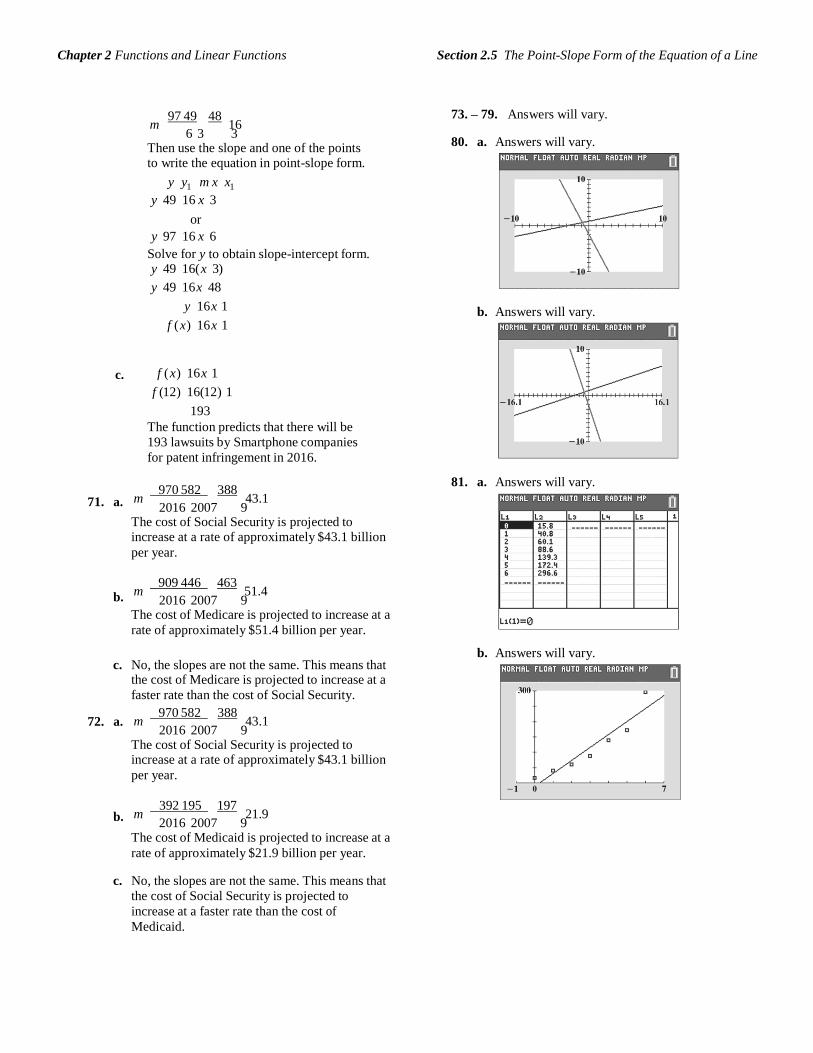
80. a. Answers will vary.
b. Answers will vary.
c.
71. a.
b.
f ( x) 16 x 1
f (12) 16(12) 1
193
The function predicts that there will be
193 lawsuits by Smartphone companies
for patent infringement in 2016.
m 970 582
388
43.1 2016 2007 9
The cost of Social Security is projected to increase at a rate of approximately $43.1 billion
per year.
m 909 446
463
51.4 2016 2007 9
The cost of Medicare is projected to increase at a
rate of approximately $51.4 billion per year.
81. a. Answers will vary.
b. Answers will vary.c. No, the slopes are not the same. This means that
the cost of Medicare is projected to increase at a
faster rate than the cost of Social Security.
72. a.
b.
m 970 582
388
43.1 2016 2007 9
The cost of Social Security is projected to increase at a rate of approximately $43.1 billion
per year.
m 392 195
197
21.9 2016 2007 9
The cost of Medicaid is projected to increase at a
rate of approximately $21.9 billion per year.
c. No, the slopes are not the same. This means that
the cost of Social Security is projected to
increase at a faster rate than the cost of
Medicaid.
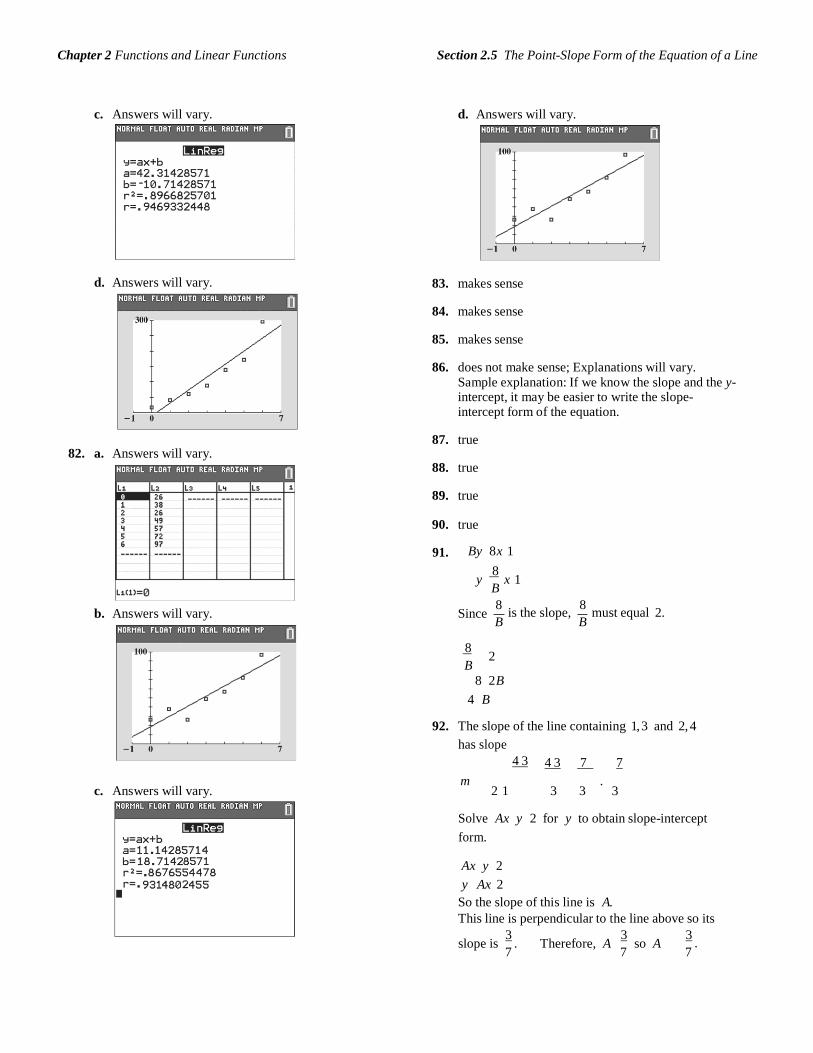
Section 2.5 The Point-Slope Form of the Equation of a Line Chapter 2 Functions and Linear Functions
.
c. Answers will vary.
d. Answers will vary.
82. a. Answers will vary.
d. Answers will vary.
83. makes sense
84. makes sense
85. makes sense
86. does not make sense; Explanations will vary. Sample explanation: If we know the slope and the y- intercept, it may be easier to write the slope- intercept form of the equation.
87. true
88. true
89. true 90. true
91. By 8x 1
y 8
x 1 B
8 8b. Answers will vary. Since is the slope,
B must equal 2.
B
8 2
B 8 2B
4 B
92. The slope of the line containing 1, 3 and 2, 4has slope
4 3 4 3 7 7
m .c. Answers will vary. 2 1 3 3 3
Solve
form.
Ax y 2 for y to obtain slope-intercept
Ax y 2
y Ax 2
So the slope of this line is A.
This line is perpendicular to the line above so its
slope is 3
. 7
Therefore, A 3 7
so A 3 7
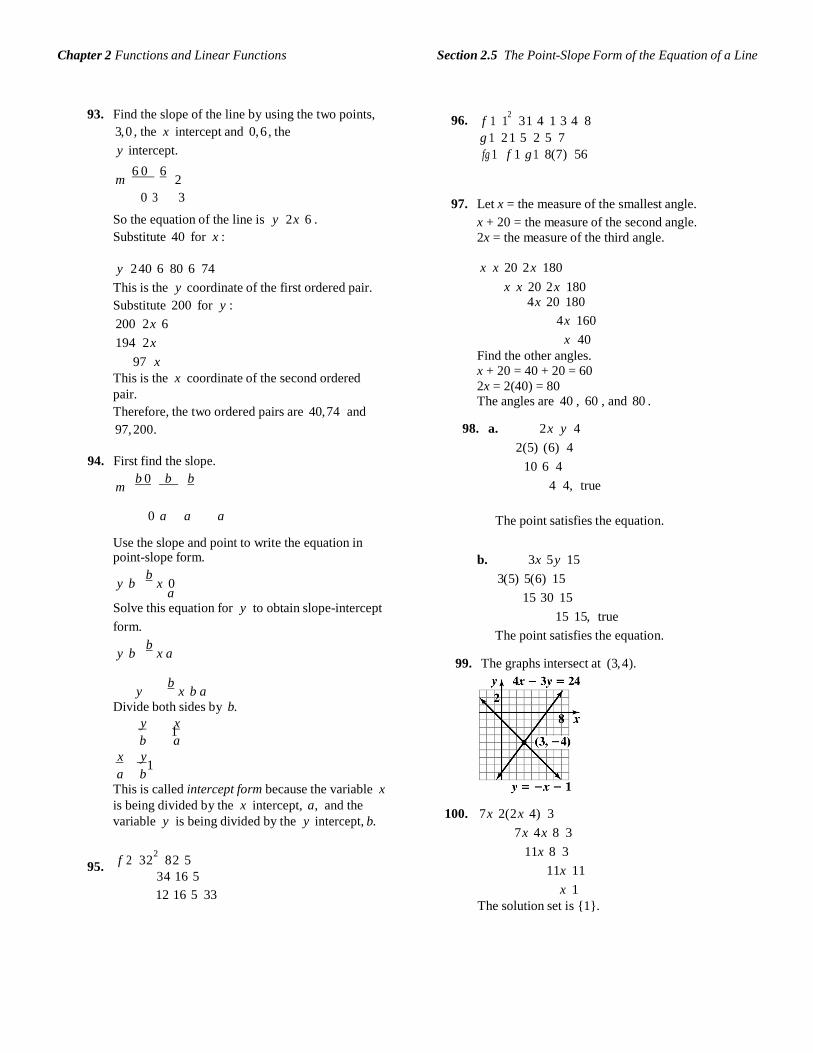
Section 2.5 The Point-Slope Form of the Equation of a Line Chapter 2 Functions and Linear Functions
93. Find the slope of the line by using the two points,
3, 0 , the x intercept and 0, 6 , the
y intercept.
m 6 0
6
2
96. f 1 12
31 4 1 3 4 8
g 1 2 1 5 2 5 7
fg 1 f 1 g 1 8(7) 56
0 3 3
97. Let x = the measure of the smallest angle.
So the equation of the line is
Substitute 40 for x :
y 2 x 6 . x + 20 = the measure of the second angle.
2x = the measure of the third angle.
y 2 40 6 80 6 74
This is the y coordinate of the first ordered pair.
Substitute 200 for y :
200 2 x 6
194 2 x
97 x
This is the x coordinate of the second ordered
pair.
Therefore, the two ordered pairs are 40, 74 and
97, 200.
94. First find the slope.
m b 0
b
b
x x 20 2 x 180
x x 20 2 x 180 4 x 20 180
4 x 160
x 40
Find the other angles.
x + 20 = 40 + 20 = 60
2x = 2(40) = 80 The angles are 40 , 60 , and 80 .
98. a. 2 x y 4
2(5) (6) 4
10 6 4
4 4, true
0 a a a The point satisfies the equation.
Use the slope and point to write the equation in point-slope form.
y b b
x 0a
Solve this equation for y to obtain slope-intercept
form.
y b b
x a
b. 3x 5 y 15
3(5) 5(6) 15
15 30 15
15 15, true
The point satisfies the equation.
99. The graphs intersect at (3, 4).
y b
x b a
95.
Divide both sides by b.
y x 1
b a
x y 1
a b This is called intercept form because the variable x
is being divided by the x intercept, a, and the
variable y is being divided by the y intercept, b.
f 2 322
8 2 5
34 16 5
12 16 5 33
100. 7 x 2(2 x 4) 3
7 x 4 x 8 3
11x 8 3
11x 11
x 1
The solution set is {1}.
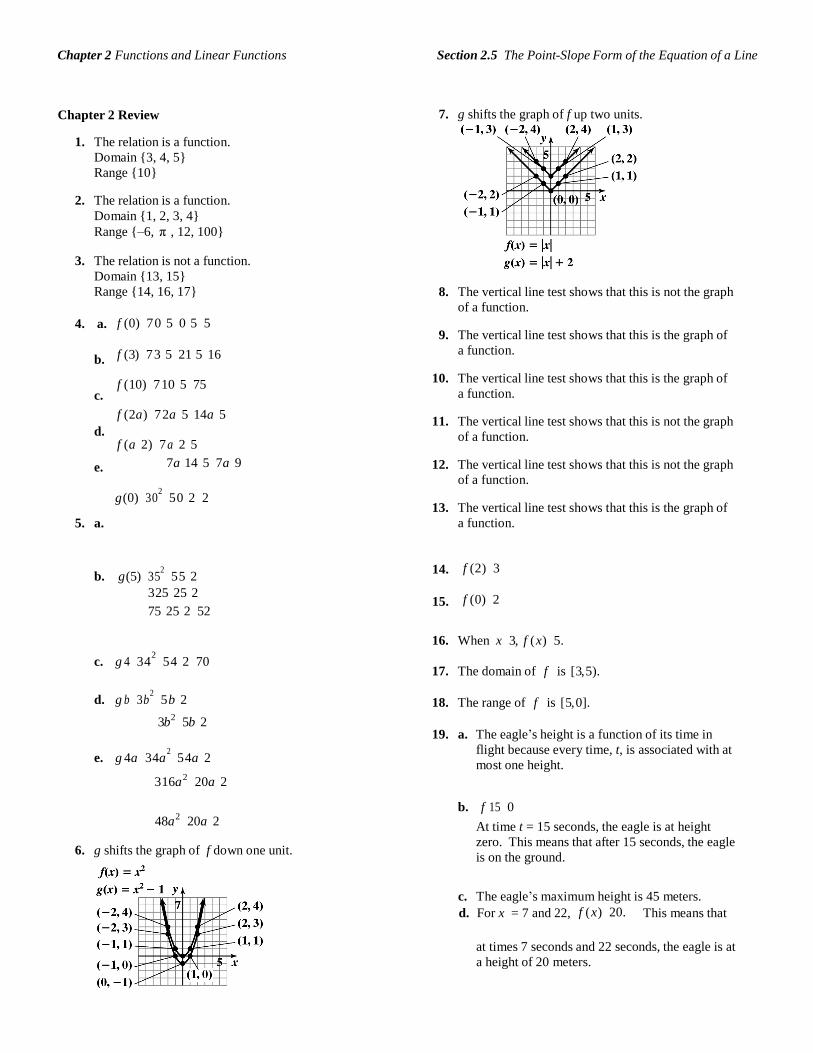
Section 2.5 The Point-Slope Form of the Equation of a Line Chapter 2 Functions and Linear Functions
Chapter 2 Review
1. The relation is a function.
Domain {3, 4, 5}
Range {10}
2. The relation is a function.
Domain {1, 2, 3, 4}
Range {–6, π , 12, 100}
3. The relation is not a function.
Domain {13, 15}
Range {14, 16, 17}
7. g shifts the graph of f up two units.
8. The vertical line test shows that this is not the graph
of a function.
4. a.
b.
c.
d.
e.
5. a.
f (0) 7 0 5 0 5 5
f (3) 7 3 5 21 5 16 f (10) 7 10 5 75 f (2a) 7 2a 5 14a 5 f (a 2) 7 a 2 5
7a 14 5 7a 9
g (0) 302
5 0 2 2
9. The vertical line test shows that this is the graph of
a function.
10. The vertical line test shows that this is the graph of
a function.
11. The vertical line test shows that this is not the graph
of a function.
12. The vertical line test shows that this is not the graph
of a function.
13. The vertical line test shows that this is the graph of
a function.
b. g (5) 352
5 5 2
325 25 2
75 25 2 52
14.
15.
f (2) 3
f (0) 2
c. g 4 342
5 4 2 70
d. g b 3b
2 5 b 2
3b2
5b 2
e. g 4a 34a 2
5 4a 2
316a 2 20a 2
16. When x 3, f ( x) 5.
17. The domain of f is [3, 5).
18. The range of f is [5, 0].
19. a. The eagle’s height is a function of its time in
flight because every time, t, is associated with at
most one height.
48a 2
20a 2
6. g shifts the graph of f down one unit.
b. f 15 0
At time t = 15 seconds, the eagle is at height
zero. This means that after 15 seconds, the eagle
is on the ground.
c. The eagle’s maximum height is 45 meters.
d. For x = 7 and 22, f ( x) 20. This means that
at times 7 seconds and 22 seconds, the eagle is at
a height of 20 meters.
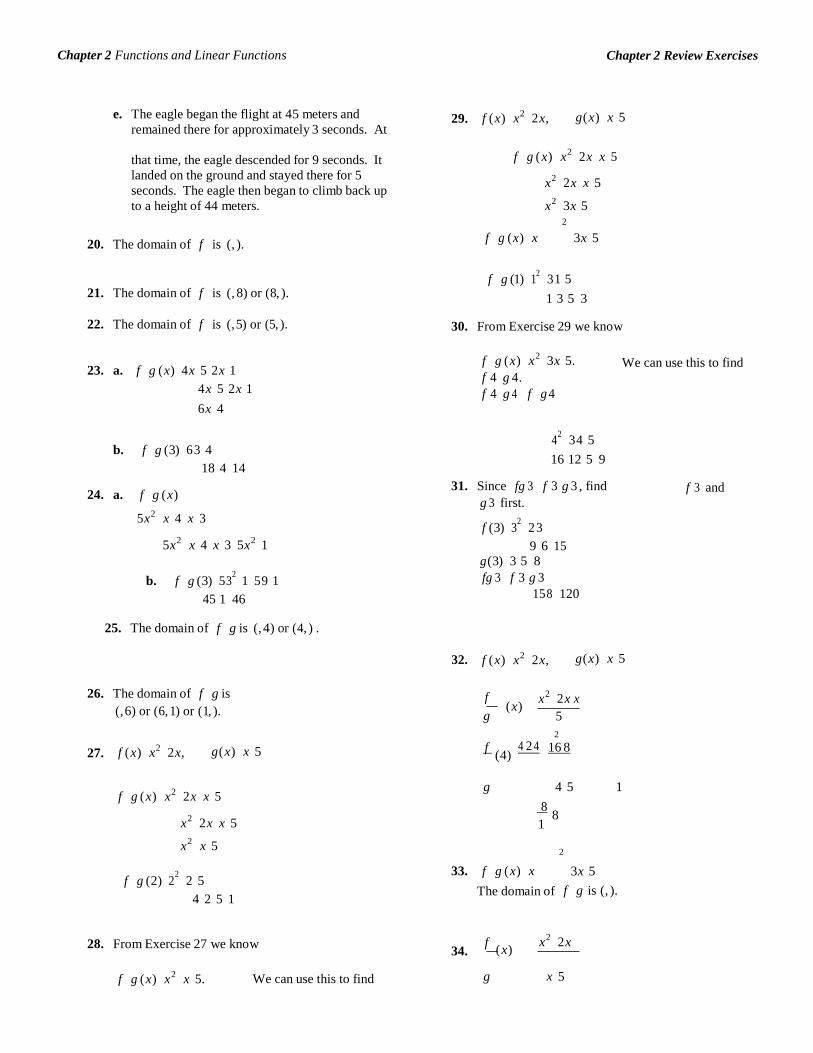
Chapter 2 Review Exercises Chapter 2 Functions and Linear Functions
e. The eagle began the flight at 45 meters and
remained there for approximately 3 seconds. At 29. f ( x) x
2 2 x, g ( x) x 5
that time, the eagle descended for 9 seconds. It
landed on the ground and stayed there for 5
seconds. The eagle then began to climb back up
to a height of 44 meters.
f g ( x) x2 2 x x 5
x2
2 x x 5
x2
3x 5 2
20. The domain of f is (, ). f g ( x) x 3x 5
21. The domain of f is (, 8) or (8, ).
22. The domain of f is (, 5) or (5, ).
f g (1) 12
31 5
1 3 5 3
30. From Exercise 29 we know
23. a. f g ( x) 4 x 5 2 x 1 4 x 5 2 x 1
6 x 4
f g ( x) x2
3x 5.
f 4 g 4.
f 4 g 4 f g 4
We can use this to find
b. f g (3) 6 3 4
18 4 14
24. a. f g ( x)
5x2 x 4 x 3
5x2
x 4 x 3 5x2
1
b. f g (3) 5 32
1 5 9 1
45 1 46
25. The domain of f g is (, 4) or (4, ) .
42
34 5
16 12 5 9
31. Since fg 3 f 3 g 3 , find
g 3 first.
f (3) 32
2 3 9 6 15
g (3) 3 5 8
fg 3 f 3 g 3 15 8 120
f 3 and
32. f ( x) x2 2 x, g ( x) x 5
26. The domain of f g is
(, 6) or (6, 1) or (1, ). f
g
( x)
x2
2 x x
5
2
27. f ( x) x2
2 x, g ( x) x 5 f (4)
4 2 4 16 8
f g ( x) x2 2 x x 5
x2
2 x x 5
x2
x 5
g 4 5 1
8 8
1
2
f g (2) 22
2 5
4 2 5 1
33. f g ( x) x
The domain of
3x 5
f g is (, ).
28. From Exercise 27 we know 34.
f
( x)
x2
2 x
f g ( x) x2
x 5. We can use this to find g x 5
Chapter 2 Review Exercises Chapter 2 Functions and Linear Functions
f 3 g 3.
f 3 g 3 f g 3
32
3 5
9 3 5 1
The domain of f
is (, 5) or (5, ). g
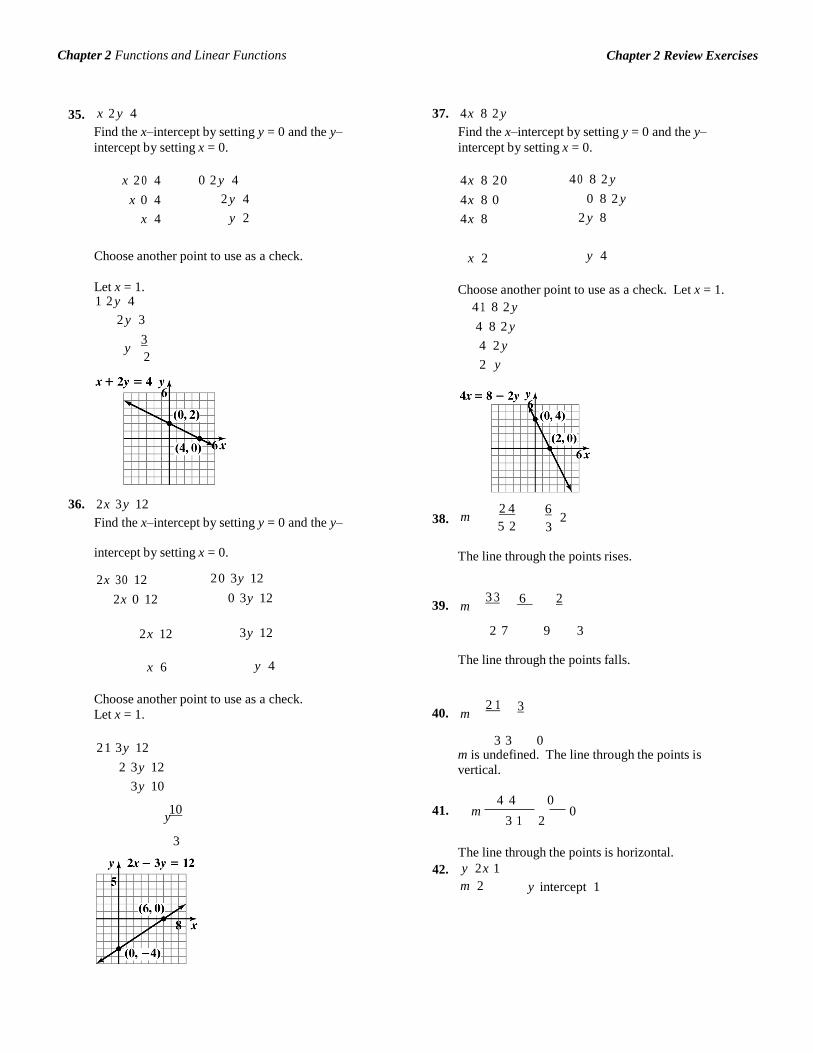
Chapter 2 Review Exercises Chapter 2 Functions and Linear Functions
35. x 2 y 4
Find the x–intercept by setting y = 0 and the y–
intercept by setting x = 0.
37. 4 x 8 2 y
Find the x–intercept by setting y = 0 and the y–
intercept by setting x = 0.
x 2 0 4
x 0 4
x 4
0 2 y 4
2 y 4
y 2
4 x 8 2 04 x 8 0
4 x 8
4 0 8 2 y
0 8 2 y
2 y 8
Choose another point to use as a check. x 2 y 4
Let x = 1. 1 2 y 4
2 y 3
y 3 2
Choose another point to use as a check. Let x = 1.
4 1 8 2 y
4 8 2 y
4 2 y
2 y
36. 2 x 3 y 12
Find the x–intercept by setting y = 0 and the y–
38.
2 4m
5 2
6 2 3
intercept by setting x = 0. The line through the points rises.
2 x 30 12
2 x 0 12
2 0 3 y 12
0 3 y 12
39.
3 3 6 2 m
2 x 12 3 y 12 2 7 9 3
x 6 y 4 The line through the points falls.
Choose another point to use as a check.
Let x = 1.
40.
2 1 3 m
2 1 3 y 12
2 3 y 12
3 y 10
3 3 0 m is undefined. The line through the points is
vertical.
4 4 010
y 41. m 0
3 1 2
3 The line through the points is horizontal.
42. y 2 x 1
m 2
y intercept 1
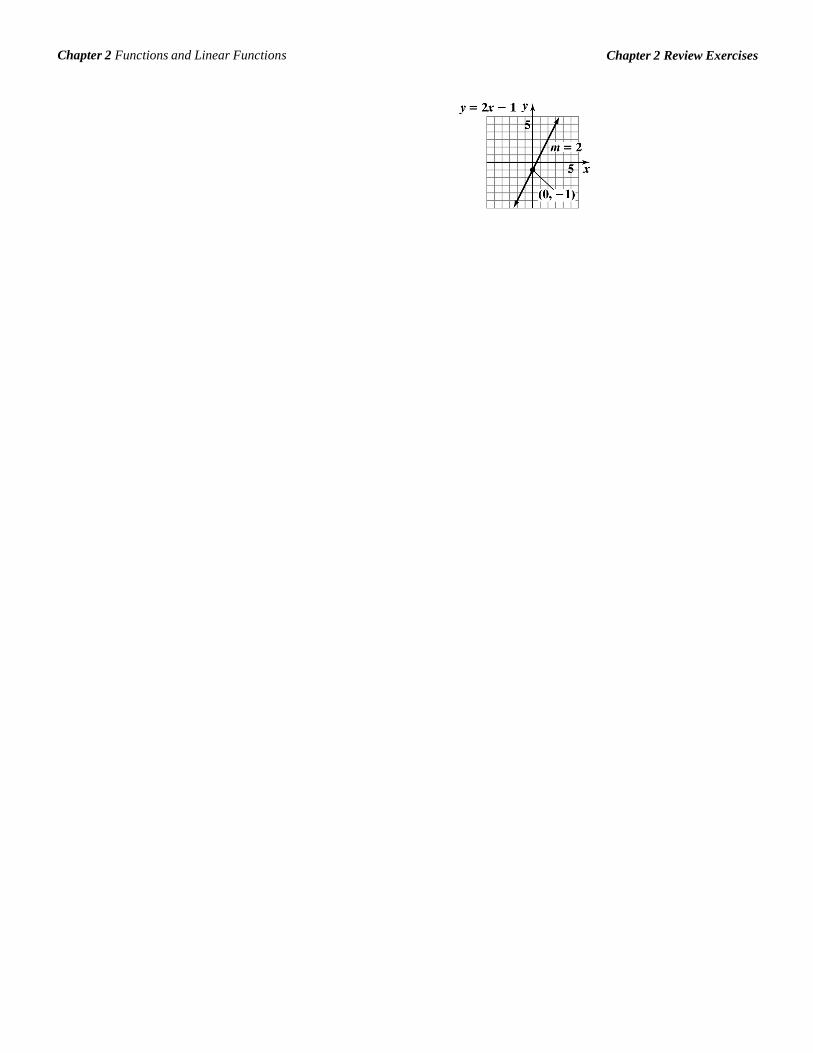
Chapter 2 Review Exercises Chapter 2 Functions and Linear Functions
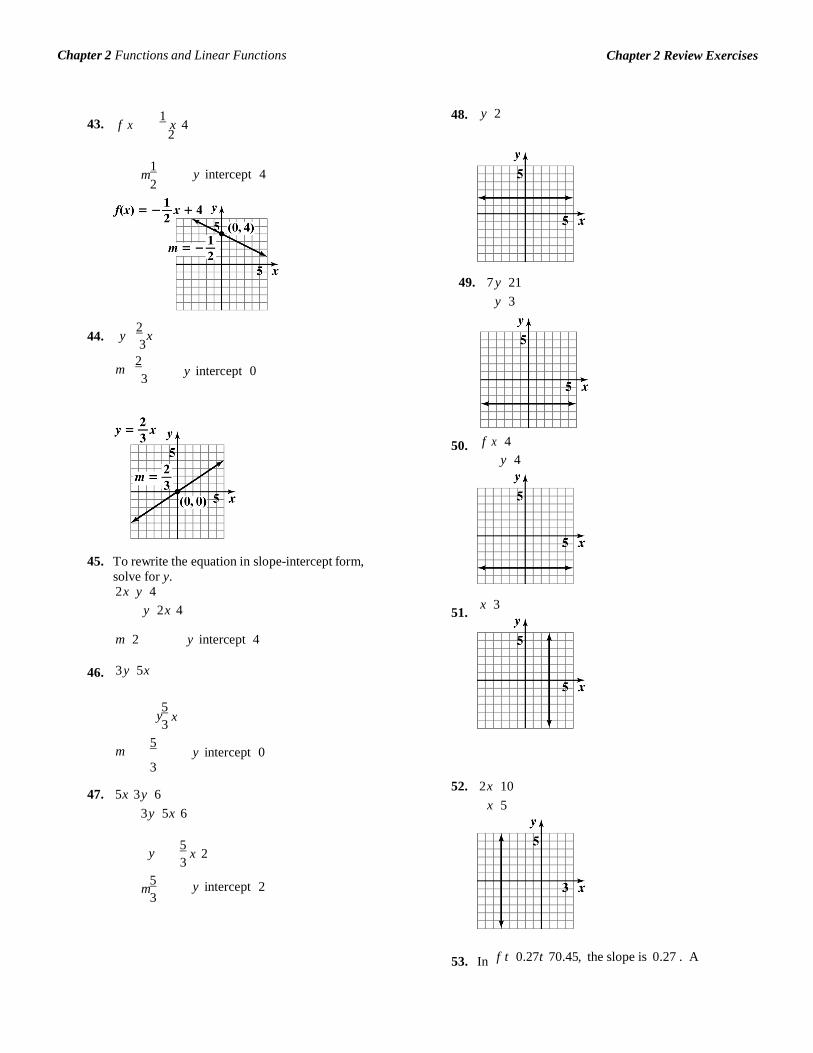
Chapter 2 Review Exercises Chapter 2 Functions and Linear Functions
x
43. f x 1
x 4 2
48. y 2
1 m
2
y intercept 4
49. 7 y 21
y 3
44. y 2
x 3
m 2 3
y intercept 0
45. To rewrite the equation in slope-intercept form,
solve for y. 2 x y 4
y 2 x 4
50.
51.
f x 4
y 4
x 3
46.
m 2
3 y 5x
y intercept 4
5 y 3
m 5
y intercept 0
3
47. 5x 3 y 6
3 y 5x 6
52. 2 x 10
x 5
y
5 m
3
5 x 2
3
y intercept 2
53. In
f t 0.27t 70.45, the slope is 0.27 . A
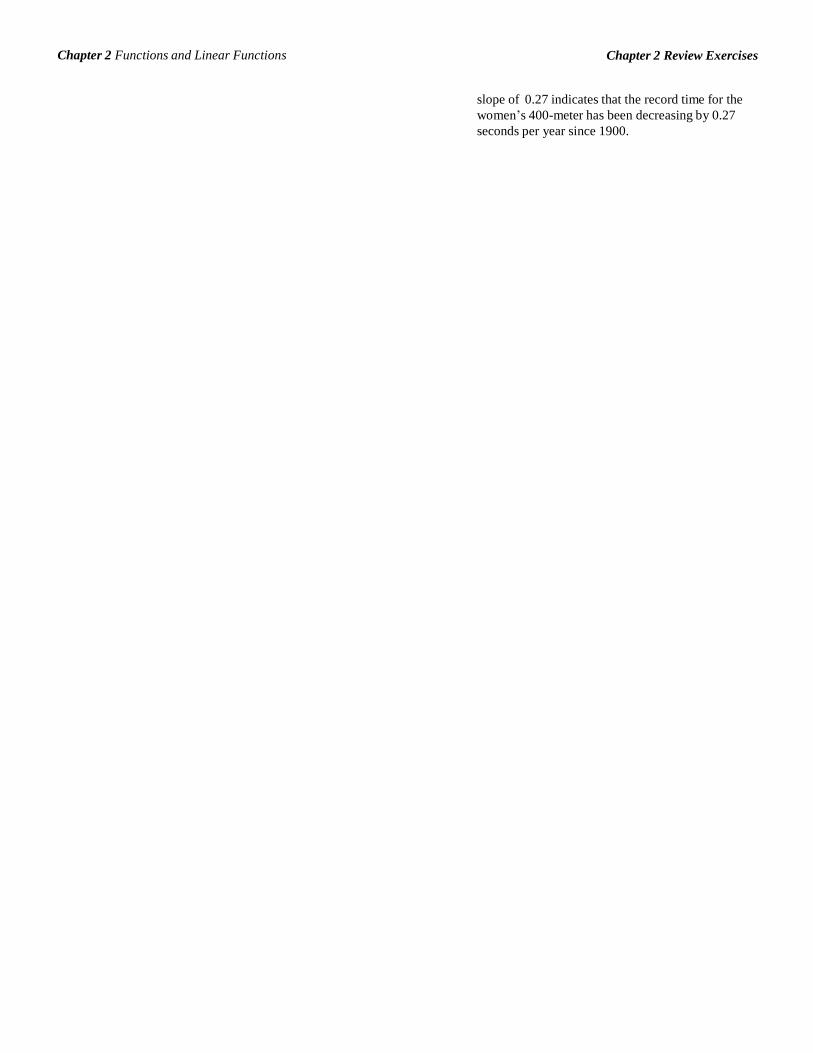
Chapter 2 Review Exercises Chapter 2 Functions and Linear Functions
slope of 0.27 indicates that the record time for the
women’s 400-meter has been decreasing by 0.27
seconds per year since 1900.

Chapter 2 Review Exercises Chapter 2 Functions and Linear Functions
54. a. m 1163 617
546
137 1998 1994 4
There was an average increase of approximately
137 discharges per year.
Then use the slope and one of the points to write the
equation in point-slope form.
y y1 m x x1 y 6 2 x 1
or
b. m 623 1273
650
130
y y
m x x
2006 2001 5 There was an average decrease of approximately
130 discharges per year.
55. a. Find the slope of the line by using the two points
(0, 32) and (100,212).
m 212 32
180
9
100 0 100 5 We use the slope and one of the points to write the equation in point-slope form.
y y1 m x x1
1 1
y 2 2 x 1y 2 2 x 1
Slope-Intercept Form
y 6 2 x 1y 6 2 x 2
y 2 x 4
f ( x) 2 x 4
58. Rewrite 3x y 9 in slope-intercept form.
3x y 9
y 32 9
x 05
y 32 9
x
y 3x 9
Since the line we are concerned with is parallel to
5 this line, we know it will have slope m 3. We
y 9
x 32 5
F 9
C 32 5
b. Let C 30 .
F 9
30 32 54 32 86 5
The Fahrenheit temperature is 86 when the
Celsius temperature is 30 .
are given that it passes through (4, –7). We use the slope and point to write the equation in point-slope form.
y y1 m x x1 y 7 3 x 4 y 7 3 x 4
Solve for y to obtain slope-intercept form.
y 7 3 x 4y 7 3x 12
y 3x 5
56. Slope 6, passing through (3, 2) In function notation, the equation of the line is
Point-Slope Form
y y1 m x x1
y 2 6 x 3
f x 3x 5. 59. The line is perpendicular to
y 1
x 4, so the 3
y 2 6 x 3Slope-Intercept Form
slope is –3. We are given that it passes through
(–2, 6). We use the slope and point to write the
equation in point-slope form.y 2 6 x 3 y y
m x x
y 2 6 x 18
y 6 x 16
f ( x) 6 x 16
57. Passing through (1, 6) and (1, 2)
First, find the slope.
m 6 2
4
2
1 1
y 6 3 x 2y 6 3 x 2
Solve for y to obtain slope-intercept form.
y 6 3 x 2y 6 3x 6
y 3x
In function notation, the equation of the line is
1 1 2 f x 3x.
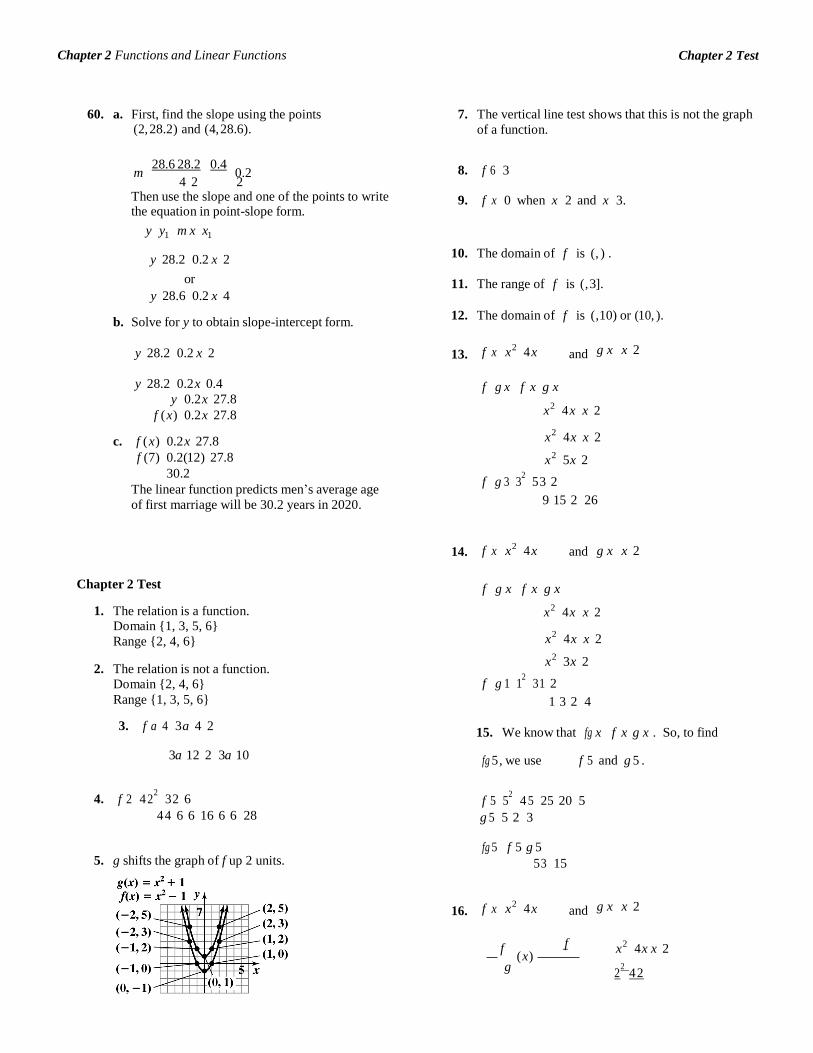
Chapter 2 Test Chapter 2 Functions and Linear Functions
60. a. First, find the slope using the points (2, 28.2) and (4, 28.6).
7. The vertical line test shows that this is not the graph
of a function.
m 28.6 28.2
0.4
0.2 4 2 2
Then use the slope and one of the points to write the equation in point-slope form.
y y1 m x x1
8. f 6 3 9. f x 0 when x 2 and x 3.
y 28.2 0.2 x 2or
y 28.6 0.2 x 4
b. Solve for y to obtain slope-intercept form.
10. The domain of f is (, ) .
11. The range of f is (, 3].
12. The domain of f is (,10) or (10, ).
y 28.2 0.2 x 2 13. f x x2 4 x and g x x 2
y 28.2 0.2 x 0.4
y 0.2 x 27.8
f ( x) 0.2 x 27.8
c. f ( x) 0.2 x 27.8
f (7) 0.2(12) 27.8
30.2
The linear function predicts men’s average age
of first marriage will be 30.2 years in 2020.
f g x f x g x
x2 4 x x 2
x2
4 x x 2
x2
5x 2
f g 3 32
5 3 2
9 15 2 26
14. f x x2 4 x and g x x 2
Chapter 2 Test
1. The relation is a function. Domain {1, 3, 5, 6}
Range {2, 4, 6}
2. The relation is not a function.
Domain {2, 4, 6}
Range {1, 3, 5, 6}
3. f a 4 3a 4 2
f g x f x g x
x2 4 x x 2
x2
4 x x 2
x2
3x 2
f g 1 12
31 2
1 3 2 4
15. We know that fg x f x g x . So, to find
3a 12 2 3a 10 fg 5 , we use f 5 and g 5 .
4. f 2 4 22
32 6
4 4 6 6 16 6 6 28
f 5 52
4 5 25 20 5
g 5 5 2 3
5. g shifts the graph of f up 2 units.
fg 5 f 5 g 5 5 3 15
16. f x x2 4 x and g x x 2
f
g ( x)
f x2
4 x x 2
22
4 2
Chapter 2 Test Chapter 2 Functions and Linear Functions
4 8 12
(2) 3
6. The vertical line test shows that this is the graph of
a function.
g 2 2 4 4
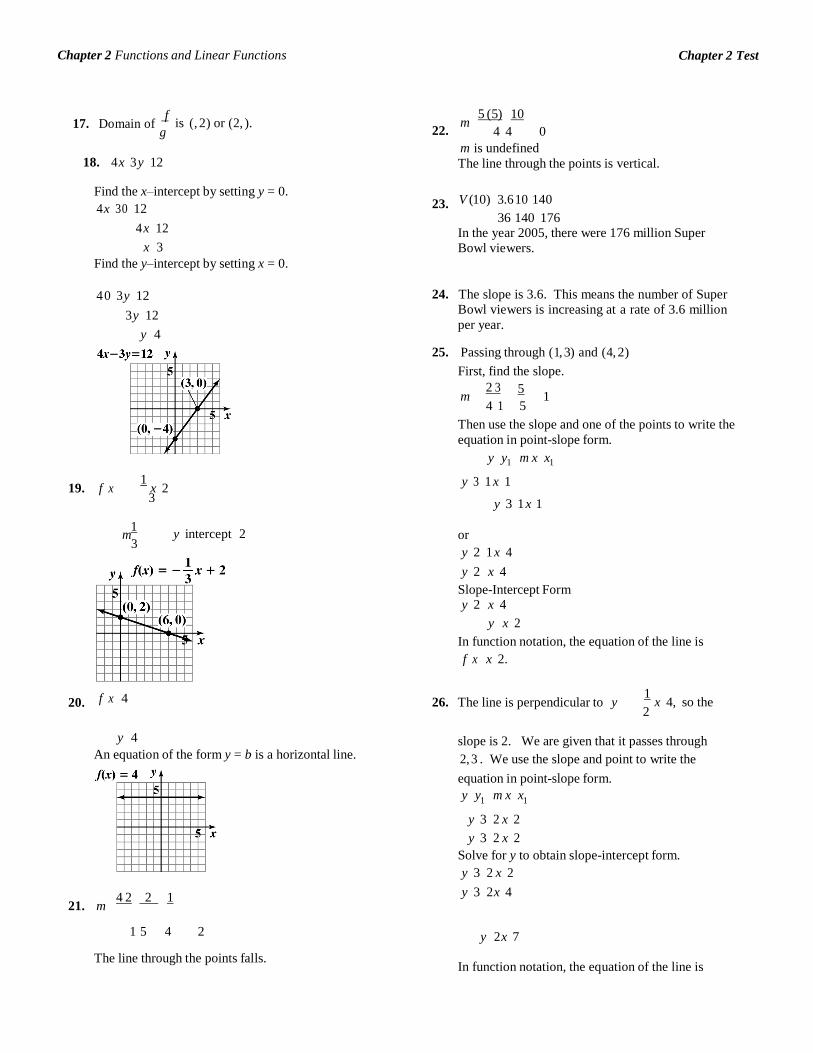
Chapter 2 Test Chapter 2 Functions and Linear Functions
17. Domain of f g
18. 4 x 3 y 12
is (, 2) or (2, ). 22.
m 5 (5)
10
4 4 0
m is undefined
The line through the points is vertical.
Find the x–intercept by setting y = 0.
4 x 30 12
4 x 12
x 3
Find the y–intercept by setting x = 0.
23.
V (10) 3.6 10 140
36 140 176 In the year 2005, there were 176 million Super
Bowl viewers.
4 0 3 y 12
3 y 12
y 4
24. The slope is 3.6. This means the number of Super
Bowl viewers is increasing at a rate of 3.6 million
per year.
25. Passing through (1, 3) and (4, 2)
First, find the slope.
2 3 5 m 1
4 1 5
19.
f x 1
x 2 3
Then use the slope and one of the points to write the
equation in point-slope form.
y y1 m x x1
y 3 1 x 1y 3 1 x 1
1 m
3 y intercept 2
or
y 2 1 x 4y 2 x 4
Slope-Intercept Form y 2 x 4
y x 2
In function notation, the equation of the line is
f x x 2.
20.
f x 4
26. The line is perpendicular to y 1
x 4, so the 2
21.
y 4
An equation of the form y = b is a horizontal line.
m 4 2
2
1
slope is 2. We are given that it passes through
2, 3 . We use the slope and point to write the
equation in point-slope form.
y y1 m x x1
y 3 2 x 2y 3 2 x 2
Solve for y to obtain slope-intercept form.
y 3 2 x 2y 3 2 x 4
1 5 4 2 y 2 x 7
The line through the points falls.
In function notation, the equation of the line is
Chapter 2 Test Chapter 2 Functions and Linear Functions
f x 2 x 7.
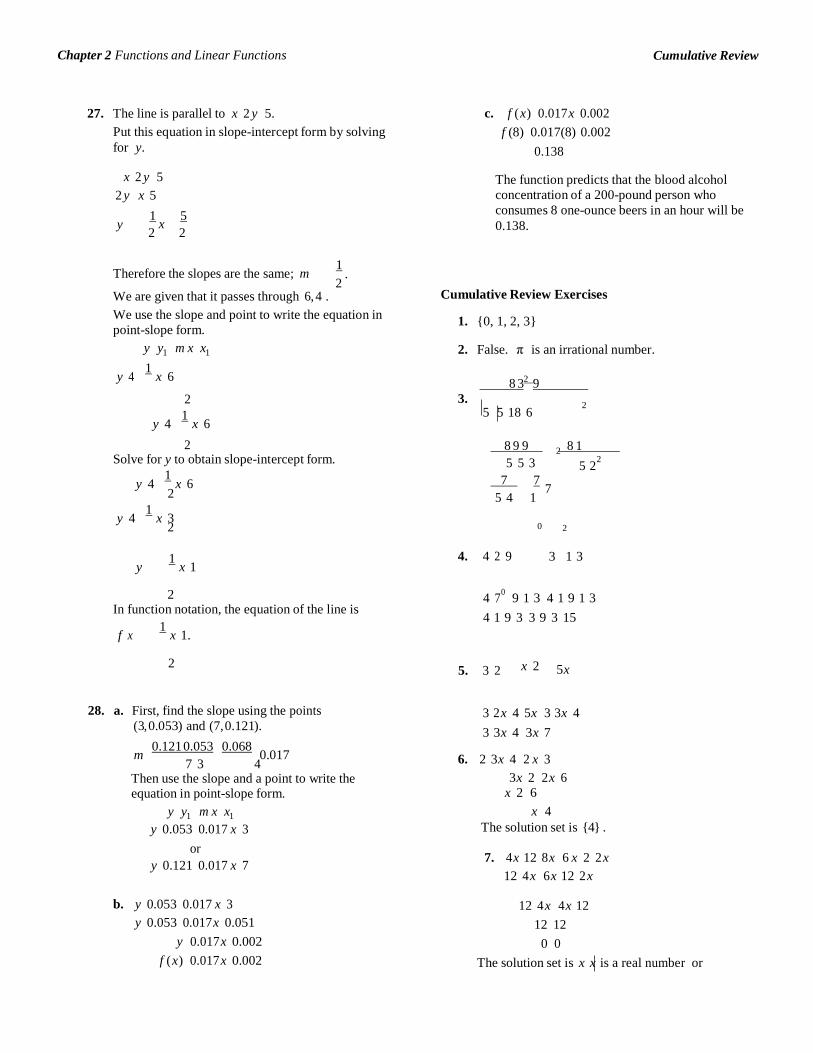
Cumulative Review Chapter 2 Functions and Linear Functions
x
.
2
2
27. The line is parallel to x 2 y 5.
Put this equation in slope-intercept form by solving
for y.
c. f ( x) 0.017 x 0.002
f (8) 0.017(8) 0.002
0.138
x 2 y 5
2 y x 5
y 1 5
2 2
The function predicts that the blood alcohol
concentration of a 200-pound person who
consumes 8 one-ounce beers in an hour will be
0.138.
Therefore the slopes are the same; m 1 2
We are given that it passes through 6, 4 . We use the slope and point to write the equation in
point-slope form.
y y1 m x x1
y 4 1
x 6
Cumulative Review Exercises
1. {0, 1, 2, 3}
2. False. π is an irrational number.
8 32 9
2
y 4 1
x 6
3. 5 5 18 6
2 8 9 9 8 1 Solve for y to obtain slope-intercept form.
y 4 1
x 62
y 4 1
x 3 2
5 5 3
7 7 7 5 4 1
0 2
5 22
y 1
x 1 4. 4 2 9 3 1 3
2 In function notation, the equation of the line is
f x 1
x 1.
4 70
9 1 3 4 1 9 1 3
4 1 9 3 3 9 3 15
2 5. 3 2 x 2 5x
28. a. First, find the slope using the points
(3, 0.053) and (7, 0.121).
m 0.121 0.053
0.068
0.017 7 3 4
Then use the slope and a point to write the equation in point-slope form.
y y1 m x x1 y 0.053 0.017 x 3
or
y 0.121 0.017 x 7
3 2 x 4 5x 3 3x 4 3 3x 4 3x 7
6. 2 3x 4 2 x 33x 2 2 x 6
x 2 6
x 4
The solution set is {4} .
7. 4 x 12 8 x 6 x 2 2 x
12 4 x 6 x 12 2 x
b. y 0.053 0.017 x 3y 0.053 0.017 x 0.051
y 0.017 x 0.002
f ( x) 0.017 x 0.002
12 4 x 4 x 12
12 12
0 0
The solution set is x x is a real number or
Cumulative Review Chapter 2 Functions and Linear Functions
(, ) or . The equation is an identity.
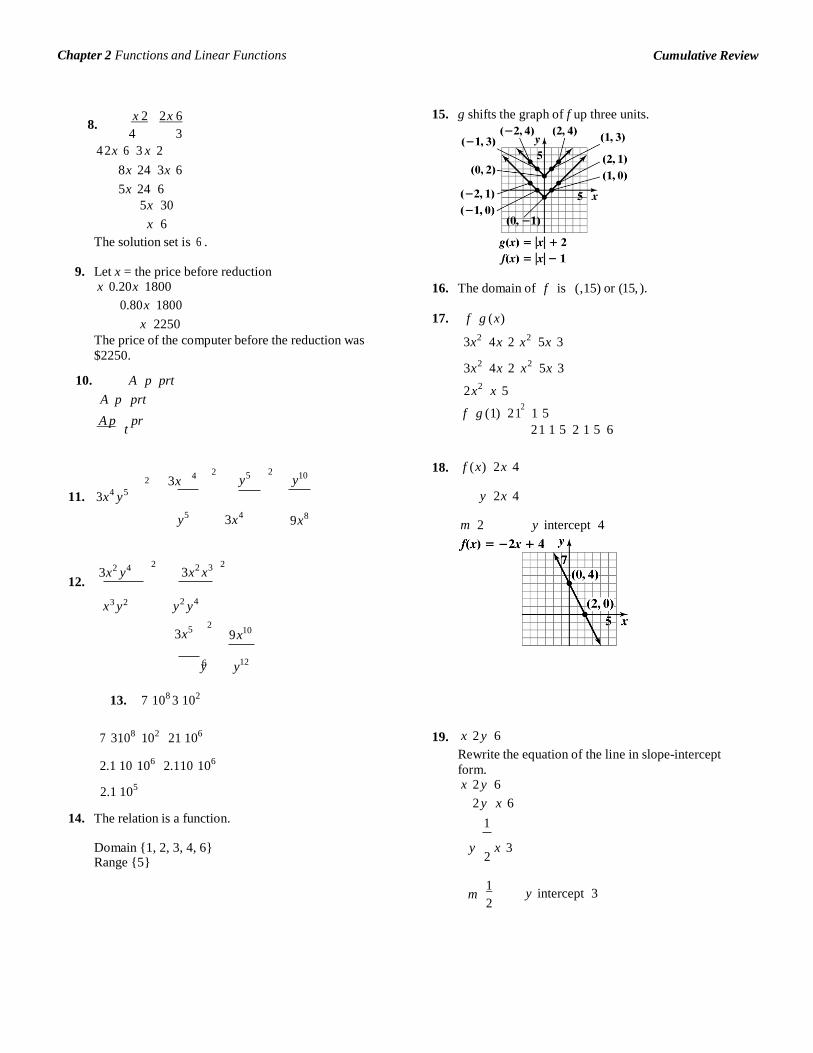
Cumulative Review Chapter 2 Functions and Linear Functions
4 2
2 2
2
8. x 2
2 x 6
4 3
4 2 x 6 3 x 28x 24 3x 6
5x 24 6
5x 30
x 6
The solution set is 6 .
9. Let x = the price before reduction x 0.20 x 1800
0.80 x 1800
x 2250
The price of the computer before the reduction was
$2250.
10. A p prt
A p prt
A p t
pr
15. g shifts the graph of f up three units.
16. The domain of f is (,15) or (15, ).
17. f g ( x)
3x2 4 x 2 x2 5x 3 3x
2 4 x 2 x
2 5x 3
2 x2
x 5
f g (1) 2 12
1 5
2 1 1 5 2 1 5 6
2
2 3x
y5
y10
18.
f ( x) 2 x 4
11. 3x4 y 5
y 2 x 4
y5
3x4 9 x8
m 2 y intercept 4
12.
3x2 y4
3x
2 x
3
x3 y 2 y 2
y 4
3x5
9 x10
6
y
13. 7 108 3 102
y
12
7 3108 102 21 106
2.1 10 106 2.110 106 2.1 10
5
14. The relation is a function.
19. x 2 y 6
Rewrite the equation of the line in slope-intercept
form. x 2 y 6
2 y x 6
1
Domain {1, 2, 3, 4, 6} Range {5}
y x 3 2
m 1
2
y intercept 3

Cumulative Review Chapter 2 Functions and Linear Functions
Cumulative Review Chapter 2 Functions and Linear Functions
20. The line is parallel to y 4 x 7, so the slope is 4.
We are given that it passes through (3, –5). We use
the slope and point to write the equation in point-
slope form.
y y1 m x x1 y 5 4 x 3
y 5 4 x 3Solve for y to obtain slope-intercept form.
y 5 4 x 3y 5 4 x 12
y 4 x 17
In function notation, the equation of the line is
f x 4 x 17.
Intermediate Algebra for College Students 7th Edition Blitzer SOLUTIONS
MANUAL
Full download at:
https://testbankreal.com/download/intermediate-algebra-for-college-students-7th-
edition-blitzer-solutions-manual/
Intermediate Algebra for College Students 7th Edition Blitzer TEST BANK
Full download at: https://testbankreal.com/download/intermediate-algebra-for-college-students-7th-edition-blitzer-test-bank/ intermediate algebra for college students 7th edition pdf intermediate algebra for college students 7th edition access code intermediate algebra for college students 7th edition online intermediate algebra for college students 7th edition answers blitzer 7th edition pdf introductory algebra for college students 7th edition pdf intermediate algebra for college students 7th edition ebook intermediate algebra for college students 7th edition 7th edition