chapter 173-700 wac compensatory wetland mitigation banks
TRANSCRIPT
Preliminary Cost Benefit and
Least Burden Analyses
Chapter 173-700 WAC
Compensatory Wetland Mitigation Banks
March 2009 Ecology Publication #09-06-002
For a printed copy of this report, contact: Name: Jackie Chandler Address: PO Box 47600, Olympia WA 98504-7600 E-mail: [email protected] Phone: (360) 407-7291 Refer to Publication Number: 09-06-002
You can also view this report on the Department of Ecology’s Web Site at http://www.ecy.wa.gov/biblio/0906002.html

i
Executive Summary The proposed rule for compensatory wetland mitigation banking offers a clearly superior alternative to the existing method of concurrent mitigation. The new approach offers:
• Higher success rates in creating functional compensatory wetlands
• Economies of scale in construction/restoration of wetlands
• Lower replacement ratios as a result of more reliable success
• Reduced costs of permitting and regulatory oversight
• Reduced gap between wetland losses and associated mitigation
Where these values are quantifiable, wetland mitigation banking could provide net benefits of $2.3 million per year, as compared to current practice. Quantitative analysis also indicates that avoiding impacts to existing wetlands is preferred to both concurrent mitigation and wetland mitigation banking. This supports the current priority of minimizing development impacts to existing wetlands, and counteracts concerns that mitigation banking creates an economic incentive to relocate all wetlands. For these reasons, the option of wetland mitigation banking is financially and socially appealing to businesses and individuals undertaking mitigation, to investors and wetland bankers seeking to sell credits, and to the population and environment of Washington State as a whole.
ii
Table of Contents EXECUTIVE SUMMARY ............................................................................................................................ I
TABLE OF CONTENTS ............................................................................................................................. II
CHAPTER 1: INTRODUCTION ............................................................................................................... 1
PARTICIPATION IN WMB ................................................................................................................................. 1 HISTORY ....................................................................................................................................................... 1
Wetland Services ................................................................................................................................... 1 Wetland Mitigation ............................................................................................................................... 3 Mitigation Banking ............................................................................................................................... 3 Regulatory Baseline .............................................................................................................................. 4
CHANGES UNDER THE PROPOSED RULE ............................................................................................................... 4 ANALYTICAL FORMAT ...................................................................................................................................... 5
CHAPTER 2: BENEFITS AND COSTS OF THE PROPOSED RULE ................................................................ 6
DESCRIPTION OF BENEFITS ................................................................................................................................ 6 Assured Success ..................................................................................................................................... 6 Concentration of Expertise, Quality of Work......................................................................................... 6 Compensation for Cumulative Piecemeal Impacts ................................................................................ 7 Reduced Construction Costs .................................................................................................................. 7 Reduction of Temporal Loss .................................................................................................................. 7 Improved Regulatory Oversight ............................................................................................................ 8 Increase in Value from Relocation ........................................................................................................ 8 Reduced Permitting Costs for Development ......................................................................................... 9 Improved Regulatory Coordination ....................................................................................................... 9
DESCRIPTION OF COSTS .................................................................................................................................... 9 Decrease in Value from Relocation ....................................................................................................... 9 Mitigation Bank Prospectus ................................................................................................................ 10 Banking Instrument ............................................................................................................................. 11 Construction and Financial Assurance ................................................................................................ 12 Monitoring and Financial Assurance ................................................................................................... 13 Long‐Run Management and Financial Assurance ............................................................................... 13 Financial Assurances ........................................................................................................................... 14 Monitoring and Reporting .................................................................................................................. 14
QUALITATIVE CONCLUSION ............................................................................................................................. 15
CHAPTER 3: QUANTIFIED COSTS AND BENEFITS ................................................................................ 15
MODEL INPUTS ............................................................................................................................................ 16 Number of WA acres annually impacted by development .................................................................. 16 Percentage of annual impacted acreage possibly mitigated by WMB ............................................... 16 Replacement ratio ............................................................................................................................... 17 Wetland construction success rate ..................................................................................................... 17 Difference between urban and rural wetland values .......................................................................... 17 Total value of wetland services ........................................................................................................... 18 Duration of temporal loss ................................................................................................................... 18 Discount rate for temporal loss ........................................................................................................... 18 Wetland creation and compliance costs ............................................................................................. 18
CALCULATIONS ............................................................................................................................................. 19 Acres Impacted and Created ............................................................................................................... 20 Valuation of Wetland Impacts ............................................................................................................ 21

iii
Construction and Compliance Costs .................................................................................................... 22 Net Benefit of the Mitigation .............................................................................................................. 22 Comparison of Net Benefits: Wetland Mitigation Banking vs. Concurrent Mitigation ....................... 23
RESULTS ..................................................................................................................................................... 23 QUANTITATIVE CONCLUSION ........................................................................................................................... 24
CHAPTER 4: OBSERVATIONS AND CONCLUSIONS .............................................................................. 25
CHAPTER 5: LEAST BURDENSOME ALTERNATIVE ANALYSIS ............................................................... 26
ALTERNATIVE CONTENT AND RESPONSES ........................................................................................................... 26 No Financial Assurances ...................................................................................................................... 26 Mandatory Financial Assurances ........................................................................................................ 26 Shorter Timelines for Certification ...................................................................................................... 27 Size Thresholds .................................................................................................................................... 27
CONCLUSION ............................................................................................................................................... 27
APPENDIX A: SOURCE LITERATURE FOR THE VALUE OF WETLAND SERVICES ................................... 28
APPENDIX B: SOURCE LITERATURE FOR THE COST OF WETLAND CONSTRUCTION AND WMB CREDIT PRICES 31
REFERENCES ........................................................................................................................................ 32

1
CHAPTER 1: Introduction The Administrative Procedure Act (Chapter 34.05 RCW) requires that, before adopting a significant legislative rule, Ecology must, “Determine that the probable benefits of the rule are greater than its probable costs, taking into account both the qualitative and quantitative benefits and costs and the specific directives of the statute being implemented.” [RCW 34.05.328(1)(c)] For this proposed wetland mitigation banking (WMB) rule, this means Ecology must estimate the impacts of the mitigation banking program on individuals, businesses and the public, including changes in costs and changes in the value of services provided by wetlands in the state. Impacts are determined as compared to the current regulatory environment—the way wetland mitigation would occur in the absence of the proposed rule—of concurrent mitigation (CM). This document provides the public with an overview of the methods Ecology used to perform its analysis, and the most likely impacts found.
Participation in WMB In most cases, a rule proposed by Ecology imposes some new requirement on a set of individuals or businesses, and Ecology determines whether the expected benefits of the rule outweigh the cost of meeting the new requirements. This proposed rule is different, because participation in WMB is a voluntary choice for developers seeking mitigation, who have the option of choosing WMB or the existing CM method. Moreover, without the proposed rule, no mitigation banks could be certified and used, so mitigation banks entering the market under the proposed rule are expected to do so only if it generates a nonzero profit for them.
Consequently, Ecology does not believe the proposed rule creates real compliance costs after the expected purchase and sale of wetland bank credits occurs. Any party wanting to mitigate wetland impacts will only choose WMB over existing CM methods if banking is the less costly option for them. Similarly, parties that create wetland banks to sell credits will only do so if it is profitable, and would not be able to create a mitigation bank under current regulation. Some WMB participants may experience cost-savings by choosing WMB over existing CM methods in mitigation, or may generate profits by choosing to create and sell credits.
History
Wetland Services Wetlands serve many important types of function for society—to flow and storage of water, to wildlife and ecology, and to people. In particular, wetlands play a vital role in:

2
• Flood protection and flood control
• Groundwater recharge and reliable flow of surface waters
• Water filtration and purification
• Erosion control
• Wildlife habitat
• Recreation
• Research and education
• Regional economic vitality Wetlands provide some or all of these services simultaneously. Alone, any of these services can be of great value to the environment or to society, but taken together, they indicate that wetland areas can be highly beneficial, even as compared to other land uses. Markets capture some of the values of wetland services, when wetland services are bought and sold. Some of these values, however, are difficult or impossible to capture in existing markets, and are excluded from market prices. For this reason, markets tend to undervalue wetlands. Unconstrained markets typically omit certain types of values when pricing goods and services. Of particular importance to wetland valuation are the values of services that involve:
• Externalities An externality is a (positive or negative) impact on a third party that is not reflected in market transactions. For example, when a private wetland that provides flood protection for the surrounding area is sold, the price reflects only the value of the acreage to the buyer and seller—not the additional value to nearby homes and businesses.
• Public Goods A public good can be used or enjoyed by multiple individuals without diminishing the benefit any particular individual receives. For example, wetlands used for research and education provide information that can be used by many individuals, and one person using that information does not reduce another’s ability to use it.
Since the 1960s, the increasing awareness of this valuation problem has led to regulations that constrain the filling or draining of wetland that can occur typically with commercial, residential, or agricultural development. These regulations have especially attempted to preserve the many wetland services that are endangered by market undervaluation.
3
Wetland Mitigation Wetland impacts require a permit from the US Army Corps of Engineers (Corps), in consultation with the US Environmental Protection Agency (EPA). A permit requires sequencing:
1. The developer must first try to avoid the impact altogether.
2. Barring (1), he must minimize the area of the impact
3. To the extent possible, impacts must be made temporary.
4. Finally, impacts that remain after the preceding three steps are termed “unavoidable” impacts, which must be offset by mitigation – the construction, restoration, enhancement or preservation of another wetland.
The Corps’ stated goal is “no net loss” of wetlands, and its existing standard for achieving that goal is concurrent mitigation (CM). Under CM, a developer is granted a permit for unavoidable impacts in return for a promise to create, restore or enhance other wetland acreage, either on the same development site itself or relatively nearby. The impact to the existing wetland and the creation of the new one happen (more or less) concurrently during site development. Sometimes the developer is allowed to pay for the preservation of some other already existing wetland as compensation for unavoidable impacts. Wetland mitigation banking (WMB) changes the order of events. A developer, public agency, or entrepreneur performs mitigation first, whether in the form of creation, restoration, enhancement or, exceptionally, preservation of a wetland. The value of this wetland is stored as credits in a wetland bank. When a later development results in unavoidable wetland impacts, the developer responsible for that impact has the option of purchasing credits from the bank, instead of creating or restoring a wetland directly.
Mitigation Banking The concept of mitigation banking has been around since the 1970s. In 1995, federal agencies released guidance on establishing, using, and operating mitigation banks. Recently there has been a renewed interest in mitigation banks as a regulatory tool, because mitigation banking creates economic incentives for restoring, creating, enhancing and/or preserving wetlands. These economic incentives provide opportunities to change developer behavior in ways that benefit both the developer seeking mitigation, and the public and environment that receive wetland services. Mitigation banks typically involve the consolidation of many small wetland mitigation projects into a larger, potentially more ecologically valuable site. Further, mitigation banks require up-front compensation (either at an owned or sponsored bank, or through purchase of credits) prior to affecting a wetland at another site. This ensures the success of the mitigation before unavoidable
4
damage occurs at another site. With proper implementation and guidelines, mitigation banking has the potential to:
• Increase ecological benefits.
• Save money for project applicants.
• Improve efficiencies in application and permitting processes.
The proposed rule identifies the criteria necessary for implementing an environmentally sound banking system in Washington State.
Regulatory Baseline Wetlands are regulated under many statutory authorities. Regulatory agencies from the federal, state and local governments all have an interest in overseeing wetland protection. Under current regulatory programs, parties seeking permits for activities that affect wetlands must first avoid and then minimize those effects. Any remaining damage must be compensated for. Historically, the regulatory preference for compensation has been on-site creation, restoration, or enhancement of a wetland. These mitigation efforts have resulted in several smaller, "postage stamp" wetlands that have had limited success in reaching full functional potential. Under the proposed rule, the sequencing of avoidance, minimization, and compensation still applies prior to using credits from any mitigation bank. However, in contrast to traditional mitigation activities, mitigation banking requires that compensation—restoration, creation, enhancement, and/or preservation—occurs before a site is affected by a project. Bank projects are put in place prior to allowing unavoidable impacts by a project. Wetland credits are generated by this up-front activity, either at a self-owned or sponsored wetland bank, or through entrepreneurial creation of wetland banks. Those credits can then be used by the bank sponsor (to mitigate his own wetland impacts at other sites), or sold to another party to offset impacts to wetlands that occur in other locations. Again, only impacts that cannot be avoided or minimized are available for compensation through credits from a mitigation bank.
Changes under the Proposed Rule The law, Chapter 90.84 RCW, Wetlands Mitigation Banking, provides no new authority for regulating wetlands, other than wetland bank projects. Current sequencing practices of avoidance, minimization, and compensation still apply. However, the proposed rule (WAC 173-700) focuses on procedures for certifying banks, as well as the process for implementing banks. Essentially, the draft rule adds another tool to the regulatory toolbox for protecting wetlands.
5
Ecology analyzed the net benefit to the State of Washington, of replacing CM with WMB where practicable.
Analytical Format The remainder of this analysis is organized into the following chapters:
• Benefits and Costs of the Proposed Rule (Chapter 2): Qualitative discussion of the likely benefits and costs arising from the proposed rule, as compared to the baseline of CM.
• Quantified Costs and Benefits (Chapter 3): Methodology and results of quantitative analysis, where possible.
• Observations and Conclusions (Chapter 4)
• Least Burdensome Alternative Analysis (Chapter 5)

6
CHAPTER 2: Benefits and Costs of the Proposed Rule The primary factors in the assessment of costs and benefits of wetland mitigation banking (WMB) over concurrent mitigation (CM) are discussed below. They are listed and described qualitatively in this chapter, along with a description of the way they are included in the analysis.
Description of Benefits
Assured Success CM—where the wetland impact happens first followed by construction or restoration—provides no guarantees that the mitigation will be successful, and the mitigation may not even be undertaken at all. In principle, the regulator could deal with unsuccessful efforts by requiring remedial action to ensure that there was some form of effective compensation for wetland impacts that have already occurred, but this is politically and administratively difficult and rarely occurs. Under WMB, few credits are sold before construction of the new wetland is complete, and some credits are withheld from sale until there is a record of accomplishment to provide reasonable confidence in success. This ensures that wetland impacts are offset mostly or entirely by functioning wetlands. Method of inclusion: In the numerical estimation, Ecology used known success rates for CM and hypothesized success rates for WMB.
Concentration of Expertise, Quality of Work When there are many small-scale CM projects, much of it can be done by people with no particular experience in creating functional wetlands. Even when consultants are hired, they may not necessarily guarantee the future success of the wetland under CM. With larger wetlands constructed or restored under WMB, greater expertise in wetland creation can be used more efficiently to compensate for cumulative wetland impacts. Moreover, because WMB requires wetland banks to be functional prior to their use in mitigation, there is incentive to use extensive expertise in their creation. Although less expertise may be cheaper, it can reduce or eliminate the expected gains of a mitigation bank by reducing the likelihood of creating a successfully functioning wetland. Method of inclusion: Qualitative, but also reflected in the increased likelihood of success under WMB in numerical estimation.
7
Compensation for Cumulative Piecemeal Impacts Many wetland impacts are in small fractions of an acre. In such cases, a permit may be granted without requiring compensation because the cost of CM of a small area would be very large compared to the individual impact. This is because fixed costs of mitigation—for example the costs of bringing equipment to a site—are incurred whether the site is small or large, and the cost per acre of wetland mitigated is therefore higher at smaller sites. Cumulatively, small, piecemeal impacts add up to significant total loss of wetlands across the state. Because WMB allows a developer to pay for credits in exchange for small wetland impacts, rather than fitting a compensatory wetland into the development plan (or failing to compensate for very small wetland impacts), WMB provides an economically viable way of compensating for these individually small losses. Method of inclusion: Qualitative.
Reduced Construction Costs WMB allows for cost savings in two ways:
• First, though the work will tend to be of higher quality than under CM (see “Concentration of Expertise, Improved Quality of Work, above), for any given quality of work there are economies of scale achieved by building fewer, larger wetlands.
• Second, by definition, development happens in areas that are being developed, driving up land prices. While WMB does not allow the mitigation bank to be too far from the impact location, it is likely to be in a significantly more rural area where land is cheaper.
Method of inclusion: Ecology used estimates from studies of the cost of construction for variously sized and located wetlands, as well as actual CM costs, and WMB prices and construction costs.
Reduction of Temporal Loss Under CM, the impact to the existing wetland and the creation of the compensatory wetland happen (more or less) concurrently during a development project. However, there is a lag between creation or restoration of a wetland and its actual functionality. Therefore, although the impact of the development is eventually compensated, there is a time window during which wetland services are missing, and this gap is known as temporal loss.

8
WMB does not eliminate this loss but it does reduce it. Since the mitigation bank exists before its credits are used for mitigation, the compensatory wetland is more likely to be functioning at the time that another wetland is impacted by development. Method of inclusion: In numerical calculations, Ecology applied estimated temporal losses under CM and WMB to estimates of wetland values that are missing during the gap between wetland impacts and compensatory wetland function.
Improved Regulatory Oversight Regulatory agencies have limited budgets and staff time, making it difficult to adequately monitor the construction and maintenance of every small compensatory wetland around the state. WMB allows agencies to focus their efforts on fewer areas, achieving higher compliance on the same enforcement budget. Method of inclusion: Qualitative.
Increase in Value from Relocation The possibility of relocating wetlands from developed areas to rural districts under WMB (instead of CM on-site or nearby in the developed area) itself has social benefits and costs. On the benefits side,1 some wildlife functions of wetlands are better served by larger, contiguous areas than by piecemeal habitat. Whereas many species will not enter developed areas or thrive in them—making urban pocket wetlands less valuable as habitat for them—a mitigation bank can be sited so as to contribute to a wildlife corridor.
Method of inclusion: In numerical calculations, Ecology included estimates of possible differences in the value of urban versus rural wetlands. In addition, Ecology used an approximate change in urban-to-rural value that was calculated in the literature based on numerous studies of wetland value.
1 The costs side of the change in value due to relocation is discussed below, under Decrease in Value from Relocation.

9
Reduced Permitting Costs for Development WMB “front-loads” the cost of obtaining necessary permits. Under CM, the permitting process can take well over a year, as regulators consider a site-specific mitigation plan to determine whether it provides adequate compensation for planned impacts. The process of establishing a bank is more extensive—in order to ensure that the wetlands created will be functional and useful. However, once the bank is established, getting approval to buy credits from the bank is faster for developers than going through the permitting process for a site-specific mitigation project. It also involves far less uncertainty regarding the mitigation’s success. This is a savings of both out-of-pocket expenses and time. Method of inclusion: Qualitative.
Improved Regulatory Coordination Just as WMB front-loads developers’ permitting costs, it concentrates and reduces the total costs incurred by regulatory agencies in overseeing a given amount of mitigation. Multiple agencies have a hand in approving wetland impacts, and there is some overlap in the information they require of developers. The WMB process brings together representatives of all the relevant agencies to consider the different aspects of the proposed bank in a coordinated fashion. Such coordination allows the agencies to provide higher quality oversight at less cost to the state and federal treasuries, which in turn means less cost to the state and national economy. Coordination is also a savings for developers who can deal with a single regulatory entity rather than with several, and who can avoid duplicate information requirements. Method of inclusion: Qualitative.
Description of Costs For more in-depth analysis of compliance costs incurred by those businesses required to comply with the proposed rule, see the associated Small Business Economic Impact Statement (Ecology publication #09-06-014).
Decrease in Value from Relocation While relocation has habitat benefits for certain species, some desirable species can co-exist with relatively dense human settlement, as long as patches of habitat are provided for them. If WMB facilitates a significant shift of wetlands from urban to rural areas, it will undercut the possibility of such coexistence. Beyond wildlife, wetlands also provide water quality and quantity functions which depend on their location in the landscape. Furthermore, there are direct uses of wetlands for recreation and education, which increase with proximity to people; these will be diminished by urban-to-rural relocation.

10
Method of Inclusion: In numerical calculations, Ecology included estimates of possible differences in the value of urban versus rural wetlands. In addition, Ecology used an approximate change in urban-to-rural value that was calculated in the literature based on numerous studies of wetland value.
Mitigation Bank Prospectus Prior to the certification of a bank, the proposed rule requires the bank sponsor to create and submit a bank prospectus. The prospectus includes:
• Goals and objectives of the bank.
• Description of the location of the bank.
• Statement of how the bank meets watershed restoration needs.
• Rationale for site selection.
• Description of the general need for the bank.
• Site maps.
• Description of the existing conditions of the site, including: o Current land ownership o Zoning o Current land use o Liens or easements o Water Resource Inventory Area o Wetland types and classes o Other habitat o Water sources o Wetland functions o Risk analysis of bank success o Existing mitigation
• Conceptual site design, including: o Proposed types and size of wetlands o Habitats o Functions o Alterations o Grading o Structures
• Figures illustrating the bank design.
• Proposed service area.
• Discussion of water rights context.
• Permanent protection mechanism.

11
• Long-run management and ownership plans.
• Expected impacts on agricultural land and commerce.
• Sponsor qualifications.
• Design team qualifications and expertise. Ecology expects bank sponsors to incur costs for creating a banking prospectus, as based on the time commitment and level of expertise necessary to evaluate each element of the prospectus. Ecology expects that the size of the bank will be an important factor in the level of difficulty and expertise necessary to create the prospectus. Method of inclusion: Ecology used existing WMB credit prices in all WMB cost calculations, to represent the total present value costs of construction and compliance per acre. This present value price represents the discounted sum of all future cost flows. While credits are not always defined as acres, Ecology conservatively assumed that one credit represents one acre, as it would have generated less conservative net benefit estimates if a credit was taken to represent multiple acres of wetland bank.
Banking Instrument The banking instrument describes how the site conditions, management, and credit sales will function in the wetland mitigation bank. This document describes in detail the short-run and long-run qualities and management of the bank, as well as how bank credits will be created and used. The proposed rule requires the banking instrument to contain some similar or identical information to what is in the mitigation bank prospectus:
• Goals and objectives of the bank.
• Site location information.
• Existing site conditions.
• Statement of how the bank meets existing watershed restoration needs.
• Detailed description of the proposed bank.
• Current land ownership.
The banking instrument must also include:
• Description of sponsor responsibilities for: o Construction implementation o Monitoring o Reporting
12
o Maintenance
• Description of the service area of the bank.
• Potential number of credits generated, and description of the credits.
• Restrictions on credit use.
• Documented water rights.
• Evaluation of historic, cultural, and archeological resources of the site.
• Credit tracking and accounting procedures.
• Reporting requirements.
• Performance standards.
• Credit release schedule.
• Monitoring standards and reporting plan.
• Adaptive management plan and statement of the responsibility for contingency action.
• Financial assurances.
• Ownership arrangements and long-run management plan.
Method of inclusion: Ecology used existing WMB credit prices in all WMB cost calculations, to represent the total present value costs of construction and compliance per acre. This present value price represents the discounted sum of all future cost flows. While credits are not always defined as acres, Ecology conservatively assumed that one credit represents one acre, as it would have generated less conservative net benefit estimates if a credit was taken to represent multiple acres of wetland bank.
Construction and Financial Assurance Depending on the current state of a bank’s land, construction may be required to create wetlands that generate credits for use or sale. This can range from protection of existing, functional wetlands, to wetland restoration, to creation of entirely new wetlands. Normally, Ecology would not consider full construction costs in its analysis, as they are generally the costs of doing business (creating a product to be sold – credits), rather than costs imposed directly by Ecology. However, because Ecology sets the standards for wetland banks, and defines and evaluates the types of wetland that can be used as mitigation credits, Ecology has included construction costs in its analysis. The proposed rule’s standards may impact the size of construction costs, or how construction is performed.
13
Moreover, Ecology requires financial assurance of construction costs for banks that release credits prior to completing construction. In light of this additional compliance cost, Ecology considered construction costs an important component of evaluating the possible decisions of bankers regarding when to release credits, and whether to incur financial assurance requirements. Method of inclusion: Ecology used existing WMB credit prices in all WMB cost calculations, to represent the total present value costs of construction and compliance per acre. This present value price represents the discounted sum of all future cost flows. While credits are not always defined as acres, Ecology conservatively assumed that one credit represents one acre, as it would have generated less conservative net benefit estimates if a credit was taken to represent multiple acres of wetland bank.
Monitoring and Financial Assurance The proposed rule requires planning and implementation of performance standards, and scheduled monitoring and reporting of compliance. If bank credits are released before attaining performance standards, the proposed rule requires financial assurance for monitoring and maintenance expenses. Financial assurance is based on the future monitoring and maintenance costs for the operational life of the bank. Method of inclusion: Ecology used existing WMB credit prices in all WMB cost calculations, to represent the total present value costs of construction and compliance per acre. This present value price represents the discounted sum of all future cost flows. While credits are not always defined as acres, Ecology conservatively assumed that one credit represents one acre, as it would have generated less conservative net benefit estimates if a credit was taken to represent multiple acres of wetland bank.
Long-Run Management and Financial Assurance The proposed rule requires financial assurance for long-run management of the bank. Financial assurance is based on future costs of annual maintenance, and on expected inflation. It can be funded though contract mechanisms such as endowments or trusts, and must ensure an ownership transfer mechanism for the bank. Method of inclusion: Ecology used existing WMB credit prices in all WMB cost calculations, to represent the total present value costs of construction and compliance per acre. This present value price represents the discounted sum of all future cost flows. While credits are not always defined as acres, Ecology conservatively assumed
14
that one credit represents one acre, as it would have generated less conservative net benefit estimates if a credit was taken to represent multiple acres of wetland bank.
Financial Assurances Ecology expects wetland mitigation bankers to choose behaviors with the highest long-run net benefit. In making decisions in light of financial assurance requirements, bankers face three options:
• Release credits before construction is complete, and before performance standards have been attained, incurring up-front financial assurance costs for construction and monitoring.
• Release credits after construction is complete, but before performance standards have been attained, incurring up-front financial assurance costs for monitoring.
• Wait to release credits, until construction is complete and performance standards have been attained, avoiding financial assurance costs for construction and monitoring.
In all of these cases, financial assurance costs for long-run management would still be incurred. Ecology assumed that bankers will choose the option with the highest present-value net benefit. This means, depending on expected credit prices and sales, bankers will choose the option that will bring the highest return in present value, accounting for the flow of future costs and revenues. For the SBEIS, however, Ecology analyzed the highest compliance cost scenario, in which all three forms of financial assurance are required. Method of inclusion: Ecology used existing WMB credit prices in all WMB cost calculations, to represent the total present value costs of construction and compliance per acre. This present value price represents the discounted sum of all future cost flows. While credits are not always defined as acres, Ecology conservatively assumed that one credit represents one acre, as it would have generated less conservative net benefit estimates if a credit was taken to represent multiple acres of wetland bank.
Monitoring and Reporting The proposed rule requires wetland bankers to monitor and report on conditions at the bank. The bank instrument describes, in part, what variables will be monitored, and how they will be monitored and evaluated. The plans and protocols for monitoring the wetland bank, and the schedule for reporting site

15
conditions are described in the banking instrument submitted by the banking certification applicant. Monitoring and reporting includes, but is not limited to:
• Document baseline conditions after construction.
• Document development of the site.
• Document attainment of performance standards.
• Identify possible problems at the site. These items document data and methodologies for bank quality evaluation over time, as based on data gathered at the site.
Method of inclusion: Ecology used existing WMB credit prices in all WMB cost calculations, to represent the total present value costs of construction and compliance per acre. This present value price represents the discounted sum of all future cost flows. While credits are not always defined as acres, Ecology conservatively assumed that one credit represents one acre, as it would have generated less conservative net benefit estimates if a credit was taken to represent multiple acres of wetland bank.
Qualitative Conclusion Based on the impacts of WMB that can only be evaluated qualitatively, Ecology found that they add a positive and possibly large benefit to any quantifiable impacts estimated in Chapter 3. These—exclusively positive—qualitative factors include:
• Concentration of expertise and quality of work
• Compensation for Cumulative Piecemeal Impacts
• Improved regulatory oversight
• Reduced permitting costs of development
• Improved regulatory coordination Moreover, use of WMB generates benefits both for those required to comply with existing wetland mitigation requirements, and for a society as a whole, because it values wetlands for the services they provide to the environment, wildlife, and people. This indicates WMB is likely to be an effective and appealing addition to existing mitigation options.
CHAPTER 3: Quantified Costs and Benefits
16
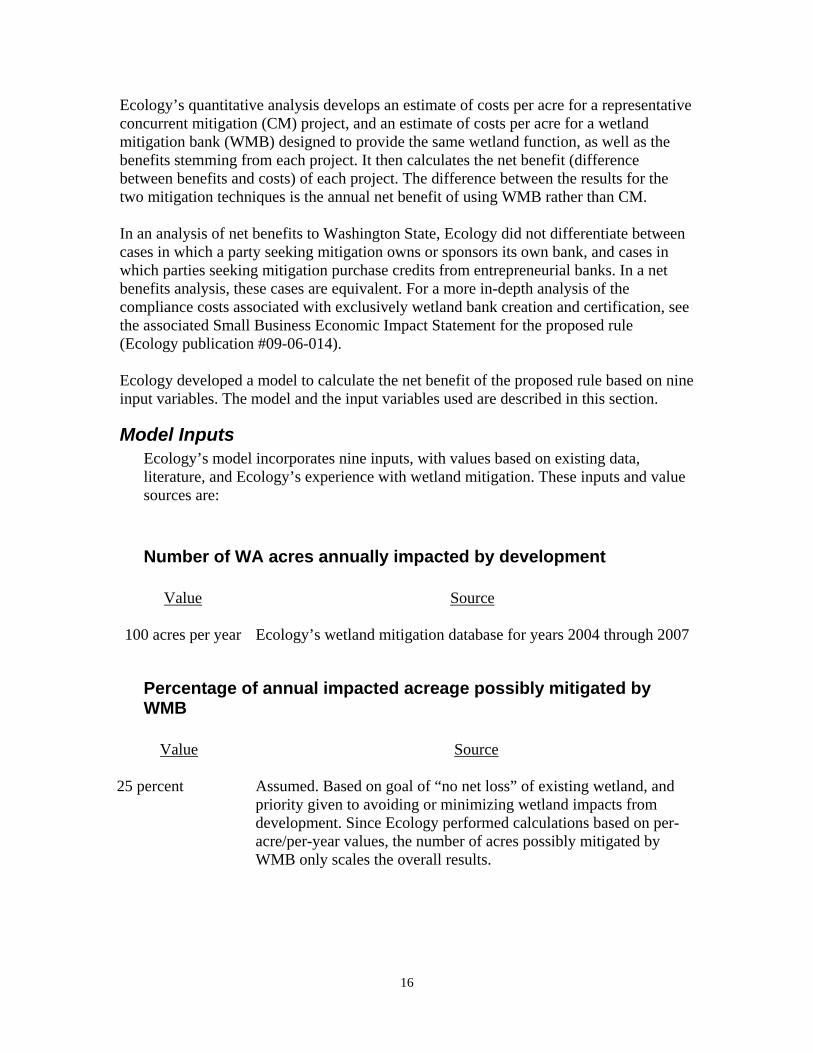
Ecology’s quantitative analysis develops an estimate of costs per acre for a representative concurrent mitigation (CM) project, and an estimate of costs per acre for a wetland mitigation bank (WMB) designed to provide the same wetland function, as well as the benefits stemming from each project. It then calculates the net benefit (difference between benefits and costs) of each project. The difference between the results for the two mitigation techniques is the annual net benefit of using WMB rather than CM. In an analysis of net benefits to Washington State, Ecology did not differentiate between cases in which a party seeking mitigation owns or sponsors its own bank, and cases in which parties seeking mitigation purchase credits from entrepreneurial banks. In a net benefits analysis, these cases are equivalent. For a more in-depth analysis of the compliance costs associated with exclusively wetland bank creation and certification, see the associated Small Business Economic Impact Statement for the proposed rule (Ecology publication #09-06-014). Ecology developed a model to calculate the net benefit of the proposed rule based on nine input variables. The model and the input variables used are described in this section.
Model Inputs Ecology’s model incorporates nine inputs, with values based on existing data, literature, and Ecology’s experience with wetland mitigation. These inputs and value sources are:
Number of WA acres annually impacted by development
Value
Source
100 acres per year Ecology’s wetland mitigation database for years 2004 through 2007
Percentage of annual impacted acreage possibly mitigated by WMB
Value
Source
25 percent Assumed. Based on goal of “no net loss” of existing wetland, and priority given to avoiding or minimizing wetland impacts from development. Since Ecology performed calculations based on per-acre/per-year values, the number of acres possibly mitigated by WMB only scales the overall results.
17
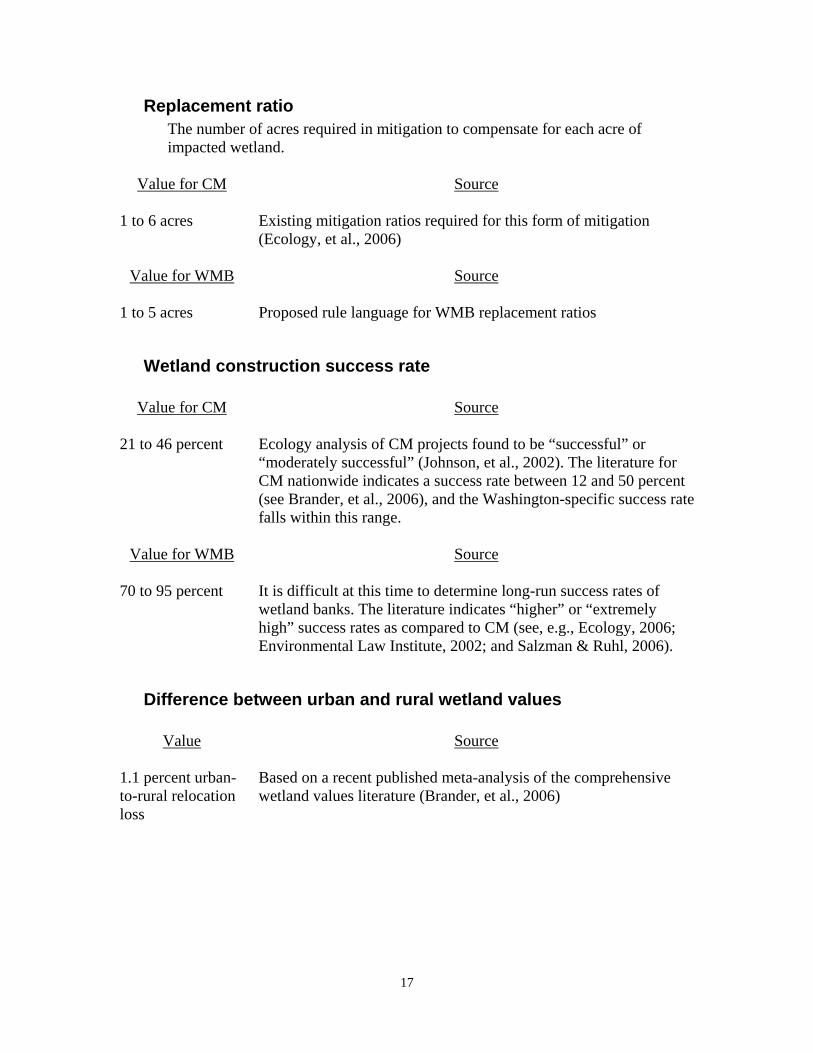
Replacement ratio The number of acres required in mitigation to compensate for each acre of impacted wetland.
Value for CM
Source
1 to 6 acres Existing mitigation ratios required for this form of mitigation (Ecology, et al., 2006)
Value for WMB
Source
1 to 5 acres Proposed rule language for WMB replacement ratios
Wetland construction success rate
Value for CM
Source
21 to 46 percent Ecology analysis of CM projects found to be “successful” or “moderately successful” (Johnson, et al., 2002). The literature for CM nationwide indicates a success rate between 12 and 50 percent (see Brander, et al., 2006), and the Washington-specific success rate falls within this range.
Value for WMB
Source
70 to 95 percent It is difficult at this time to determine long-run success rates of wetland banks. The literature indicates “higher” or “extremely high” success rates as compared to CM (see, e.g., Ecology, 2006; Environmental Law Institute, 2002; and Salzman & Ruhl, 2006).
Difference between urban and rural wetland values
Value
Source
1.1 percent urban-to-rural relocation loss
Based on a recent published meta-analysis of the comprehensive wetland values literature (Brander, et al., 2006)

18
Total value of wetland services
Value
Source
$23,600 to $1.7 million per acre
Ecology surveyed the wetland values literature, and summarized value ranges for each wetland function (see Appendix A). The overall value range for the total value of wetland services per acre is based on the viable combinations of individual function values. Total values were included where available.
Duration of temporal loss
Value for CM
Source
5 to 10 years Assumed. Mitigation typically occurs at or around the time of wetland impacts, but functionality is delayed. Ecology generally evaluates project success after a 10-year monitoring period.
Value for WMB
Source
0 to 5 years Assumed. The bank from which credits are purchased has already been constructed at the time of wetland impacts, but full functionality may be delayed depending on the age of the bank.
Discount rate for temporal loss
As services gained from mitigation are moved farther into the future, each year of delay reduces their present value (value in terms of today’s dollars).
Value
Source
2.0 to 3.7 percent per year
Current inflation-adjusted bond rates for short-term I Bond and for 30-year US Treasury securities, averaged over the last 10 years (Treasury Department, 2008). These are rates at which a dollar could be invested now to retain the same purchasing power in the future, accounting for inflation and perceived risk.
Wetland creation and compliance costs
To maintain conservative estimates, Ecology used the costs to fully construct an acre of wetland, rather than the smaller costs of restoring or preserving a wetland.

19
Ecology used data on wetland creation costs that it was able to access for this Preliminary Cost-Benefit Analysis, and welcomes additional construction-cost and compliance-cost data that might improve the accuracy of estimates resulting from this analysis. For concurrent mitigation, creation and compliance costs included only the costs of design and construction implementation. For WMB, creation and compliance costs were based on existing wetland bank credit prices, which Ecology expects to reflect the present value of both short-run and long-run costs of design, construction, maintenance, monitoring, reporting, and other compliance costs incurred exclusively by banks.
Value for CM
Source
$23 thousand to $348 thousand per acre
Ecology surveyed costs of actual CM in the state, as well as literature estimates for “small” mitigation projects (see Appendix B). For this analysis, Ecology assumed that CM would involve constructing multiple small wetlands as compensation for the generally small individual impacts observed on Washington wetlands.
Value for WMB
Source
$42 thousand to $126 thousand per acre
The US Army Corps of Engineers Directorate of Civil Works 2006 Draft Environmental Assessment, Finding of No Significant Impact, and Regulatory Analysis for Proposed Compensatory Mitigation Regulation indentifies wetland bank credit prices for the Northwestern Corps Division within this range. Ecology assumed that credit prices reflect present values of bank construction, monitoring, reporting, and maintenance costs over the life of a bank.
Calculations Ecology used the above input values to develop a set of possible outcomes for mitigation under CM and under WMB. Ecology then compared the possible ranges and distributions, as well as the most likely values under each mitigation method to determine the likely impact of making WMB available as an option. This section describes the calculations Ecology performed, and provides equations for each step in the calculation.

20
Acres Impacted and Created Ecology first multiplied the number of acres of wetland impacted in Washington State annually by the percentage of those that is a likely candidate for WMB. This is the annual number of acres potentially mitigated by WMB.2
PercentWMByear
sLostAnnualAcreyear
tiallyWMBAcresPoten *=
Ecology multiplied this number by the replacement ratio to determine the number of acres of wetland built annually.3
tRatioreplacemenyear
tiallyWMBAcresPotenyear
AcresBuilt *=
The number of acres of wetland built annually, multiplied by the success rate, is the number of actual functional acres built each year.4
eSuccessRatyear
AcresBuiltyear
AcresFunctional *=
Minus the number of acres initially impacted, this leads to the net increase or decrease in the number of wetland acres in the state—accounting for the wetland impacted, and the wetland built.5
yeartiallyWMBAcresPoten
yearAcresFunctional
yearcresunctionalANetChangeF
−=
2 Definitions: AcresPotentiallyWMB = number of acres potentially mitigated using wetland banking
AnnualAcresLost = number of acres in the state of Washington impacted by development PercentWMB = percentage of impacted acreage that can potentially be mitigated by WMB
3 Definitions: AcresBuilt = number of acres built to mitigate wetland impacts in Washington State AcresPotentiallyWMB = number of acres potentially mitigated using wetland banking ReplacementRatio = required number of wetland acres built for each acre impacted by
development
4 Definitions: FunctionalAcres = number of successfully functioning acres built in mitigation AcresBuilt = number of acres built to mitigate wetland impacts in Washington State SuccessRate = percentage of constructed acreage that succeeds in becoming functioning
wetland
5 Definitions: NetChangeFunctionalAcres = change in functional acres of wetland in Washington State, accounting for loss of wetland due to development impacts, and for wetlands built to mitigate those impacts
FunctionalAcres = number of successfully functioning acres built in mitigation AcresPotentiallyWMB = number of acres potentially mitigated using wetland banking
21
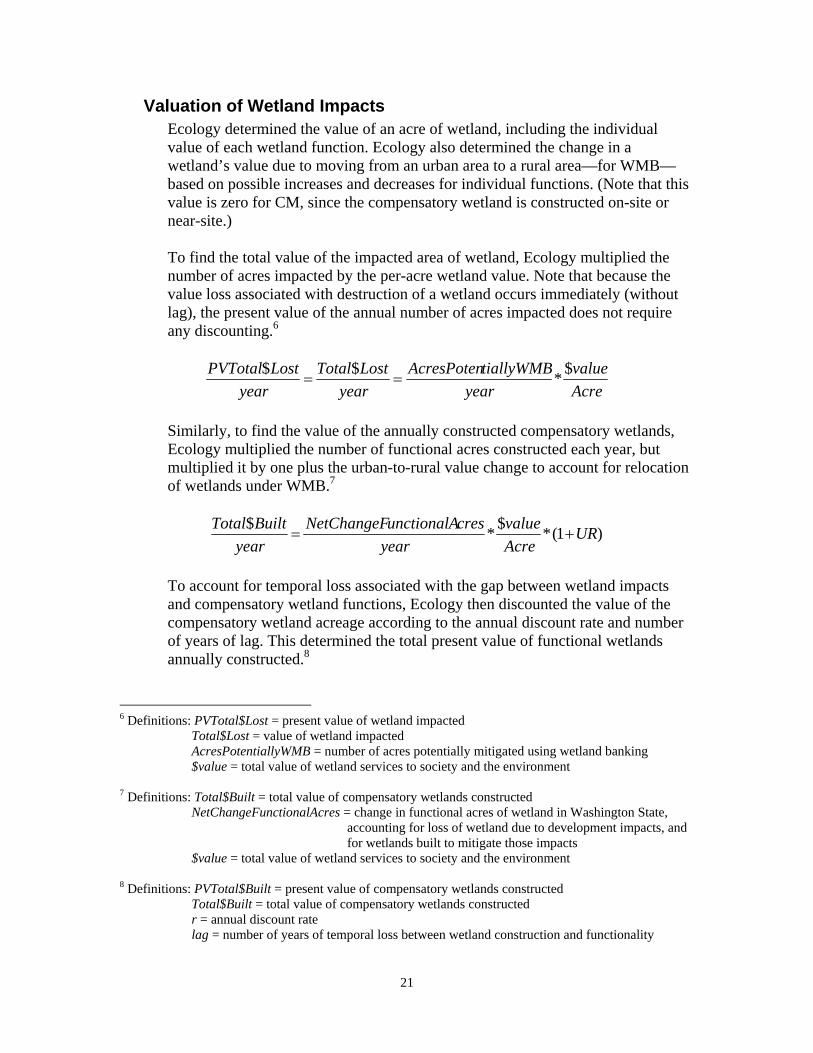
Valuation of Wetland Impacts Ecology determined the value of an acre of wetland, including the individual value of each wetland function. Ecology also determined the change in a wetland’s value due to moving from an urban area to a rural area—for WMB—based on possible increases and decreases for individual functions. (Note that this value is zero for CM, since the compensatory wetland is constructed on-site or near-site.) To find the total value of the impacted area of wetland, Ecology multiplied the number of acres impacted by the per-acre wetland value. Note that because the value loss associated with destruction of a wetland occurs immediately (without lag), the present value of the annual number of acres impacted does not require any discounting.6
Acrevalue
yeartiallyWMBAcresPoten
yearLostTotal
yearLostPVTotal $*$$
==
Similarly, to find the value of the annually constructed compensatory wetlands, Ecology multiplied the number of functional acres constructed each year, but multiplied it by one plus the urban-to-rural value change to account for relocation of wetlands under WMB.7
)1(*$*$ URAcrevalue
yearcresunctionalANetChangeF
yearBuiltTotal
+=
To account for temporal loss associated with the gap between wetland impacts and compensatory wetland functions, Ecology then discounted the value of the compensatory wetland acreage according to the annual discount rate and number of years of lag. This determined the total present value of functional wetlands annually constructed.8
6 Definitions: PVTotal$Lost = present value of wetland impacted
Total$Lost = value of wetland impacted AcresPotentiallyWMB = number of acres potentially mitigated using wetland banking $value = total value of wetland services to society and the environment
7 Definitions: Total$Built = total value of compensatory wetlands constructed NetChangeFunctionalAcres = change in functional acres of wetland in Washington State,
accounting for loss of wetland due to development impacts, and for wetlands built to mitigate those impacts
$value = total value of wetland services to society and the environment 8 Definitions: PVTotal$Built = present value of compensatory wetlands constructed
Total$Built = total value of compensatory wetlands constructed r = annual discount rate lag = number of years of temporal loss between wetland construction and functionality
22
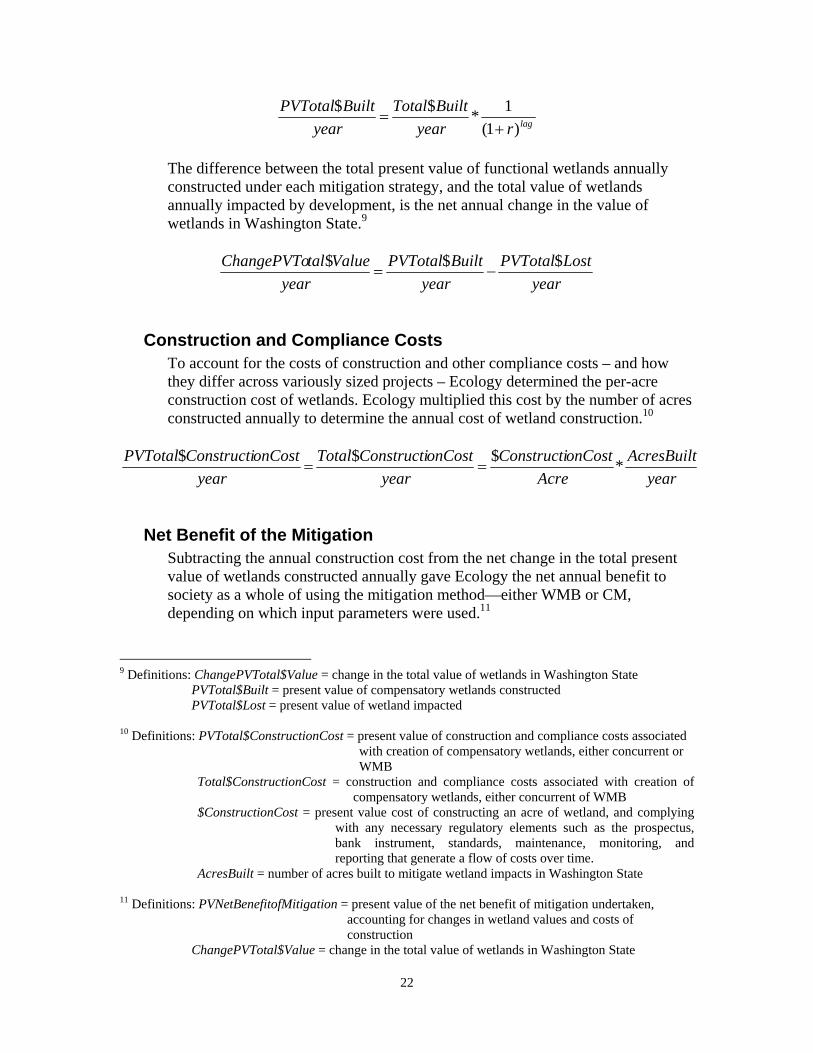
lagryearBuiltTotal
yearBuiltPVTotal
)1(1*$$
+=
The difference between the total present value of functional wetlands annually constructed under each mitigation strategy, and the total value of wetlands annually impacted by development, is the net annual change in the value of wetlands in Washington State.9
yearLostPVTotal
yearBuiltPVTotal
yearValuetalChangePVTo $$$
−=
Construction and Compliance Costs To account for the costs of construction and other compliance costs – and how they differ across variously sized projects – Ecology determined the per-acre construction cost of wetlands. Ecology multiplied this cost by the number of acres constructed annually to determine the annual cost of wetland construction.10
yearAcresBuilt
AcreonCostConstructi
yearonCostConstructiTotal
yearonCostConstructiPVTotal *$$$
==
Net Benefit of the Mitigation Subtracting the annual construction cost from the net change in the total present value of wetlands constructed annually gave Ecology the net annual benefit to society as a whole of using the mitigation method—either WMB or CM, depending on which input parameters were used.11
9 Definitions: ChangePVTotal$Value = change in the total value of wetlands in Washington State
PVTotal$Built = present value of compensatory wetlands constructed PVTotal$Lost = present value of wetland impacted
10 Definitions: PVTotal$ConstructionCost = present value of construction and compliance costs associated with creation of compensatory wetlands, either concurrent or WMB
Total$ConstructionCost = construction and compliance costs associated with creation of compensatory wetlands, either concurrent of WMB
$ConstructionCost = present value cost of constructing an acre of wetland, and complying with any necessary regulatory elements such as the prospectus, bank instrument, standards, maintenance, monitoring, and reporting that generate a flow of costs over time.
AcresBuilt = number of acres built to mitigate wetland impacts in Washington State
11 Definitions: PVNetBenefitofMitigation = present value of the net benefit of mitigation undertaken, accounting for changes in wetland values and costs of construction
ChangePVTotal$Value = change in the total value of wetlands in Washington State
23
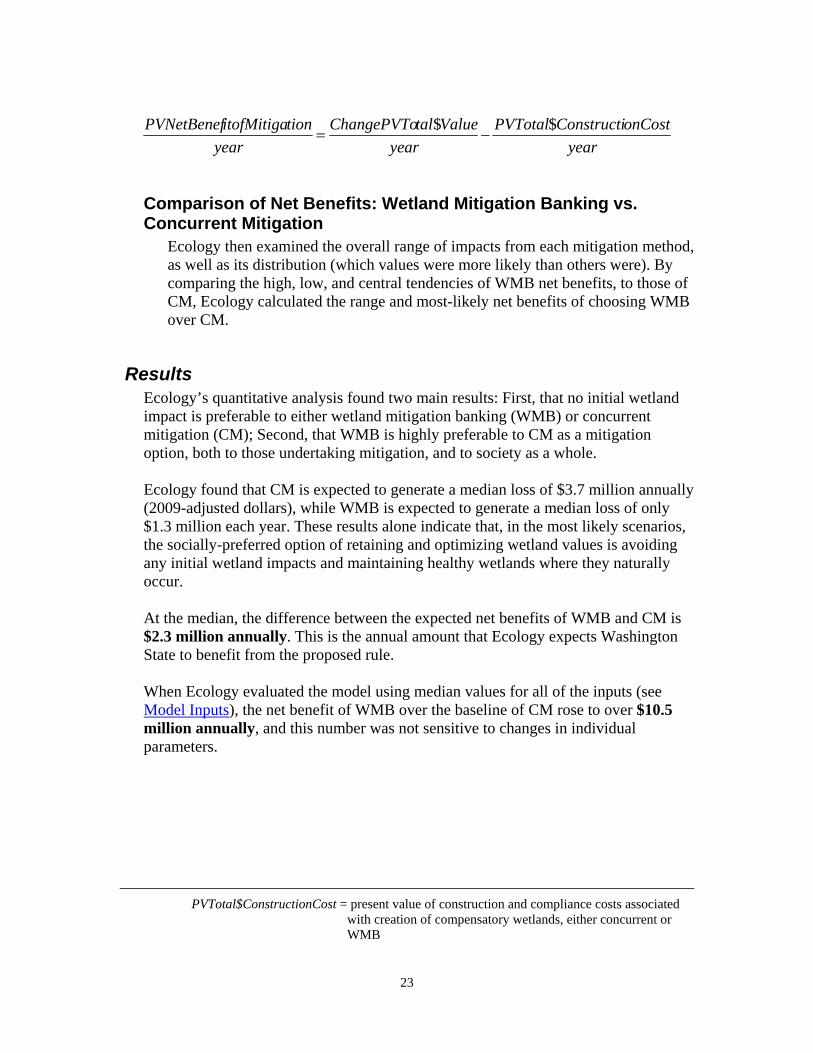
yearonCostConstructiPVTotal
yearValuetalChangePVTo
yeartionitofMitigaPVNetBenef $$
−=
Comparison of Net Benefits: Wetland Mitigation Banking vs. Concurrent Mitigation
Ecology then examined the overall range of impacts from each mitigation method, as well as its distribution (which values were more likely than others were). By comparing the high, low, and central tendencies of WMB net benefits, to those of CM, Ecology calculated the range and most-likely net benefits of choosing WMB over CM.
Results Ecology’s quantitative analysis found two main results: First, that no initial wetland impact is preferable to either wetland mitigation banking (WMB) or concurrent mitigation (CM); Second, that WMB is highly preferable to CM as a mitigation option, both to those undertaking mitigation, and to society as a whole. Ecology found that CM is expected to generate a median loss of $3.7 million annually (2009-adjusted dollars), while WMB is expected to generate a median loss of only $1.3 million each year. These results alone indicate that, in the most likely scenarios, the socially-preferred option of retaining and optimizing wetland values is avoiding any initial wetland impacts and maintaining healthy wetlands where they naturally occur. At the median, the difference between the expected net benefits of WMB and CM is $2.3 million annually. This is the annual amount that Ecology expects Washington State to benefit from the proposed rule. When Ecology evaluated the model using median values for all of the inputs (see Model Inputs), the net benefit of WMB over the baseline of CM rose to over $10.5 million annually, and this number was not sensitive to changes in individual parameters.
PVTotal$ConstructionCost = present value of construction and compliance costs associated
with creation of compensatory wetlands, either concurrent or WMB

24
Quantitative Conclusion Ecology concluded that wetland mitigation banking (WMB) generates a net benefit when compared to the existing method of concurrent mitigation (CM), when accounting for all of the quantifiable costs and benefits.

25
CHAPTER 4: Observations and Conclusions Ecology separately calculated the qualitative and quantified net benefits of the proposed wetland mitigation banking (WMB) rule, accounting for likely costs and benefits of a switch to WMB from the current concurrent mitigation (CM) method. Based on the combined qualitative and quantitative net benefits that Ecology finds to be likely under WMB (as compared to CM), Ecology concluded that the benefits of the proposed rule will most likely exceed the probable costs. On the purely qualitative (unquantifiable or difficult to accurately quantify) side, Ecology does not expect any costs to arise, leaving only benefits in the qualitative category of moving to WMB. These qualitative impacts include:
• Concentration of expertise and quality of work
• Compensation for cumulative piecemeal impacts
• Improved regulatory oversight
• Reduced permitting costs of development
• Improved regulatory coordination
The qualitative benefits of WMB—as compared to CM—only add to the positive net benefit found in Ecology’s quantitative analysis as well. Ecology’s quantitative analysis of the costs and benefits of WMB over CM concluded that the most likely net benefit of the proposed rule is an available annual gain of $2.3 – 10.5 million. Ecology concluded that overall—based on both positive qualitative benefits and positive quantitative net benefits—the proposed rule offers a switch to mitigation through WMB that could create significantly large benefits for the state. Moreover, WMB is attractive to all parties involved, and is more likely to be undertaken than CM. Finally, although Ecology’s analysis showed that WMB is highly preferable to CM, Ecology underscores that the highest likely median net benefit from wetlands is achieved through preservation of existing wetlands and the maintenance of their functions in their current locations.12
12 The “median net benefit from wetlands” refers to the value to society and the environment provided by wetlands in the state, accounting for the costs of wetland creation/maintenance, and the social and ecological services wetlands provide, but not accounting for the value of developments that displace them. The net benefit from a development project that impacts wetlands should include the combined net benefits of the project itself, as well as the net benefit (or cost) of the wetland impacts and mitigation.
26
CHAPTER 5: Least Burdensome Alternative Analysis RCW 34.05.328(1)(e) requires Ecology to “determine, after considering alternative versions of the rule and the analysis required under (b), (c), and (d) of this subsection, that the rule being adopted is the least burdensome alternative for those required to comply with it that will achieve the general goals and specific objectives stated under (a) of this subsection.”
Alternative Content and Responses Ecology considered alternatives to the proposed rule’s content during the rule development process. These alternatives, and reasons for not including them in the proposed rule, are listed below.
No Financial Assurances The authorizing statute creating wetland mitigation banks (Chapter 90.84 RCW) states that the benefits of wetland mitigation banking include, “the ability to provide compensatory mitigation in an efficient, predictable, and economically and environmentally responsible manner” (RCW 90.84.005(1)(f)). Ecology did not consider it to be economically or environmentally responsible to allow banks to benefit from credit release prior to completing required construction and performance standards, or prior to demonstrating the ability to maintain the bank in the long-run. Not setting financial assurances (either those that are optional or those that are mandatory) could harm both the banker and the environment by allowing a bank project to:
• Be abandoned after investments and expenditures were made, prior to any revenues.
• Fail to provide the long-run wetland functions the bank credits represent, and for which developers have paid.
• Fail to mitigate wetland impacts in the state, or establish successful remediation through meeting performance standards.
Mandatory Financial Assurances Ecology did not choose to include this option, as it places greater burden on those seeking to certify wetland banks. Inclusion of this option would create additionally disproportionate compliance costs for small businesses, which may not have access to the credit that larger businesses do, and therefore benefit from the choice (in the proposed rule) to delay credit releases until construction,
27
performance standards, or both are completed, to avoid financial assurance requirements.
Shorter Timelines for Certification The authorizing statute creating wetland mitigation banks (Chapter 90.84 RCW) states that the benefits of wetland mitigation banking include:
• “[I]ncreased potential for the establishment and long-term management of successful mitigation by bringing together financial resources, planning, and scientific expertise not practicable for many project-specific mitigation proposals” (RCW 90.84.005(1)(b)).
• “[I]ncreased certainty over the success of mitigation and reduction of temporal losses of wetlands since mitigation banks are typically implemented and functioning in advance of project impacts” (RCW 90.84.005(1)(c)).
Ecology determined that shorter timelines than were determined by scientific experts to be appropriate for establishing and verifying successful banks (meeting performance standards), or appropriate for evaluating prospective bank sites and instruments would violate these principals.
Size Thresholds Ecology did not include this option, as it places greater burden on businesses and individuals seeking to certify wetland mitigation banks. While size is one of many considerations in evaluating whether a banking site is appropriate, Ecology did not find it necessary to explicitly set size thresholds for banks. Moreover, size thresholds place additional restriction on urban wetland banks, which may be restricted by land use code, land prices, and available locations.
Conclusion Based on research and analysis required by RCW 34.05.328(d)(e) the Department of Ecology determines:
There is sufficient evidence that the proposed rule is the least burdensome version of the rule for those who are required to comply, given the goals and objectives of the law for Ecology to propose the rule.

28
APPENDIX A: Source Literature for the Value of Wetland Services Allen, J, M Cunningham, A Greenwood & L Rosenthal, 1992. The Value of California Wetlands: An Analysis of their Economic Benefits. The Campaign to Save California Wetlands. Oakland, CA. Bergstrom, JC, JR Stoll & JP Titre, 1989. Recreational Benefits of Wetlands Protection. In Luzar, J & S Henning, editors. Alternative Perspectives on Wetland Evaluation and Use. SNREC Publication number 27. Southern Rural Development Center, Mississippi State University, MS. Bergstrom, JC, JR Stoll, JP Titre & VL Wright, 1989. Economic Value of Wetlands-Based Recreation. Selected paper at the annual meetings of the Southern Regional Science Association. Chapel Hill, North Carolina. Breaux, A, S Farber & J Day, 1995. Using Natural Coastal Wetland Systems for Wastewater Treatment: An Economic Benefit Analysis. Journal of Environmental Management 44. pp. 285 – 291. Charbonneau, JJ & MJ Hay, 1978. Determinants and Economic Values of Hunting and Fishing. Proceedings of the Forty-Third North American Wildlife and Natural Resources Conference. Wildlife Management Institute. Washington, DC. pp. 391 – 403. Costanza, R, SC Farber & J Maxwell, 1989. Valuation and Management of Wetland Ecosystems. Ecological Economics 1. pp. 335 – 361. Creel, M & J Loomis, 1992. Recreation Value of Water to Wetlands in the San Joaquin Valley: Linked Multinomial Logit and Count Data Trip Frequency Models. Water Resources Research 28(10). pp. 2597 – 2606. Dillman, BL, LJ Beran & DD Hook, 1993. Nonmarker Valuation of Freshwater Wetlands: The Francis Beidler Forest. GB705 C57R No. 135. Doss, CR & SJ Taff, 1996. The Influence of Wetland Type and Wetland Proximity on Residential Property Values. Journal of Agricultural and Resource Economics 21(1). pp. 120 – 129. Elliot, ML & G Mulamoottil, 1992. Agricultural and marsh land uses on Walpole Island: Profit Comparisons. Canadian Water Resources Journal 17. pp. 111 – 119. Farber, S, 1987. The Value of Coastal Wetlands for Protection of Property Against Hurricane Wind Damage. Journal of Environmental Economics and Management 14(2). pp. 143 – 151.
29
Farber, S, 1988. The Value of Coastal Wetlands for Recreation: An Application of Travel Cost and Contingent Valuation Methodologies. Journal of Environmental Management 26. pp. 299 – 321. Farber, S, 1996. Welfare Loss of Wetlands Disintegration: A Louisiana Study. Contemporary Economic Policy 14. pp. 92 – 106. Farber, S & R Costanza, 1987. The Economic Value of Wetland Systems. Journal of Environmental Management 24. pp. 41 – 51. Ferguson, A, G Holman & R Kistritz, 1989. Application of Wetland Evaluation Methods to the Cowichan Estuary, British Columbia. Report 4. Wildlife Habitat Canada & Environment Canada. Ottawa, Canada. Hammak, J & GM Brown, 1974. Waterfowl and Wetlands: Toward Bioeconomic Analysis. Resources for the Future. Johns Hopkins University Press. Baltimore, MD and London, England. Johnson, CW & RL Linder, 1986. An Economic Valuation of South Dakota Wetlands as a Recreation Resource for Resident Hunters. Landscape Journal 5(1). pp. 33 – 38. Lant, CL & RS Roberts, 1989. Greenbelts: An Economic Analysis of Riparian Corridors in the Agricultural Midwest. Unpublished Ph.D. dissertation. Lant CL & RS Roberts, 1990. Greenbelts in the Cornbelt: Riparian Wetlands, Intrinsic Values, and Market Failure. Environment and Planning A 22(10). pp. 1375 – 1388. Loomis, JB, M Hanemann, B Kanninen & T Wegge, 1991. Willingness to Pay to Protect Wetlands and Reduce Wildlife Contamination from Agricultural Drainage. In Dinar, A & D Zilberman, editors. The Economics and Management of Water and Drainage in Agriculture. pp. 411 – 429. Mahan, BL, 1997. Valuing Urban Wetlands: A Property Pricing Approach. US Army Corps of Engineers Institute for Water Resources. Mazzotta, MJ, 1996. Measuring Public Values and Priorities for Natural Resources: An Application to the Peconic Estuary System. Ph.D. dissertation. Miller, JR & MJ Hay, 1981. Determinants of Hunter Participation: Duck Hunting in the Mississippi Flyway. American Journal of Agricultural Economics 63(4). pp. 677 – 684. National Audubon Society 1994. Valuing Wetlands: The Cost of Destroying America’s Wetlands. D Kloepfer, editor. Washington, DC. Raphael, CN & E Jaworski, 1979. Economic Value of Fish, Wildlife, and Recreation in Michigan’s Coastal Wetlands. Coastal Zone Management Journal 5. pp. 181 – 194.

30
Stockdale, E, 1997. The Economic Value of Wetlands: Wetlands’ Role in Flood Protection in Western Washington. Ecology publication number 97-100. Thibodeau, FR & BD Ostro, 1981. An Economic Analysis of Wetland Protection. Journal of Environmental Management 12. pp. 19 – 30.

31
APPENDIX B: Source Literature for the Cost of Wetland Construction and WMB Credit Prices Army Corps of Engineers (USACE), 2006. Final Environmental Assessment, Finding of No Significant Impact, and Regulatory Analysis for Compensatory Mitigation Regulation. Directorate of Civil Works, Operations and Regulatory Community of Practice. Critical Habitats, Inc., 2008. Introduction to Green Wealth. Available at http://www.criticalhabitats.com/green-wealth-intro.html Transportation (Washington State Department of Transportation), 2003. WSDOT Project Mitigation Costs: Case Studies. Case studies for: SR 18 Maple Valley; SR 202 Redmond to SR 520; and SR 18 Hobart. May 6, 2003. Transportation (Washington State Department of Transportation), 2006. WSDOT Project Mitigation Costs: Case Studies, Volume 2. Case studies for: I 5 from 548th St. to Pacific; I 405 Kirkland—SR 520 to SR 522; SR 18—Union to Jackson Avenue. January 2006. Transportation (Washington State Department of Transportation), 2006. Wetland Mitigation Banking and WSDOT. September 20, 2006. Wilkinson, J & J Thompson, 2006. 2005 Status Report on Compensatory Mitigation in the United States. Environmental Law Institute. April 2006.
32
REFERENCES Allen, J, M Cunningham, A Greenwood & L Rosenthal, 1992. The Value of California Wetlands: An Analysis of their Economic Benefits. The Campaign to Save California Wetlands. Oakland, CA. Army Corps of Engineers (USACE), 2006. Final Environmental Assessment, Finding of No Significant Impact, and Regulatory Analysis for Compensatory Mitigation Regulation. Directorate of Civil Works, Operations and Regulatory Community of Practice. Bergstrom, JC, JR Stoll & JP Titre, 1989. Recreational Benefits of Wetlands Protection. In Luzar, J & S Henning, editors. Alternative Perspectives on Wetland Evaluation and Use. SNREC Publication number 27. Southern Rural Development Center, Mississippi State University, MS. Bergstrom, JC, JR Stoll, JP Titre & VL Wright, 1989. Economic Value of Wetlands-Based Recreation. Selected paper at the annual meetings of the Southern Regional Science Association. Chapel Hill, North Carolina. Brander, LM, RJGM Florax & JE Vermaat, 2006. The Empirics of Wetland Valuation: A Comprehensive Summary and a Meta-Analysis of the Literature. Environmental and Resource Economics 33(2). pp. 223 – 250. Breaux, A, S Farber & J Day, 1995. Using Natural Coastal Wetland Systems for Wastewater Treatment: An Economic Benefit Analysis. Journal of Environmental Management 44. pp. 285 – 291. Charbonneau, JJ & MJ Hay, 1978. Determinants and Economic Values of Hunting and Fishing. Proceedings of the Forty-Third North American Wildlife and Natural Resources Conference. Wildlife Management Institute. Washington, DC. pp. 391 – 403. Costanza, R, SC Farber & J Maxwell, 1989. Valuation and Management of Wetland Ecosystems. Ecological Economics 1. pp. 335 – 361. Critical Habitats, Inc., 2008. Introduction to Green Wealth. Available at http://www.criticalhabitats.com/green-wealth-intro.html Creel, M & J Loomis, 1992. Recreation Value of Water to Wetlands in the San Joaquin Valley: Linked Multinomial Logit and Count Data Trip Frequency Models. Water Resources Research 28(10). pp. 2597 – 2606. Dillman, BL, LJ Beran & DD Hook, 1993. Nonmarker Valuation of Freshwater Wetlands: The Francis Beidler Forest. GB705 C57R No. 135.

33
Doss, CR & SJ Taff, 1996. The Influence of Wetland Type and Wetland Proximity on Residential Property Values. Journal of Agricultural and Resource Economics 21(1). pp. 120 – 129. Ecology (WA State Dept. of Ecology), 2006. Status of the Wetland Mitigation Banking Pilot Program. Ecology publication number 06-06-026. Ecology (WA State Dept. of Ecology), US Army Corps of Engineers & Environmental Protection Agency Region 10, 2006. Wetland Mitigation in Washington State, Part 1: Agency Policies and Guidance. Ecology publication number 06-06-011a. Elliot, ML & G Mulamoottil, 1992. Agricultural and marsh land uses on Walpole Island: Profit Comparisons. Canadian Water Resources Journal 17. pp. 111 – 119. Environmental Law Institute, 2002. Banks and Fees: The Status of Off-Site Wetland Mitigation in the United States. Washington, DC. Farber, S, 1987. The Value of Coastal Wetlands for Protection of Property Against Hurricane Wind Damage. Journal of Environmental Economics and Management 14(2). pp. 143 – 151. Farber, S, 1988. The Value of Coastal Wetlands for Recreation: An Application of Travel Cost and Contingent Valuation Methodologies. Journal of Environmental Management 26. pp. 299 – 321. Farber, S, 1996. Welfare Loss of Wetlands Disintegration: A Louisiana Study. Contemporary Economic Policy 14. pp. 92 – 106. Farber, S & R Costanza, 1987. The Economic Value of Wetland Systems. Journal of Environmental Management 24. pp. 41 – 51. Ferguson, A, G Holman & R Kistritz, 1989. Application of Wetland Evaluation Methods to the Cowichan Estuary, British Columbia. Report 4. Wildlife Habitat Canada & Environment Canada. Ottawa, Canada. Hammak, J & GM Brown, 1974. Waterfowl and Wetlands: Toward Bioeconomic Analysis. Resources for the Future. Johns Hopkins University Press. Baltimore, MD and London, England. Johnson, CW & RL Linder, 1986. An Economic Valuation of South Dakota Wetlands as a Recreation Resource for Resident Hunters. Landscape Journal 5(1). pp. 33 – 38. Johnson, PA, DL Mock, A McMillan, L Driscoll & T Hurby, 2002. Washington State Wetland Mitigation Evaluation Study, Phase 2: Evaluating Success. Ecology publication number 02-06-009.
34
Johnson, PA, DL Mock, EJ Teachout & A McMillan, 2000. Washington State Wetland Mitigation Evaluation Study, Phase 1: Compliance. Ecology publication number 00-06-016. Lant, CL & RS Roberts, 1989. Greenbelts: An Economic Analysis of Riparian Corridors in the Agricultural Midwest. Unpublished Ph.D. dissertation. Lant CL & RS Roberts, 1990. Greenbelts in the Cornbelt: Riparian Wetlands, Intrinsic Values, and Market Failure. Environment and Planning A 22(10). pp. 1375 – 1388. Loomis, JB, M Hanemann, B Kanninen & T Wegge, 1991. Willingness to Pay to Protect Wetlands and Reduce Wildlife Contamination from Agricultural Drainage. In Dinar, A & D Zilberman, editors. The Economics and Management of Water and Drainage in Agriculture. pp. 411 – 429. Mahan, BL, 1997. Valuing Urban Wetlands: A Property Pricing Approach. US Army Corps of Engineers Institute for Water Resources. Mazzotta, MJ, 1996. Measuring Public Values and Priorities for Natural Resources: An Application to the Peconic Estuary System. Ph.D. dissertation. Miller, JR & MJ Hay, 1981. Determinants of Hunter Participation: Duck Hunting in the Mississippi Flyway. American Journal of Agricultural Economics 63(4). pp. 677 – 684. National Audubon Society 1994. Valuing Wetlands: The Cost of Destroying America’s Wetlands. D Kloepfer, editor. Washington, DC. Raphael, CN & E Jaworski, 1979. Economic Value of Fish, Wildlife, and Recreation in Michigan’s Coastal Wetlands. Coastal Zone Management Journal 5. pp. 181 – 194. Salzman, J & JB Ruhl, 2006. No Net Loss—Instrument Choice in Wetlands Protection. In Freeman, J & CD Kolstad, editors. Moving to Markets in Environmental Regulation: Twenty Years of Experience. Oxford University Press. Stockdale, E, 1997. The Economic Value of Wetlands: Wetlands’ Role in Flood Protection in Western Washington. Ecology publication number 97-100. Thibodeau, FR & BD Ostro, 1981. An Economic Analysis of Wetland Protection. Journal of Environmental Management 12. pp. 19 – 30. Transportation (Washington State Department of Transportation), 2003. WSDOT Project Mitigation Costs: Case Studies. May 6, 2003. Transportation (Washington State Department of Transportation), 2006. WSDOT Project Mitigation Costs: Case Studies, Volume 2. January 2006.

35
Transportation (Washington State Department of Transportation), 2006. Wetland Mitigation Banking and WSDOT. September 20, 2006. Treasury Department (US Department of the Treasury), 2008. Treasury Direct: I Savings Bonds Rates and Terms, and Treasury Direct: Treasury Bonds Rates and Terms. Most current rates available at http://www.treasurydirect.gov/indiv/research/indepth/ibonds/res_ibonds_iratesandterms.htm and http://www.treasurydirect.gov/indiv/research/indepth/tbonds/res_tbond_rates.htm Wilkinson, J & J Thompson, 2006. 2005 Status Report on Compensatory Mitigation in the United States. Environmental Law Institute. April, 2006.