chapter 13 graphical rhetoricigppweb.ucsd.edu/~parker/software/dcanotes.pdf · 2irecommend joseph...
TRANSCRIPT

Chapter 13
Graphical Rhetoric
Academic science is a social institution devoted to the construction of a rational consensus
of opinion over the widest possible field.—John Ziman (1984). An Introduction to Science
Studies (Cambridge University Press, Cambridge).
They [sc. the Royal Society] have exacted from all their members, a close, naked, natural
wa y of speaking; positive expressions; clear senses; a native easiness; bringing all things as
near the Mathematical plainness, as they can: and preferring the language of Artizans,
Countrymen, and Merchants, before that, of Wits, or Scholars.—Thomas Sprat (1667). The
History of the Royal-Society of London, for the Improving of Natural Knowledge (Martyn
and Allestry, London).
The advantages proposed by this [sc. graphical] mode of representation, are to facilitate the
attainment of information, and aid the memory in retaining it: which two points form the
principal business in what we call learning, or the acquisition of knowledge. Of all the
senses, the eye gives the liveliest and most accurate idea of whatever is susceptible of being
represented to it.—William Playfair (1801). The Statistical Breviary; Shewing, on a Princi-
ple Entirely New, The Resources of Every State and Kingdom in Europe (London).
13. Introduction
Science is, as stated in the first quotation, above, a social enterprise,1 and so it
is important, not just to get results, but to communicate them to other researchers.
This communication has four steps:
1. Some idea, result, or whatever starts as thoughts in your head.
2. You produce signals of some sort: sometimes speech, more often blobs and
shapes on paper or on a screen.
3. Somebody else receives these signals, through their ears or their eyes.
4. They interpret these signals somehow to produce thoughts in their own head.
In scientific communication the goal is to make the thoughts and ideas at both
ends match; so your aim, in Step 2, should be to produce the signals that will result
in steps 3 and 4 causing someone else to think as you do.
For science, as in academic discourse in general, there are three modes of sig-
naling available:
A. Language, whether spoken or written (usually the latter).
B. Equations and other mathematics.
C. Pictures, diagrams, and graphs.
Since language is something we naturally acquire, it can be deceptively easy to
think that you have used it well: ‘‘deceptively’’ because it is all too easy to produce
tedious, obscure, and even incomprehensible prose. The surest ways to avoid this
are to learn methods that can make your writing clearer2 and to rewrite as many
1 There is now a large literature on ‘‘Social Studies of Science’’; Ziman’s book is a good intro-
duction.2 I recommend Joseph Williams (1990) Style: Toward Clarity and Grace (Univ. of Chicago
Press, Chicago), as a practical guide to writing clear academic prose. G. D. Gopen and J. A Swan
(1990) The science of scientific writing, Amer. Scient., 78, 550-558 provide a summary, which
shows how to improve a seismological example. This paper is available online at the American
Scientist website, http://www.americanscientist.org.
© 2008 D. C. Agnew/C. Constable

Version 1.0 Graphical Rhetoric 13-2
times as you can: no first draft should survive unscathed. You should aim at a style
that matches Sprat’s description, above, of how scientists ought to write.
Mathematical notation is (by design) much more structured and much less
ambiguous than natural language. But there are still choices to be made in how to
present it. One choice is how detailed a derivation needs to be—remembering that
what is perfectly comprehensible to some (especially the author) will be too con-
densed for others. Notations also require choices. The more symbols there are to
assimilate, the worse off the reader usually is, so anything with a plethora of sub-
scripts and superscripts should be avoided: once you have learned vector notation, it
is easier to read ∇∇ × r than ε ijk∂ j rk. Similarly, it is not usually a good idea to use
names for variables or subscripts, however convenient this may be in writing pro-
grams. But sometimes subscripting is helpful, especially when it allows you to adopt
a standard form: displacements in spherical coordinates are easier for most people to
remember if written as ur, uθ , and uφ rather than with arbitrary labels such as u, v
and w.
Figure 13.1
But the most difficult element of communication is pictures, particularly graph-
ical representations of data, which were the last class of communicative methods to
be developed.3 One reason for this late development was a prejudice (still present in
some areas of scholarship) that pictures are inferior to words;4 another was techno-
logical: pictures were more expensive to produce, and reproduce, than written lan-
guage. Now that everything is done with bits, this cost discrepancy (color printing
aside) is now gone, and there is software to make complicated graphics easy to pro-
duce. But this ease does not solve the problem that graphics can be good or bad in
communicating your message—and software can often make bad choices especially
easy.
My aim is to set out some principles that will help you produce clear and infor-
mative graphs. Many of these are taken from the books by Tufte and Cleveland
given in our list of further reading; but I have tried to focus on problems peculiar to
geophysics. And most of my examples, even if not always from the natural sciences,
should be relevant to the geophysical experience.
3 Statistical graphics were largely invented by William Playfair, in two books published in
1786 and 1801, and only gradually came into use through the nineteenth century. A good online
resource for this history is M. Friendly and D. J. Denis, ‘‘Milestones in the History of Thematic
Cartography, Statistical Graphics, and Data Visualization’’ at
http://www.math.yorku.ca/SCS/Gallery/milestone/
4 See Rudwick, M. J. S. (1976). The emergence of a visual language for geological science:
1760-1840, Hist. Sci., 14, 149-195.
© 2008 D. C. Agnew/C. Constable

Version 1.0 Graphical Rhetoric 13-3
Figure 13.2
13.1. Encode Your Data Intelligently
We begin with a Playfair-like example: representing the size of various geophys-
ical kingdoms, as given by the number of abstracts submitted for each section of the
Fall 2007 AGU meeting. Figure 13.1 shows the data plotted as Playfair might have:
circles of different sizes, with areas proportional to the number of abstracts, and two-
letter codes as identifiers. While this does give a more immediate impression of rela-
tive sizes than a table would, it is not a very precise impression. This plot requires
us to compare areas, which is difficult when these are nearly the same and not adja-
cent. Also, representing numbers by areas is a possible source of error; we might
think that diameter is what we should be considering.5
We might instead use another of Playfair’s inventions: the pie chart, much used
in business and newspaper graphics. The left plot in Figure 13.2 shows the pie slices
arranged alphabetically; on the right, they are sorted from largest to smallest (as
Playfair did in his pie charts). The pie chart is better (because more compact) than
the circles, but we still cannot easily compare relative sizes: for example, what is the
ratio of GC to OS?.
We can describe the problem we are facing as being one of how to encode some
quantity: what visual element are we using to mark relative sizes? Figure 13.1 used
area, and both plots in Figure NN.2 use angle. The problem is that our visual sys-
tem is not particularly good at judging if two areas, or angles, are equal, or their rel-
ative sizes. To decide if a graphic is good, or not, we should be asking what is the
most effective encoding.6 Because we are not good at comparing angles, they are a
poor method of encoding: you should never make a pie chart of anything. We do bet-
ter at judging length, either relatively or in comparing small differences. This
encoding leads us to that venerable graphic, the bar chart, shown in two
5 Scaling two- or three-dimensional images by the relative sizes of the data, is a well-known
form of graphical deception; the viewer tends to assume that area or volume, not length, is
meant. This practice is rare in science, but you should be wary of it elsewhere.6 Cleveland, W. S., and R. McGill (1984). Graphical perception: theory, experimentation, and
application to the development of graphical methods, J. Amer. Stat. Ass., 79, 531-554.
© 2008 D. C. Agnew/C. Constable

Version 1.0 Graphical Rhetoric 13-4
Figure 13.3
arrangements (alphabetical and numerically sorted) in Figure 13.3.
Figure 13.4
Our visual system is even better at judging relative position along a line; we
can use this in a design (invented by Cleveland) called a dot chart. In this, we plot
the values along a set of lines with a common scale. Stacking these vertically allows
us to add better labeling. Figure 13.4 shows a dot chart for the AGU data; plotting
the data in numerically sorted order makes relative comparisons much easier than
an alphabetic ordering would; and after all the alphabetic order is purely arbitrary.7
Unlike the bar chart, the dot chart can have log scales; and with different symbols it
7 In tables as well as figures, it is worthwhile to think about how to order your data. Do not
enslave yourself to names or to the alphabet.
© 2008 D. C. Agnew/C. Constable

Version 1.0 Graphical Rhetoric 13-5
can show more than one type of data; though you cannot then sort them all. Unless
you need to show more than two decimal places, a dot chart can actually replace a
table.
Table 1: Possible Encodings, Best to Worst
• Positions along common and aligned scales.
• Positions along common but unaligned scales.
• Lengths.
• Angle, or slope of a line.
• Areas of similar figures (areas of dissimilar figures cannot be decoded with any accuracy).
• Apparent volumes of similar solids shown by 2-D pictures.
• Color (hue, saturation, or brightness).
Figure 13.5
Table 1 shows the different visual encodings, ranked in the order they can be
used to discriminate values. What is meant by ‘‘position along common but non-
aligned scales’’ is shown in Figure 13.5, which illustrates (in a modified form)
another of Cleveland’s inventions, the framed-rectangle plot. This plot shows vari-
able quantities defined at different locations, or averages over different regions.
This can be done with color or a gray scale, but these are the poorest encodings of
all. Bars at each point, which encode the data as length, are better; but even better
is to include an identical scale with each bar. This encoding makes it easier to see
differences for regions not close to each other. Figure 13.5 shows the rate of change
of sea level at tide gauges in the lower 48 United States, plus nearby US-controlled
locations; groups of values are arranged, as much as possible, to lie along common
© 2008 D. C. Agnew/C. Constable

Version 1.0 Graphical Rhetoric 13-6
scales, with lines pointing back to the locations; though this is not possible for all the
data, a common scale is attached to each group. Two signals are evident: going
south along the east coast there is an increase in the rate of sea-level rise, from the
collapse of the bulge caused by glacial loading during the Ice Age. And high rates in
Louisiana are from loading by the Mississippi delta. Even though the west coast is
tectonically active, there is little variation in rates of change, except for a few sites
close to the Cascadia subduction zone and the Mendocino triple junction.
13.2. Show What You Want To Show
These [sc. rules] require that the author shall:
12. Say what he is proposing to say, not merely come near it.
13. Use the right word, not its second cousin.
Mark Twain (1895). Fenimore Cooper’s literary offenses, North American Rev., 161, 1-12.
This rule might seem obvious, but surprisingly it is not; perhaps because we
know what we are trying to show, we do not easily realize that what we can see eas-
ily, a viewer might not. Obscurity of this kind can be disastrous in a talk, since the
plot may be in view for less than a minute. All too often, the speaker then says
something like, ‘‘If you imagine doing [X] to what is shown, you would see that...’’, a
remark almost as inane as ‘‘I know you can’t read the table, but if you could you
would see that ...’’.
Figure 13.6
The three plots in Figure 13.6 are a simple but realistic example. These all
show time series for one component of displacement for two nearby GPS stations. In
the first plot (upper left), about all we can see is that both show a steady, and
© 2008 D. C. Agnew/C. Constable

Version 1.0 Graphical Rhetoric 13-7
similar, decrease with time. This might be acceptable that were the only point of the
plot, but it is not difficult to convey more information, say about the noise level of
the series—something I have seen plots of this type used for. A simple improvement
is to remove the long-term trends, which can be described by one number, and show
the residuals; this is done in the plot on the upper right. What this improved plot
mostly shows is that there are motions shared by both sites. All too often we are
invited to see that the series are similar, though not entirely, with a phrase such as
‘‘some part of the noise is common to both signals’’—to which a viewer’s response
might well be ‘‘Yes, that is clear, but how much?’’. Again there is a simple cure,
which is to show the difference between the two, as is done in the bottom plot. Since
the time series and the trend are also included, this plot has lost no information,
while allowing us to see much more about the behavior of the two series.
This is just one example of the general rule to show what you need to. If you
want to show how well the model fits the data, show the difference (the residuals),
not just the model overlain on the data. If you want to show differences or ratios,
show them—not the two data sets individually. If you have time series, do not add
them, since then the variations in all but the bottom one become obscured; if you
want to show the sum, do so as a separate series. It may seem as though such plots
are redundant: why show (say) the ratio as well as the data? But it is better to be
redundant than to be unclear.
Figure 13.7
© 2008 D. C. Agnew/C. Constable

Version 1.0 Graphical Rhetoric 13-8
13.3. If There is a Lot of White Space, Think Again
Something of a corollary to the previous section is that a lot of white space often
indicates bad design, since this space rarely shows anything informative. Figure
13.7 shows a common reason for this: an unintelligent choice of plot limits. Many
people learn that plots should always include zero, since one that does not can exag-
gerate the size of small fractional changes. Most scientists can however spot and
allow for this effect, and it is foolish to produce a lot of blank space just to have zero
in the plot. The left-hand plot in Figure 13.7 does not have this problem; rather,
including a couple of outlying points means that most of the data are squeezed into a
small part of the graph. The cure is simple: indicate the extreme values8 separately,
and choose sensible plot limits. Another possible cure is to use a log scale, though in
this case, as the bottom left frame shows, this does not always distribute the data as
well as a well-chosen linear scale.
In keeping with the rule given in the previous section, I also show the data
(lower right) in a completely different form, to answer the obvious question ‘‘How are
the times distributed?’’. The top right frame of the plot assures us that the distribu-
tion of times is about the same over this span of years, so we can reasonably aggre-
gate the data to construct these cumulative curves.
13.4. Do Not Show What You Do Not Need To
So geographers, in Afric maps,
With savage pictures fill their gaps,
And o’er unhabitable downs
Place elephants for want of towns.
Jonathan Swift (1733) On Poetry: a Rhapsody
14. Eschew surplusage.
Mark Twain, op. cit.
The viewer has to look at and evaluate everything on the plot, so you make her
life easier by leaving out as much as you can, saving her the trouble of deciding that
what she has seen is irrelevant. This suggestion might seem obvious, but experience
shows that geophysicists, like geographers of old, can abhor graphical vacua—espe-
cially in maps. One reason is the widespread use of the GMT (Generic Mapping
Tools) package, which marries many capabilities to two major weaknesses: an arcane
and cumbersome set of commands, and the ease with which the user can overdeco-
rate the result. A minor example of overdecoration is the pointless striped bar that
surrounds most GMT maps; a more important one is the inclusion of unnecessary
geographic detail that clutters the plot, in some cases wholly obscuring the data of
interest.
Figure 13.8 is a world map, showing the locations of GPS monitoring sites. The
left plot (modeled after a figure I have seen) is an example of excess clutter: the lati-
tude-longitude graticule is not needed, and a lot of marks inside major landmasses
come from various lakes and rivers. On the right, both of these have been dropped
to leave just the outline of the continents, which is all that is needed to see where
8 These are the PhD thesis of W. R. Gayman (entered 1956, PhD exam 1970, degree awarded
2000) and the MS thesis of C. Jerde (entered 1961, MS 1981).
© 2008 D. C. Agnew/C. Constable

Version 1.0 Graphical Rhetoric 13-9
Figure 13.8
the sites are.9 The right-hand map also uses hollow circles for the symbols. Like the
thin line along the coasts (something found in good maps) this relies on how well the
human visual system detects edges. The outline of any shape of uniform shade will
be enhanced by an edge that contrasts with the shades on either side.
GMT is not the the only source of overdecoration, since many commercial
graphics packages, driven by the aesthetic inclinations of graphic designers to make
plots ‘‘interesting’’, also allow a lot of pointless elaboration: for example, showing
bars on a bar chart as 3-D shaded columns. Even though someone saw fit to include
some feature in a plotting package (especially if that package is PowerPoint), it may
well be one you should eschew.
13.5. On a Good Design, You Can See a Lot
You should not avoid complication, or a lot of information, if it really is needed;
the human visual system can absorb a great deal, and you can pack a surprising
amount into a well-designed plot. This is of course truer for plots in papers (or
posters) than those used in talks, for two reasons. One is that the viewer has time to
study the plot, while in a talk there may be only a minute or two. Also, printing
technology can provide much higher density than all but high-resolution video
screens. A typical (current) resolution for these is 640 by 480 pixels, so most figures
will use about 300 by 300; this is equivalent to a printed figure about 3 inches on a
side.
The second map in Figure 13.9 is one example of how much can be made legible
in a small space. A method that makes use of this is what Tufte calls ‘‘small multi-
ples’’: instead of trying to stuff all your information into one plot, you should show
different parts of it on a series of smaller and simpler plots. Figure 13.10 is an
example, showing the history of different sources of information on California earth-
quakes from 1850 to 1890, with different symbols for how often they reported; the
more often, the better. The individual figures are simple, but together provide a
detailed visual history that shows (for example) the effect of the first California real
estate boom of the late 1880’s: many weekly newspapers.
9 For GMT users: to remove the graticule, use a large interval in the -B option of pscoast; to
remove the lakes and rivers, and small islands, set -A10000/0/1. Always use the -Dc option for
any global map.
© 2008 D. C. Agnew/C. Constable

Version 1.0 Graphical Rhetoric 13-10
Figure 13.10
13.6. Color: Essential, Useful, or Superfluous?
While Figure 13.10 would be perfectly adequate for a paper, it would not work
well in a talk. The time needed to assimilate it can be reduced by differentiating the
different information types not just by symbol shape, but also by color, as shown in
Figure 13.11. Our visual system (like those of other species that eat fruits) is superb
at quickly distinguishing one color from another. Until recently, displaying colors
was technically challenging; now it is so easy, and so tempting, that it is often
overused or abused.
There are several reasons to use color. My own ranking, from good to bad,
would be:
1. To mimic the colors we would see if looking at an actual scene (say, of a geologi-
cal exposure), or else to highlight features in such a scene that we would not
naturally see. Color photographs, or false-color ones, convey much more infor-
mation than black and white.
2. To display densely pixelized information, such as InSAR data.
3. To distinguish one element of a plot from another, as in Figure 13.11. Color
does not automatically cure bad design: while a jumble of black lines may be
incomprehensible, the same lines if colored may still be a jumble. Any good
map (I will venture to offer Figure 13.15, below) shows how coloring allows us
to effortlessly separate different elements of a plot. But for simple plots, if you
do not need color, do not use it, since it then becomes just another thing that the
viewer has to decide doesn’t really matter.10
10 And, until journals abandon the creation of paper copies, there are good economic reasons to
avoid color, which is still much more expensive to print many copies of. And even the reader of
© 2008 D. C. Agnew/C. Constable

Version 1.0 Graphical Rhetoric 13-11
Figure 13.11
4. To encode, through some ordering of colors, quantitative information. This is
the second most common use, and I discuss it further below.
5. To provide pointless visual excitement or a nominal sense of ‘‘reality’’ as when,
for example, aerial or space photographs are used as a map base.
As noted in Section 13.1 above, colors are not a very accurate way of encoding
value. You should always ask, if tempted to use colors in this way, if they are in fact
the most appropriate method. For relatively simple situations contours are much
better, because they can be read quantitatively in a way that colors cannot (Section
13.7). But in very complex situations contours can become an uninterpretable jum-
ble, while colors easily show small-scale variation—not surprisingly, given that color
variations are ubiquitous in natural scenes.
Indeed, one of the problems with coloring is that it is too noticeable. You can
often do better by keeping them in the background: which is to say, pastels are good.
If some large area of your plot will have the same hue, whitening it to a pastel shade
will keep it from overwhelming the rest of the plot. In this spirit, I have used a light
gray for the grids in most figures, making the grid available but unobtrusive. The
next two figures show the contrast between using bright and (some) pastel colors for
a map of seismic intensity from a hypothetical earthquake; because of the variations
from geology, this is the kind of spatially-varying quantity that would be difficult to
contour. Figure 13.12 uses bright (saturated) colors throughout; Figure 13.13
restricts them to those which take up only a small part of the plot. Letting the back-
ground approach whiteness makes it easier to see anything overlain on it: in this
case, other faults and the state highway network.
your proposal may not have a color printer available.
© 2008 D. C. Agnew/C. Constable

Version 1.0 Graphical Rhetoric 13-12
Figure 13.12
A final point about color is that you should never assume colors will come out
just as you thought they would—at least, not unless you are willing to learn some-
thing about how colors are specified. Unfortunately this is a complicated subject,
beyond the scope of these notes.
13.7. In Showing Surfaces, Avoid Realism
Although the establishment of a curved surface of this kind seems to require the three
dimensions of space, we possess a notation as simple as it is expressive, by means of which
it is easy to replace the constructions that we have just indicated in space by others effected
on a plane surface. This process is altogether the same as that which is employed for paint-
ing to the eye elevation of land on topographical plans, carefully raised and traced out.—L.
Lalanne (1843/45). ‘‘Graphical representation of laws with two variables’’11
Any respectable graphics package will include various tools that allow you to
make perspective views of a surface, say of a function of two variables f (x1, fx2):
something often referred to as ‘‘2.5D data’’. Perspective views produce an image that
11 This is an Appendix to L. F. Kaemtz, C. Martin (trans.), L. Lalanne, and C. V. Walker
(trans.) (1845). A Complete Course of Meteorology, with Notes, and an Appendix, Containing the
Graphic Representation of the Numerical Tables (London: Hippolyte Bailliere). The original
appendix is L. Lalanne (1843). Appendice sur la representation graphique des tableaux
meteorologiques et des lois naturelles en general, in the French translation of Kaemtz’ German
original.
© 2008 D. C. Agnew/C. Constable

Version 1.0 Graphical Rhetoric 13-13
Figure 13.13
the visual system can easily interpret as three-dimensional, especially if they use
sophisticated rendering algorithms for sumulating lighting and shading.
But though such images are easy to recognize, they cannot be interpreted quan-
titatively, and should be avoided in scientific use, not least because there is a better
method available, namely a contour plot. Such a plot takes a little experience to
learn to read, but it is safe to assume that an audience of scientists will know how to
do so—especially earth scientists.
As an example, Figure 13.14 and Figure 13.15 show a perspective and contour
representation of a dataset, namely the mean temperature in Halle, Germany, as a
function of time of the day and time of year.12 The perspective plot immediately
shows one its defects: for any viewing position some portion of the surface will be
invisible or badly foreshortened. Being able to move our viewpoint around the sur-
face would solve this, but that is an expensive patch to a poor initial design. And not
12 I pick this rather obscure example because it was used for the first non-topographic contour
plot ever made, by L. Lalanne, as part of the paper from which I took the quotation at the head of
this section. The data were published in that paper, and I have used modern software to make
the plots. For the history of contour plots and related developments, see T. L. Hankins (1999),
Blood, dirt, and nomograms: a particular history of graphs, Isis, 90, 50-80; and Gilles Palsky
(1996), Des Chiffres et des Cartes: Naissance et Developpement de la Cartographie Quantitative
Francaise au XIXe Siecle, (Paris: Ministere de l’enseignment superieur et de la recherche, Comite
des travaux historiques et scientifiques)
© 2008 D. C. Agnew/C. Constable

Version 1.0 Graphical Rhetoric 13-14
Figure 13.14
Figure 13.15
even a dynamic display can show what value corresponds to any particular set of
© 2008 D. C. Agnew/C. Constable

Version 1.0 Graphical Rhetoric 13-15
times.
The contour plot, by contrast, shows the entire surface, and the value for any
pair of times, or along one or the other (say, the daily variation at a particular sea-
son) can be read directly.
Glendale-Verdugo LSM Site
-118.226˚ -118.224˚ -118.222˚ -118.220˚ -118.218˚ -118.216˚
34.172˚
34.174˚
34.176˚
34.178˚
260.000
290.
000
290.000
290.
000
320.
000
320.000
320.000
350.000
350.
000
350.
000
350.000
380.
000
380.000
380.000
380.000
380.000
410.000
410.000
410.000
0 0.125 0.25
km
Contour interval 3 m
Hw
y 2
(G
len
dale
Fw
y)
N end
S end
Figure 13.16
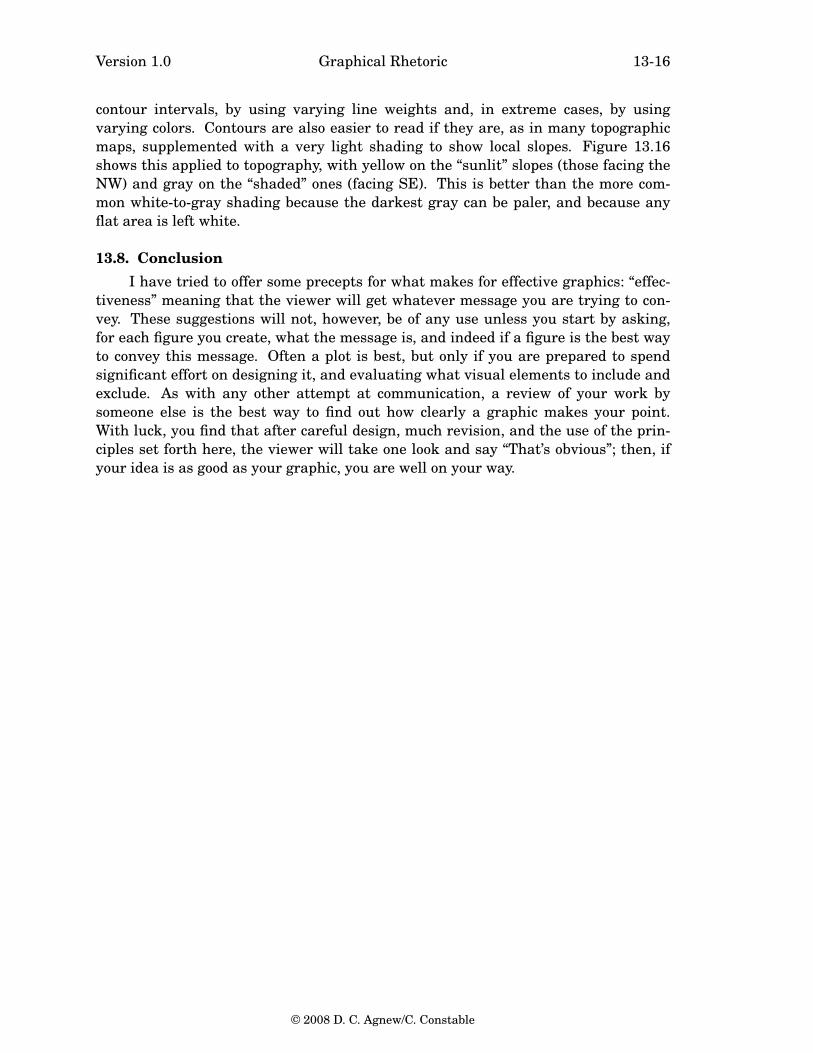
As noted in the previous section, it is harder to read a contour plot of more com-
plicated surfaces; not that this makes 3D views any more useful. When you think
you need to represent such a surface, you should investigate the methods used by
cartographers to represent surface topography, since landforms can be very compli-
cated.13 Layer coloring, of which Figure 13.13 is an example, is probably the only
method that can be used for really complex surfaces. Even though it is easy to do
(especially with GMT) it should not be used for simple situations such as Figure
13.15. You first try to make contour lines more legible by thoughtful choice of
13 The classic guide is Eduard Imhof (1982/2007): Cartographic Relief Presentation (New York,
De Gruyter/Redlands, ESRI Press), now fortunately back in print. For some examples online,
look at http://www.shadedrelief.com, which displays a number of maps, and methods, devel-
oped by a current master of the craft—though all of the manipulations are described in purely
qualitative terms, and make use of nothing more elaborate than Adobe PhotoShop. For a
broader view, see http://www.reliefshading.com.
© 2008 D. C. Agnew/C. Constable
Version 1.0 Graphical Rhetoric 13-16
contour intervals, by using varying line weights and, in extreme cases, by using
varying colors. Contours are also easier to read if they are, as in many topographic
maps, supplemented with a very light shading to show local slopes. Figure 13.16
shows this applied to topography, with yellow on the ‘‘sunlit’’ slopes (those facing the
NW) and gray on the ‘‘shaded’’ ones (facing SE). This is better than the more com-
mon white-to-gray shading because the darkest gray can be paler, and because any
flat area is left white.
13.8. Conclusion
I have tried to offer some precepts for what makes for effective graphics: ‘‘effec-
tiveness’’ meaning that the viewer will get whatever message you are trying to con-
vey. These suggestions will not, however, be of any use unless you start by asking,
for each figure you create, what the message is, and indeed if a figure is the best way
to convey this message. Often a plot is best, but only if you are prepared to spend
significant effort on designing it, and evaluating what visual elements to include and
exclude. As with any other attempt at communication, a review of your work by
someone else is the best way to find out how clearly a graphic makes your point.
With luck, you find that after careful design, much revision, and the use of the prin-
ciples set forth here, the viewer will take one look and say ‘‘That’s obvious’’; then, if
your idea is as good as your graphic, you are well on your way.
© 2008 D. C. Agnew/C. Constable