chapter 11 density of states, fermi energy and energy …homepages.wmich.edu/~leehs/me695/chapter...
TRANSCRIPT

11-1
Chapter 11 Density of States,
Fermi Energy and Energy
Bands
Contents
Chapter 11 Density of States, Fermi Energy and Energy Bands .................................. 11-1
Contents .......................................................................................................................... 11-1 11.1 Current and Energy Transport ........................................................................... 11-1
11.2 Electron Density of States .................................................................................. 11-2
Dispersion Relation .................................................................................................... 11-2
Effective Mass ............................................................................................................ 11-3 Density of States ......................................................................................................... 11-5
11.3 Fermi-Dirac Distribution ................................................................................... 11-7 11.4 Electron Concentration ...................................................................................... 11-8 11.5 Fermi Energy in Metals ..................................................................................... 11-9
EXAMPLE 11.1 Fermi Energy in Gold ................................................................... 11-11 11.6 Fermi Energy in Semiconductors ..................................................................... 11-12
EXAMPLE 11.2 Fermi Energy in Doped Semiconductors ...................................... 11-13 11.7 Energy Bands ................................................................................................... 11-14
11.7.1 Multiple Bands ......................................................................................... 11-15 11.7.2 Direct and Indirect Semiconductors......................................................... 11-16
11.7.3 Periodic Potential (Kronig-Penney Model) ............................................. 11-17 Problems ....................................................................................................................... 11-24 References ..................................................................................................................... 11-24
11.1 Current and Energy Transport
The electric field E is interfered with two processes which are the electric current density j and
the temperature gradient T . The coefficients come from the Ohm’s law and the Seebeck effect.
The field can be written as

11-2
Tj
Ε (11.1)
where is the electrical conductivity and is the Seebeck coefficient.
The heat flux (thermal current density) q is also interfered with both the electric field Ε and the
temperature gradient T . However, the coefficients are not readily attainable. Thomson in 1854
arrived at the relationship assuming that thermoelectric phenomena and thermal conduction are
independent. Later, Onsager [1] supported that relationship by presenting the reciprocal principle
which was experimentally verified. The heat flux can be written as
TkTjq (11.2)
where k is the thermal conductivity consisting of the electronic and lattice (or phonon)
contributions to the thermal conductivity as
le kkk (11.3)
In this chapter, only the electronic contribution to the total thermal conductivity is used.
TkTjq ee (11.4)
We consider a one-dimensional analysis in this chapter because most thermoelectric devices
reasonably holds one-dimension, so that tensor notations are avoided.
11.2 Electron Density of States
Dispersion Relation
From Equation (10.16) (combining the Bohr model and the de Broglie wave), we have
p
h (11.5)
This is known as the de Broglie wavelength. Using the definition of wavevector k = 2/, we have

11-3
pk (11.6)
Knowing the momentum p = mv, the possible energy states of a free electron is obtained
m
k
m
pmvE
222
1 2222
(11.7)
which is called the dispersion relation (energy or frequency-wavevector relation).
Effective Mass
In reality, an electron in a crystal experiences complex forces from the ionized atoms. We imagine
that the atoms in the linear chain form the electrical periodic potential. If the free electron mass m
is replaced by the effective mass m*, we can treat the motion of electrons in the conduction band
as free electrons. An exact defined value of the wavevector k, however, implies complete
uncertainty about the electron’s position in real space. Mathematically, localization can be
described by expressing the state of the electron as a wave packet, in other words, a group velocity.
The group velocity of electrons in Figure 11.1 is the slope of the dispersion relation.
k
vg
(11.8)
Since the wavelength is twice the lattice constant a, the boundaries at the zone in k-space is k = ±
/a. The frequency associated with a wavevector of energy E is
E and
pk (11.9)
where the two equations are known as the Planck-Einstein relations.

11-4
Figure 11.1 Dispersion relation of a group of electrons with a nearest neighbor interaction. Note
that is linear for small k, and that k vanishes at the boundaries of the Brillouin zone (k = ±
/a)
k
Evg
1 (11.10)
The derivative of Equation (11.10) with respect to time is
t
k
k
E
tk
E
t
vg
2
22 11
(11.11)
From Equation (11.9), we have kmvg and tktvm g . The force acting on the group
of electrons is then
t
k
t
vmF
g
(11.12)
Combining Equations (11.11) and (11.12) yields
t
v
kEF
g
22
2 (11.13)
This indicates that there is an effective mass m*, which will replace the electron mass m.
2
2
2
11
k
E
m
(11.14)

11-5
The effective mass m* is the second order of derivative of energy with respect to wavevector,
which is representative of the local curvature of the dispersion relation in three dimensional space.
The effective mass is a tensor and may be obtained experimentally or numerically.
Density of States
Thermoelectric materials typically exhibit the directional behavior. Therefore, in general we have
z
z
y
y
x
x
m
k
m
k
m
kE
2222
2
(11.15)
where mx, my, and mz are the principal effective masses in the x-, y-, z-directions and here k is the
magnitude of the wavevector.
2222
zyx kkkk (11.16)
This represents the surface of a sphere with radius k in k-space. We introduce a new wavevectors
k and an effective mass m as
222222
22zyx kkk
mm
kE
(11.17)
Equating Equations (11.15) and (11.17), we have a relationship between the original wavevector
and the new wavevector as
x
xx k
m
mk
, y
y
y km
mk
, and z
zz k
m
mk
(11.18)
In Figure 11.2, we have the volume of a thin shell of radius k and thickness dk.
kdkm
mmmkdkdkd
m
mmmdkdkdkdk
zyx
zyx
zyx
zyx
2
334 (11.19)
The volume of the smallest wavevector in a crystal of volume L3 is (2/L)3 since L is the largest
wavelength. The number of states between k and k + dk in three-dimensional space is then obtained
(see Figure 11.2)

11-6
kd
m
mmm
L
kdkkN
zyx
33
2
2
42
(11.20)
where the factor of 2 accounts for the electron spin (Pauli Exclusion Principle). Now the density
of states g(k) is obtained by dividing the number of states N by the volume of the crystal L3.
kdm
mmmkdkkg
zyx
32
2
(11.21)
(a) (b)
Figure 11.2 A constant energy surface in k-space: (a) three-dimensional view, (b) lattice points
for a spherical band in two-dimensional view.
From Equation (11.17), we have
2
12
Em
k
(11.22)
Differentiating this gives
2
1
2
2
E
m
dE
kd
(11.23)
Replacing this into Equation (11.21), m is eliminated. The density of states per valley is finally
obtained as

11-7
2
12
3
22
2
2
1E
mEg d
(11.24)
where
31
zyxd mmmm (11.25)
which is called the density-of-states effective mass, and mx, my, and mz are the principal effective
masses in the x-, y-, z-directions. Most actual band structures for semiconductors have ellipsoidal
energy surfaces which require longitudinal and transverse effective masses in place of the three
principal effective masses (Figure 11.3). Therefore, the density-of-states effective mass is
expressed as
31
2
tld mmm (11.26)
where lm is the longitudinal effective mass and tm is the transverse effective mass.
(a) (b)
Figure 11.3 Constant electron energy surfaces in the Brillouin zones (space or k-space): (a) a
spherical band such as GaAs; (b) an ellipsoidal band such as Si. Si has six identical conduction
bands.
11.3 Fermi-Dirac Distribution
Although the classical free electron theory gave good results for electrical and thermal
conductivities including Ohm’s law in metals, it failed in certain other respects. These failure was
eliminated by having the free electron obeys the Fermi-Dirac distribution.
The ground state is state of the N electron system at absolute zero. What happens as the
temperature is increased? The solution is given by the Fermi-Dirac distribution. The kinetic
energy of the electron increases as the temperature is increased: some energy levels are occupied

11-8
which were vacant at absolute zero, and some levels are vacant which were occupied at absolute
zero (Figure 11.4). The Fermi-Dirac distribution fo gives the probability that an orbital at energy
E will be occupied by an ideal electron in thermal equilibrium.
1
1
TkEEoBFe
Ef (11.27)
Figure 11.4 Fermi-Dirac distribution at the various temperatures.
11.4 Electron Concentration
The electron concentration n in thermal nonequilibrium is expressed as
0
dEEfEgn (11.28)
where f(E) is the temperature-dependent occupation probability in thermal nonequilibrium. It
becomes the Fermi-Dirac distribution fo(E) in thermal equilibrium as shown in Equation (11.27),
which becomes unity at absolute zero when E is less than EF, and zero when E is greater than EF
(Figure 11.5). The electron concentration n in thermal equilibrium is

11-9
0
dEEfEgn o (11.29)
Using Equations (11.24) and (11.27), the electron concentration n in thermal equilibrium is
dE
e
Emn
TkEE
d
BF
0
2
1
2
3
22 1
2
2
1
(11.30)
11.5 Fermi Energy in Metals
The Fermi-Dirac distribution implies that at absolute zero (in the ground state of a system) the
largest Fermions (electrons, holes, etc.) are filled up in the density of states, of which the energy
is often called the Fermi energy (Figure 11.5), but here we specifically redefine it as the Fermi
energy at absolute zero. So that the Fermi energy is temperature-dependent quantity. It is
sometimes called the Fermi level or the chemical potential. In general, the chemical potential
(temperature dependent) is not equal to the Fermi energy at absolute zero. The correction is very
small at ordinary temperatures (under an order of 103 K) in ordinary metals.
Figure 11.5 Electron concentration n is given by the area under the density of states curve up to
the Fermi energy EF. The dashed curve represents the density of filled orbitals at a finite
temperature. The electrons are thermally excited from region 1 to region 2.
The largest number of states N can be defined when a sphere of Fermi radius kF is divided by the
smallest volume (2/L)3 in k-space (see Figure 11.2 (a)).

11-10
3
3
2
3
42
L
k
NF
(11.31)
where the factor of 2 accounts for the Pauli Exclusion Principle. Since the crystal volume is
defined as V = L3, the Fermi wavevector is
31
23
12
33
nV
NkF
(11.32)
where N/V is the electron density (or electron concentration) n at the Fermi surface, which can be
obtained from the lattice points, the lattice constant and the mass of the atom (n is usually a great
number of about 1022 cm-3). The Fermi wavevectors form the Fermi surface, which separates the
occupied from the unoccupied levels. The Fermi surface is one of the fundamental constructions
in the modern theory of metals; in general it is not spherical. The Fermi energy is
32
22
32
nm
EF
(11.33)
or the electron concentration n is
2
3
32
21
3
22FE
mmn
(11.34)
This can be also obtained by integrating Equation (11.30) from zero to EF with 1of for
TkEE BF << 0 in most metals. The Fermi velocity at the Fermi surface is
31
23 nmm
kv F
F
(11.35)
For metals, the Fermi velocity is an order of 108 cm/s. This is a substantial velocity (about 1 percent
of the speed of light). From the view point of classical statistical mechanisms, this is quite a
surprising result, for we are describing the ground state (T = 0), and all particles in a classical gas
have zero velocity at T = 0 (classical equipartition energy 1/2mv2 = 3/2kBT). The Fermi velocity is
only an approximation to the average electron velocity; this approximation works best in metals
and in heavily doped semiconductors. The electron mean free path can be approximated by

11-11
Fv (11.36)
where is the relaxation time. The mean free path is a measure of the average distance between
successive scattering events. The relaxation time is the average time between successive collisions.
The wavelength of electrons may be estimated by the de Broglie expression.
Fmvp
h
2 (11.37)
EXAMPLE 11.1 Fermi Energy in Gold
A gold crystal has an fcc lattice with one gold atom per lattice point and a lattice constant of 4.08
Å. Every gold atom has one valence electron. Estimate the electron Fermi energy, Fermi velocity
and electron wavelength in a gold crystal.
Solution:
We assume that the electron effective mass in gold is identical to that of free electrons. For an fcc
lattice, there are four lattice points and thus four valence electrons. Consequently, the electron
number density is
322
3831089.5
1008.4
4
constant) (Lattice
points Lattice
cm
cmn
From Equation (11.33), using Jsh 34106021.6 , 2h , kgme
311010939.9 , and
JeV 1910602.11 ,
eVJnm
EF 52.51084.832
193
22
2
The Fermi velocity is
m/snmm
kv F
F
63
12 1039.13
The electron wavelength is estimated by

11-12
mmvp
h
F
910522.02
Comments: We give the number of density in terms of cm-3 because such a unit is commonly used
in semiconductors. Typical dopant levels for silicon-based semiconductor devices are ~1017 – 1019
cm-3, which is much smaller than those in metals.
11.6 Fermi Energy in Semiconductors
In semiconductors, we usually have TkEE BF >> 1, and then TkEE BFexp becomes
much greater than 1. Therefore, eliminating one we have
Tk
EE
eEf
B
F
TkEEoBF
exp1
1 (11.38)
The electron concentration n in equilibrium from Equation (11.30) is
dETk
EEE
mn
B
Fd
0
2
12
3
22exp
2
2
1
(11.39)
This can be solved using Gamma function. The electron concentration n in single band is reduced
to (this is known as the Boltzmann approximation)
Tk
ETkmNn
B
FBdv exp
22
2
3
2 (11.40)
where Nv is the degeneracy (number of bands or valleys having the same band edge energy and
the same wavevector). For example, Si has the degeneracy of six valleys (see Figure 11.3). Solving
for EF, we have
2
3
222ln
Tkm
N
nTkE Bd
v
BF (11.41)
In typical semiconductors, the Fermi energy EF may be below the conduction band edge EC. The
band gap Eg is the difference between EC and EV, which is usually much larger than kBT as shown
in Figure 11.6. The electron concentration n is the shaded area under the density of states curve

11-13
and the Fermi energy at room temperature. Note that the Fermi energy greatly affects the electron
concentration n in the conduction band, which is much smaller than that of a metal (Figure 11.5).
Figure 11.6 Electron concentration n in a semiconductor is given by the area under the density of
states curve and the Fermi energy EF at room temperature. The Fermi energy EF is located under
the minimum of conduction band. The dashed curve represents the density of filled orbitals at a
finite temperature.
EXAMPLE 11.2 Fermi Energy in Doped Semiconductors
Silicon is widely used semiconductor material, and it is often doped with phosphorus to form an
n-type semiconductor. Determine the Fermi energy of an n-type semiconductor doped with
phosphorus with an electron concentration of 1017 cm-3 at 300 K, assuming that every phosphorus
atom contributes one free electron to the conduction band and neglecting thermally excited
electrons from the valence band. Si has six identical conduction bands with an effective mass equal
to 0.33m, where m is the free electron mass.
Solution:
Silicon has six identical conduction bands (Figure 11.3). When counting all six bands (Nv = 6),
Equation (11.40) is written as

11-14
Tk
ETkmNn
B
FBdv exp
22
2
3
2
Taking n = 1017 cm-3, we can find the Fermi energy as
eV
Tkm
N
nTkE Bd
v
BF
146.0210626.62
3001038.1101.933.0
62
10ln3001038.1
22ln
23
234
23312323
2
3
2
Comments: The negative sign means that the Fermi energy is below the conduction band edge.
The silicon bandgap at room temperature is 1.12 eV. Thus the Fermi energy is within the band
gap. In fact, only in this case, the Boltzmann approximation we used in Equation (11.40) is
applicable because the electron energy inside the conduction band, minus the Fermi energy, is
much greater than kBT ( TkEE BF >> 1). If the Fermi energy is close to the band edge or falls
inside the conduction band, which is the case when the semiconductors are heavily doped, we need
to carry out numerical integration with the Fermi-Dirac distribution.
The value of the Fermi energy needs a reference point. Equation (11.39) indicates that the
reference is the conduction band edge at zero energy, which is shown in Figure 11.6.
11.7 Energy Bands
The free electron model of metals gives us good insight into the electrical conductivity and
electrodynamics of metals. But the model fails to help us with other questions, for example the
relation of conduction electrons in the metal to the valence electrons of free atoms and many
transport properties. Every solid contains electrons. The important question for electrical
conductivity is how electrons respond to an applied electric field. We shall see that electrons in
crystals are arranged in energy bands separated by regions in energy for which no wavelike
electron orbits exist. Such forbidden regions are called energy gaps or band gaps (𝐸𝐺) which are
shown in Figure 11.7, wherein the differences between a metal, a semiconductor and an insulator
are summarized schematically.
The crystal behaves as an insulator if the allowed energy bands are all either filled or empty,
for then no electrons can move in an electric field. The crystal behaves as a metal if one or more
bands are partly filled. The crystal is a semiconductor or semimetal if one or two bands are slightly
filled or slightly empty.

11-15
To understand the difference between insulators and conductors, we must extend the free
electron model to take account of the periodic lattice of the solid. The possibility of a band gap is
the most important new property that emerges.
Figure 11.7 Energy level diagrams for a metal, a semiconductor, and an insulator. Metals have a
partly occupied band (shaded). For semiconductors and insulators, the Fermi level lies between
the occupied valence band and the unoccupied conduction band.
11.7.1 Multiple Bands
There may be two separate bands: a conduction band for electrons and a valence band for holes
as shown in Figure 11.8 (a). In many semiconductors such as Si and PbTe, there may be also
multiple bands that have the same energy levels, whereby it is called degeneracy. The heavy and
light holes are degenerate and the split-off hole in the valence band is slightly off the valence
band edge (maximum).

11-16
(a) (b)
Figure 11.8 Band structures of a semiconductor including the conduction band and the valence
bands. (a) A model of a conduction band and a valence band, and (b) a model of multiple bands.
11.7.2 Direct and Indirect Semiconductors
The type of band gap in semiconductors is important for the selection of material for many
electronic devices including thermoelectric devices, solar cells and lasers. There are two types of
band gaps in semiconductors, which are direct and indirect band gap. The energy E of a particle
is always associated with a wavevector k (or momentum), which implies that, for any transition
between bands, both energy and momentum must be conserved. When an electron absorbs enough
energy to exceed the energy gap Eg, the electron can jump from the valence band into the
conduction band. The source of the energy could be photons, phonons, or electric field.
In direct band gap semiconductors, such as GaAs, the maximum and minimum of energy
versus momentum relationship occur at the same value of the wavevector (Figure 11.9 (a)).
In indirect band gap semiconductors like Si and Ge, the maximum and minimum of the energy
versus momentum relationship occurs at different wavevectors, which is pictured in Figure 11.9
(b). In this case, the electron cannot directly jump into the conduction band, but once the electron
at the valence band edge EV absorbs energy (photon, phonon, or electric field) and reaches the
energy level of the conduction band edge EC across the energy band Eg, it can indirectly jump
into the conduction band with the aid of phonon energy because phonon usually exists anyway.
k
E
0
Conduction Band
Valence Band
EC
EV
Eg
k
E
0
Conduction Band
Valence Band
EC
EV
Eg
Heavy Hole
Light Hole
Split-off Hole

11-17
Figure 11.9 Energy versus wavevector diagrams in (a) direct bandgap and (b) indirect bandgap
semiconductors.
Direct and indirect gap semiconductors have major differences in their optical properties. Direct
band gap semiconductors are more efficient photon emitters, semiconductor lasers are made of
direct gap semiconductors such as GaAs, whereas most electronic devices including
thermoelectric devices are built on indirect semiconductors.
11.7.3 Periodic Potential (Kronig-Penney Model)
So far we have dealt with a free electron. In fact the electron in a crystal experiences a periodic
potential which is along a line of the ionized atoms. Assuming one-dimensional lattice with the
lattice constant a as shown in Figure 11.10 (a), resembling the individual atomic potentials as the
atom is approached closely and flattening off in the region between atoms. We approximate this
by a square periodic potential in Figure 11.10 (b) as introduced by Kronig and Penney.
Ec
Ev
E
k
EgEc
Ev
Eg
(a) (b)
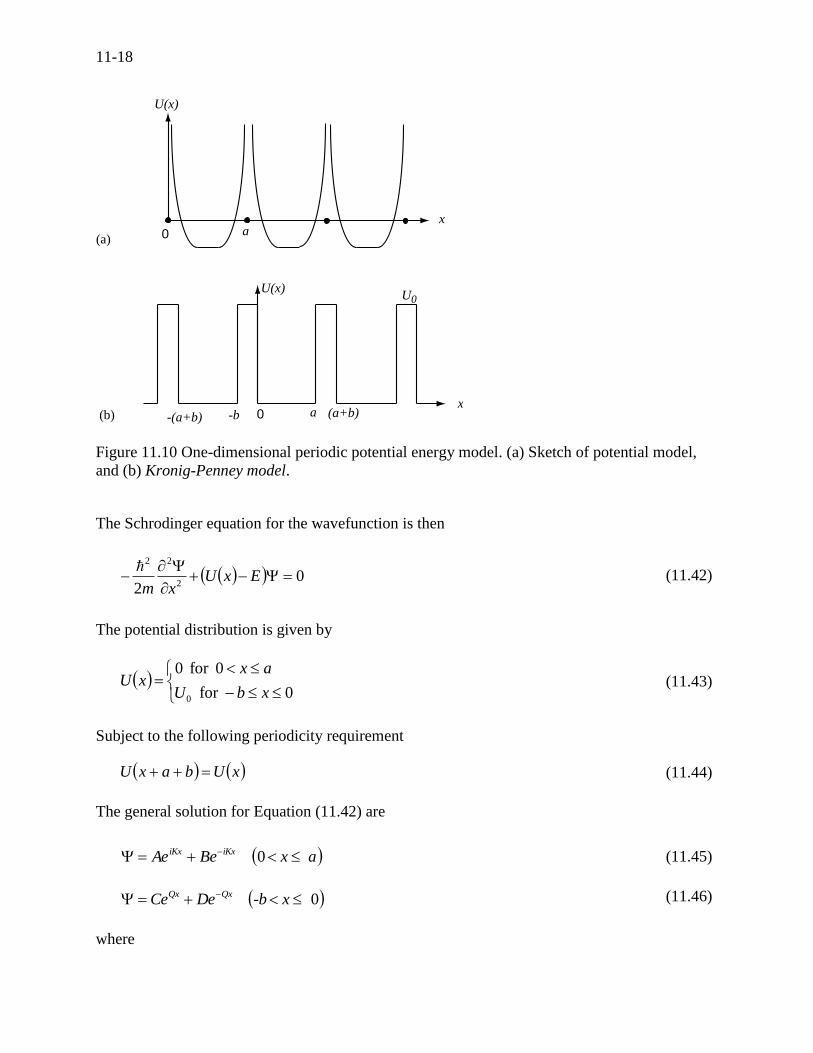
11-18
Figure 11.10 One-dimensional periodic potential energy model. (a) Sketch of potential model,
and (b) Kronig-Penney model.
The Schrodinger equation for the wavefunction is then
02 2
22
ExU
xm
(11.42)
The potential distribution is given by
0for
0for 0
0 xbU
axxU (11.43)
Subject to the following periodicity requirement
xUbaxU (11.44)
The general solution for Equation (11.42) are
axBeAe iKxiKx 0 (11.45)
0 x-bDeCe QxQx (11.46)
where
U(x)
x
0 a
0 a-b-(a+b) (a+b)x
U(x)U0
(a)
(b)

11-19
m
QEU
m
KE
2 and
2
22
0
22
(11.47)
And K and Q are to be determined, from which the eigen energy E of the electron inside such a
periodic potential is to be extracted.
Four boundary conditions are needed to determine the unknown coefficient A, B, C, and D. We
can use the continuity of the wavefunction and its derivative at x = 0, which gives
DCBA (11.48)
DCQBAiK (11.49)
Two more boundary conditions are necessary to determine the four unknown coefficients. Due to
the periodicity in the potential, the wavefunction at any two points separated by a lattice vector is
related through the Bloch theorem in the x-direction,
baikexbax (11.50)
We should distinguish the wavevector k from the propagation vector of the solution K in Equation
(11.45). The latter contains the energy of the electrons that we want to find. We want to find a
relation between k and E, which is equivalent to a relation between k and K. The continuity
requirements for the wavefunction and its derivative at x = a are then
baikQbQbiKaiKa eDeCeBeAe (11.51)
baikQbQbiKaiKa eDeCeQBeAeiK (11.52)
Four equations with four unknowns have a solution only if the determinant of the coefficients
vanishes, yielding
bakKaQbKaQb
KQ
KQ
coscoscoshsinsinh
2
22
(11.53)
It is rather tedious to obtain this equation. The result is simplified if we represent the potential by
the periodic delta function obtained when we pass to the limit b = 0 and 0U in such a way that
PbaQ 22, a finite quantity. In this limit Q >> K and Qb <<1. Then, Equation (11.53) reduces
to

11-20
𝑃
𝐾𝑎𝑠𝑖𝑛(𝐾𝑎) + 𝑐𝑜𝑠(𝐾𝑎) = 𝑐𝑜𝑠(𝑘𝑎)
(11.54)
The range of K for which this equation has solutions are plotted in Figure 11.11, for the case P =
3/2. We can convert the solution for K into energy, and redraw the graph as a function of ka as
shown in Figure 11.12. The figure shows that, for each wavevector k, there are multiple values for
the electron energy E.
Figure 11.11 Left-hand side of Equation (11.54) as function of Ka. Because the right-hand side is
always less than or equal to one, there are regions (the shaded area) where no solution for Ka
exists, and thus no electrons exist with energy corresponding to the values of K in these regions.
The electron energy forms quasi-continuous bands (because k itself is quasi-continuous)
separated from each other by a minimum gap that occurs at ka = s (s = 0, ±1, ±2, …), or k = s
/a, at which the right-hand side of Equation (11.54) is ±1. Figure 11.12 (b) implies that there are
multiple values of k for each E. However, the Bloch theorem says that wavefunctions
corresponding to the wavevectors k separated by m(2/a) (since b = 0) are identical, they are the
same quantum state and should be counted only once. Thus, rather than plotting the energy
eigenvalues for all the wavevectors, we can plot them in one period, as shown in Figure 11.13.
This way of representation is called the reduced-zone representation. The relationship between
the energy and the wavevector is the dispersion relation.
Ka
E
p 2p0 3p 4p
Forbidden region
+1
-1

11-21
(a)
(b)
Figure 11.12 (a) Parabolic energy curves of a free electron in one dimension, periodically
continued in reciprocal space. The periodicity in real space is a, and (b) extended zone: splitting
of the energy parabola at the boundaries of the first Brillouin zone. The energy gaps are
forbidden regions. The solid lines from Kronig-Penney model.
a
p-
0
a
p
E
k
a
2p
a
3p
a
4p
a
2p-
a
3p-
a
p
a
p- 0
a
2p
a
2p-
a
3p-
a
3p
a
4p
a
4p-
Energy gap
Energy Gap
k
E

11-22
Figure 11.13 The solid lines show the energy bands in the reduced zone. The free electron
dispersion relations are shown as dashed lines.
The ab initio calculated electronic band structure using the density functional theory (DFT)
depicted in Figure 11.14 shows the indirect energy gap and the threefold degeneracy of the valence
band at the Fermi energy. It is seen that the approximate sum of the energy bands for a specific
energy level in Figure 11.14 (a) corresponds to the density of states for the energy level in Figure
11.14 (b). From this approach, we can estimate the effective mass using Equation (11.14) that is
the second derivative of energy with respect to wavevector. Also we obtain the band gap from the
figure.
a
p
a
p-
0
Band 1
Band 2
Band 3
Band 4
Band 5

11-23
(a) (b)
Figure 11.14 (a) Electronic band structure of Mg2Si calculated with the density functional theory
(DFT), and (b) total electron density of states (DOS) projected on magnesium and silicon atoms,
the solid line for total DOS, the dashed line for silicon contribution, and the dot-dashed line for
magnesium contribution. Boulet at al. (2011)

11-24
Problems
11.1 A copper crystal has an fcc lattice with one Cu atom per lattice point and a lattice constant
of 3.61 Å. Every copper atom has one valence electron. Estimate the electron Fermi
energy, Fermi velocity and electron wavelength in a copper crystal.
11.2 Derive Equation (11.33) by using Equation (11.30).
11.3 Germanium Ge is widely used semiconductor material, and it is often doped with As to form
an n-type semiconductor. Determine the Fermi energy of an n-type semiconductor doped
with As with an electron concentration of 1019 cm-3 at 300 K. Assume that every As atom
contributes one free electron to the conduction band and neglect thermally excited electrons
from the valence band. Ge has 4 identical conduction bands with an effective mass equal to
0.55m, where m is the free electron mass.
11.4 PbTe is widely used semiconductor material, and it is often doped with Na to form an n-type
semiconductor. Determine the Fermi energy of an n-type semiconductor doped with Na with
an electron concentration of 1018 cm-3 at 300 K, assuming that every Na atom contributes
one free electron to the conduction band and neglecting thermally excited electrons from the
valence band. PbTe has 4 identical conduction bands with an effective mass equal to 0.22m,
where m is the free electron mass.
11.5 Describe the important concept of the band structures.
11.6 Describe briefly the important concept and results of the Kronig-Penney model.
References
1. Onsager, L., Reciprocal Relations in Irreversible Processes. I. Physical Review, 1931. 37(4): p. 405-426.