chapter 07 lecture environmental science
DESCRIPTION
Chapter 07 Lecture Environmental ScienceTRANSCRIPT
Slide 1
Chapter 7
Populations: Characteristics and Issues
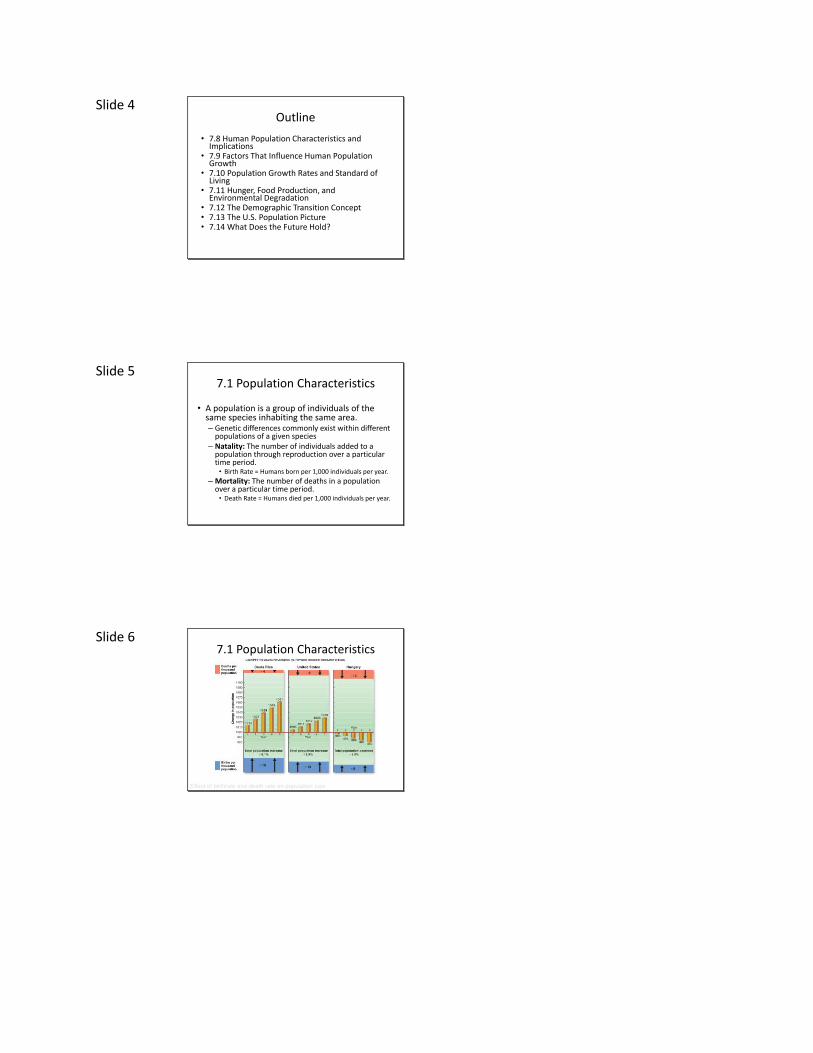
Slide 2 Populations: Characteristics and Issues
Slide 3 Outline
• 7.1 Population Characteristics
• 7.2 A Population Growth Curve
• 7.3 Factors That Limit Population Size
• 7.4 Categories of Limiting Factors
• 7.5 Carrying Capacity
• 7.6 Reproductive Strategies and Population Fluctuations
• 7.7 Human Population Growth
Slide 4 Outline
• 7.8 Human Population Characteristics and Implications
• 7.9 Factors That Influence Human Population Growth
• 7.10 Population Growth Rates and Standard of Living
• 7.11 Hunger, Food Production, and Environmental Degradation
• 7.12 The Demographic Transition Concept• 7.13 The U.S. Population Picture• 7.14 What Does the Future Hold?
Slide 5 7.1 Population Characteristics
• A population is a group of individuals of the same species inhabiting the same area.– Genetic differences commonly exist within different
populations of a given species– Natality: The number of individuals added to a
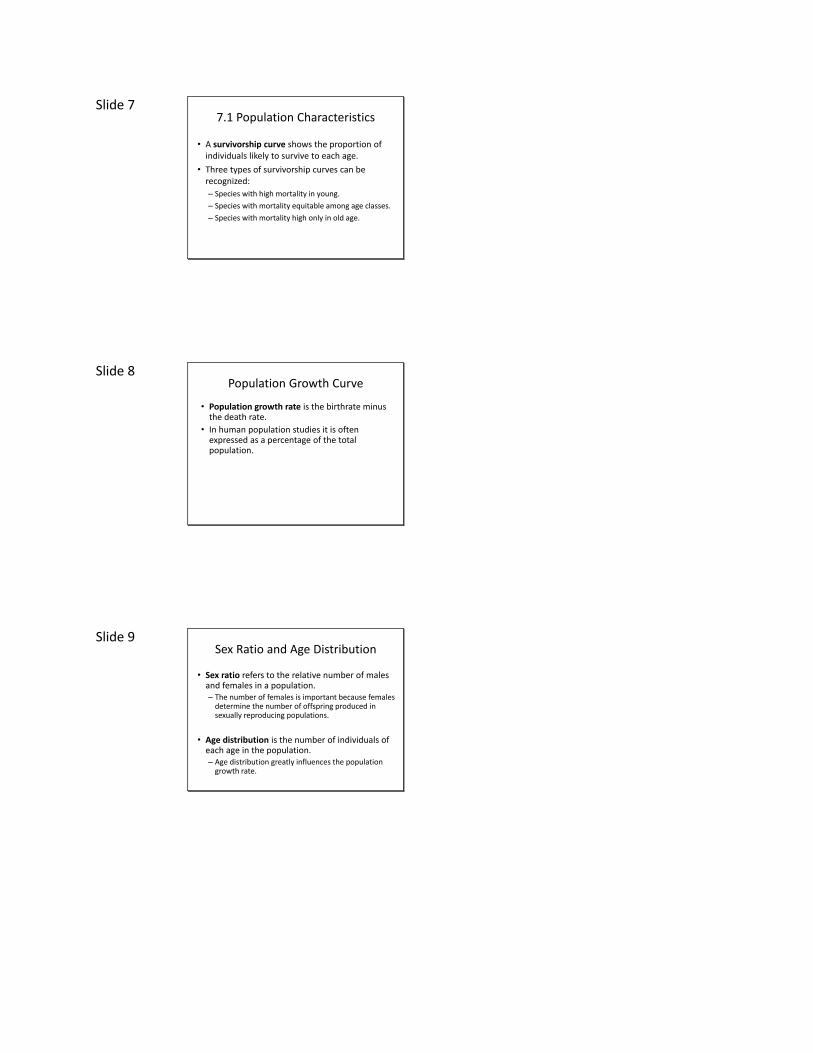
population through reproduction over a particular time period.• Birth Rate = Humans born per 1,000 individuals per year.
– Mortality: The number of deaths in a population over a particular time period.• Death Rate = Humans died per 1,000 individuals per year.
Slide 6 7.1 Population Characteristics
Effect of birthrate and death rate on population size
Slide 7 7.1 Population Characteristics
• A survivorship curve shows the proportion of individuals likely to survive to each age.
• Three types of survivorship curves can be recognized:
– Species with high mortality in young.
– Species with mortality equitable among age classes.
– Species with mortality high only in old age.
Slide 8 Population Growth Curve
• Population growth rate is the birthrate minus the death rate.
• In human population studies it is often expressed as a percentage of the total population.
Slide 9 Sex Ratio and Age Distribution
• Sex ratio refers to the relative number of males and females in a population.– The number of females is important because females
determine the number of offspring produced in sexually reproducing populations.
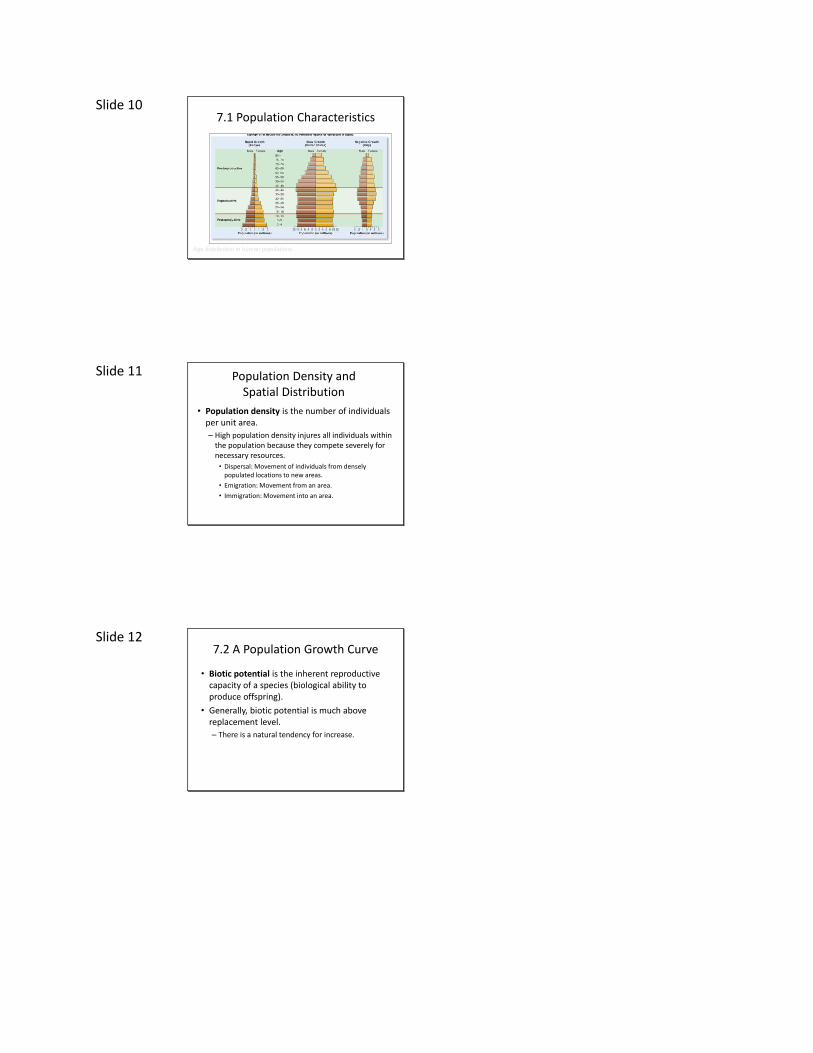
• Age distribution is the number of individuals of each age in the population.– Age distribution greatly influences the population
growth rate.
Slide 10 7.1 Population Characteristics
Age distribution in human populations
Slide 11 Population Density and Spatial Distribution
• Population density is the number of individuals per unit area.
– High population density injures all individuals within the population because they compete severely for necessary resources.
• Dispersal: Movement of individuals from densely populated locations to new areas.
• Emigration: Movement from an area.
• Immigration: Movement into an area.
Slide 12 7.2 A Population Growth Curve
• Biotic potential is the inherent reproductive capacity of a species (biological ability to produce offspring).
• Generally, biotic potential is much above replacement level.
– There is a natural tendency for increase.
Slide 13 7.2 A Population Growth Curve
• Population growth follows a pattern consisting of a lag phase, an exponential growth phase, a deceleration phase, and a stable equilibrium phase.
– Lag Phase: This is the first portion of the curve; slow population growth.
Slide 14 7.2 A Population Growth Curve
– Exponential Growth Phase (Log Phase): More organisms are reproducing, causing accelerated growth; this continues as long as birth rate exceeds death rate.
– Deceleration Phase: The population growth rate slows as the death rate and birthrate come to equal one another.
– Stable Equilibrium Phase: The death rate and birth rate become equal and the population stops growing.
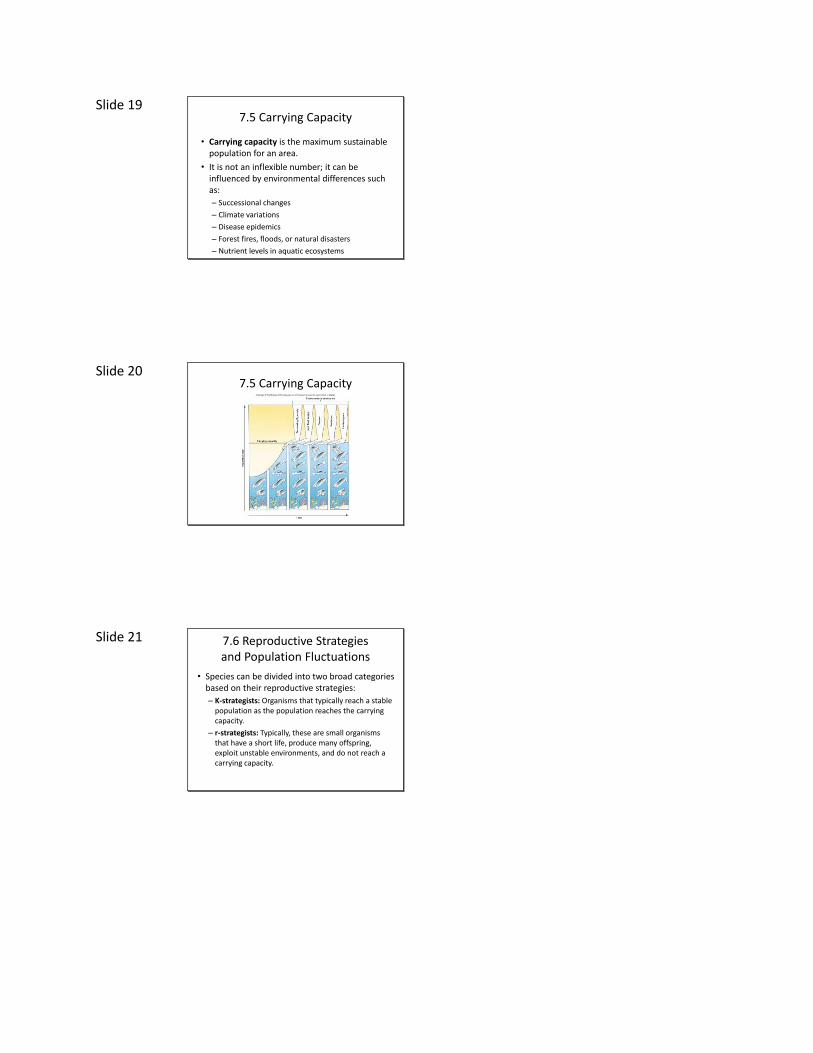
Slide 15 7.2 A Population Growth Curve
A typical population growth curve
Slide 16 7.3 Factors That Limit Population Size
• Factors that prevent unlimited population growth are known as limiting factors.
• All of the different limiting factors that act on a population are collectively known as environmental resistance.
• Extrinsic limiting factors are those that come from outside the population.– Predators
– Loss of food source
– Lack of sunlight
– Accidents of nature
Slide 17 7.3 Factors That Limit Population Size
• Intrinsic limiting factors are those factors that originate within the population and exercise control over it.– Behavioral changes amongst the population cause
lower birthrates and higher death rates.
• Density-dependent limiting factors are those that become more effective as the density of the population increases.
• Density-independent limiting factors are population-controlling influences that are not related to the density of the population.
Slide 18 7.4 Categories of Limiting Factors
• For most populations, limiting factors recognized as components of environmental resistance can be placed into four main categories:
– Raw material availability
– Energy availability
– Accumulation of waste products
– Interactions among organisms
Slide 19 7.5 Carrying Capacity
• Carrying capacity is the maximum sustainable population for an area.
• It is not an inflexible number; it can be influenced by environmental differences such as:
– Successional changes
– Climate variations
– Disease epidemics
– Forest fires, floods, or natural disasters
– Nutrient levels in aquatic ecosystems
Slide 20 7.5 Carrying Capacity
Slide 21 7.6 Reproductive Strategies and Population Fluctuations
• Species can be divided into two broad categories based on their reproductive strategies:
– K-strategists: Organisms that typically reach a stable population as the population reaches the carrying capacity.
– r-strategists: Typically, these are small organisms that have a short life, produce many offspring, exploit unstable environments, and do not reach a carrying capacity.
Slide 22 7.6 Reproductive Strategies and Population Fluctuations
• K-strategist characteristics include:– Usually occupy relatively stable environments
– Large organisms
– Long-lived
– Produce few offspring
– Provide substantial parental care
– Reproductive strategy is to invest a great deal of energy in producing a few offspring that have a good chance of living to reproduce.
• K-strategists are controlled by density-dependent limiting factors.
Slide 23 7.6 Reproductive Strategies and Population Fluctuations
• r-strategist characteristics include: – Small, short-lived organisms
– Produce many offspring
– Little if any parental care
– Exploit unstable environments
– Usually do not reach carrying capacity (boom-bust cycles)
– Reproductive strategy is to produce large numbers of offspring to overcome high mortality.
• r-strategists are controlled by density-independent limiting factors.
Slide 24 7.7 Human Population Growth
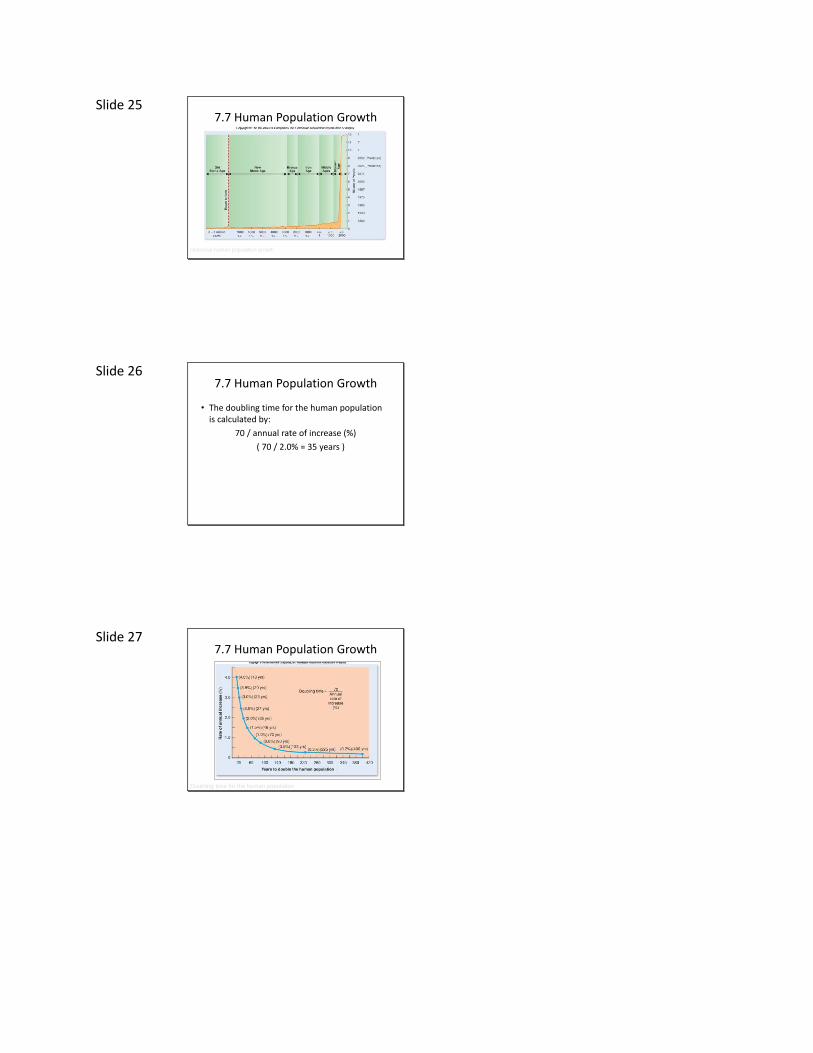
• The human population growth curve has a long lag phase followed by a sharply rising exponential growth phase that is still rapidly increasing.
• A major reason for the increasing human population growth rate is an increase in medical care, and a consequential decrease in death rates.
Slide 25 7.7 Human Population Growth
Historical human population growth
Slide 26 7.7 Human Population Growth
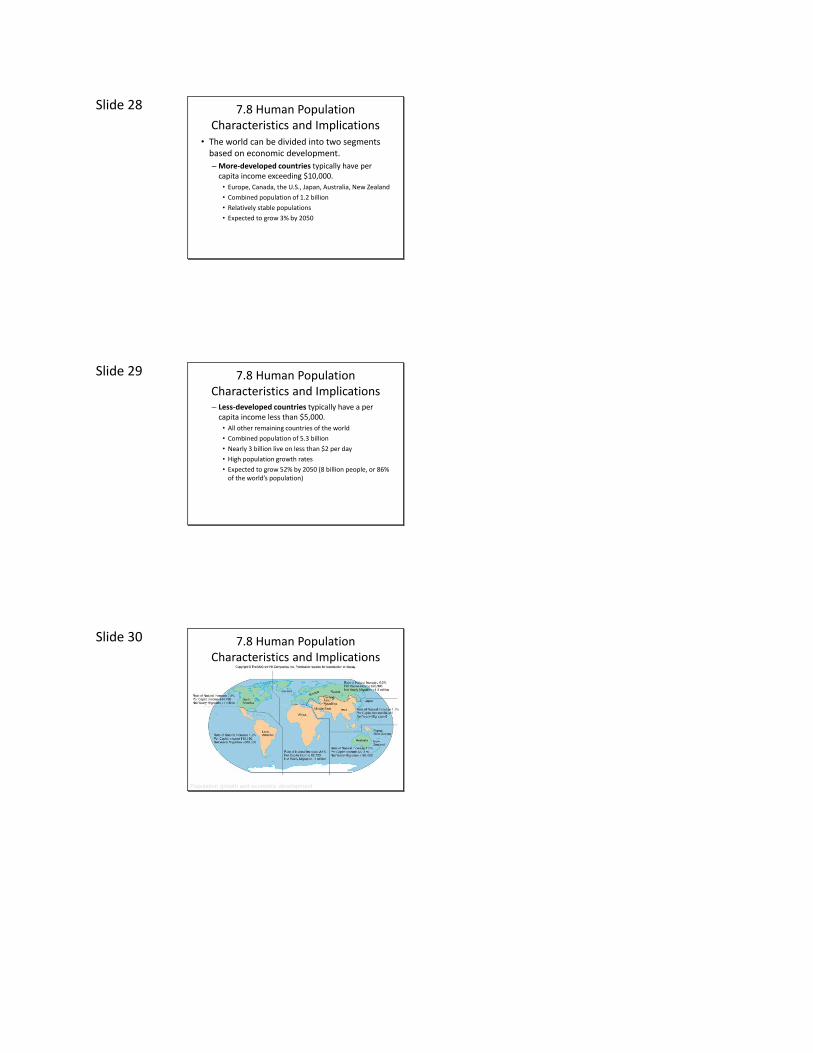
• The doubling time for the human population is calculated by:
70 / annual rate of increase (%)
( 70 / 2.0% = 35 years )
Slide 27 7.7 Human Population Growth
Doubling time for the human population
Slide 28 7.8 Human Population Characteristics and Implications
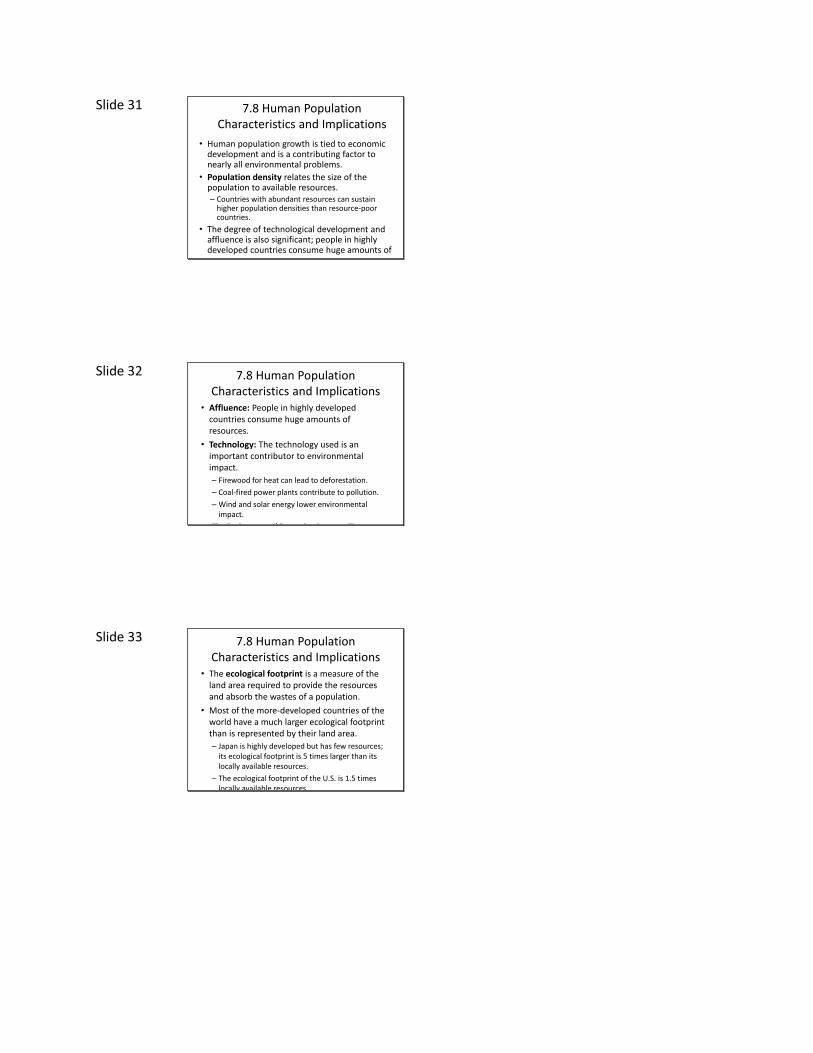
• The world can be divided into two segments based on economic development.
– More-developed countries typically have per capita income exceeding $10,000.
• Europe, Canada, the U.S., Japan, Australia, New Zealand
• Combined population of 1.2 billion
• Relatively stable populations
• Expected to grow 3% by 2050
Slide 29 7.8 Human Population Characteristics and Implications– Less-developed countries typically have a per
capita income less than $5,000.
• All other remaining countries of the world
• Combined population of 5.3 billion
• Nearly 3 billion live on less than $2 per day
• High population growth rates
• Expected to grow 52% by 2050 (8 billion people, or 86% of the world’s population)
Slide 30 7.8 Human Population Characteristics and Implications
Population growth and economic development
Slide 31 7.8 Human Population Characteristics and Implications
• Human population growth is tied to economic development and is a contributing factor to nearly all environmental problems.
• Population density relates the size of the population to available resources.– Countries with abundant resources can sustain
higher population densities than resource-poor countries.
• The degree of technological development and affluence is also significant; people in highly developed countries consume huge amounts of resources.
Slide 32 7.8 Human Population Characteristics and Implications
• Affluence: People in highly developed countries consume huge amounts of resources.
• Technology: The technology used is an important contributor to environmental impact.
– Firewood for heat can lead to deforestation.
– Coal-fired power plants contribute to pollution.
– Wind and solar energy lower environmental impact.
The Environmental Foot print Concept: The environmental impact of highly developed regions is often felt in distant places where goods are produced.
Slide 33 7.8 Human Population Characteristics and Implications
• The ecological footprint is a measure of the land area required to provide the resources and absorb the wastes of a population.
• Most of the more-developed countries of the world have a much larger ecological footprint than is represented by their land area.
– Japan is highly developed but has few resources; its ecological footprint is 5 times larger than its locally available resources.
– The ecological footprint of the U.S. is 1.5 times locally available resources.
Slide 34 7.9 Factors That Influence Human Population Growth
• Humans, unlike other kinds of organisms, are influenced by social, political, economic, and ethical factors.
• We can make conscious decisions based on the likely course of events and adjust our lives accordingly.
Slide 35 7.9 Factors That Influence Human Population Growth
• Biological Factors
– Demography is the study of populations and their characteristics, how those characteristics affect growth, and the consequences of that growth.
– The most important determinant of the rate at which human populations grow is related to how many women in the population are having children and the number of children each woman will have.
– The total fertility rate of a population is the number of children a woman has during her lifetime.
Slide 36 7.9 Factors That Influence Human Population Growth
• Biological Factors
– A total fertility rate of 2.1 is known as replacement fertility; parents produce 2 children who will replace the parents when they die.
– Zero population growth is when the birth rate equals death rate.
– The age distribution is the number of people of each age in the population.
Slide 37 7.9 Factors That Influence Human Population Growth
• Social Factors
– Reducing fertility rates would be advantageous, especially in LDCs, but not everyone agrees.
– Several factors (religious, traditional, social, and economic) influence the number of children a couple would like to have.
– The major social factors determining family size are the status and desires of women in the culture.
– In male-dominated cultures, traditional role of women is to marry and raise children.
Slide 38 7.9 Factors That Influence Human Population Growth
• Social Factors– Early marriages foster high fertility rates.
• In Africa, 17% of births are to women in the 15-19 year-old range.
• Total Fertility Rate of 5.0%
– Childrearing practices also influence population growth rates.• In countries where breast feeding is practiced, several
benefits accrue. – Breast milk is an excellent source of nutrients and antibodies.
– During the months a woman is breast feeding, she is less likely to become pregnant again.
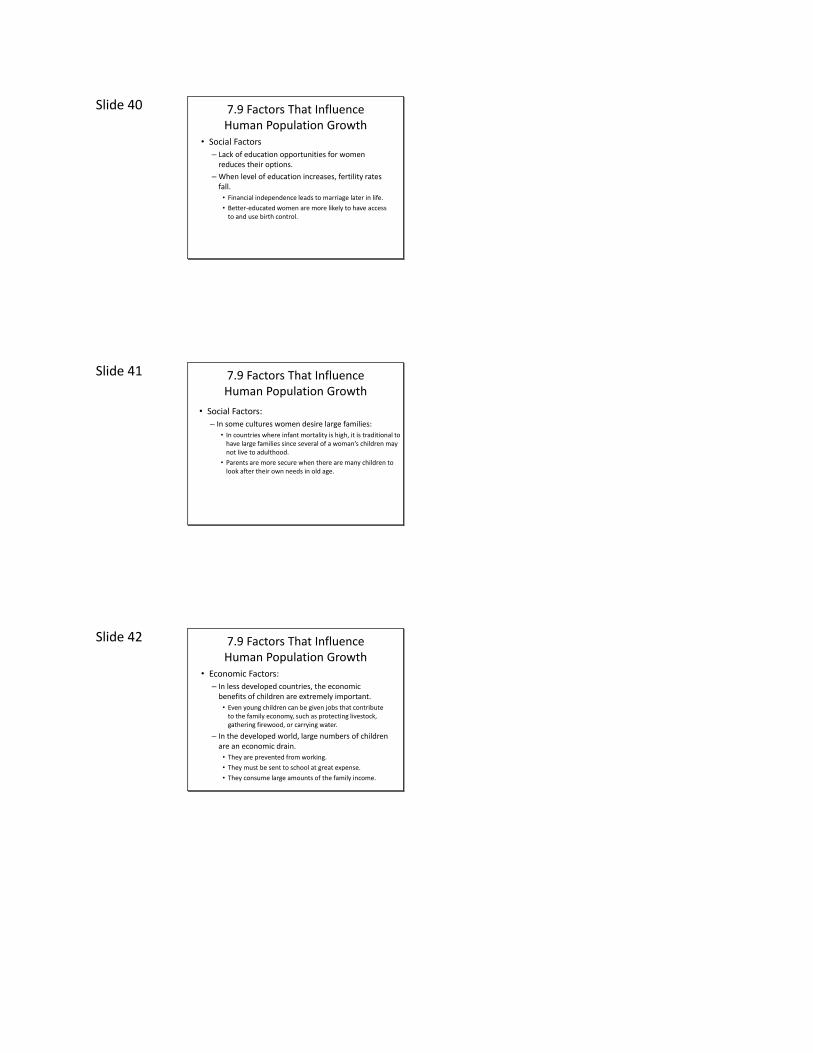
Slide 39 7.9 Factors That InfluenceHuman Population Growth
Slide 40 7.9 Factors That Influence Human Population Growth
• Social Factors
– Lack of education opportunities for women reduces their options.
– When level of education increases, fertility rates fall.
• Financial independence leads to marriage later in life.
• Better-educated women are more likely to have access to and use birth control.
Slide 41 7.9 Factors That Influence Human Population Growth
• Social Factors:
– In some cultures women desire large families:
• In countries where infant mortality is high, it is traditional to have large families since several of a woman’s children may not live to adulthood.
• Parents are more secure when there are many children to look after their own needs in old age.
Slide 42 7.9 Factors That Influence Human Population Growth
• Economic Factors:
– In less developed countries, the economic benefits of children are extremely important.
• Even young children can be given jobs that contribute to the family economy, such as protecting livestock, gathering firewood, or carrying water.
– In the developed world, large numbers of children are an economic drain.
• They are prevented from working.
• They must be sent to school at great expense.
• They consume large amounts of the family income.
Slide 43 7.9 Factors That Influence Human Population Growth
• Political Factors – Governments can either reward or punish high
fertility rates.
– Several European countries are concerned about low birth rates and have instituted policies to encourage couples to have more children.• Paid maternity leave and guaranteed job availability
upon the mother’s return to work.
• Childcare facilities make it possible for both parents to work.
• Child tax deductions provide an indirect payment to families.
Slide 44 7.9 Factors That Influence Human Population Growth
• Political Factors
– Most developing countries are concerned that population growth is too rapid and have instituted programs to limit growth:
• They provide information on family planning and maternal and child health.
• Sometimes governments provide free or low-cost contraceptives.
• One-child policy in China
Slide 45 7.9 Factors That Influence Human Population Growth
• Immigration Policies
– Birthrates are so low in some countries that immigration is encouraged to offset a potential decline in the number of working-age citizens.
– Developed countries are under intense pressure to accept immigrants.
• The higher standard of living is a magnet for refugees or people who seek a better life than is possible where they currently live.
Slide 46 7.10 Population Growth Rates and Standard of Living
• There appears to be an inverse relationship between a country’s growth rate and its average standard of living.
• Standard of living is a difficult concept to quantify since various cultures have different desires.
• Factors usually included in an analysis of standard of living:– Economic well-being
– Health conditions
– Social status and mobility
Slide 47 7.10 Population Growth Rates and Standard of Living
• An important economic measure of standard of living is the average purchasing power per person.
• Gross national income (GNI) is an index of purchasing power measuring total goods and services generated by citizens of a country.
– Gross national income purchasing power parity(GNIPPP) is used to account for varying prices of goods and services between countries.
Slide 48 7.10 Population Growth Rates and Standard of Living
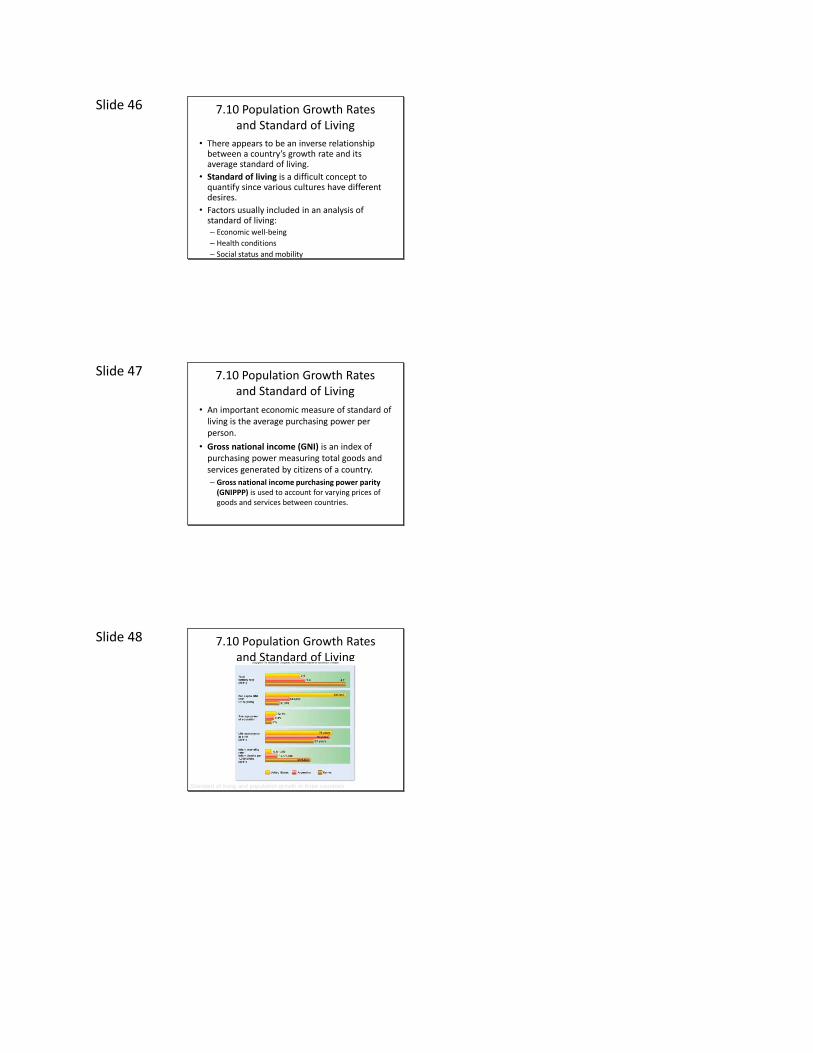
Standard of living and population growth in three countries
Slide 49 7.11 Hunger, Food Production, and Environmental Degradation
• As human population grows, so does the demand for food.
– Most people in developed countries must purchase their own food.
– Most people in less-developed countries must grow their own food.
• Human populations can only increase in size if other plant and animal populations decrease in size.
Slide 50 7.11 Hunger, Food Production, and Environmental Degradation
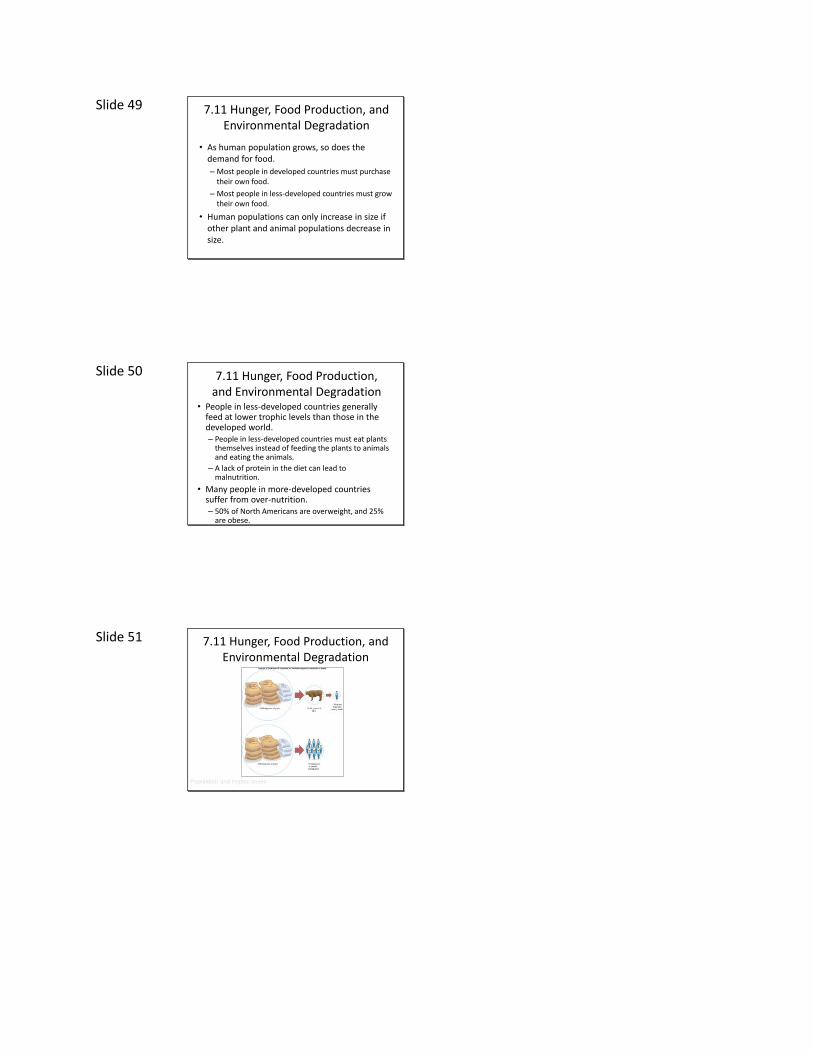
• People in less-developed countries generally feed at lower trophic levels than those in the developed world.– People in less-developed countries must eat plants
themselves instead of feeding the plants to animals and eating the animals.
– A lack of protein in the diet can lead to malnutrition.
• Many people in more-developed countries suffer from over-nutrition.– 50% of North Americans are overweight, and 25%
are obese.
Slide 51 7.11 Hunger, Food Production, and Environmental Degradation
Population and trophic levels
Slide 52 7.11 Hunger, Food Production, and Environmental Degradation
• In countries where food is in short supply, agricultural land is already being exploited to its limit and there is still a need for more food.
• Many more-developed countries are net food exporters.
• Improved plant varieties and agricultural techniques have dramatically increased food production in some parts of the world.
• Political activities such as war, repayment of foreign debt, corruption, and poor management often determine food availability.
Slide 53 7.11 Hunger, Food Production, and Environmental Degradation
• Solving the problem of food distribution is not an easy question.
– Humanitarian food aid provides an excellent service, but:
• It provides a temporary relief of symptoms.
• It works against self-reliance.
• The emphasis must be on self-sufficiency.
Slide 54 7.12 The Demographic Transition Concept
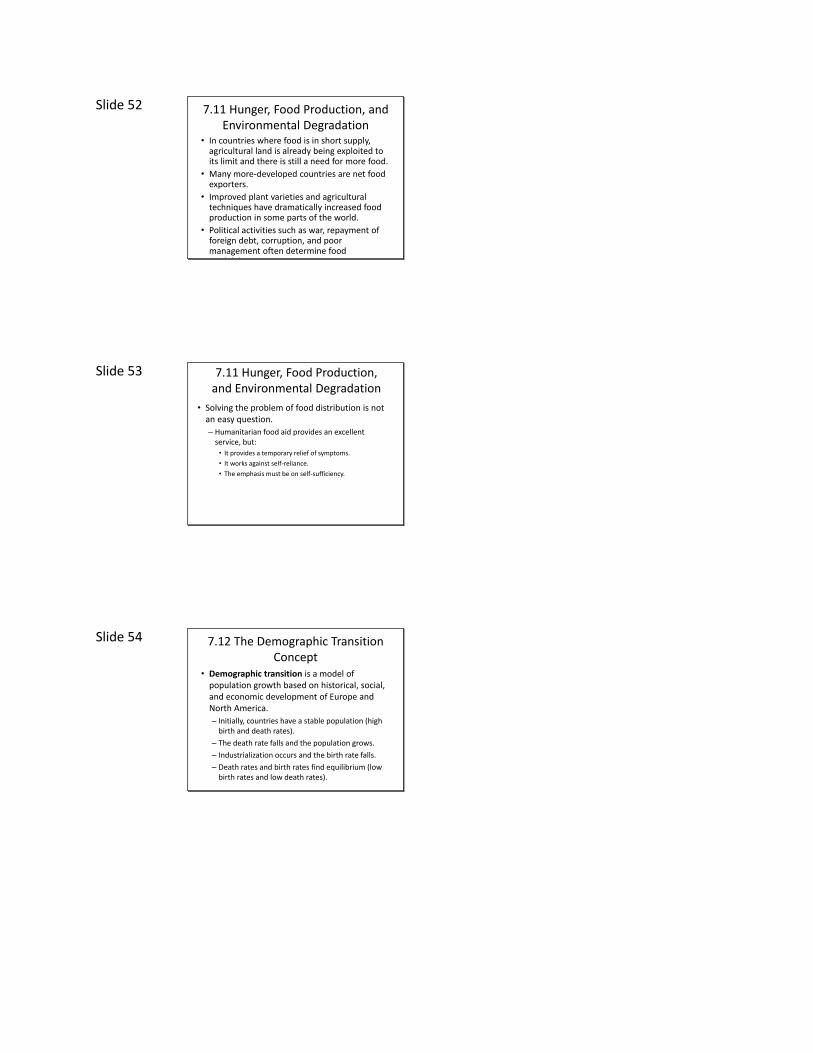
• Demographic transition is a model of population growth based on historical, social, and economic development of Europe and North America.
– Initially, countries have a stable population (high birth and death rates).
– The death rate falls and the population grows.
– Industrialization occurs and the birth rate falls.
– Death rates and birth rates find equilibrium (low birth rates and low death rates).
Slide 55 7.12 The Demographic Transition Concept
Slide 56 7.12 The Demographic Transition Concept
• This is a comfortable model, because it suggests industrialization will naturally lead to population stabilization.
• Can a model developed in Europe and North America be applied to less-developed countries?
– Resources are no longer abundant.
– Human population is growing much faster than before.
Slide 57 7.13 The U.S. Population Picture
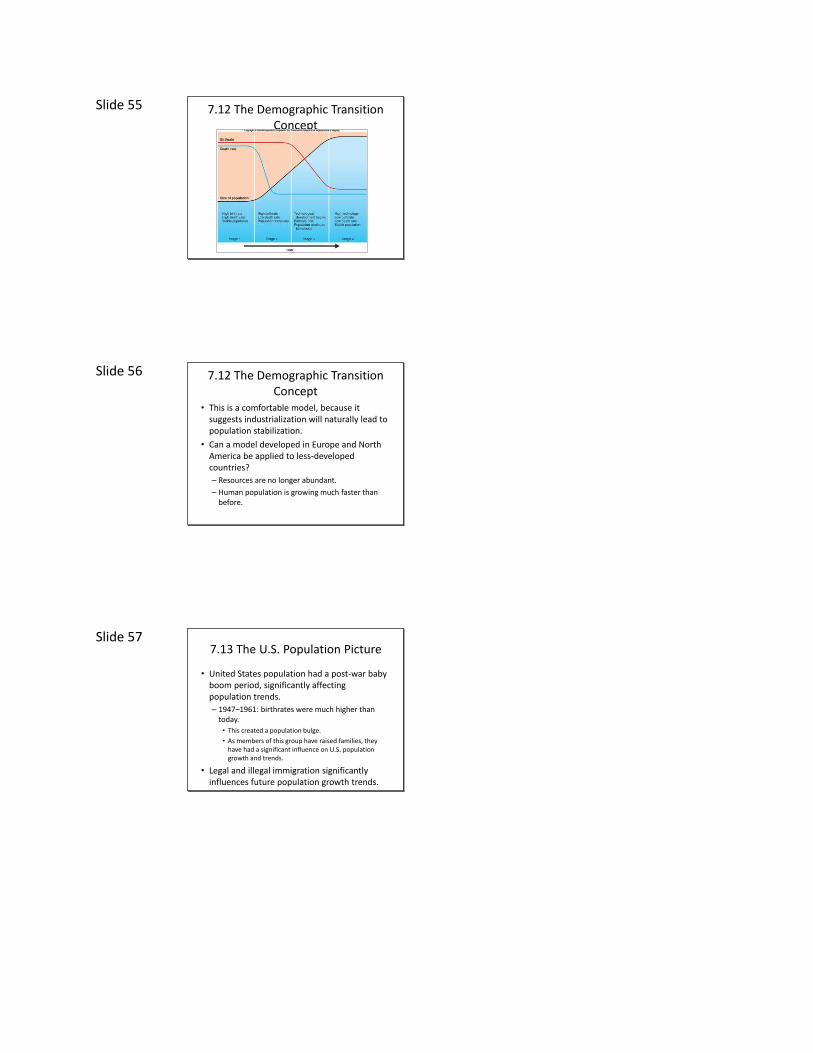
• United States population had a post-war baby boom period, significantly affecting population trends.
– 1947–1961: birthrates were much higher than today.
• This created a population bulge.
• As members of this group have raised families, they have had a significant influence on U.S. population growth and trends.
• Legal and illegal immigration significantly influences future population growth trends.
Slide 58 7.13 The U.S. Population Picture
Changing age distribution of U.S. population
Slide 59 7.14 What Does the Future Hold?
• We must remember that interactions with other species and with other humans will help determine our carrying capacity.
• Four basic factors are involved in this consideration:
1. Available raw materials
2. Available energy
3. Waste disposal
4. Interactions with other organisms
Slide 60 7.14 What Does the Future Hold?
1. Available raw materials
• This issue is not limited to the amount of food available.
• We are also dependent on technology.
• Our lifestyles are tied to use of other resources such as irrigation water, genetic research, and antibiotics.
2. Available energy
• This issue is similar to that of raw materials.
• Increases in energy efficiency and the development of renewable fuels can reduce dependence on fossil fuels.
Slide 61 7.14 What Does the Future Hold?
3. Waste disposal
• Pollution is the waste product of human activity.
• Lack of adequate sewage treatment and safe drinking water causes large numbers of deaths.
4. Interactions with other organisms
• We are not the only species of importance.
• Converting land to meet our needs displaces other species from their habitats.
• What today seems like an unimportant organism may one day be seen as an important link to our own survival.
Slide 62 7.14 What Does the Future Hold?
• Social Factors Influence Human Population
– Current technology and medical knowledge are available to control human population growth and improve the health of the people of the world.
– But humans are social animals who have freedom of choice and frequently do not do what is considered “best” from an unemotional, uninvolved, biological point of view.
– People make decisions based on history, social situations, ethical and religious considerations, and personal desires.
Slide 63 7.14 What Does the Future Hold?
• If the world continues to grow at its current rate, population will surpass 9.4 billion by 2058.
– The human population is subject to same biological constraints as other species.
– The human population will ultimately reach a carrying capacity and stabilize.
• Disagreement about exact size and primary limiting factors
Slide 64 Summary
• The birthrate (natality) is the number of individuals entering the population by reproduction during a certain period.
• The death rate is the number of deaths in a population in a certain period.
• A typical population growth curve shows a lag phase followed by an exponential growth phase, a deceleration phase, and a stable equilibrium phase at the carrying capacity.
• The world’s population is growing rapidly. The causes of population growth are biological, social, political, philosophical, and theological.
Slide 65 Summary
• Most of the growth is occurring in less-developed countries of the world.
• Demography is the study of human populations and the things that affect them.
• Population growth rates are determined by biological factors, but also by social and economic factors.
• The demographic transition model suggests that as a country becomes industrialized, its population becomes stabilized.