chaotic moving striations in inert gas plasmas
TRANSCRIPT
11 October 1999
Ž .Physics Letters A 261 1999 183–190www.elsevier.nlrlocaterphysleta
Chaotic moving striations in inert gas plasmas
Jonathan A. Walkenstein, William B. Pardo, Marco Monti, Robert E. O’Meara,Torben N. Buch, Epaminondas Rosa Jr. )
Nonlinear Dynamics Laboratory, Department of Physics, UniÕersity of Miami, Coral Gables, FL 33146, USA
Received 12 April 1999; received in revised form 17 August 1999; accepted 19 August 1999Communicated by A.R. Bishop
Abstract
Ž .Three distinct data acquisition systems photo-diode, hybrid video camerarrotating mirror, and high-speed video cameraare utilized to study the behavior of a contemporary geissler plasma discharge tube. The geometry of the tube is responsiblefor the large changes that occur in the plasma current density over a short distance. The three techniques utilized revealdetails of the plasma behavior in a complementary manner. The value of the fractal capacity dimension of the attractordepends on the voltage applied across the tube. q 1999 Published by Elsevier Science B.V. All rights reserved.
PACS: 52.25.-b; 52.35.-g; 05.45.qb
Plasmas are typical nonlinear systems with sev-eral degrees of freedom, and of much interest forexperimental testing of the universal characteristicsof chaos such as fractal dimension, Lyapunov expo-nents and routes to chaos. In fact, many plasmaexperiments and numerical simulations have shown
w xthe emergence of nonlinear chaotic behavior 1 .Moreover, there are many commercial devices thatconvert electrical energy into useful photons throughthe intermediary of nonlinear lighting plasmas. Thesedevices range from the common fluorescent lampsand neon signs to much more sophisticated applica-
Žtions as hollow cathode lamps so useful for spectro-. Žscopists , surface processing deposition of thin films
. Ž .and surface etching , and lasers He–Ne, CO2, KrFw x2 . Experimental observations of plasma discharge
) Corresponding author. E-mail: [email protected]
tubes reveal the separation of the plasma into alter-nate luminous and dark zones, or striations 1. Thesestriations are thought to be manifestations of anionization instability in which the density of elec-trons, ions, and neutral excited species in the plasma
w xvary spatially 4 , and due to the presence of nonlin-
1 Plasma striations were probably first observed by Faradaywho discovered the glow discharge while investigating the electri-cal conduction of gases. These striations are found in noble andmolecular gases, and metallic vapors under a wide range of
Ž y4 2 .operating conditions from low to high currents 10 A to 10 A ,Ž y3 2 .from low to high pressures 10 Torr to 10 Torr , and from dcŽ .to microwave frequencies 10 GHz . They are observed in many
systems where a current travels through a gas including fluores-Žcent lights, neon signs, lasers, geissler tubes sealed glass enve-
lope that contains low pressure high-purity gas samples used forcalibration of optical instruments and for providing a standardagainst which unknown quantities can be compared. See, for
w xinstance, 3 .
0375-9601r99r$ - see front matter q 1999 Published by Elsevier Science B.V. All rights reserved.Ž .PII: S0375-9601 99 00588-5

( )J.A. Walkenstein et al.rPhysics Letters A 261 1999 183–190184
w xear terms in the particle conservation equations 5 . Itis generally believed that a wave phenomenon origi-
w xnates the striated column 6 .In this paper we study the effects of the large
changes that occur in the current density of a plasmacolumn over a short distance. The geometry of the
Žgeissler tube a sealed glass envelope that containslow pressure high purity gas samples used for cali-
.brating optical instruments provides the physicalmeans for gradient and direction dependent behaviorof moving striations. The tube consists of two widecylindrical areas containing the electrodes, and a thincapillary area in the central region where the currentdensity is higher. Fig. 1 shows some details of thetube’s wide area with the electrode and part of thecapillary region. The inside diameter of the glassenvelope necks down from 13 mm to 3 mm over alength of 10 mm. This transition between the elec-trode area and the central capillary section creates acurrent density gradient of about 19:1 between thetwo regions. Most housings used to excite geisslertubes are simple 115 VAC@60 Hz step up trans-formers that provide approximately 600 volts ac at10 mA on the tube side of the transformer under loadconditions. Control over the secondary coil of thestep-up transformer can be achieved by connectingthe housing to a variable transformer. We observe
Žpositive striations striations that move from theanode through the positive column towards the cath-
.ode over pressures in the range of 0.1–30 Torr andvarying currents. Striations separate a column intolight and dark regions that move at a speed on theorder of 100 mrs. In the ac configuration, thesestriations move back and forth along the axis to the
tube at a frequency of 60 Hz, from anode to cathodeŽ .positive ion motion in each half cycle. Experimen-tal observations, therefore, require appropriatemethod and equipment to avoid ambiguity in theanalysis of the acquired data. We present here theresults obtained by using three different techniques:light detector with oscilloscope, rotating mirror, andhigh speed image converter. These techniques pro-vide the means for a better understanding of theconnection between experimental measurements andthe physical reality of the plasma. A minute account
Ž .of the second technique rotating mirror has beenw xpresented in Ref. 7 , and specific details about the
Ž .third technique high speed video camera are to bew xfound in Ref. 8 . Therefore we present here more
Ždetails about the first technique light detector with.oscilloscope and less details about the second and
third techniques.Our first data acquision configuration, the photo-
diode based experiment involves a hybrid signalprocessing scheme. For this study we use a PIN
Ž .photo-diode Panasonic PN 334 with 10 ns risetime. The sensor is mounted in an EMF shieldedhousing with a female BNC connector providingsignal output. A photo-voltaic arrangement for thediode sensor is utilized because of the abundance oflight intensity from the neon plasma. The outputfrom the photo-diode is passed in parallel to ananalog derivative circuit, an analog oscilloscope, anda PC based GPIB controlled CAMAC crate. ALeCroy 6810 waveform recorder is used for the dataacquisition which is capable of providing four differ-ential input channels, with acquision rates up to5=106 samplesrsecond and 12 bit resolution. The
Fig. 1. Left-hand side of the geissler discharge tube with nine positions of the PIN photo-diode indicated as P1, P2, . . . , P9.
( )J.A. Walkenstein et al.rPhysics Letters A 261 1999 183–190 185
Žuse of a low noise precision op-amp Burr–Brown.OPA111 in the analog derivative circuit results in a
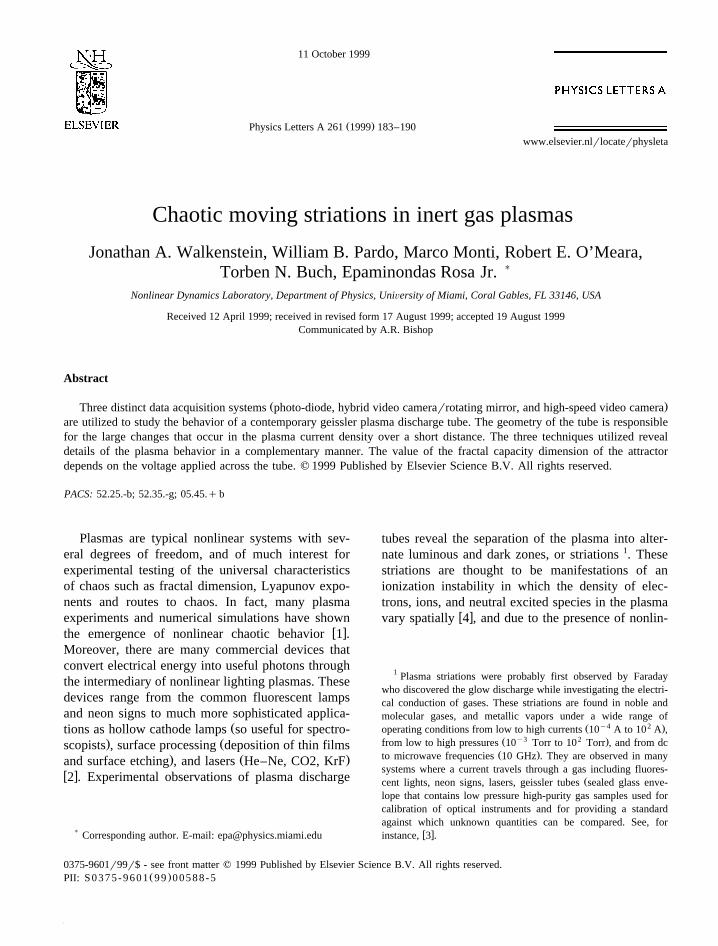
relatively noise insensitive means for computing thederivatives in real time. An analog voltmeter inconjunction with an analog oscilloscope providesreal time monitoring of the system’s behavior. Theanalog differentiator also allows real time observa-tions of attractors constructed by plotting the rawlight intensity time series versus the analog firstderivative. This is accomplished by utilizing the xyplotting capability of the analog oscilloscope. Thepart of the geissler tube illustrated in Fig. 1 showsnine sites 0.5 cm apart indicated as P1, P2, . . . , P9,that correspond to nine positions of the PIN photo-diode which measures the varying light intensity asthe striations go by the site where the photo-diode isplaced. Fig. 2, produced with this experimental con-figuration and the photo-diode placed at position P5,shows a digitized video frame of a real time attrac-tor. We examine the spatial variation of behavior in
the 4 cm length region along the nine positionsindicated in Fig. 1 near one of the electrodes with600 VAC applied. The data sets were 16 Kbytes insize, with light intensity and analog first derivativerecorded at a rate of 1 sample per 10 ms. Fig. 3displays the attractors corresponding to these ninesites clearly indicating the spatial behavior depen-dence of the system. Starting at position P1 all theway through position P8 we can see two distinctcycles, one corresponding to the current in one direc-tion, the other corresponding to the current in theopposite direction. In position P9 they are almostindistinguishable. Scaled Fourier spectra were addedto the lower left-hand side of each attractor to showthe evolution of the dominant frequencies.
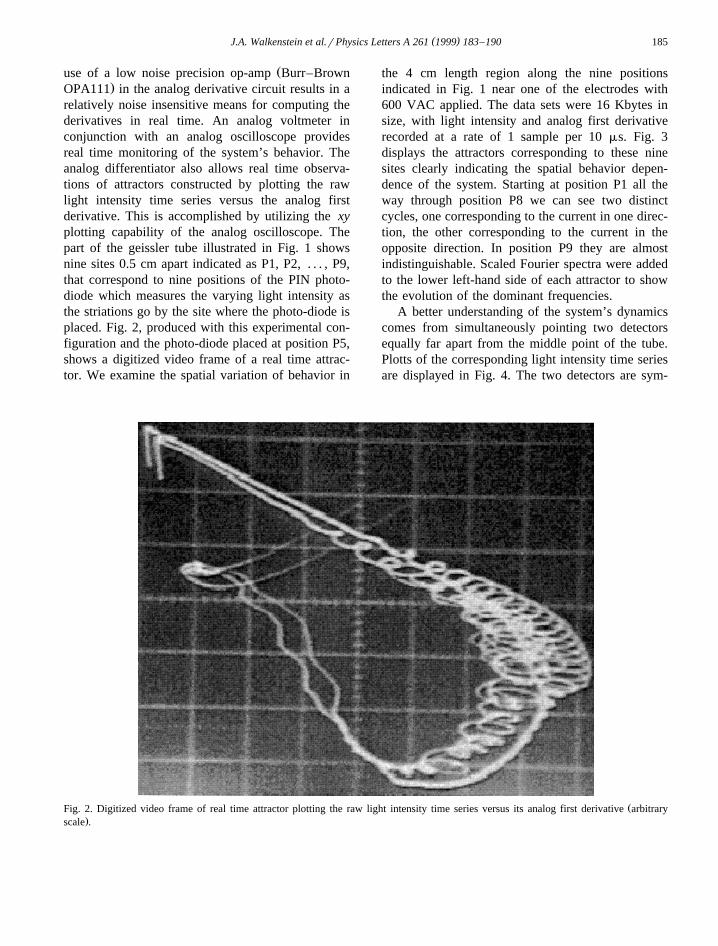
A better understanding of the system’s dynamicscomes from simultaneously pointing two detectorsequally far apart from the middle point of the tube.Plotts of the corresponding light intensity time seriesare displayed in Fig. 4. The two detectors are sym-
ŽFig. 2. Digitized video frame of real time attractor plotting the raw light intensity time series versus its analog first derivative arbitrary.scale .

( )J.A. Walkenstein et al.rPhysics Letters A 261 1999 183–190186
Fig. 3. Attractors constructed from data acquired at the nine positions of the PIN photo-diode indicated in Fig. 1, with the correspondingŽ .Fourier power spectra arbitrary scale .
metrically placed, with respect to the middle point ofthe tube, at sites equivalent to the position P5 of Fig.1. The upper picture, Fig. 4A, shows a schematic
Ž .representation of the geissler tube. Fig. 4B 4Cdisplays the normalized light intensity measured at
Ž .the right-hand left-hand side electrode. The twohumps correspond, in both Fig. 4B and 4C to a fullcycle, the first hump for current flow from left toright, and the second hump for current flow from
Žright to left as indicated by the arrows in thecorresponding representations of the tube below each
.hump . Notice the wave form along the humps, fromleft to right regular-irregular in Fig. 4B, and irregu-lar-regular in Fig. 4C. In the positions of both left
Ž .and right detectors the irregular regular patternhappens when the current flows from the large to the
Ž .small from the small to the large area , with increas-Ž .ing decreasing current density. These observations
are consistent with the results obtained by a filteringtechnique implemented to both remove and isolatethe irregular component of the data. Removal of the
Ž .low frequency component 60 Hz involves the useof a third order butterworth filter designed to give a100 dB attenuation below about 200 Hz. Thesespecifications are both met and implemented by theuse of the MATLAB filtfilt command: After filteringin the forward direction, the filtered sequence is thenreversed and run back through the filter. The result-ing sequence has precisely zero-phase distortion anddouble the filter order. Care is taken care to mini-mize startup and ending transitions by matchinginitial conditions. The extensively tabulated analogcoefficients are converted to digital coefficients suit-able for filtering data with a finite sample rate of 100kHz using the bilinear transform. This bilinear trans-form at the sample rate of 100 kHz perfectly pre-
( )J.A. Walkenstein et al.rPhysics Letters A 261 1999 183–190 187
Fig. 4. Simultaneous light intensity time series for two light detectors. One placed by the left-hand side electrode, and the other placed bythe right-hand side electrode.
serves the response of the filter. It eliminates phasedistortion and produces a signal whose magnitude isthe magnitude of the original data minus the low
Ž .frequency 60 Hz power component. Examinationof these filtered time series clearly show that theirregular component occurs when the striations movefrom the larger electrode region squeezing into thecapillary section of the tube.
Moving striations are also observed with current-regulated dc plasmas. In this case the anode and thecathode do not exchange positions and we can ob-serve the irregular wave form in the region where the
Žcurrent density increases going from the anode area.into the capillary region and the regular wave form
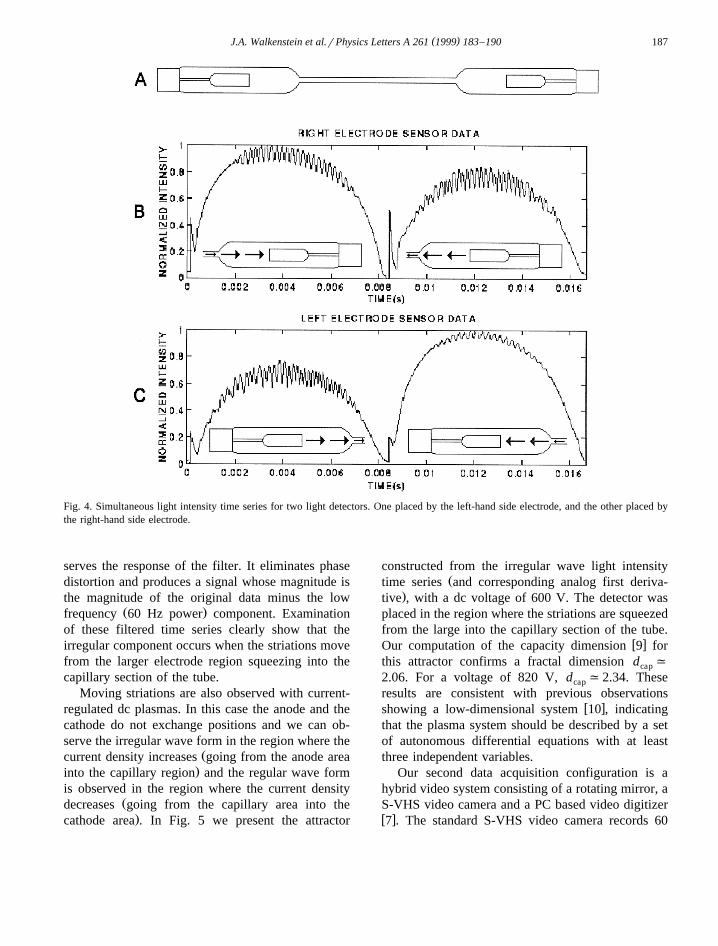
is observed in the region where the current densityŽdecreases going from the capillary area into the.cathode area . In Fig. 5 we present the attractor
constructed from the irregular wave light intensityŽtime series and corresponding analog first deriva-
.tive , with a dc voltage of 600 V. The detector wasplaced in the region where the striations are squeezedfrom the large into the capillary section of the tube.
w xOur computation of the capacity dimension 9 forthis attractor confirms a fractal dimension d ,cap
2.06. For a voltage of 820 V, d ,2.34. Thesecap
results are consistent with previous observationsw xshowing a low-dimensional system 10 , indicating
that the plasma system should be described by a setof autonomous differential equations with at leastthree independent variables.
Our second data acquisition configuration is ahybrid video system consisting of a rotating mirror, aS-VHS video camera and a PC based video digitizerw x7 . The standard S-VHS video camera records 60
( )J.A. Walkenstein et al.rPhysics Letters A 261 1999 183–190188
ŽFig. 5. Attractor reconstructed from the light intensity and its. Žanalog first derivative for the dc geissler tube at 600 V arbitrary
.scale .
Žfieldsrs on video tape, and with the shutter speed or.electronic gate set at 1 ms, the incident light regis-
ters an image on the photosurface of the CCDŽ .charge-coupled device during the 1 ms interval that
the shutter is open. This image is then dumped fromŽthe individual pixels of the CCD to a BBD bucket-
.brigade device , which is scanned and processedelectronically before being recorded as an analogsignal on video tape in the form required by com-mercial television sets. At the same time, the CCD iserased to prepare for the next frame. To improve therecording speed we use a rotating mirror to sweep animage of the object across the photosurface of thecamcorder in a time determined by the rotating speedand geometry of the mirror. In this case the mirrorrotates at 13 500 rpm, and the image takes 10.5 ms to
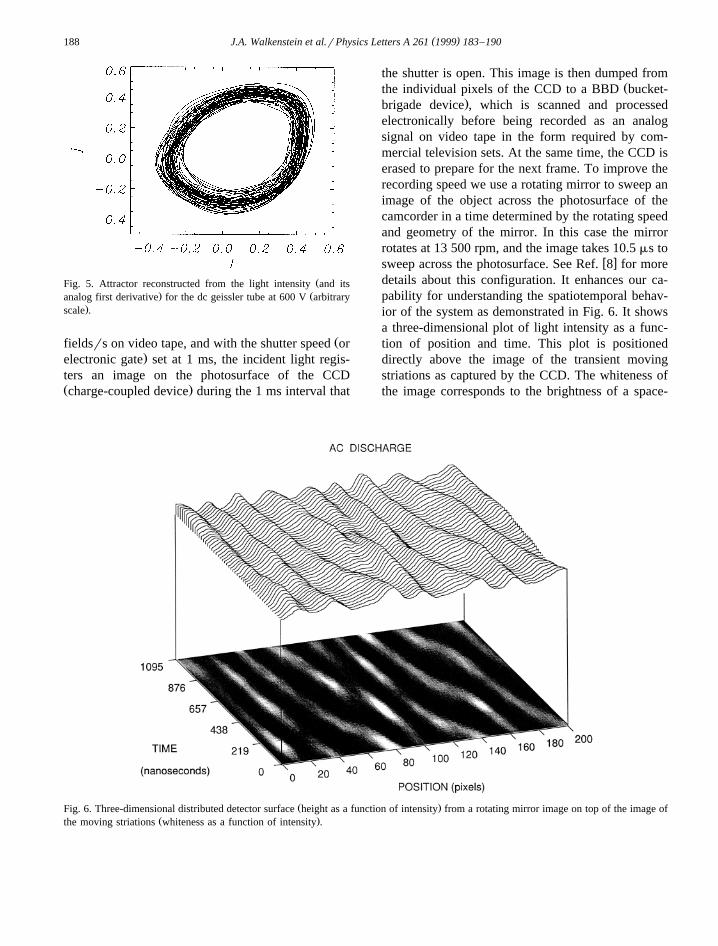
w xsweep across the photosurface. See Ref. 8 for moredetails about this configuration. It enhances our ca-pability for understanding the spatiotemporal behav-ior of the system as demonstrated in Fig. 6. It showsa three-dimensional plot of light intensity as a func-tion of position and time. This plot is positioneddirectly above the image of the transient movingstriations as captured by the CCD. The whiteness ofthe image corresponds to the brightness of a space-
Ž .Fig. 6. Three-dimensional distributed detector surface height as a function of intensity from a rotating mirror image on top of the image ofŽ .the moving striations whiteness as a function of intensity .
( )J.A. Walkenstein et al.rPhysics Letters A 261 1999 183–190 189
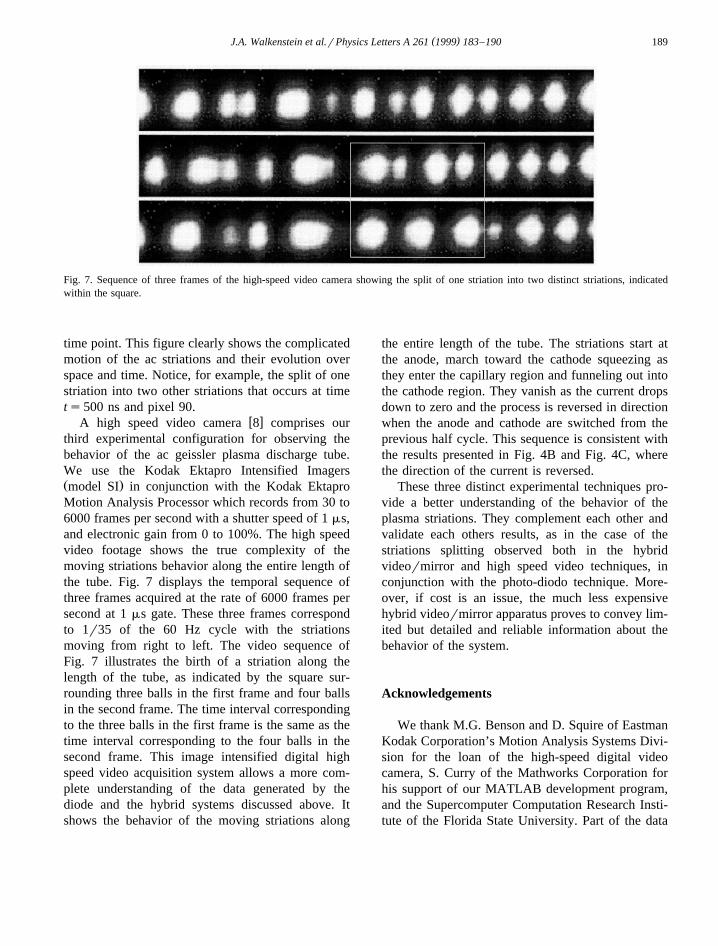
Fig. 7. Sequence of three frames of the high-speed video camera showing the split of one striation into two distinct striations, indicatedwithin the square.
time point. This figure clearly shows the complicatedmotion of the ac striations and their evolution overspace and time. Notice, for example, the split of onestriation into two other striations that occurs at timets500 ns and pixel 90.
w xA high speed video camera 8 comprises ourthird experimental configuration for observing thebehavior of the ac geissler plasma discharge tube.We use the Kodak Ektapro Intensified ImagersŽ .model SI in conjunction with the Kodak EktaproMotion Analysis Processor which records from 30 to6000 frames per second with a shutter speed of 1 ms,and electronic gain from 0 to 100%. The high speedvideo footage shows the true complexity of themoving striations behavior along the entire length ofthe tube. Fig. 7 displays the temporal sequence ofthree frames acquired at the rate of 6000 frames persecond at 1 ms gate. These three frames correspondto 1r35 of the 60 Hz cycle with the striationsmoving from right to left. The video sequence ofFig. 7 illustrates the birth of a striation along thelength of the tube, as indicated by the square sur-rounding three balls in the first frame and four ballsin the second frame. The time interval correspondingto the three balls in the first frame is the same as thetime interval corresponding to the four balls in thesecond frame. This image intensified digital highspeed video acquisition system allows a more com-plete understanding of the data generated by thediode and the hybrid systems discussed above. Itshows the behavior of the moving striations along
the entire length of the tube. The striations start atthe anode, march toward the cathode squeezing asthey enter the capillary region and funneling out intothe cathode region. They vanish as the current dropsdown to zero and the process is reversed in directionwhen the anode and cathode are switched from theprevious half cycle. This sequence is consistent withthe results presented in Fig. 4B and Fig. 4C, wherethe direction of the current is reversed.
These three distinct experimental techniques pro-vide a better understanding of the behavior of theplasma striations. They complement each other andvalidate each others results, as in the case of thestriations splitting observed both in the hybridvideormirror and high speed video techniques, inconjunction with the photo-diodo technique. More-over, if cost is an issue, the much less expensivehybrid videormirror apparatus proves to convey lim-ited but detailed and reliable information about thebehavior of the system.
Acknowledgements
We thank M.G. Benson and D. Squire of EastmanKodak Corporation’s Motion Analysis Systems Divi-sion for the loan of the high-speed digital videocamera, S. Curry of the Mathworks Corporation forhis support of our MATLAB development program,and the Supercomputer Computation Research Insti-tute of the Florida State University. Part of the data

( )J.A. Walkenstein et al.rPhysics Letters A 261 1999 183–190190
acquisition equipment in our laboratory was pur-chased under The United States Department of Edu-cation academic facilities program, Grant Number2-4-01007.
References
w x Ž .1 G.A. Held, C. Jeffries, Phys. Rev. Lett. 56 1986 1183; B.B.Ž .Godfrey, Phys. Fluids 30 1987 1553; P.Y. Cheung, S.
Ž .Donovan, A.Y. Wong, Phys. Rev. Lett. 61 1988 1360; C.Ž .Wilke, R.W. Leven, H. Deutsch, Phys. Lett. A 136 1989
114; T. Braun, J.A. Lisboa, J.A. Gallas, Phys. Rev. Lett. 68Ž .1992 2770; F. Greiner, T. Greiner, A. Piel, Phys. Plasmas 2Ž .1995 1810; T. Klinger, F. Greiner, A. Piel, Phys. Plasmas 2Ž .1995 1822; M. Sanduloviciu, V. Melnig, C. Borcia, Phys.
Ž .Lett. A 229 1997 354; M.S. Hur, H.J. Lee, J.K. Lee, Phys.Ž .Rev. E 58 1998 936; H. Friedel, R. Grauer, K.H. Spatschek,
Ž .Phys. Plasmas 5 1998 3187; T. Braun, Int. J. Bifurc. ChaosŽ .8 1999 1739.
w x Ž .2 J.T. Dakin, IEEE Trans. Plasma Sci. 19 1991 991; J.W.Ž .Coburn, IEEE Trans. Plasma Sci. 19 1991 1048; W.W.
Stoffels, E. Stoffels, G.H.P.M. Swinkels, M. Boufnichel,Ž .G.M.W. Kroesen, Phys. Rev. E 59 1999 2302.
w x3 N.L. Oleson, A.W. Cooper, Advances in Electronics andŽ .Electron Physics 24 1968 155.
w x Ž .4 H.S. Robertson, J.J. Herring, Phys. Fluids 12 1969 836; K.Ž .Ohe, A. Naito, T. Kimura, Phys. Fluids B 3 1991 3302.
w x5 R.A. Goldstein, M.A. Huerta, J.C. Nearing, Phys. Fluids 22Ž .1979 231.
w x Ž .6 M. Rottmann, K.H. Spatschek, J. Plasma Phys. 60 1998215.
w x7 J.A. Walkenstein, W.B. Pardo, H.S. Robertson, M. Monti,Ž .Rev. Sci. Instrum. 66 1995 1.
w x8 T.N. Buch, W.B. Pardo, J.A. Walkenstein, M. Monti, E.Ž .Rosa Jr., Phys. Lett. 248A 1998 353.
w x Ž .9 P. Grassberger, I. Proccacia, Phys. Rev. Lett. 50 1983 346;C. Grebogi, H.E. Nusse, E. Ott, J.A. Yorke, Lecture Notes in
Ž .Mathematics, A. Dold, B. Eckmann, J.C. Alexander Eds. ,Springer-Verlag, 1987, pp. 220–250; P.S. Landa, NonlinearOscillations and Waves in Dynamical Systems, Kluwer, Dor-drecht, 1996, pp. 22–27.
w x Ž .10 J. Qin, L. Wang, Phys Lett. A 156 1991 81; J.A. JohnsonŽ .III, L.E. Johnson, Y. Hong, Phys. Lett. A 158 1991 144; D.
Weixing, H. Wei, W. Xiaodong, C.H. Yu, Phys. Rev. Lett.Ž .70 1993 170.