changing the game: outlook for the global sports market to 2015
TRANSCRIPT

Changing the game
www.pwc.com/sportsoutlook
December 2011
Outlook for the global sports market to 2015

2 Outlook for the global sports market
Our definition of the ‘Sports Market’For the purposes of this report, the sports market consists of:
Sponsorships, which include payments to have a product associated with a team, league or •event and naming rights. Gate revenues for live sporting events. •Media rights fees paid to show sports on broadcast and cable television networks, television •stations, terrestrial radio, satellite radio, the internet and on mobile devices. Merchandising, which includes the selling of licensed products with team or league logos, •player likenesses, or other intellectual property. Food concession revenues are not included.
Definitions of key termsAssociation Football (soccer) is referred to in this report as ‘football’, while American Football −asplayedintheNFL−isreferredtobyitsfullname.‘Ongoing events’ refers to regular sports events and leagues that occur annually or more often. These are distinct from ‘major events’, which are large international events occurring every few years, such as the winter and summer Olympics, and the FIFA World Cup.A glossary is included in the appendix at the back of this publication to explain acronyms and abbreviations used in the paper.

Outlook for the global sports market 3
Contents
Welcome 4Emerging trends in the global sports market 6Global revenue outlook by region 10Gate revenues 14Sponsorship 18Media rights 22Merchandising 26Appendix 28Glossary 36Contacts 40

4 Outlook for the global sports market
Welcome
Welcome to the second edition of PwC’s1 outlook for the global sports market. In this edition we provide revenue forecasts ataglobalandregionalbasisoverthefiveyears to 2015, and also drill down into key segments with projections for gate revenues, sponsorship, media rights and merchandising.
The industry outlookIn this latest edition − Changing the game − we continue to identify and investigate the issues that key players in the wider world of sport are facing, providing the context for the revenue forecasts. We go on to consider what the future might hold for the sports market in a world of increasing economic and political uncertainty and investigate where new opportunities might lie and what challenges to future growth might emerge.
Across the world, we’re seeing ever closer convergence between the sport and entertainment industries, as both sectors continue to rise to the challenges of new digital technologies which shape the way we spend our leisure time. At the same time sponsorships and media rights emerge as the main engines of growth, putting the traditional dominance of gate revenues under pressure. There will need to be much more focus on developing sophisticated measurement techniques to demonstrate the returns on this investment.
1 “PwC” refers to the network of member firms of PricewaterhouseCoopers
International Limited (PwCIL)

Outlook for the global sports market 5
Julie ClarkUK Leader, Sports & LeisureTel: +44 (0)207 213 4170Email: [email protected]
Where now?Despite the recent troubled economic times, sport has continued to thrive, with major events appearing to become more popular than ever. However lower tier events are having to work harder to attract support. We are also seeing more focus on providing value for money, for example by providing added entertainment through offers such as post-event concerts.
The popularity of major events is supported by ongoing improvements in broadcasting and technology, which allow higher-quality coverage than ever before. At the same time, TV companies are embracing social media to engage with fans and deliver a greater intensity of experience. Meanwhile, sponsors remain eager to contribute to − and be associated with − sports events and teams as part of their marketing mix and are using sophisticated data mining to gain increasing levels of intelligence and insight into their target markets.
Hurdles to overcome…Within this generally positive outlook, challenges remain. While stadia, circuits and arenas are full for the big events, spectators face rising ticket prices − and corporate clients and sponsors face wider economic and regulatory concerns of their own. Meanwhile, broadcasters continue towrestlewithfindingthebestwaystoextract value from new media. As sports search for new ways to keep on growing their revenues, player costs − the single largest expense in most sports − continue to increase rapidly, putting pressure on the bottom line.
Sportsorganisationsarefindingitincreasinglydifficulttobalancetheneeds of all their stakeholders – it used to be all about the fan who would simply vote with their feet, but now the fan has a louder voice via social media. At the same time a corporate world of sponsors and broadcasters, can shape the fans’ experience more than ever before. For thesponsor,allthebenefitswhichanassociation with sport can have, can be destroyed by poor behaviour of a player or sports administrator, or by corruption, asintherecentspotfixingscandalbyPakistani cricket players.
…and pointers to the futureSo where do sports go from here? Here are a few pointers to the future that our industry specialists around the world are seeing:
Emerging sports markets in Brazil, •Russia, India, China and the Middle East continue to grow apace, offering scope for the development of new commercial opportunities in these territories for both domestic and international sports and events.
As sponsors allocate increasing •amounts of money to sport, there will be intensifying pressure for far more sophisticated measurement techniques to demonstrate the returns on that investment.
Sporting bodies and associations are •increasingly seeking to introduce new regulations in an attempt to control the cost base and levels of debt in their sports and leave a sustainable business model for future generations.
All sporting bodies are walking a •tightrope, as they attempt to balance increased commercial demands on theirsports,withtheoftenconflictingneed to maintain the integrity and unpredictability that make sporting competitions so exciting and appealing to their supporters.
Overall, as our projections show, sports revenues globally are on an upward path through to 2015, despite a slight reduction in2011whichreflectstheusualpostFIFAWorld Cup dip. So the cake is growing. The real competition is around who can deliver the most entertaining and compelling offerings that will claim the biggest slices.
6 Outlook for the global sports market
Emerging trends in the global sports market
While the commercial dynamics of sport and entertainment have always overlapped, the two are now closer than ever before. At root, people buy tickets to sports events and pay-TV services carrying exclusive sports content expecting to be entertained. If they are not, they will vote with their feet and their wallets − and will soon be followed by media partners and sponsors seeking other opportunities.
In many cases, sporting entertainment and commercial success are now seen as two sides of the same coin. Sport and entertainment events are increasingly being staged together, as a way to enhance the overall experience and extend the length of events − and therefore the time that supporters and viewers stay. With an average US audience of 111 million viewers, the 2011 Super Bowl became the most-watched programme of any kind
in the history of American television. The entertainment line-up included Keith Urban and Maroon 5 during the pre-game, Christina Aguilera singing the national anthem and The Black Eyed Peas at half-time. Glee was the lead-out programme, attracting nearly 27 million viewers, almost double its usual audience. Grand Prix events also now involve concerts, includingLadyGagaperformingattheafter-partyforthefirsteverIndianGrandPrix.
The trend towards blending more entertainment content isn’t always welcomed by ‘purist’ sports fans, who often feel their sport is being hijacked. The shift towards entertainment can also cause dilemmas for governing bodies, which want to encourage excellence in sporting achievement and do not want their core offer of serious sporting competition to be trivialised by too much ‘froth’. When theIndianPremierLeaguewaslaunchedin 2008, almost as much media attention was focused on the cheerleaders as the sporting contest, to the chagrin of diehard cricket fans.
Sport and entertainment converge
Sports media goes social
A further area of convergence between sport and entertainment is the rising use of social media. Social networking continues to create opportunities and challenges for traditional broadcasters −andalsoforsportspeoplewhoappearincreasingly prone to overstepping the boundaries of what they should say on sites such as Twitter. Partly as a result of this open personal interaction, social media allows fans to get closer to athletes and sports personalities, and provides sponsors with an opportunity for two-way communication, thus enabling them both to embed their brand, and also to understand and manage how fans perceive the brand.
This again mirrors trends in entertainment, where social networking is an increasingly closely related and integrated element of the content offering. As people have become used to voting for their favourite acts on television programmes such as the X-Factor, sports fans increasingly want to be involved in their chosen sports via social media sites. The English lower-league football club Stockport County recently gave its fans the opportunity to vote on its summer signings, and many owners of sports media rights look to enhance the value of their rights through presences on Twitter and Facebook.

Outlook for the global sports market 7
Commercial challenges
As such trends gain momentum, the sports industry continues to face challenges on thefinancialandcommercialfront.Manyof these relate to the impact of economic uncertainty and consumer caution, which are affecting all consumer-facing sectors.
However, sport also faces a delicate balancing-act, because of the need to maintain value for money in light of increased ticket prices and rising expectations among the paying public. If sports charge more for tickets, then spectators expect them to provide more in return. The same ultimately applies to the cost of media rights, which can knock on to the pay TV subscriptions funded by subscribers.
The balance between price and value is further complicated by the deep sense of ownership that many sports fans feel fortheircluborsport.Againreflectingtrends in entertainment such as brand and product placement, sports sponsors want to be embedded within the product, rather thanjustbeinganameonashirt.Namingrights remain a popular investment for sponsors, both for new and established sport and entertainment venues. Examples includeBarcelonaFootballClub’sfive-
and-a-half year, €171 million shirt sponsorshipdealwiththenotforprofitQatar Foundation. However, this type of open commercialism does not always go down well with paying customers, and thousands of Barcelona fans signed a petition demanding the agreement be dropped. Sport’s status as a ‘healthy’ pursuitalsotendstogeneratesignificantcriticism of sponsorship from companies such as alcohol or fast food providers, limitingthebenefitsonbothsides.
Rising player costs
In many sports, the focus on providing the most entertaining and successful product isdrivingrapidinflationinplayercosts.This escalating investment in talent is causing growing tensions on two fronts. Oneisfinancial,with− for example − many of Europe’s leading football clubs burdened with massive debts, but only 20 per cent of them reckoned to be turning a profit.Atthestartofthe2011-12season,footballers in Spain’s top division went on strike over unpaid wages, claimed to run into tens of millions of euros.
The other area of tension is with sporting bodies and regulators, who are struggling to maintain a reasonably level playing fieldinfinancialterms,arguablyinorderto maintain an exciting and competitive sporting landscape. Again in European football, the governing body UEFA has drawnupfinancialfairplayrulesthatare scheduled to come fully into effect in the 2013-14 season, and are designed to ensure that football clubs stop their debt-fuelled overspending and live within their means over a rolling three-year period. In theUS,thestartofthe2011–12NationalBasketballAssociation(NBA)seasonwasdelayed by a lockout caused by a standoff betweenplayersandNBAownersoverrevenue sharing and the structure of the salary cap. There are some sign of success however: in Formula 1, the teams agreedtoinstilsomefinancialprudencein response to declining sponsorship revenues during the downturn in 2009 and agreed to the Resource Restriction Agreement, which is believed to have reduced spend over the past two seasons.
Many football fans in Europe look with envy attheNFL’ssysteminAmericanFootball,which involves sharing revenue from the national TV deal, enabling smaller teams to compete more effectively with those with bigger, wealthier fan bases. Yet even the NFLexperiencesproblemsovercollectivebargaining and player remuneration, including a four-and-a-half- month lock-out in2011,followingthefilingofanantitrustlawsuitagainsttheNFLbyagroupofplayers. A new ten-year collective bargaining agreement was signed in August 2011.

8 Outlook for the global sports market
InternationalisationA further challenge for governing bodies is the increasing pressure to grow their sports in new international markets, while at the same time maintaining the local support base and the integrity of their competitions.TheEnglishPremierLeaguehas been widely criticised by fans and media worldwide for proposing a ‘39th game’ in an overseas location. Yet some fans in other sports and countries are more welcoming of international expansion.
Since the publication of our last edition of this Outlook, internationalisation to new markets has continued. Most notably, decisions have been taken to hold the FIFA World Cup in two emerging sports markets − Russia in 2018 and Qatar in 2022.
Arelatedissueistheperennialconflictbetween club and country in sports such as football, where players are remunerated so highly for success in the club game that they are often perceived − rightly or wrongly − to be uninterested in their national team. Cricket authorities in countries such as Australia and England have resolved this issue by awarding top players central contracts to play for their country. However, this results in club, state or county sides effectively losing these players’ services for large parts of the season.
When the NFL announced in 2007 that it was going to set up its now well-established competitive game in the UK, its website received more than a million applications for tickets.

Outlook for the global sports market 9
Broadcast rights: scheduling and engagement issues
Also, while the traditional broadcast model is still responsible for generating the most income from media rights, engagement with fans is increasingly shifting towards new technology. In an era of 24-hour news and player tweets, fans want to know everything and be as close to the action as possible, or even
inside it. Alongside the growing use of 3D and HD TV for sport, examples include the virtual and computer-generated first-downlineusedinNFLcoverage,andtechnology that enables broadcasters to freeze the positions of players in a football match, and then rotate the image digitally in 3D.
While media rights revenues are continuing on a generally upward path, the size of the market remains volatile year on year, depending on the presence or absence of major events such as World Cups and Olympics. What is more, the value of broadcast rights for international tournaments varies depending on local screening times in regions around the world.
This issue can in turn affect the sporting contest itself. The 2011 Rugby World Cup in NewZealandresultedinearlymorningkick-offsinthelucrativeNorthernHemispheremarket. Partly as a result, the major countries’ games were scheduled at weekends to allow them to attract larger European audiences. This led to disquiet about the minor nations having their games squeezed closer together, putting them at an even greater disadvantage to the bigger teams.
Going forward: more regulation − more globalisation?In an era of economic uncertainty, what’s clear is that the balance of global economic power is shifting to the east and south. This will help to maintain the momentum of internationalisation, as sports seek new revenues from the growing middle classes in emerging nations. In turn there may be more regulation of media coverage to protect national interests and domestic sports. In Asia, there is already concern that the obsession with overseas football leagues such as the English Premier Leaguemayactuallybestuntingthedevelopment of local clubs and the game as a whole.
That said, as we will highlight in this Outlook,sportsrevenuesinNorthAmerica− still the world’s largest market − will significantlyoutpacethegrowthinAsiaoverthenextfiveyears.
While the balance of power is shifting, the growth opportunities in the traditional developed markets are far from over.

10 Outlook for the global sports market
Over the five years to 2015, a combination of improved economic conditions, stronger TV advertising, further growth in pay TV penetration, and the ongoing migration of sports to pay TV will be the leading drivers of global sports revenues in all regions.
Thereturnoffinancialservicesandautomobile companies to the sponsorship marketiscontributingtosignificantgrowth in sponsorship spending. Major international events − including the LondonOlympicandParalympicGamesin 2012 and the FIFA World Cup football tournament in Brazil in 2014 − will boost media rights fees and sponsorship revenues in those years, and gate revenues and merchandising in the regions in which they are held.
Global revenue outlook by region
Outlook for the global sports market 11
4.0%
2.9%
3.9%
4.9%
0.0%
1.0%
2.0%
3.0%
4.0%
5.0%
6.0%
North America EMEA Asia Pacif ic Latin America
CAGR 2011 - 2015
Global revenue growth by region 2011-2015Global revenues split by region 2010
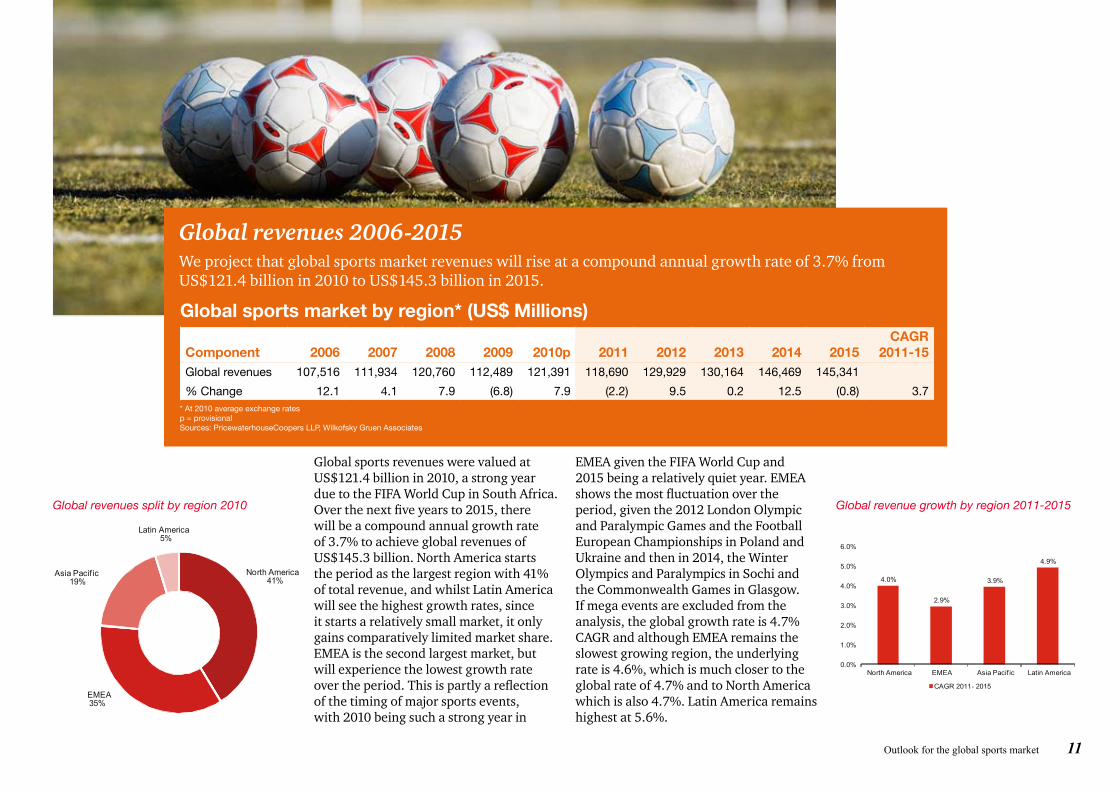
Global revenues 2006-2015We project that global sports market revenues will rise at a compound annual growth rate of 3.7% from US$121.4 billion in 2010 to US$145.3 billion in 2015.
Global sports market by region* (US$ Millions)
* At 2010 average exchange ratesp = provisionalSources: PricewaterhouseCoopers LLP, Wilkofsky Gruen Associates
Component 2006 2007 2008 2009 2010p 2011 2012 2013 2014 2015CAGR
2011-15Global revenues 107,516 111,934 120,760 112,489 121,391 118,690 129,929 130,164 146,469 145,341
% Change 12.1 4.1 7.9 (6.8) 7.9 (2.2) 9.5 0.2 12.5 (0.8) 3.7
Global sports revenues were valued at US$121.4 billion in 2010, a strong year due to the FIFA World Cup in South Africa. Overthenextfiveyearsto2015,therewill be a compound annual growth rate of 3.7% to achieve global revenues of US$145.3billion.NorthAmericastartsthe period as the largest region with 41% oftotalrevenue,andwhilstLatinAmericawill see the highest growth rates, since it starts a relatively small market, it only gains comparatively limited market share. EMEA is the second largest market, but will experience the lowest growth rate overtheperiod.Thisispartlyareflectionof the timing of major sports events, with 2010 being such a strong year in
EMEA given the FIFA World Cup and 2015 being a relatively quiet year. EMEA showsthemostfluctuationovertheperiod,giventhe2012LondonOlympicand Paralympic Games and the Football European Championships in Poland and Ukraine and then in 2014, the Winter Olympics and Paralympics in Sochi and the Commonwealth Games in Glasgow. If mega events are excluded from the analysis, the global growth rate is 4.7% CAGR and although EMEA remains the slowest growing region, the underlying rate is 4.6%, which is much closer to the globalrateof4.7%andtoNorthAmericawhichisalso4.7%.LatinAmericaremainshighest at 5.6%.
North America41%
EMEA35%
Asia
Pacif ic19%
Latin America5%

12 Outlook for the global sports market
North America
Latin America
EMEA
Asia Pacific
LargestregionwithUS$49.9billionor41%ofglobal•revenues in 2010.Projected to grow at 4.0% CAGR to 2015. •Gate revenues are the largest sector at 31.4% in 2010.•Sponsorship is the fastest growing sector to 2015 at •6.1%.
Second largest region with US$42.8 billion or 35.3% of the •total.Projected to be the slowest growing region at 2.9% CAGR to •2015, although if the impact of one-off events is excluded, the underlying growth rate is 4.6%.Gate revenues are the largest segment, accounting for 38.6%.•Sponsorship is the fastest growing segment at 5.3%.•WithinEMEA,theMiddleEastNorthAfricaisexperiencing•the fastest growth of all regions at 6.8% CAGR.
Smallest region with US$5.9 billion or 4.9% of total. •Fastest growing region at 4.9% CAGR to 2015.•Media rights represent the largest sector at 38.3% of the •total.Media rights are also the fastest growing sector at 5.6%.•
Currently the 3rd largest region at US$22.7 billion.•It is also expected to have the 3rd fastest growth rate at •3.9%.Sponsorship is the largest sector at 43.2% of the total.•Sponsorship and media rights are jointly the fastest •growing sectors at 4.4% CAGR.

Outlook for the global sports market 13
Spotlight on the BRICS
Growth in the sports market in the BRIC countries−Brazil,Russia,IndiaandChina−stronglyoutpacedtheoverallglobalmarket between 2006 and 2010, growing at a compound annual rate of 7.7 percent compared with a CAGR of only 3.4 percent for the global market during that period. Butduringthenextfiveyearsthisgapwill narrow sharply, with sports revenue growth in the BRIC countries averaging 4.5 percent compounded annually compared with 3.7 percent for the global market.
Following China’s staging of the Olympics in Beijing in 2008 and India’s hosting of the Commonwealth Games in 2010, the next few years will see the other BRICs increasetheirprofileashostsofmajorevents. Brazil will host the 2014 FIFA World Cup, the Copa America in 2015 and the 2016 Summer Olympics. Russia has the World Summer Universiade 2013 in Kazan, the Olympic and Paralympic Winter Games in Sochi in 2014 and the FIFA World Cupin2018.RussiawillalsohostitsfirstFormula 1 Grand Prix in 2014.
5.3%
4.6%5.0%
3.3%
0.0%
1.0%
2.0%
3.0%
4.0%
5.0%
6.0%
Brazil Russia India China
CAGR 2011 - 2015
BRIC revenue growth 2011-2015 by country
Brazil39%
Russia8%
India18%
China35%
BRIC revenues split by country 2010
BRIC revenues 2010-2015We project that BRIC market revenues will rise at a compound annual growth rate of 4.5% from US$8.3 billion in 2010 to US$10.4 billion in 2015.
* At 2010 average exchange ratesp = provisionalSources: PricewaterhouseCoopers LLP, Wilkofsky Gruen Associates
BRIC sports market by country* (US$ Millions)
Component 2006 2007 2008 2009 2010p 2011 2012 2013 2014 2015CAGR
2011-15BRIC revenue 6,167 6,468 7,539 6,976 8,326 7,929 8,337 8,822 12,121 10,388
% Change 9.9 4.4 16.6 (7.5) 19.4 (4.8) 5.1 5.8 37.4 (14.3) 4.5
14 Outlook for the global sports market
Gate revenues
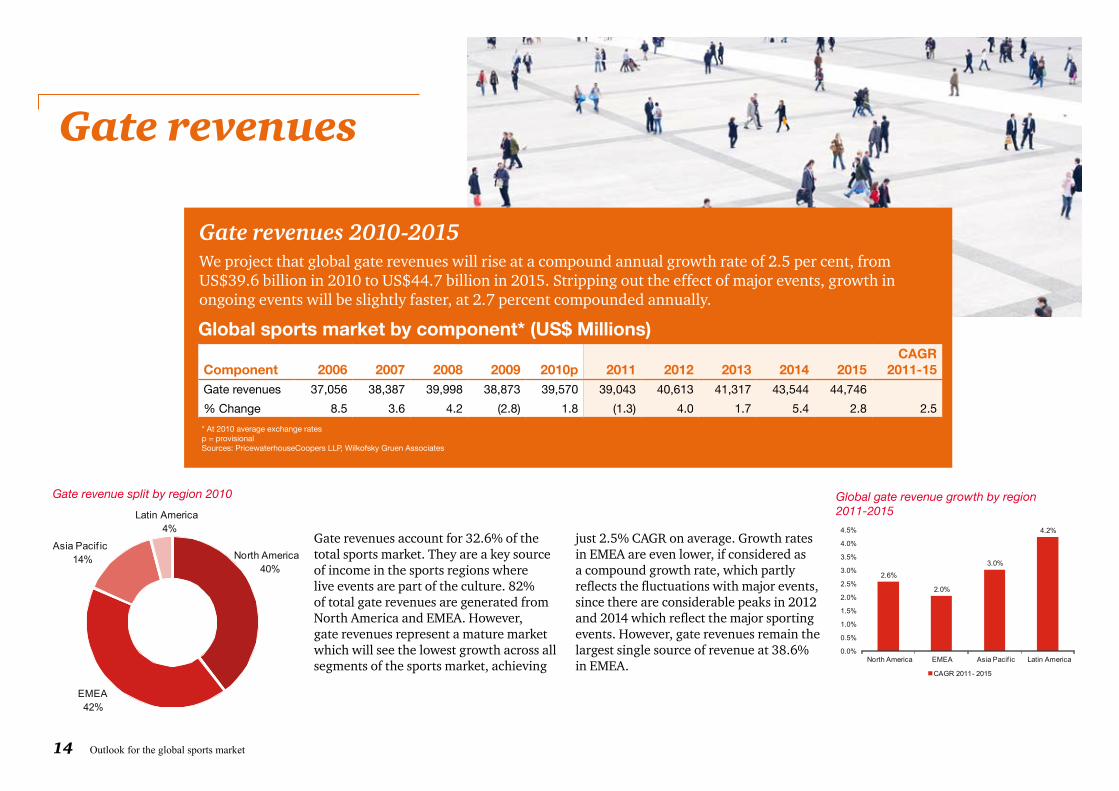
Gate revenues 2010-2015We project that global gate revenues will rise at a compound annual growth rate of 2.5 per cent, from US$39.6 billion in 2010 to US$44.7 billion in 2015. Stripping out the effect of major events, growth in ongoing events will be slightly faster, at 2.7 percent compounded annually.
Component 2006 2007 2008 2009 2010p 2011 2012 2013 2014 2015CAGR
2011-15Gate revenues 37,056 38,387 39,998 38,873 39,570 39,043 40,613 41,317 43,544 44,746
% Change 8.5 3.6 4.2 (2.8) 1.8 (1.3) 4.0 1.7 5.4 2.8 2.5
Global sports market by component* (US$ Millions)
* At 2010 average exchange ratesp = provisionalSources: PricewaterhouseCoopers LLP, Wilkofsky Gruen Associates
2.6%
2.0%
3.0%
4.2%
0.0%
0.5%
1.0%
1.5%
2.0%
2.5%
3.0%
3.5%
4.0%
4.5%
North America EMEA Asia Pacif ic Latin America
CAGR 2011 - 2015
Global gate revenue growth by region 2011-2015
North America40%
EMEA42%
Asia Pacif ic14%
Latin America4%
Gate revenues account for 32.6% of the total sports market. They are a key source of income in the sports regions where live events are part of the culture. 82% of total gate revenues are generated from NorthAmericaandEMEA.However,gate revenues represent a mature market which will see the lowest growth across all segments of the sports market, achieving
just 2.5% CAGR on average. Growth rates in EMEA are even lower, if considered as a compound growth rate, which partly reflectsthefluctuationswithmajorevents,since there are considerable peaks in 2012 and2014whichreflectthemajorsportingevents. However, gate revenues remain the largest single source of revenue at 38.6% in EMEA.
Gate revenue split by region 2010

Outlook for the global sports market 15
This concern over the balance between competitive sport and mass-entertainment can reduce consumers’ willingness to pay for the live experience, and raise the question of whether prices can continue to rise inexorably at capacity constrained events. Declining attendances for matches atIndianPremierLeague(IPL)cricketmatches in 2011 was widely ascribed to consumers’ fatigue over the number of gamesandthenoveltyoftheIPL’sglitzwearing off.
Such experiences also give rise to wider concerns about sports losing contact with their roots at a local level, and their ability to grow the fan base of the future. When Argentina’s national football team played Venezuela in Kolkata in India in 2011, the cheapest tickets were priced at 700 Rupees (US$16), effectively excluding all buttheaffluentmiddle-classes.DespitewidespreadpublicmaniaoverLionelMessi’s presence in India, the 120,000-seater stadium was only about two-thirds full for the match, although this remains an impressive attendance in a country dominated by cricket.
Pricing and the risk of overselling are key considerations when trying to expand all sports internationally, especially to countries where attending live sporting events is less of a part of the local culture. Dragon boat racing is hugely popular in Singapore, and it is notable how Formula 1’s Singapore Grand Prix has emulated the atmosphere of the annual Dragon Boat Festival by running entertainment offerings over an entire weekend, with the2011eventincludingLinkinParkandShakira.
As we’ve already highlighted, attendances at top live events remain strong worldwide. Fans retain a strong desire to be part of the live experience, whether the attraction be sport, entertainment such as music, or increasingly both together. The growing appeal of the live experience appears to apply to all high-profile sporting events, including the 2010 FIFA World Cup in Africa, and the 2011 Cricket World Cup in India, Sri Lanka and Bangladesh.
The fact that tickets for major events are often completely sold out − examples include the Super Bowl, the ballot for the London2012OlympicandParalympicGames, ‘Ashes’ cricket test matches between England and Australia, and the show courts at Wimbledon − underline that gate revenues at the top end are constrained by capacity. The fact that tickets are hard to get may actually increase their attractiveness. However there is a risk of saturation lower down the hierarchy of events, with spectators sometimes feeling that the product is being oversold, and that competitive quality may havebeensacrificedtomass-appeal.
As well as being sporting competitions, these events are social occasions that people like to be at, experience and talk about. The social element can be especially attractive at one-off events with a particularly high-society brand and appeal, such as the UK’s Henley rowing regatta. These types of occasions, together with smaller events associated with major ones such as Olympic athletics trials, are generating rising attendances.
…so long as the price−and culture−are right

16 Outlook for the global sports market
Regional spotlight: Gate revenues in EMEAThe economic downturn had an adverse effect on gate revenues in EMEA, with gate revenues for ongoing events falling by 1.8 percent in 2009 and an additional 1.0 percent in 2010.
With economic conditions remaining uncertain, we do not expect significantgrowthinthenearterm.Nevertheless,interestinsportsremains high and there are signs that the gate revenue market is turning around. We expect modest growth averaging less than 2 percent compounded annually during the next two years, with only slightly faster increases of just over 3 percent annually for ongoing events during 2013–15. The gate revenue market is effectively saturated. Interest in association football is high and attendance does not show dramatic year-to-year variation. Price increases will be the principal driver of growth.
Actual gate revenues will be affected by several international events thatwillbehostedinEMEA.TheLondonOlympicandParalympicGames in 2012 and the Sochi Winter Olympics and Paralympics in 2014 will boost gate revenues in those years as will the Common-wealth Games in Glasgow in 2014 and Rugby World Cup in England in 2015. Euro 2012 in Poland and Ukraine will provide an additional lift that year as well.
The fact that the gate revenue market for some of the bigger sports appears to be mature and saturated raises the question of where growth will come from in the future. One unlikely stimulus for growth is regulation: in European football, UEFA’s financialfairplayrulesareforcingclubstotry and boost their football revenues, and thereby are providing an extra impetus for new stadia development, not least among Italian clubs.
Another source of growth in gate revenues is shorter format events. The usual aim is to produce a version of the sport that is faster, less time-consuming and more exciting, so helping it to attract a new audience − such as the 18-25 and female demographics, and/or gain popularity in new territories. Examples include the growth of rugby sevens in AfricancountriessuchasNamibiaandKenya, where there is little in terms of local tradition for the full format game, but the shorter version is commercially sustainable. Other sports that have tried this include cricket with its highly successful venture into T20, ‘power snooker’, and powerplay golf, which is still in its early days.
The global attractiveness of major sporting events is underlined by their ongoing and generally successful expansion around the world over the last 20 years. This growth reflectsnotjustthedesireofsportingbodies and owners to push their sports into new markets, but also demand-pull from governments.
The motivations for hosting events include the fact that they put countries on the map − as with the staging of international cricket in the Middle East − and demonstrate that their governments can deliver and manage prestigious major events, as with the Beijing Olympics. Hosting Formula 1 Grand Prix has proved especially attractive to countries around the world, resulting in an ever-expanding Formula 1 map, with South Korea opening in 2010, India in 2011, and Sochi Russia in 2014.
That said, there are risks in hosting major events. If it is perceived that the preparations have been poor, then they can attract adverse publicity and damage the country’s reputation, as occurred with the 2010 Commonwealth Games in Delhi. There are also risks for the sports. It is important to work out who will pay to come and watch both from the local and overseas markets. And questions often arise about the sustainability of efforts at internationalisation, such as with the new Indian Grand Prix circuit, which failed to achieve full capacity. Elsewhere the evidence is patchy, with Formula 1 appearing to be continuing to grow in countries such as Turkey while in others such as South Korea, it appear to have plateaued.
Other risks around hosting major events include the recurrent problems around a lack of legacy use for the stadia where they have been hosted. Stadia that were used for the FIFA World Cup in South Africa remain under used. Russia and Qatar are looking to apply innovation to solve this, by dismantling some of the new stadia after the Sochi 2014 Winter Olympics and Paralympics and 2022 FIFA World Cup events to reassemble in other areas.
Seeking new sources of growth

Outlook for the global sports market 17
Sporting bodies continue to innovate in pursuit of growth in gate revenues. Clear examples − as we highlighted in the introduction to the Outlook − include combining concerts and sporting events into one event, as frequently now happens with motor sport and horse racing.InthecaseoftheIPL,theadditionof entertainment-inspired glamour extends to creating theatre and spectacle at matches, and having teams owned by − and closely associated with − top Bollywood movie stars.
All such marketing efforts raise the need to strike the right balance between entertainment and sport, and between drawing in crowds and maintaining the credibility and quality of the sport on offer. Cricket bodies, for example, need to consider the potentially negative impact ofthegrowthintheIPL’sT20formatonrevenues from the more established Test and 50-over formats.
Where next
Gate receipts: key messagesGate revenues, while important in certain markets, are growing less quickly than in the past.
Value for money is key for all but the very top events − both in terms of pricing and provided added-value entertainment
For most sports, there is an important link between the live experience and the experience of the TV viewer, since the viewing experience is far better and more atmospheric if the stadium is full. Organisers can further improve the viewing experience by managing and incentivising the paying attendees.
Spectators can become part of the entertainment as they are encouraged to display ever more complex messages in the stands through the distribution of coloured cards. More controversially, the vuvuzelas used at the FIFA World Cup in South Africa created a distinctive atmosphere; and the crowd can become a platform for the sponsor, as evidenced by the sea of orange caps distributed by Vodafone and seen at various Grand Prix events.

18 Outlook for the global sports market
Sponsorship
Sponsorships 2010-2015We project that global revenues from sports sponsorships will increase from US$35 billion in 2010 to US$45.3 billion in 2015, a 5.3 percent compound annual increase. Stripping out major events, growth in sponsorships for ongoing events will average 6.4 percent compounded annually.
Component 2006 2007 2008 2009 2010p 2011 2012 2013 2014 2015CAGR
2011-15Sponsorships 26,749 29,273 32,494 31,467 34,972 35,132 39,173 40,236 45,559 45,281
% Change 14.2 9.4 11.0 (3.2) 11.1 0.5 11.5 2.7 13.2 (0.6) 5.3
Global sports market by component* (US$ Millions)
* At 2010 average exchange ratesp = provisionalSources: PricewaterhouseCoopers LLP, Wilkofsky Gruen Associates
6.1%
5.3%
4.4%4.9%
0.0%
1.0%
2.0%
3.0%
4.0%
5.0%
6.0%
7.0%
North America EMEA Asia Pacif ic Latin America
CAGR 2011 - 2015
North America34%
EMEA34%
Asia Pacif ic28%
Latin America4%
Sponsorship revenue growth by region 2011-2015
Sponsorship revenue split by region 2010
Accounting for 28.8% of the total sports market sponsorship will be a key engine for growth in total revenues over the period, with an average growth rate globally of 5.3%. This is relatively equally shared across the regions, with Asia Pacifichavingthelowestgrowthrateof4.4%andNorthAmerica,thehighestat 6.1%. If major events are excluded
from the analysis, however, and the underlying growth rate in the market only is considered, sponsorship falls to the second fastest growing revenue source, having been overtaken by media rights. Sponsorship is a key component of the total revenue mix in certain regions, with 43.2% of all revenue in Asia coming from sponsorship.

Outlook for the global sports market 19
Global match day gate revenues remain flat or even declining − edging downwards by 1.3 per cent in 2011 making sponsorship an increasingly important revenue stream for many sports. The industry’s fastest growing source of money, sponsors have continued to be attracted to sport throughout the downturn, with a modest decline in 2009 followed by a double-digit rebound in 2010.
Recent examples of innovative sports sponsorships include English football club Tottenham Hotspurs’ decision to sign up with different shirt sponsors for different competitions, with Investec sponsoring its shirts for all domestic and European cup competitions, and Autonomy for PremierLeaguematches.AndManchester
United has signed up with a sponsor for its training shirt. Football has a dominant share of sports sponsorship deals by number, with the Olympics, motorsport and American football also putting in a strong showing.
Sponsorship is a particularly important revenue source in certain geographies. In the BRIC countries, for example, it represents the biggest component of the sports market. The same applies in Asia Pacificasawhole.InChina,sponsorshipaccounts for some 48 per cent of total sports revenues.
0
200
400
600
800
1000
1200
1400
1600
1800
2006 2007 2008 2009 2010
Number of deals
Source: World Sponsorship Monitor

20 Outlook for the global sports market
Regional spotlight: Sponsorship in Asia PacificSponsorshipsrepresentthelargestcomponentofthesportsmarketinAsiaPacific.In2010,sponsorshipsassociated with the FIFA World Cup, the Asian Games and the Commonwealth Games generated an incremental US$916 million, which contributed to the 16.8 per cent increase from 2009. Even without those sponsorships related to major events, the underlying market rose 5.9 per cent.
InAustralia,thenewdealbetweenToyotaandtheAustralianFootballLeagueforA$8millionannuallyisthelargestsinglesponsorshipdeal.ThePeople’sRepublicofChina’sfirstnamingrightsdealwassigned in 2010, as Mercedes-Benz acquired the naming rights to a new arena in Shanghai. And in India, NokiareplacedBhartiAirtelasthetitlesponsoroftheChampionsLeagueTwenty20tournament,whileNikeraiseditssponsorshipsupportforthenationalcricketteamtoUS$65millionforfiveyears,morethan 30 per cent higher than the previous deal with Bharti Airtel.
Motivations for sponsorshipWhilst the rationale for why companies decide to invest in sports sponsorships varies widely, what can be said is that the key motivation is no longer just about maximising brand visibility and awareness, but is also about gaining deeper and more emotional engagement with fans and staff, and even managing the perception of the sponsoring company. Fast food chain McDonalds − a sponsor of the Olympics since 1976 and FIFA World Cups since 1994 − has signed up Olympic US multiple-medallist Darra Torres to front its campaign in the run-up to the 2012 Olympics, promoting exercise and balanced eating.
Banksandinsurancefirmstendtouseittogenerate global recognition. For example StandardCharteredsponsorsLiverpoolFootball Club’s shirts, and the UBS Chinese Grand Prix was held in Shanghai in April 2011. Sberbank of Russia’s decision to become a General Partner of the Sochi 2014 Winter Olympics was motivated in large part by a desire to innovate and raise itsinternationalprofile.
Lifestyleproductsandservicesontheother hand, use sport − along with music, cinema, theatre, art and so on − to access consumers, and to enhance and be part of the experience. Orange, for example, has signed up with UEFA to sponsor the Euro 2012 football tournament. More generally, telecommunications companies are now heavier sponsors of sport than a decade ago, including Vodafone’s sponsorship of the Australian cricket team and the Russian telecommunications company MegaFon’s active sponsorship of domestic Russian sports leagues, the World Universiade in 2013 in Kazan and the Sochi 2014 Winter Olympics and Paralympics.
An increasingly key element of the rationale both for advertisers and sponsors is integration of social media in their sports involvement. The domestic appliance maker Indesit has launched Football.Indesit.com as the community hub for sponsorship of four European football teams, including AC Milan and Arsenal. Building on a social networking base, companies can use data mining to help them develop content that is relevant to each platform and each consumer segment.

Outlook for the global sports market 21
Regulatory changesChanges in restrictions on which industries are allowed to undertake sponsorships canhaveadramaticeffectontheprofileof the sports sponsorship community. For example, the lifting of regulations banning beer sponsorship in US, has led to substantial sponsorship deals for theNFL,NHLandMLS,andtriggeredasharp jump in sponsorship spending by alcohol companies. Aside from regulatory effects, the revival in the US automotive industry has had a similar effect on that sector’s spending. Meanwhile in Europe, the proposed legalisation of online betting in Germany may open up further opportunities for sports sponsorship.
Going forward, football sponsorship in Europe will be further affected by the financialfairplayrules,whichwillrequireafocusondefiningvalue.Tocomplywith the rules, related parties will only be allowed to sponsor a club if they can demonstrate the fair value of the deal. Manchester City’s estimated £400 million 10-year sponsorship deal with Etihad Airways for both the club’s shirt and stadium is likely to come under scrutiny from UEFA, because of the Abu Dhabi links of both parties. More generally, the rising importance of establishing value and demonstrating returns from sponsorship for both sides will intensify the demand for accurate and auditable measurement of results.
Challenges
The market for sports sponsorship deals is increasingly competitive and globalised, as more sports vie for companies’ cash. Some sports are growing in-house sponsorship resourcesorinvestinginoverseasofficesto pursue deals, while for others it makes more sense to simply use agents. Whatever approach they take, all sports will need to be more sophisticated to offer the level of measurement required. It is no longer enough simply to monitor media hits. Instead, reporting must show whether the sponsorship is achieving far more ambitious business objectives.
Sponsorships: key messagesSponsorship is likely to be of increasing importance to most sports organisations and major events over the coming years.
As sponsorship becomes more important both for the sponsor and the sports body, the need for accurate measurement will increase.

22 Outlook for the global sports market
Media rights 2010-2015We project that global revenues from media rights fees will rise at a 3.8 per cent compound annual rate from US$29.2 billion in 2010 to US$35.2 billion in 2015. Stripping out major events, growth for ongoing events only will be much faster, at 6.6 percent on a compound annual basis.
Component 2006 2007 2008 2009 2010p 2011 2012 2013 2014 2015CAGR
2011-15Media rights 24,281 23,861 27,005 24,563 29,225 26,945 32,141 30,062 37,801 35,247
% Change 19.9 (1.7) 13.2 (9.0) 19.0 (7.8) 19.3 (6.5) 25.7 (6.8) 3.8
Global sports market by component* (US$ Millions)
* At 2010 average exchange ratesp = provisionalSources: PricewaterhouseCoopers LLP, Wilkofsky Gruen Associates
Media rights
5.3%
1.9%
4.4%
5.6%
0.0%
1.0%
2.0%
3.0%
4.0%
5.0%
6.0%
North America EMEA Asia Pacif ic Latin America
CAGR 2011 - 2015
Media rights generate the third largest category of revenue and account for 24.1% of the total market. However, it is the second fastest growing sector at 3.8% CAGR if all sport is included and is the fastest growing sector at 6.6% CAGR if only ongoing events are included. The reason for the difference is the timing of major events with 2010, the base year, being such a strong year, and 2015, the
end of the period, being relatively quiet. EMEA accounts for the largest proportion of the total global media market, followed byNorthAmerica.However,thefastestgrowthratesareprojectedtobeinLatin(5.6%)andNorthAmerica(5.3%).Mediarights are the largest single source of revenueinLatinAmericaat38.3%ofthetotal.
Media rights revenue growth by region 2011-2015
Media rights revenue split by region 2010
North America33%
EMEA42%
Asia Pacif ic17%
Latin America8%

Outlook for the global sports market 23
Over the five years to 2015, we project relatively healthy overall growth in global media rights revenues of 3.8 per cent compounded annually. However, this top-line growth figure masks large year-on-year swings, reflecting the traditionally dramatic impact of major global events held in ‘even’ years, such as the Olympics and FIFA World Cups.
As this cyclical pattern continues, one of the most powerful and consistent forces driving the media rights market is technology, which continues to advance at a dramatic pace. The mens’ and ladies’finalsofthe2011WimbledonChampionshipswasthefirsttimethattheBBC broadcast live 3D sports coverage, and − also in the UK − Sky Sports routinely broadcasts sports such as football and rugby in 3D. Meanwhile, Japan’s ultimately unsuccessful bid to host 2022 FIFA World Cup involved a plan to project 3D holograms of the games live onto footballfieldsworldwide.
The quality of the experience and sense of immersion with 3D raise questions over the longer-term impact of these services on live attendance at games. As we’ve already highlighted, full stadia look better on TV and give a more compelling experience
Going multi-platformAs such statistics underline, broadcasting still generates the lion’s share of income from media rights, but social media is increasingly the engine driving interaction, hype and interest. Engagement through Internet and mobile phones can help to bring people to live matches and encourage them to purchase merchandise. Rights owners can enhance and expand the fans’ experience using different media platforms and social networking in an integrated way, adding further value for themselves and the user.
Historically, entertainment companies have led the way in social media, using different platforms according to the content offer. So video content might be seen on YouTube, while Twitter has been more used by celebrities. Interestingly, multi-platform approaches for sports content have not replaced TV, but are complementary to it rather than substitutional.
Many TV companies have invested in interactive portals, enabling them to combine online TV screening with social media, and to provide an online social and information environment surrounding their media rights and strengthening its value.
The new interactive TV portal combines the strengths of online TV streaming with the popularity of social networks. Users can engage in live chat and discuss their favourite shows in real time, using their Facebook credentials. According to ITV, the application is the perfect dual-screen companiontoITVShows.Launchedduringthe2010FIFAWorldCup,ITVLiveachieved two million users within four weeks by providing additional incentives such as direct chat with celebrities, factoids, etc.
This approach matches emerging consumer behaviour. Recent research by Digital Clarity indicates that 80 per cent of under-25s use a mobile device to communicate with friends while they watch TV, and Twitter reports big spikes in trafficduringmajorsportsprogrammes.
This blend of TV and online effectively gives the viewer a virtual living room in which they can watch sport with friends even when sitting physically alone, creating a higher intensity of experience.
ITV Live
for the viewer. But more immediately, the commercial potential of new technology for media rights owners was demonstrated bythebroadcastingoftheIPLonYouTube.It attracted 20 million cumulative unique views, equivalent to 69 per cent of the reach of the overall YouTube audience in India.
24 Outlook for the global sports market
Challenges: reshaping the competitive and technological landscapes
As sports rights holders go increasingly online and multi-platform to engage fans, they are increasingly competing with other forms of content taking similar approaches, as well as with other immersive experiences such as cinema and live music. Yet the audiences will often vary. Comparing the viewership of the X-Factor with − for example −ChampionsLeaguefootballconfirmsthatliveeventsareabiggerdrawthrough TV, but that there are different audiences for each, with the X Factor having more social media interaction and a higher proportion of women and children. That said, the post-Super Bowl 2011 edition ofGleebenefitedhugelyfromthecarry-over audience.
Demographics can also impact the value and speed of going multi-channel. For sports like golf and cricket, the balance between older and younger generations is likely to be tipped towards older audiences. This means it takes longer for innovations and changes to come through. However, they still do come through in time. The BBC has built a thriving global online community around its online text commentary service for international cricket,reflectingthefactthatmanyusersare at work and do not want to be seen listening or watching, but can click through to the site unobserved in a quiet moment.
Regional spotlight: media rights in the USWe expect much faster growth in the underlying media rights market in the US beginning in 2011 compared with the past three years. The TV advertising market is holding up well despite the slowdown ineconomicgrowth,andmobilerightsarebecomingsignificantastabletspenetratethemarket.
The key factors are that sports ratings have been strong, and sports viewing is proving virtually immune to time-shifting. In the key 18-49 demographic, live programmes dominate the ratings, and sports are well represented in the top-rated live programmes. A second factor driving rights fees is growing competitionasESPNcompetesvigorouslywiththemajorbroadcastnetworks.Localrightsalsoarelucrative.TimeWarnerCabletripledthefeesitpaystotheLosAngelesLakersforlocalrights.TheYESnetworkalsodoubledtherightsfeesitwillpayfortheNewJerseyNets.
However, sport is still nowhere near the entertainment sector in terms of Twitterprofile.LadyGagahas15millionfollowers on Twitter, while the Brazil and Real Madrid footballer, Kaka, is the top sportsman at 6.5 million, in 17th place. Thereareonlyfiveothersportsentitiesor personalities in the Twitter top 100, all from the US. This is perhaps just as well for clubs, since the challenges of managing what sports people say on Twitter have been demonstrated time and again. They are the public face of sports and clubs, butitisextremelydifficulttomonitororcontrolthem.Inearly2011,Liverpoolfootballer Ryan Babel was charged with improper conduct by the FA after posting a mocked–up picture of a referee in an opposing team’s shirt on Twitter.

Outlook for the global sports market 25
‘Free’ content and fragmentation
Given the ongoing convergence with entertainment and rising impact of technology, sport may increasingly face challenges that echo those of other forms of digital content. For example, many people now assume that consumption of music is and should be for free. So will they expect to access sport for free in the future on the TV or Internet? On this issue, sports right holders seem to be in a fairly strong position at the moment. Research and indeed the experience of pay-TV broadcasters with exclusive sports content confirmthatpeoplearepreparedtopayfor additional value. A rising number of newspapers have also now started to put up paywalls around their on-line content, andarefindingthatpeoplewillpayforthepremium end and specialist content.
Aside from that issue, the proliferation of digitised content, web access and social media will have further impacts on sports rights and related advertising revenues. These developments means companies now have the ability to mine and analyse detailed information to which they have never previously had access. Data also plays an increasingly pivotal role in the interface between consumers, content
and brands. Across all these areas, digital technology will drive a demand for more accurate, transparent and accountable measurement as a basis for commercial decisions. The world football governing body FIFA has admitted to greatly exaggerating TV audiences in the past for events such as the World Cup Final. In the world of digital rights and delivery, sports bodies or broadcasters simply will not get away with this type of overstatement.
Also, for international sports tournaments, the value of broadcast rights can vary depending on screening times in regions around the world, owing to its impact on viewership and therefore advertising revenues. The 2002 FIFA World Cup in Japan and Korea and the 2011 Rugby WorldCupinNewZealandbothresultedin games being shown in the early morning in the big European markets.
A further challenge for sports bodies andregulatorsalikeisthedifficultyofregulating and controlling the same content across different platforms and geographies, as the device market fragments and as online and digital technologies render national borders increasingly irrelevant. In 2011, deciding in favour of a pub landlady from the UK, the European Court of Justice said that broadcasters cannot prevent customers from buying cheaper foreign satellite TV servicestowatchPremierLeaguefootball.While legal experts said that pubs may still be prevented from doing this because of Intellectual Property rules, the case underlined the growing complexity of policing and selling sports rights in a digital world.
Media Rights: Key MessagesOngoing technology innovation and expansion across multiple platforms will continue to be used to maximise engagement and put the viewer ‘inside’ the sport.
In an increasingly digital world, a major challenge for rights holders is trying to retain control over how, where and by whom sports content is consumed, so that this content can be monetised.

26 Outlook for the global sports market
Merchandising 2010-2015We project that global revenues from merchandising will total US$20.1 billion in 2015 from US$17.6 billion in 2010, a 2.6 per cent compound annual increase. Growth for ongoing events will average 2.9 percent compounded annually.
Global sports market by component* (US$ Millions)
* At 2010 average exchange ratesp = provisionalSources: PricewaterhouseCoopers LLP, Wilkofsky Gruen Associates
Component 2006 2007 2008 2009 2010p 2011 2012 2013 2014 2015CAGR
2011-15Merchandising 19,430 20,413 21,263 17,586 16,624 17,570 18,002 18,549 19,565 20,067
% Change 7.7 5.1 4.2 (17.3) 0.2 (0.3) 2.5 3.0 5.5 2.6 2.6
2.5%2.2%
3.3%
3.9%
0.0%
0.5%
1.0%
1.5%
2.0%
2.5%
3.0%
3.5%
4.0%
4.5%
North America EMEA Asia Pacif ic Latin America
CAGR 2011 - 2015North America
71%
EMEA13%
Asia Pacif ic13%
Latin America3%
Merchandising revenue growth by region 2011-2015
Merchandising revenue by region 2010
Merchandising
Merchandising is the smallest category of revenue in our forecasts, accounting for 14.5%, although it accounts for 25.2%ofallrevenueinNorthAmerica.Notsurprisinglythen,NorthAmericaaccounts for 71% of the total global sports merchandising market. Growth
in merchandising revenue is closely linked with consumer spend patterns and the overall growth is similar to gate revenues at 2.6% CAGR. Growth rates goingforwardto2015arehighestinLatinAmericaat3.9%CAGRandAsiaPacificat3.3% CAGR.

Outlook for the global sports market 27
Spendingonsportsmerchandisingreflectsthe wider polarisation of buying habits, with transactional online shopping at one end, and retail as entertainment at the other, with consumers spending leisurely days at a department store or high-end mall. That said, sports clubs are seeing a rising proportion of their merchandise transactions migrating towardstheInternet.Aspecificbenefitofmerchandising is the ability to engage with fans who cannot attend matches, including thosewholiveinothercountries−anopportunity that has been expanded by the Internet. This engagement helps both to monetise sports brands in those regions and markets, and also to build demand for media coverage of the clubs involved.
According to a new PwC report based on a study of multichannel shopping behaviour in three continents, online shopping in China exceeds all the other countries by about 30%. Otherwise consumer online shopping behaviour is pretty consistent by geography.
Merchandising: Key MessagesRetail is part of the whole sports experience for many fans, and helps generate engagement among people who live in different markets and/or who cannot attend matches.
Experience shows that increased engagement among consumers leads to higher spending on merchandise. For example,Nikeletsconsumerscustomisetheir trainers, meaning they then share the designs and opinions with their friends, both on person and online. This not only helpsNikeunderstandwhatitscustomerswant−providingitwithinformationthatit can feed into its customer intelligence −butalsoensurethatitsowncustomersgets what they want and are more likely to come back.
The economy plays a major role in determining trends in discretionary spend and there was a dramatic reduction in sports merchandising spend during the global economic downturn.
28 Outlook for the global sports market
AppendixHow we derive the data
Historical information
Historical information is obtained principallyfromconfidentialandproprietary sources. In instances where third-party sources are consulted and their information is used directly - from such sources as government agencies, trade associations, and related entities that seek to have their data disseminated in the public domain - the sources of such information are explicitly cited. In instances where the information is used indirectly, as part of the calculus for the historical data, the sources are proprietary.
Forecast information
Recent trends in industry performance are analysed, and the factors underlying thosetrendsareidentified.Thefactorsconsidered are certain economic, demographic, technological, institutional, behavioral, competitive, and other drivers that may affect the sports market.
Models are then developed to quantify the impact of each factor on industry spending. A forecast scenario for each causative factor is then created, and the contribution of each factor on a prospectivebasisisidentified.
These proprietary mathematical models and analytic algorithms are used in the process to provide an initial array of prospective values. Our professional expertise and institutional knowledge are then applied to review and adjust those values if required. The entire process is then examined for internal consistency and transparency vis-à-vis prevailing industry wisdom.
Forecasts for 2011–2015 are also based on an analysis of the dynamics of each segment in each region and on the factors that affect those dynamics. We provide compound annual growth rates (CAGRs) that cover the 2011–2015 forecast period. In the calculation of CAGRs, 2010 is the beginningyear,withfivegrowthyearsduring the forecast period: 2011, 2012, 2013, 2014 and 2015. The end year is 2015. The formula is:
CAGR = 100 * ((Value in 2015 ÷ Value in 2010) ^ (1 ÷ 5) – 1)
The2011gatereceiptsforNorthAmericareflectstheNBAlock-out.WehaveassumedtheresumptionoftheNBAschedule in January 2012.
Inflation
Acrossallchapters,figuresarereportedinnominaltermsreflectingactualspendingtransactions and therefore include the effectsofinflation.
Exchange rates
AllfiguresarepresentedinUSdollarsby using the average 2010 exchange rate held constant for each historical year and forecast year. This means the figuresreflectindustrytrendsandarenotdistortedbyfluctuationsininternationalexchange rates.
Nominal GDP growth
Becauseallfiguresareshownasactualspending,withtheeffectsofinflationincluded, nominal GDP growth has an importantinfluenceonentertainmentandmedia spending.
Outlook for the global sports market 29
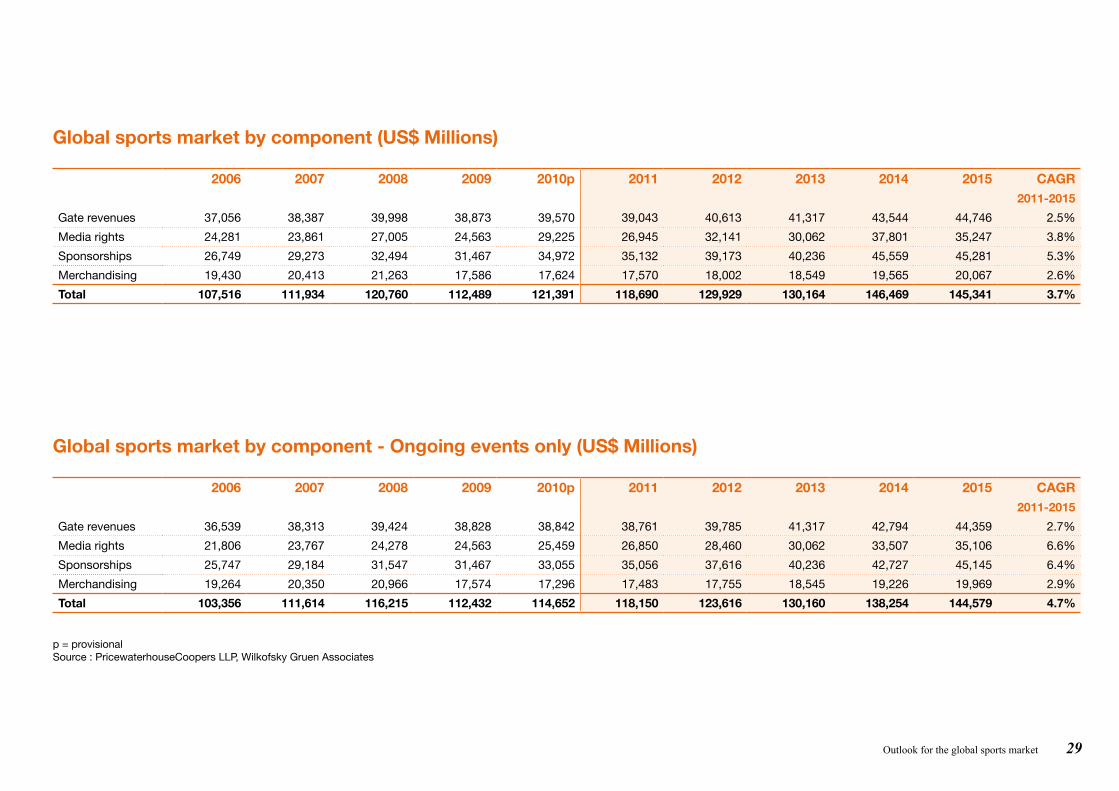
Global sports market by component (US$ Millions)
2006 2007 2008 2009 2010p 2011 2012 2013 2014 2015 CAGR2011-2015
Gate revenues 37,056 38,387 39,998 38,873 39,570 39,043 40,613 41,317 43,544 44,746 2.5%
Media rights 24,281 23,861 27,005 24,563 29,225 26,945 32,141 30,062 37,801 35,247 3.8%
Sponsorships 26,749 29,273 32,494 31,467 34,972 35,132 39,173 40,236 45,559 45,281 5.3%
Merchandising 19,430 20,413 21,263 17,586 17,624 17,570 18,002 18,549 19,565 20,067 2.6%
Total 107,516 111,934 120,760 112,489 121,391 118,690 129,929 130,164 146,469 145,341 3.7%
Global sports market by component - Ongoing events only (US$ Millions)
2006 2007 2008 2009 2010p 2011 2012 2013 2014 2015 CAGR2011-2015
Gate revenues 36,539 38,313 39,424 38,828 38,842 38,761 39,785 41,317 42,794 44,359 2.7%
Media rights 21,806 23,767 24,278 24,563 25,459 26,850 28,460 30,062 33,507 35,106 6.6%
Sponsorships 25,747 29,184 31,547 31,467 33,055 35,056 37,616 40,236 42,727 45,145 6.4%
Merchandising 19,264 20,350 20,966 17,574 17,296 17,483 17,755 18,545 19,226 19,969 2.9%
Total 103,356 111,614 116,215 112,432 114,652 118,150 123,616 130,160 138,254 144,579 4.7%
p = provisionalSource : PricewaterhouseCoopers LLP, Wilkofsky Gruen Associates

30 Outlook for the global sports market
Global sports market by region (US$ Millions)
2006 2007 2008 2009 2010p 2011 2012 2013 2014 2015 CAGR2011-2015
North America 46,422 49,257 52,907 48,302 49,955 49,692 53,077 54,496 59,823 60,776 4.0%
EMEA 37,744 38,487 40,815 38,208 42,806 40,698 47,298 44,807 51,398 49,491 2.9%
Asia Pacific 17,952 18,595 21,381 20,403 22,735 22,361 23,299 24,277 27,332 27,580 3.9%
Latin America 5,398 5,595 5,657 5,576 5,895 5,939 6,255 6,584 7,916 7,494 4.9%
Total 107,516 111,934 120,760 112,489 121,391 118,690 129,929 130,164 146,469 145,341 3.7%
Global sports market by region - Ongoing events only (US$ Millions)
2006 2007 2008 2009 2010p 2011 2012 2013 2014 2015 CAGR2011-2015
North America 45,542 49,257 51,888 48,302 48,412 49,692 51,733 54,492 58,564 60,770 4.7%
EMEA 35,161 38,447 38,851 38,208 39,407 40,698 42,628 44,807 47,066 49,371 4.6%
Asia Pacific 17,389 18,357 19,833 20,346 21,152 21,868 23,016 24,277 25,630 26,994 5.0%
Latin America 5,264 5,553 5,643 5,576 5,681 5,892 6,239 6,584 6,994 7,444 5.6%
Total 103,356 111,614 116,215 112,432 114,652 118,150 123,616 130,160 138,254 144,579 4.7%
p = provisionalSource : PricewaterhouseCoopers LLP, Wilkofsky Gruen Associates

Outlook for the global sports market 31
BRIC sports market by country* (US$ Millions)
Country 2006 2007 2008 2009 2010p 2011 2012 2013 2014 2015CAGR
2011-15Brazil 2,890 2,919 2,931 2,910 3,231 3,180 3,303 3,483 4,605 4,188
% Change 10.7 1.0 0.4 (0.7) 11.0 (1.6) 3.9 5.4 32.2 (9.1) 5.3%
Russia 666 762 749 702 697 715 741 778 2,246 871
% Change 11.4 14.4 (1.7) (6.3) (0.7) 2.6 3.6 5.0 188.7 (61.2) 4.6%
India 856 916 1,095 1,185 1,489 1,534 1,530 1,648 1,831 1,899
% Change 8.5 7.0 19.5 8.2 25.7 3.0 (0.3) 7.7 11.1 3.7 5.0%
China 1,785 1,871 2,764 2,179 2,909 2,500 2,763 2,913 3,439 3,430
% Change 8.6 4.8 47.7 (21.2) 33.5 (14.1) 10.5 5.4 18.1 (0.3) 3.3%
Total 6,167 6,468 7,539 6,976 8,326 7,929 8,337 8,822 12,121 10,388
% Change 9.9 4.4 16.6 (7.5) 19.4 (4.8) 5.1 5.8 37.4 (14.3) 4.5%
p = provisionalSource : PricewaterhouseCoopers LLP, Wilkofsky Gruen Associates

32 Outlook for the global sports market
Gate revenues by region (US$ Millions)
2006 2007 2008 2009 2010p 2011 2012 2013 2014 2015 CAGR2011-2015
North America 14,512 15,598 15,982 15,552 15,710 15,330 15,860 16,634 17,210 17,835 2.6%
EMEA 15,954 16,033 16,537 16,132 16,543 16,099 17,259 16,961 17,782 18,306 2.0%
Asia Pacific 4,967 5,058 5,810 5,558 5,681 5,893 5,740 5,910 6,189 6,592 3.0%
Latin America 1,623 1,698 1,669 1,631 1,636 1,721 1,754 1,812 2,363 2,013 4.2%
Total 37,056 38,387 39,998 38,873 39,570 39,043 40,613 41,317 43,544 44,746 2.5%
Gate revenues by region - Ongoing events only (US$ Millions)
2006 2007 2008 2009 2010p 2011 2012 2013 2014 2015 CAGR2011-2015
North America 14,512 15,598 15,982 15,552 15,613 15,330 15,860 16,634 17,210 17,835 2.7%
EMEA 15,437 15,993 16,431 16,132 15,967 16,099 16,431 16,961 17,557 18,186 2.6%
Asia Pacific 4,967 5,058 5,342 5,513 5,626 5,649 5,740 5,910 6,138 6,365 2.5%
Latin America 1,623 1,664 1,669 1,631 1,636 1,683 1,754 1,812 1,889 1,973 3.8%
Total 36,539 38,313 39,424 38,828 38,842 38,761 39,785 41,317 42,794 44,359 2.7%
p = provisionalSource : PricewaterhouseCoopers LLP, Wilkofsky Gruen Associates

Outlook for the global sports market 33
Media rights by region (US$ Millions)
2006 2007 2008 2009 2010p 2011 2012 2013 2014 2015 CAGR2011-2015
North America 8,489 8,388 9,449 8,708 9,841 9,344 10,999 10,180 13,466 12,757 5.3%
EMEA 10,044 9,693 11,270 9,620 12,250 10,706 13,549 12,078 15,165 13,482 1.9%
Asia Pacific 3,828 3,785 4,205 4,149 4,877 4,637 5,170 5,228 6,240 6,047 4.4%
Latin America 1,920 1,995 2,081 2,086 2,257 2,258 2,423 2,576 2,930 2,961 5.6%
Total 24,281 23,861 27,005 24,563 29,225 26,945 32,141 30,062 37,801 35,247 3.8%
Media rights by region - Ongoing Events Only (US$ Millions)
2006 2007 2008 2009 2010p 2011 2012 2013 2014 2015 CAGR2011-2015
North America 7,728 8,388 8,540 8,708 8,743 9,344 9,790 10,180 12,392 12,757 7.8%
EMEA 8,706 9,693 9,693 9,620 10,289 10,706 11,376 12,078 12,780 13,482 5.6%
Asia Pacific 3,523 3,694 3,978 4,149 4,285 4,546 4,887 5,228 5,569 5,910 6.6%
Latin America 1,849 1,992 2,067 2,086 2,142 2,254 2,407 2,576 2,766 2,957 6.7%
Total 21,806 23,767 24,278 24,563 25,459 26,850 28,460 30,062 33,507 35,106 6.6%
p = provisionalSource : PricewaterhouseCoopers LLP, Wilkofsky Gruen Associates
34 Outlook for the global sports market
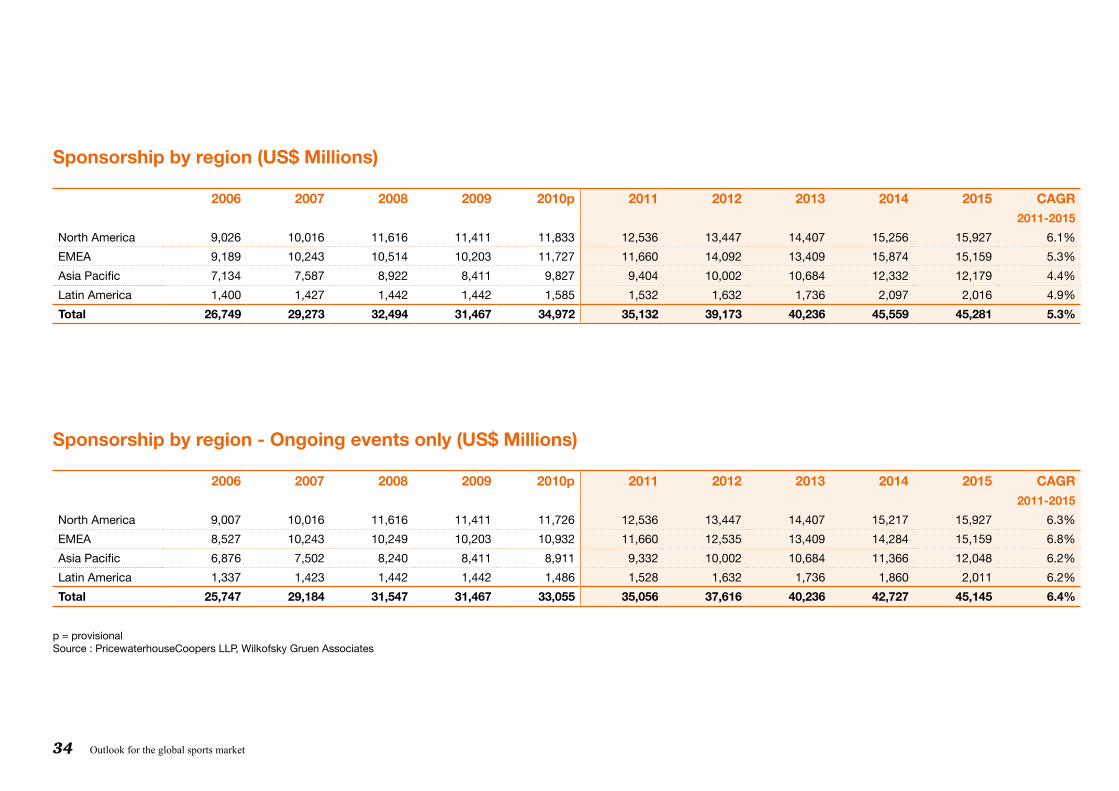
Sponsorship by region (US$ Millions)
2006 2007 2008 2009 2010p 2011 2012 2013 2014 2015 CAGR2011-2015
North America 9,026 10,016 11,616 11,411 11,833 12,536 13,447 14,407 15,256 15,927 6.1%
EMEA 9,189 10,243 10,514 10,203 11,727 11,660 14,092 13,409 15,874 15,159 5.3%
Asia Pacific 7,134 7,587 8,922 8,411 9,827 9,404 10,002 10,684 12,332 12,179 4.4%
Latin America 1,400 1,427 1,442 1,442 1,585 1,532 1,632 1,736 2,097 2,016 4.9%
Total 26,749 29,273 32,494 31,467 34,972 35,132 39,173 40,236 45,559 45,281 5.3%
Sponsorship by region - Ongoing events only (US$ Millions)
2006 2007 2008 2009 2010p 2011 2012 2013 2014 2015 CAGR2011-2015
North America 9,007 10,016 11,616 11,411 11,726 12,536 13,447 14,407 15,217 15,927 6.3%
EMEA 8,527 10,243 10,249 10,203 10,932 11,660 12,535 13,409 14,284 15,159 6.8%
Asia Pacific 6,876 7,502 8,240 8,411 8,911 9,332 10,002 10,684 11,366 12,048 6.2%
Latin America 1,337 1,423 1,442 1,442 1,486 1,528 1,632 1,736 1,860 2,011 6.2%
Total 25,747 29,184 31,547 31,467 33,055 35,056 37,616 40,236 42,727 45,145 6.4%
p = provisionalSource : PricewaterhouseCoopers LLP, Wilkofsky Gruen Associates

Outlook for the global sports market 35
Merchandising by region (US$ Millions)
2006 2007 2008 2009 2010p 2011 2012 2013 2014 2015 CAGR2011-2015
North America 14,395 15,255 15,860 12,631 12,571 12,482 12,771 13,275 13,891 14,257 2.5%
EMEA 2,557 2,518 2,494 2,253 2,286 2,233 2,398 2,359 2,577 2,544 2.2%
Asia Pacific 2,023 2,165 2,444 2,285 2,350 2,427 2,387 2,455 2,571 2,762 3.3%
Latin America 455 475 465 417 417 428 446 460 526 504 3.9%
Total 19,430 20,413 21,263 17,586 17,624 17,570 18,002 18,549 19,565 20,067 2.6%
Merchandising by region - Ongoing events only (US$ Millions)
2006 2007 2008 2009 2010p 2011 2012 2013 2014 2015 CAGR2011-2015
North America 14,295 15,255 15,750 12,631 12,330 12,482 12,636 13,271 13,745 14,251 2.9%
EMEA 2,491 2,518 2,478 2,253 2,219 2,233 2,286 2,359 2,445 2,544 2.8%
Asia Pacific 2,023 2,103 2,273 2,273 2,330 2,341 2,387 2,455 2,557 2,671 2.8%
Latin America 455 474 465 417 417 427 446 460 479 503 3.8%
Total 19,264 20,350 20,966 17,574 17,296 17,483 17,755 18,545 19,226 19,969 2.9%
p = provisionalSource : PricewaterhouseCoopers LLP, Wilkofsky Gruen Associates

36 Outlook for the global sports market
Glossary
CAGR Compound Annual Growth Rate - the percentage rate of growth year-on-year, averaged out over the forecast period
EMEA Europe, the Middle East and Africa
FA Football Association
FC Football Club (Soccer), other European equivalents are BV, SV and CF
FIFA Federation Internationale de Football Association (International Federation of Association Football), the world governing body for association football (Soccer)
ICC International Cricket Council
IPL Indian Premier League Cricket tournament
MLB US Major League Baseball
MLS US Major League Soccer
NBA US National Basketball Association
NCAA US National Collegiate Athletic Association
NFL US National Football League (American Football)
NHL US National Hockey League (Ice Hockey)

Outlook for the global sports market 37Outlook for the global sports market 37


Contacts
Global and Regional Leaders
Global Leader, Entertainment & Media
US Leader, Hospitality & Leisure
UK Leader, Hospitality & Leisure
US Leader, Entertainment & Media
UK & EMEA Leader, Entertainment & Media
Marcel Fenez [email protected]
Scott Berman [email protected]
Robert Milburn [email protected]
Kenneth Sharkey [email protected]
Phil Stokes [email protected]
Editor in Chief
UK Leader, Sports & Leisure
Julie Clark [email protected]
Territory Sports Contacts
Australia Brazil Canada China France Germany
Megan Brownlow [email protected]
Mauricio Girardello [email protected]
Ronald [email protected]
Hongbin Cong [email protected]
Matthieu Aubusson de Cavarlay [email protected]
Werner Ballhaus [email protected]
India Ireland Italy Netherlands Qatar Russian Federation
Timmy S Kandhari [email protected]
Bartley O’Connor [email protected]
Andrea Samaja [email protected]
Ennèl van Eeden [email protected]
Stephen Anderson [email protected]
Robert Gruman [email protected]
Singapore South Africa Spain Switzerland United Arab Emirates United States
Mark Rathbone [email protected]
Vicky Myburgh [email protected]
Virginia Arce [email protected]
David Dellea [email protected]
Mohammad Dahmash [email protected]
Rob Canton [email protected]
For further information please contact:
PwC firms help organisations and individuals create the value they’re looking for. We’re a network of firms in 158 countries with close to 169,000 people who are committed to delivering quality in assurance, tax and advisory services. Tell us what matters to you and find out more by visiting us at www.pwc.com.
This publication has been prepared for general guidance on matters of interest only, and does not constitute professional advice. You should not act upon the information contained in this publication without obtaining specific professional advice. No representation or warranty (express or implied) is given as to the accuracy or completeness of the information contained in this publication, and, to the extent permitted by law, PricewaterhouseCoopers does not accept or assume any liability, responsibility or duty of care for any consequences of you or anyone else acting, or refraining to act, in reliance on the information contained in this publication or for any decision based on it.
© 2011 PwC. All rights reserved. Not for further distribution without the permission of PwC. “PwC” refers to the network of member firms of PricewaterhouseCoopers International Limited (PwCIL), or, as the context requires, individual member firms of the PwC network. Each member firm is a separate legal entity and does not act as agent of PwCIL or any other member firm. PwCIL does not provide any services to clients. PwCIL is not responsible or liable for the acts or omissions of any of its member firms nor can it control the exercise of their professional judgment or bind them in any way. No member firm is responsible or liable for the acts or omissions of any other member firm nor can it control the exercise of another member firm’s professional judgment or bind another member firm or PwCIL in any way.
ML2(R)-2011-11-04-0930-DS