changes in the abundance of farmland birds in relation ... · relative population size of corn...
TRANSCRIPT

Changes in the abundance of farmland birds in relation
to the timing of agricultural intensi®cation in England
and Wales
D.E. CHAMBERLAIN*{ , R.J. FULLER{ , R.G.H. BUNCEx,J.C. DUCKWORTH{x and M. SHRUBB{{British Trust for Ornithology, The Nunnery, Thetford, Norfolk IP24 2PU, UK; xInstitute of TerrestrialEcology, Merlewood Research Station, Grange over Sands, Cumbria LA11 6JU, UK; and {Hillcrest, Llanwrtyd
Wells, Powys LD5 4TL, UK
Summary
1. Over the past three decades changes in agricultural management have resulted
in increased crop and grass production. This intensi®cation has been accompanied
by population declines among farmland bird species and a decline in farmland bio-
diversity. We have analysed trends in agricultural management in order to quantify
the degree of intensi®cation, and have considered how they match change in the
farmland bird community.
2. Changes in agriculture through time (1962±95) were examined quantitatively for
31 variables representing crop areas, livestock numbers, fertilizer application, grass
production and pesticide use. The majority were highly intercorrelated because fac-
tors facilitating intensi®cation simultaneously a�ected many management activities.
3. Change in agriculture was measured using detrended correspondence analysis
(DCA). The period 1970±88 saw most intensi®cation, characterized by increases in
the area of oilseed rape, autumn-sown cereals, and the use of pesticides and inor-
ganic fertilizers. Spring-sown cereals, bare fallow and root crops declined.
4. Indices of relative population change between 1962 and 1996 were determined
for 29 bird species using data from Common Birds Census (CBC) plots on farm-
land in England and Wales. Principal components analysis (PCA) described a gra-
dient from species that had declined most to those that had increased.
5. The ordinations of agricultural change and bird population change were broadly
matching but with a time lag in the response of birds. The most accurately mea-
sured agricultural variables for the period 1974±91 matched the changes in farm-
land birds more closely.
6. We conclude that large shifts in agricultural management are a plausible expla-
nation for the declines in farmland bird populations. We propose a threshold
model relating to critical amounts of high-quality habitat or food resources that
may be relevant in explaining the lag in response of birds, and propose it should be
taken into account in predicting the e�ects of future agri-environment schemes.
Identifying individual factors responsible for bird declines is not possible without
detailed experimental work because many components of intensi®cation are inter-
dependent. Birds may be responding to a suite of interacting factors rather indivi-
dual aspects of farm management. Holistic conservation strategy that encourages
general extensi®cation of farming practices will be most likely to bene®t farmland
bird communities.
Key-words: Common Birds Census, DCA, farm management, PCA, population
declines.
Journal of Applied Ecology (2000) 37, 771±788
*Correspondence:D.E. Chamberlain (e-mail [email protected]).
{Present address: Plantlife, 21 Elizabeth St., London SW1 9RP, UK.
Journal of
Applied Ecology
2000, 37,
771±788
# 2000 British
Ecological Society

Introduction
There have been great changes in the management
of farmland in England and Wales over the last few
decades. These changes have a�ected all aspects of
the farmed landscape. Crop management and the
type and relative abundance of di�erent crops has
changed markedly; grassland management has
shifted away from hay to silage systems; chemical
inputs on farmland have increased substantially; the
timing of farming operations has changed; non-crop
habitats such as hedgerows and farm ponds have
been reduced; and there has been a reduction in the
diversity of di�erent types of agriculture per indivi-
dual farm, with farms tending to specialize in either
arable or livestock (O'Connor & Shrubb 1986;
Grigg 1989; Stoate 1996). This `intensi®cation' of
farmland has led to greatly increased yields. For
example, wheat yields increased by 66% between
1970 and 1990 [Ministry of Agriculture, Fisheries
and Food (MAFF), unpublished data]. Other crops
and grass have shown similar increases in yield over
the same period. Developments in farming technol-
ogy in terms of machinery, development of new
crop strains and development of pesticides and ferti-
lizers, have probably been the main underlying
causes behind the increased yields, although both
social and economic factors have also contributed
(Grigg 1989).
The coincidence of this period of intensi®cation of
farm management and the decline of many farmland
bird species has led to suggestions of a causal link
between the two (Fuller et al. 1995). The temporal
relationship between changes in farming practices
and changes in bird populations has not, however,
been examined previously in a quantitative manner
for the majority of farmland species. The proposed
mechanisms by which agricultural changes in man-
agement have a�ected bird populations are diverse,
but generally concern diminished food supplies
(Potts 1986; Campbell et al. 1997; Evans et al. 1997;
Brickle et al. 2000), less suitable nesting habitat
(Wilson et al. 1997; Chamberlain et al. 1999) or
direct mortality of birds by farming operations
(Crick et al. 1994; Green 1995). Several studies indi-
cate that there is an association between agricultural
management and changes in bird populations. A
number of these studies have considered di�erences
in regional and habitat-speci®c population trends.
For example, population declines of skylarks Alauda
arvensis L. have been steepest in agricultural com-
pared with upland and coastal landscapes (Cham-
berlain & Crick 1999), granivorous birds have
declined most in arable farmland (Marchant & Gre-
gory 1994), but corvids have increased the most on
pastoral and mixed farmland (Gregory & Marchant
1996). Also, Donald (1997) found change in the
relative population size of corn buntings Miliaria
calandra L. to be correlated signi®cantly with annual
variation in a number of agricultural variables
which themselves were often intercorrelated.
Other potential causes of the population declines
have been proposed, for example disease, climate
and predation (Fuller et al. 1995). There is no evi-
dence for disease causing long-term bird population
change in the UK. Climate, however, has been
shown to cause short-term changes in bird popula-
tion size. For example, Baillie (1990) found that
much variation in relative population change of a
resident passerine, the song thrush Turdus philome-
los L., could be explained by the number of freezing
days in the preceding winter, although this e�ect
was not su�cient to explain the most recent
declines.
A number of predatory bird species have
increased on farmland in recent years (Newton
1986; Gregory & Marchant 1996). There is evidence
that breeding populations of game birds can be
a�ected by predator numbers (Redpath & Thirgood
1997; Tapper, Potts & Brockless 1996), but there is
little evidence to suggest that increased numbers of
sparrowhawks Accipiter nisus L. (Newton 1993;
Thomson et al. 1998) or magpies Pica pica L.
(Gooch, Baillie & Birkhead 1991) a�ect breeding
numbers of passerines.
Although the timing of the onset of population
declines of a number of bird species has been exam-
ined in detail (Siriwardena et al. 1998), there has
been no comparable examination of the detailed
changes in agricultural practices. In this paper, we
present a review of the main changes in agricultural
management that have occurred over the past four
decades. We examine the evidence that changes in
bird abundance have coincided with changes in agri-
cultural management by using ordination techniques
to identify patterns of change in both bird abun-
dance and agricultural management data. These
analyses demonstrate the pattern of temporal asso-
ciation between bird population change and agricul-
tural intensi®cation.
Methods
HABITAT DATA
Annual changes in agricultural variables were
derived from a number of sources: county-level sum-
maries of MAFF June Census data; MAFF pesti-
cide usage survey reports (Thomas 1997); Institute
of Terrestrial Ecology (ITE)/Agricultural Develop-
ment Advisory Service (ADAS) review of agricul-
tural management (Wilkinson 1997); ADAS British
Survey of Fertilizer Practice; and data presented by
O'Connor & Shrubb (1986). The variables that were
considered, the years from which data were avail-
able, data sources and abbreviations used in subse-
quent analyses are shown in Table 1. For some
potentially important variables (e.g. areas of hay,
772Agricultural
intensi®cation and
bird abundance
# 2000 British
Ecological Society
Journal of Applied
Ecology, 37,
771±788

silage, stubbles and undersown cereals) no data
sources were found. Data were obtained for Eng-
land and Wales where possible to match up with the
bird data (see below), although in some cases it was
only possible to obtain data from the whole of the
UK. In these cases, we assume that temporal
changes show similar patterns in England and Wales
to those from the whole UK, which was the case in
a number of variables where data were available at
both scales (e.g. similar percentage changes between
1970 and 1995).
B IRD DATA
The Common Birds Census (CBC) is a long-term
monitoring scheme, running since 1962, that pro-
vides estimates of annual population change for a
large number of British bird species (Marchant et al.
1990). This scheme has, above all others, been
responsible for drawing attention to the population
declines of several farmland bird species (Fuller et al.
1995; Siriwardena et al. 1998). Estimates of relative
population change and change in breeding density
were derived from CBC data for 29 selected species.
Farmland CBC sites are not randomly distributed
throughout the country, but show a south-eastern
bias, so indices derived at the national level tend to
be most representative of lowland habitats and pre-
dominantly arable farmland (Fuller, Marchant &
Morgan 1985). Data were derived from lowland
farmland CBC sites in England and Wales, the
region and habitat of which CBC plots are most
representative. The 29 species were identi®ed by
Fuller et al. (1995) as either farmland specialists or
woodland generalists which commonly use farm-
land. The species, their population status and their
predominant habitat according to Fuller et al.
(1995) are shown in Table 2. Certain farmland spe-
cies, although of great conservation concern, were
too rare for any valid analysis (e.g. stone curlew
Burhinus oedicnemus L. and cirl bunting Emberiza
cirlus L.). Some common farmland species that are
poorly censused were also not considered (e.g. phea-
sant Phasianus colchicus L., woodpigeon Columba
Table 1. Agricultural variables considered in the analyses of annual changes. Data are for England and Wales unless stated.
Sources: MAFF1, June census data adapted from parish summaries, provided by the University of Edinburgh Data Library;
MAFF2, pesticide usage survey reports (e.g. Thomas 1997); ITE, review of agricultural management (Wilkinson 1997);
ADAS, British Survey of Fertilizer Practice; O&S, O'Connor & Shrubb (1986). {Data for whole UK; other data are for
England and Wales
Variable Years available Source Units
Bare fallow 1962±92 MAFF1 Area
Barley (total) 1962±92 MAFF1 Area
Barley (autumn-sown) 1962, 67, 69, 74±92, 94 MAFF1 Area
Barley (spring-sown) 1962, 67, 69, 74±92, 94 MAFF1 Area
Cattle 1977±86, 88 MAFF1 Total cattle � calves
Fertilizer application 1970±94 ITE kg haÿ1
Mown grass production{ 1970±89 ITE Tonnes dry matter
Permanent grass (>5 or 7- years old) 1962±92 MAFF1 Area
Hay production{ 1970±89 ITE Tonnes dry matter
New grass (<5 or 7-years old) 1962±92 MAFF1 Area
Linseed{ 1989±95 MAFF1 Area
Oats 1962±92 (not 88) MAFF1 Area
Oilseed rape 1962±92 MAFF1 Area
Rough grazing 1962±92 MAFF1 Area
Set-aside{ 1989±95 MAFF1 Area
Sheep 1969, 77±92 (not 88) MAFF1 Total ewes � lambs
Silage production{ 1970±89 ITE Tonnes
Slurry application 1969±91, 93 (not 86) ADAS Area
Potato 1962±92 MAFF1 Area
Sugar beet 1962±92 MAFF1 Area
Total tilled land 1962±92 MAFF1 Area
Turnip and swede 1962±92 MAFF1 Area
Wheat (total) 1962±92 MAFF1 Area
Wheat (autumn-sown) 1962, 67, 69, 74, 78, 82, 87, 94 MAFF1 Area
Wheat (spring-sown) 1962, 67, 69, 74, 78, 82, 87, 94 MAFF1 Area
Fungicides (total) 1974, 77, 82, 88, 90, 92, 94 MAFF2 Spray hectares
Herbicides (total) 1974, 77, 82, 88, 90, 92, 94 MAFF2 Spray hectares
Herbicides on cereals (pre-emergent){ 1960, 65, 70, 75, 80, 85 O & S No. of chemicals
Herbicides on cereals (post-emergent){ 1960, 65, 70, 75, 80, 85 O & S No. of chemicals
Insecticides (total) 1974, 77, 82, 88, 90, 92, 94 MAFF2 Spray hectares
Seed dressings on cereals 1974, 77, 82, 88, 90, 92, 94 MAFF2 Spray hectares
773D.E. Chamberlain
et al.
# 2000 British
Ecological Society
Journal of Applied
Ecology, 37,
771±788
palumbus L. and house sparrow Passer domesticus
L.). Full CBC survey methods can be found in
Marchant et al. (1990). The data were used primar-
ily to calculate population indices, which reveal rela-
tive changes from year to year, hence providing an
estimate of population change. Indices were deter-
mined from between 60 and 127 CBC farmland
plots per year.
ANALYSIS
For annual agricultural variables, data were
obtained between 1962 and 1995 where possible, but
in a number of cases data were available only for
intermittent years within this period. For these vari-
ables, missing values were interpolated from a
straight line drawn between years with actual data
up to 1995. Data on the area of permanent grass-
land (at least n years old) and new grassland (seeded
or reseeded within the previous n years) were a par-
ticular problem as the de®nition changed in 1974
from n� 7 to n� 5. In order to produce a run of
values, the di�erence between the means of the ear-
lier and the later grassland de®nition was added
onto every value after 1974 as a correction factor.
We assume that the pattern of change is a good
re¯ection of trends in grassland but acknowledge
that the actual ®gures presented should not be taken
as absolute values.
Many of the agricultural variables considered
were strongly correlated with one another, which
made interpretation of relationships between indivi-
dual variables and bird abundance di�cult. There-
fore, we examined general gradients of agricultural
change to allow an assessment of features that most
strongly characterize those gradients. Agricultural
variables were analysed by two ordination techni-
ques: variables de®ned into categories were analysed
using detrended correspondence analysis (DCA),
and continuous variables using principal compo-
nents analysis (PCA). For the DCA, underlying
trends were identi®ed using a smoothing procedure
that uses a 4235H-twice running median (Velleman
& Hoaglin 1981). Using the smoothing technique
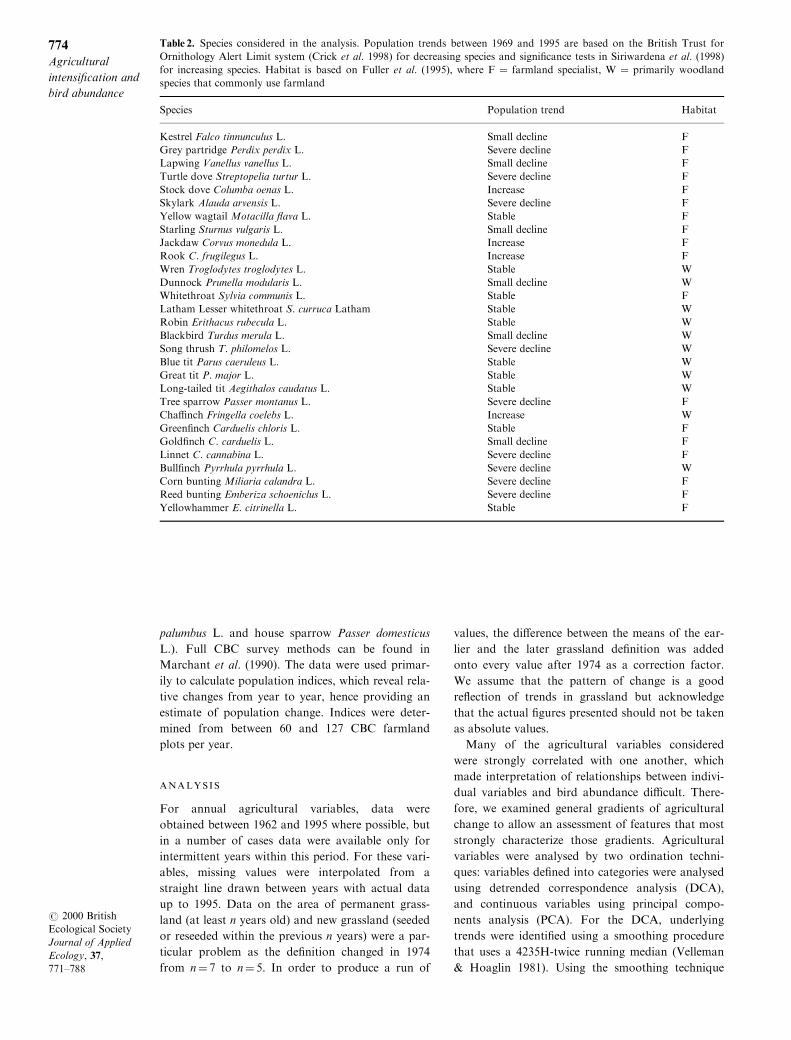
Table 2. Species considered in the analysis. Population trends between 1969 and 1995 are based on the British Trust for
Ornithology Alert Limit system (Crick et al. 1998) for decreasing species and signi®cance tests in Siriwardena et al. (1998)
for increasing species. Habitat is based on Fuller et al. (1995), where F � farmland specialist, W � primarily woodland
species that commonly use farmland
Species Population trend Habitat
Kestrel Falco tinnunculus L. Small decline F
Grey partridge Perdix perdix L. Severe decline F
Lapwing Vanellus vanellus L. Small decline F
Turtle dove Streptopelia turtur L. Severe decline F
Stock dove Columba oenas L. Increase F
Skylark Alauda arvensis L. Severe decline F
Yellow wagtail Motacilla ¯ava L. Stable F
Starling Sturnus vulgaris L. Small decline F
Jackdaw Corvus monedula L. Increase F
Rook C. frugilegus L. Increase F
Wren Troglodytes troglodytes L. Stable W
Dunnock Prunella modularis L. Small decline W
Whitethroat Sylvia communis L. Stable F
Latham Lesser whitethroat S. curruca Latham Stable W
Robin Erithacus rubecula L. Stable W
Blackbird Turdus merula L. Small decline W
Song thrush T. philomelos L. Severe decline W
Blue tit Parus caeruleus L. Stable W
Great tit P. major L. Stable W
Long-tailed tit Aegithalos caudatus L. Stable W
Tree sparrow Passer montanus L. Severe decline F
Cha�nch Fringella coelebs L. Increase W
Green®nch Carduelis chloris L. Stable F
Gold®nch C. carduelis L. Small decline F
Linnet C. cannabina L. Severe decline F
Bull®nch Pyrrhula pyrrhula L. Severe decline W
Corn bunting Miliaria calandra L. Severe decline F
Reed bunting Emberiza schoeniclus L. Severe decline F
Yellowhammer E. citrinella L. Stable F
774Agricultural
intensi®cation and
bird abundance
# 2000 British
Ecological Society
Journal of Applied
Ecology, 37,
771±788
allows the determination of continuous underlying
temporal trends and has the advantage of few
assumptions compared with alternative parametric
methods. For each variable separately, annual
values (including estimated values) were ranked
across years and then divided equally into three
groups of relatively high, medium and low ranks.
These ranked groups were then recorded as attri-
butes that were present or absent for each year and
ordinated using DCA with the program DEC-
ORANA (Hill 1979). Thus the data could be sum-
marized in terms of attribute scores over years,
giving an index of agricultural change. In this way,
the category of the value rather than the actual
value is important, so it matters less that certain
values were estimated.
For the PCA, variables with a large number of
interpolated values (more than 2) were dropped
from the analysis, so only variables with a continu-
ous run of several years of actual data were consid-
ered. The majority of variables had generally poor
data for both the earliest and latest years, so the
analysis was carried out only on data between 1974
and 1991. PCA was carried out using the correlation
matrix of (unsmoothed) variables, enabling variables
measured on di�erent scales to be included on the
same axis (James & McCulloch 1990). Due to the
`gappiness' of the data, it was not possible to disre-
gard all interpolated values in this analysis as this
would have made the sample sizes small and, more
seriously, would have meant that a number of
important variables (especially autumn- and spring-
sown barley) would not have been considered.
CBC population indices were determined using
log±linear Poisson regression, modelling logarithms
of bird counts using the software TRIM (ter Braak
et al. 1994; Pannekoek & van Strien 1996). The
model incorporated individual site and year e�ects,
which revealed year-to-year changes in CBC index.
Detailed patterns of change in CBC index are pre-
sented in Fuller et al. (1995) and Siriwardena et al.
(1998). Model ®t was examined using maximum
likelihood methods, testing whether annual changes
are homogeneous across sites (using likelihood ratio
tests). Indices derived using the model incorporating
site and year e�ects were analysed individually in
relation to agricultural variables and by using PCA
on a matrix of species index by year between 1962
and 1996. Use of PCA enabled the identi®cation of
general patterns of change within the farmland bird
community.
General e�ects of agricultural change on bird
populations were considered using axes of environ-
mental variation from DCA and PCA. Principal
axes derived from CBC indices (referred to as
BIRDPCA) were plotted against axes of environ-
mental variation derived from DCA and PCA of
agricultural statistics (referred to as HABDCA and
HABPCA, respectively) in order to identify coinci-
dence in general patterns of change in bird abun-
dances and agricultural management.
Results
CHANGES IN AGRICULTURAL
MANAGEMENT
Smoothed trends for 31 agricultural variables are
shown in Fig. 1. The area of tilled land has increased
by almost one million hectares since the early 1960s
(Fig. 1a). There has been a slight decline recently,
however, that may have been partly due to the
introduction of set-aside (Fig. 1b). There have been
substantial increases in wheat, oilseed rape and
sugar beet, and decreases in oats, barley, potatoes,
other root crops (turnips and swedes) and bare fal-
low (Fig. 1c±j), the latter two re¯ecting changes in
crop rotations. A former feature of arable rotations
was root crops, which had the function of cleaning
the soil of weeds. This is no longer necessary with
the development of pre-emergent herbicides (see
below), and also the main use for the root crop as
fodder no longer exists. Oilseed rape has replaced
both of these crops in a typical rotation. We could
®nd only recent data on the area of linseed, but we
know that this crop has increased substantially since
the late 1980s as it has become a more pro®table
industrial crop and also because it is often sown as
a cover crop within the set-aside scheme. We thus
assume that the increase in linseed has followed the
trend for set-aside (Fig. 1k), although there will have
been very small amounts grown prior to this.
Within cereal crops, there have been changes in
the timing of sowing. The area of wheat and barley
sown in the autumn increased substantially from the
mid-1970s, with spring-sown cereals showing conco-
mitant decreases in area (Fig. 1l±o). One conse-
quence of this is the decrease of winter stubble.
Previously, a large proportion of harvested ®elds
would have been ploughed and left until the spring.
In some cases the stubble was left over winter to be
ploughed in before planting the next crop. Under-
sowing of grass or clover was also a widespread
practice that has declined with the increase in
autumn sowing and the increasing separation of ara-
ble and pastoral enterprises. The majority of the
wheat crop has been sown in the autumn since at
least the early 1960s. By the mid-1980s, virtually all
wheat was autumn-sown and currently less than 1%
is sown in the spring. Spring-sown barley is still rela-
tively common, accounting for 28% of the barley
acreage in 1994 (MAFF, unpublished data).
Improved permanent and temporary grassland
and rough grazing have all declined since the 1960s
(Fig. 1p±r). However, the ®gures for total grass area
are misleading because trends vary regionally, grass
having decreased in arable regions and increased in
pastoral regions due to a decrease in fodder crops
775D.E. Chamberlain
et al.
# 2000 British
Ecological Society
Journal of Applied
Ecology, 37,
771±788

Fig. 1. Trends in agricultural variables for the whole of England and Wales or the whole UK (see Table 1 for variable de®-
nitions). Variables with continuous runs of annual data have been smoothed to reveal underlying trends. Solid black shad-
ing indicates annual smoothed data. Single lines joining crosses indicate data from intermittent years. Dashed lines indicate
interpolated/extrapolated data.
776Agricultural
intensi®cation and
bird abundance
# 2000 British
Ecological Society
Journal of Applied
Ecology, 37,
771±788

Fig. 1. continued.
777D.E. Chamberlain
et al.
# 2000 British
Ecological Society
Journal of Applied
Ecology, 37,
771±788

and the conversion of marginal land to permanent
improved pasture (Chamberlain & Fuller 2000). The
decline of temporary grass has arisen due to the
decline of traditional rotational and mixed farming
systems and the increasingly widespread adoption of
continuous tillage cropping. The type of temporary
grass has also changed. In the late 1940s much
would have been 1-year clover leys, but by the early
Fig. 1. continued.
778Agricultural
intensi®cation and
bird abundance
# 2000 British
Ecological Society
Journal of Applied
Ecology, 37,
771±788

1980s clover ley accounted for less than 1% of the
area of all temporary grassland (O'Connor &
Shrubb 1986). One of the main changes to have
occurred in the post-war management of grassland
has been the replacement of traditional hay mea-
dows with grass grown for silage (Fig. 1s±t). Wide-
spread adoption of silage occurred from the 1960s
onwards and by the 1980s this was the dominant
form of grass feed production in the UK (Wilkinson
1997). Silage grass is often cut two or more times in
a season compared with the single late cut of hay,
and is typically cut too early for grass seed to set.
Fig. 1. continued.
779D.E. Chamberlain
et al.
# 2000 British
Ecological Society
Journal of Applied
Ecology, 37,
771±788

The multiple cut of silage leads to increased yields
over hay which has resulted in a great increase in
grass yields (Fig. 1u).
Many changes in grass and crop management
have been facilitated by increases in both arti®cial
fertilizer and slurry inputs (Fig. 1v±w). Inorganic
fertilizers have replaced farmyard manure as the
major source of plant nutrients supplied to crops
and grass. The development of concentrated arti®-
cial fertilizers has meant a much faster and easier
application: 1 ton of inorganic fertilizer contains as
much nutrient as 25 tons of manure (Grigg 1989).
Although the majority of plant nutrients is now pro-
vided by arti®cial means, a large proportion (up to
25%) still comes from animal dung, in the form of
either manure or slurry, particularly in grassland
enterprises (Grigg 1989).
Since the 1970s there has been a decrease in cattle
numbers (Fig. 1x), partly due to European Commu-
nity (EC) dairy quotas, but probably also due to
changing land use including the decline of mixed
farming. This has been facilitated by the fact that
farms no longer need to produce their own farmyard
manure due to the use of chemical fertilizers. In the
1960s and early 1970s sheep numbers fell in central
and eastern England due to the intensi®cation of
cereal farming, but since then there have been
increases in both lowland and upland England and
Wales (Fig. 1y). To some extent this may have been
due to grassland improvement (e.g. drainage and
reseeding), but the main reason is likely to be eco-
nomic, the start of the increase in the mid-1970s
coinciding with the introduction of the Hill Live-
stock Compensation Allowance. The ®gure pre-
sented may be misleading in the context of this
analysis as these ®gures include uplands where
increases have been much greater than on lowland
farmland (Fuller & Gough 1999). Given that grass
area is generally decreasing, there is likely to have
been an even larger increase in the density of sheep
(although this is not possible to determine accu-
rately with MAFF statistics).
The area treated with all types of pesticide (herbi-
cides, insecticides, molluscicides, fungicides and seed
dressings) has increased since the early 1970s (Fig.
1z±ee). A further factor to consider is the increase in
the diversity of chemicals, the number of di�erent
formulations on the o�cial Agricultural Chemicals
Approval Scheme list rising from 37 in 1955 to 199
in 1985 (O'Connor & Shrubb 1986). In the 1950s
herbicides would have been mainly post-emergent,
particularly acting on broad-leaved weeds in cereals.
The development of pre-emergent and grass herbi-
cides has been very important in facilitating changes
in cropping practice, particularly the widespread
adoption of autumn sowing. Grass weeds in particu-
lar are an obstacle to continuous cereal cropping
and were previously dealt with by the two periods of
cultivation per season experienced in rotation, when
grass that had germinated over winter was ploughed
in before spring sowing. Pre-emergent herbicides
remove competitive weeds and grasses at crop estab-
lishment and so have led to a serious reduction in
their ability to set seed.
Several of the variables in Fig. 1 have shown simi-
lar trends or opposing trends over time and there
was a high degree of collinearity in the data, with
many variables signi®cantly correlated with many
others (Table 3), so changes in di�erent aspects of
agricultural management have tended to occur at
the same time. A noticeable aspect of intensi®cation
is that changes are often closely interlinked. For
example, technological advances in pesticides and
fertilizers have facilitated changes in sowing regimes
and, subsequently, changes in harvesting times and
decreases in winter stubbles. Similarly, these devel-
opments have facilitated the polarization of British
farmland into either pastoral or arable enterprises,
as necessary resources that were previously pro-
duced on the farm itself (e.g. farmyard manure
needed for arable crops, or cereals needed for ani-
mal feed) can now be supplied in arti®cial form
(Grigg 1989).
ORDINATION OF AGRICULTURAL DATA
DCA of temporal change in agricultural variables
grouped into high, medium and low categories pro-
duced one strongly dominant axis that accounted
for 82% of variation in the data (Table 4). At one
end of this axis is a mixture of factors with low
scores early in the time period in question (e.g. per-
manent grass, herbicides and winter cereals) and
those with high scores at that time (e.g. spring
wheat and hay production); at the other end are fac-
tors with low scores late in the time period (e.g. cat-
tle, new grass and potatoes) and those with high
scores then (e.g. oilseed rape, fungicide and silage
production). Thus this axis summarizes the long-
term trends in agricultural change, and the high pro-
portion of the variance it explains con®rms how
coincident the various changes have been.
HABDCA scores increased most rapidly between
1970 and 1988 (Fig. 2), the period when variables
with the greatest e�ect on the axis were changing
the most; 1962±70 and 1988±95 were periods of little
change, especially in variables with most in¯uence
on the axis.
The above analysis was fairly simple in that it
used categorical data based on ranks and had some
variables (mostly pesticide data) where many values
were estimated. A further, more rigorous, analysis
using actual data was performed using PCA, consid-
ering only variables with a continuous run of
smoothed data values and a maximum of two inter-
polated values from 1974 to 1991 (Table 5). The ®rst
axis explained 76% of variation in the data and
represented a gradient from variables that had
780Agricultural
intensi®cation and
bird abundance
# 2000 British
Ecological Society
Journal of Applied
Ecology, 37,
771±788
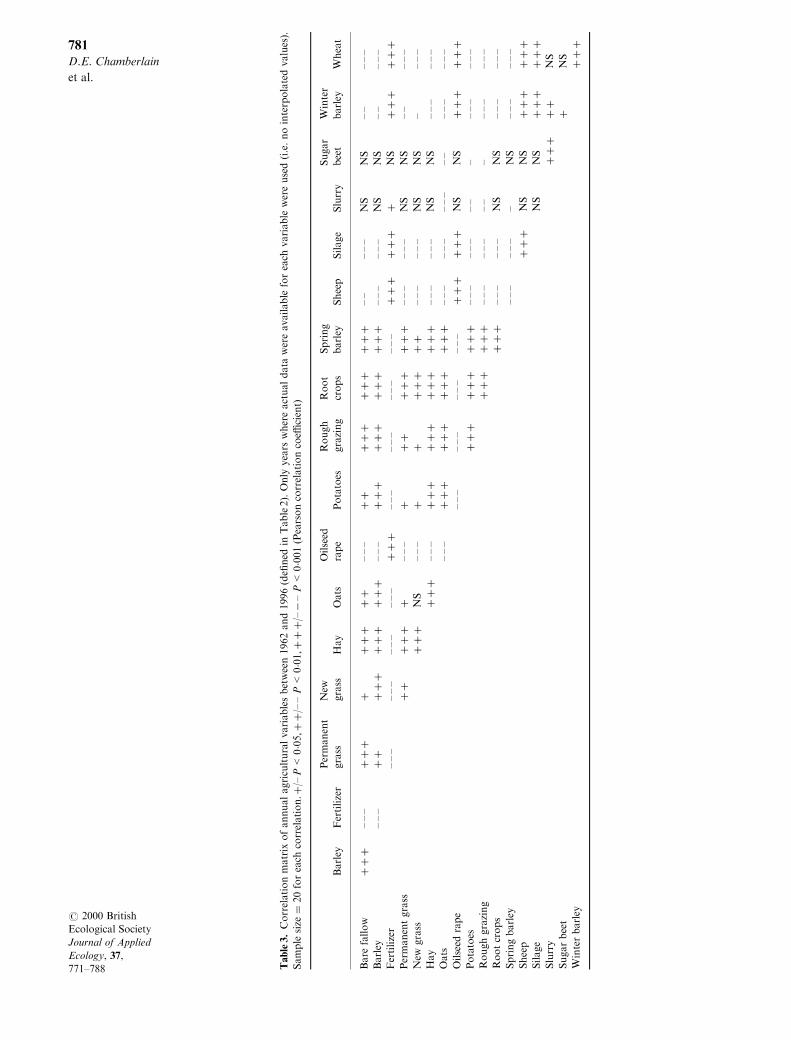
Table3.Correlationmatrix
ofannualagriculturalvariablesbetween1962and1996(de®ned
inTable2).Only
years
whereactualdata
wereavailable
foreach
variable
wereused(i.e.nointerpolatedvalues).
Sample
size�
20foreach
correlation.�
/±P<
0�05
,��/
±±P<
0�01
,���/
±ÿ±P<
0�00
1(Pearsoncorrelationcoe�
cient)
Barley
Fertilizer
Permanent
grass
New
grass
Hay
Oats
Oilseed
rape
Potatoes
Rough
grazing
Root
crops
Spring
barley
Sheep
Silage
Slurry
Sugar
beet
Winter
barley
Wheat
Bare
fallow
���
±±±
���
����
��
±±±
��
���
���
���
±±
±±±
NS
NS
±±
±±±
Barley
±±±
��
���
���
���
±±±
���
���
���
���
±±±
±±±
NS
NS
±±
±±±
Fertilizer
±±±
±±±
±±±
±±±
���
±±±
±±±
±±±
±±±
���
���
�NS
���
���
Permanentgrass
��
���
�±±±
���
���
���
±±±
±±±
NS
NS
±±
±±±
New
grass
���
NS
±±±
��
���
��
±±±
±±±
NS
NS
±±±±
Hay
���
±±±
���
���
���
���
±±±
±±±
NS
NS
±±±
±±±
Oats
±±±
���
���
���
���
±±±
±±±
±±±
±±
±±±
±±±
Oilseed
rape
±±±
±±±
±±±
±±±
���
���
NS
NS
���
���
Potatoes
���
���
���
±±±
±±±
±±
±±±±
±±±
Roughgrazing
���
���
±±±
±±±
±±
±±±±
±±±
Rootcrops
���
±±±
±±±
NS
NS
±±±
±±±
Springbarley
±±±
±±±
±NS
±±±
±±±
Sheep
���
NS
NS
���
���
Silage
NS
NS
���
���
Slurry
���
��
NS
Sugarbeet
�NS
Winterbarley
���781
D.E. Chamberlain
et al.
# 2000 British
Ecological Society
Journal of Applied
Ecology, 37,
771±788

shown rapid rises in more recent years, especially
wheat, oilseed rape, sheep numbers, silage produc-
tion and arti®cial fertilizer application, to variables
that had shown a rapid decrease over the same per-
iod, such as spring barley, rough grazing, hay pro-
duction and root crops (Table 5). The second axis
explained 11% of variation in the data and was
harder to interpret, but was dominated by sugar
beet area and slurry application rates, which have
shown fairly steady rates of change over time. A
plot of axis 1 against year revealed similar patterns
to that shown for HABDCA axis scores, with the
period of greatest change between 1975 and 1986
for those variables having the greatest in¯uence on
the gradient (Fig. 3). However, this pattern was
more linear in form.
ORDINATION OF CBC TRENDS
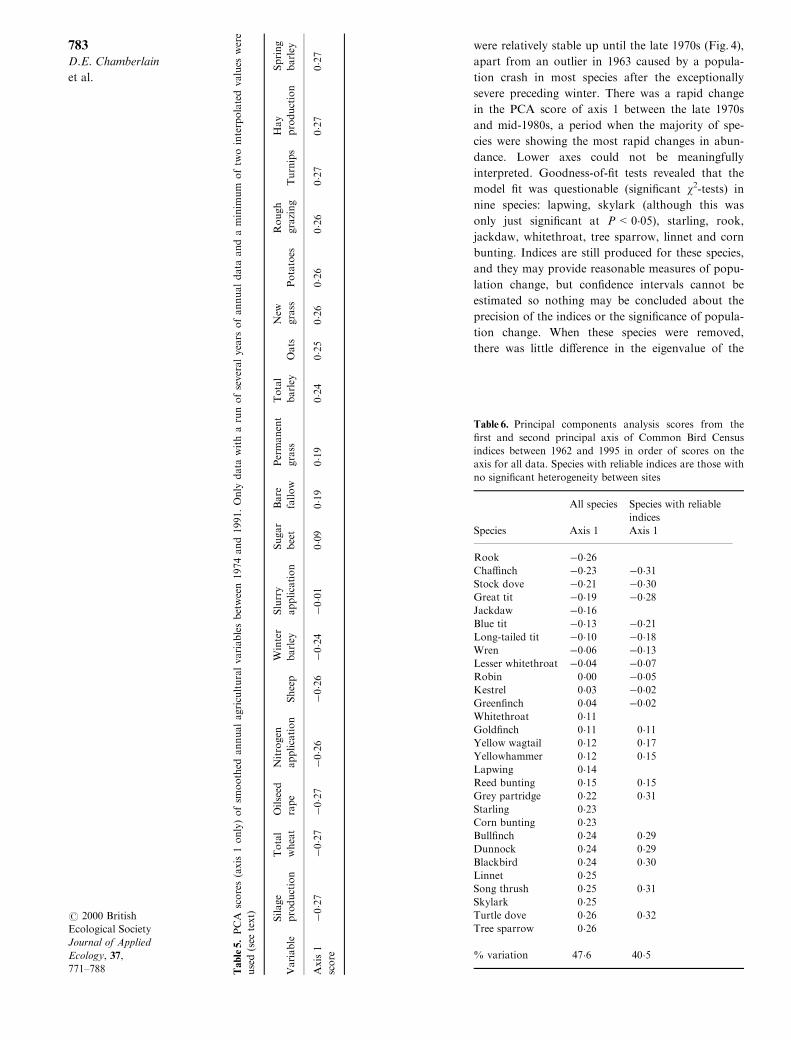
PCA analyses were carried out on CBC indices
derived from a model incorporating year and site
e�ects across years between 1962 and 1996. When
including all 29 species, the ®rst PCA axis repre-
sented a strong gradient from species showing evi-
dence of increases (stock dove, rook and cha�nch)
to species showing decreases. Tree sparrow, turtle
dove, skylark, song thrush, linnet, blackbird, dun-
nock, bull®nch and corn bunting showed very simi-
lar axis scores (Table 6) and have similar patterns of
decline (Siriwardena et al. 1998). Annual axis scores
Table 4. Analysis of temporal change in agriculture by detrended correspondence analysis (DCA) scores of agricultural vari-
ables, showing only the 15 highest and lowest ranked variables on axis 1. Each variable has high, medium or low categories
and has the pre®xes H, M or L, respectively. A total of 93 variables (31 variables each with high, medium and low cate-
gories) was considered in the analysis
Low rank variables DCA score (axis 1) High rank variables DCA score (axis 1)
L grass ÿ0�76 H insecticide 5�66L post-emergent herbicide ÿ0�75 H silage production 5�66L winter barley ÿ0�66 L potatoes 5�66L winter wheat ÿ0�66 H set-aside 5�71H spring wheat ÿ0�66 H linseed 5�71H rough grazing ÿ0�52 L total barley 5�82H oats ÿ0�52 L new grass 5�82H hay production ÿ0�52 H total wheat 5�82L grass production ÿ0�52 M set-aside 5�86L sugar beet ÿ0�52 H fungicide 5�88L pre-emergent herbicide ÿ0�50 L cattle numbers 5�89L fertilizer application ÿ0�42 H oilseed rape 5�89L slurry application ÿ0�26 M linseed 5�94L sheep numbers ÿ0�20 L linseed 6�05L seed dressing 0�29 L set-aside 6�05
Fig. 2. Annual scores from the ®rst axis of detrended cor-
respondence analysis of agricultural variables (Table 4)
grouped into high, medium and low categories based on
data in Fig. 1.
Fig. 3. Annual scores from the ®rst axis of principal com-
ponents analysis of agricultural variables, considering the
18 most accurately measured variables (Table 5).
782Agricultural
intensi®cation and
bird abundance
# 2000 British
Ecological Society
Journal of Applied
Ecology, 37,
771±788
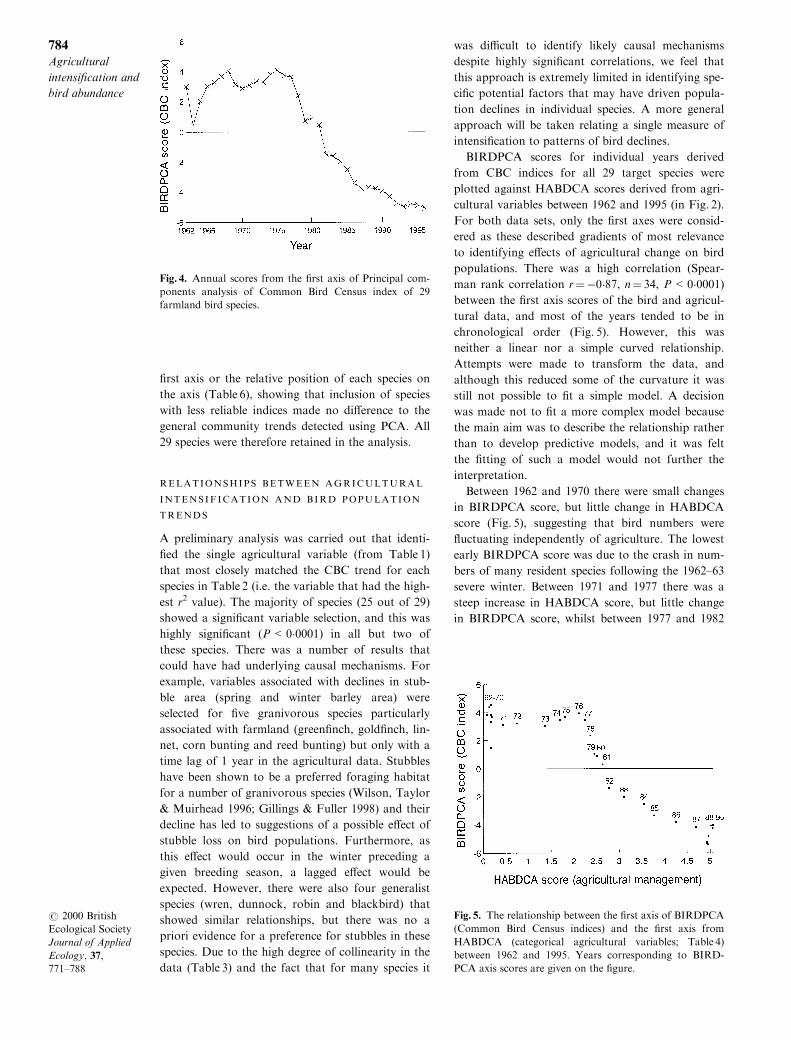
were relatively stable up until the late 1970s (Fig. 4),
apart from an outlier in 1963 caused by a popula-
tion crash in most species after the exceptionally
severe preceding winter. There was a rapid change
in the PCA score of axis 1 between the late 1970s
and mid-1980s, a period when the majority of spe-
cies were showing the most rapid changes in abun-
dance. Lower axes could not be meaningfully
interpreted. Goodness-of-®t tests revealed that the
model ®t was questionable (signi®cant w2-tests) in
nine species: lapwing, skylark (although this was
only just signi®cant at P<0�05), starling, rook,
jackdaw, whitethroat, tree sparrow, linnet and corn
bunting. Indices are still produced for these species,
and they may provide reasonable measures of popu-
lation change, but con®dence intervals cannot be
estimated so nothing may be concluded about the
precision of the indices or the signi®cance of popula-
tion change. When these species were removed,
there was little di�erence in the eigenvalue of the
Table5.PCA
scores(axis
1only)ofsm
oothed
annualagriculturalvariablesbetween1974and1991.Only
data
witharunofseveralyears
ofannualdata
andaminim
um
oftw
ointerpolatedvalues
were
used(see
text)
Variable
Silage
production
Total
wheat
Oilseed
rape
Nitrogen
application
Sheep
Winter
barley
Slurry
application
Sugar
beet
Bare
fallow
Permanent
grass
Total
barley
Oats
New
grass
Potatoes
Rough
grazing
Turnips
Hay
production
Spring
barley
Axis1
score
ÿ0�27
ÿ0�27
ÿ0�27
ÿ0�26
ÿ0�26
ÿ0�24
ÿ0�01
0�09
0�19
0�19
0�24
0�25
0�26
0�26
0�26
0�27
0�27
0�27
Table 6. Principal components analysis scores from the
®rst and second principal axis of Common Bird Census
indices between 1962 and 1995 in order of scores on the
axis for all data. Species with reliable indices are those with
no signi®cant heterogeneity between sites
Species
All species
Axis 1
Species with reliable
indices
Axis 1
Rook ÿ0�26Cha�nch ÿ0�23 ÿ0�31Stock dove ÿ0�21 ÿ0�30Great tit ÿ0�19 ÿ0�28Jackdaw ÿ0�16Blue tit ÿ0�13 ÿ0�21Long-tailed tit ÿ0�10 ÿ0�18Wren ÿ0�06 ÿ0�13Lesser whitethroat ÿ0�04 ÿ0�07Robin 0�00 ÿ0�05Kestrel 0�03 ÿ0�02Green®nch 0�04 ÿ0�02Whitethroat 0�11Gold®nch 0�11 0�11Yellow wagtail 0�12 0�17Yellowhammer 0�12 0�15Lapwing 0�14Reed bunting 0�15 0�15Grey partridge 0�22 0�31Starling 0�23Corn bunting 0�23Bull®nch 0�24 0�29Dunnock 0�24 0�29Blackbird 0�24 0�30Linnet 0�25Song thrush 0�25 0�31Skylark 0�25Turtle dove 0�26 0�32Tree sparrow 0�26
% variation 47�6 40�5
783D.E. Chamberlain
et al.
# 2000 British
Ecological Society
Journal of Applied
Ecology, 37,
771±788
®rst axis or the relative position of each species on
the axis (Table 6), showing that inclusion of species
with less reliable indices made no di�erence to the
general community trends detected using PCA. All
29 species were therefore retained in the analysis.
RELATIONSHIPS BETWEEN AGRICULTURAL
INTENSIFICATION AND BIRD POPULATION
TRENDS
A preliminary analysis was carried out that identi-
®ed the single agricultural variable (from Table 1)
that most closely matched the CBC trend for each
species in Table 2 (i.e. the variable that had the high-
est r2 value). The majority of species (25 out of 29)
showed a signi®cant variable selection, and this was
highly signi®cant (P<0�0001) in all but two of
these species. There was a number of results that
could have had underlying causal mechanisms. For
example, variables associated with declines in stub-
ble area (spring and winter barley area) were
selected for ®ve granivorous species particularly
associated with farmland (green®nch, gold®nch, lin-
net, corn bunting and reed bunting) but only with a
time lag of 1 year in the agricultural data. Stubbles
have been shown to be a preferred foraging habitat
for a number of granivorous species (Wilson, Taylor
& Muirhead 1996; Gillings & Fuller 1998) and their
decline has led to suggestions of a possible e�ect of
stubble loss on bird populations. Furthermore, as
this e�ect would occur in the winter preceding a
given breeding season, a lagged e�ect would be
expected. However, there were also four generalist
species (wren, dunnock, robin and blackbird) that
showed similar relationships, but there was no a
priori evidence for a preference for stubbles in these
species. Due to the high degree of collinearity in the
data (Table 3) and the fact that for many species it
was di�cult to identify likely causal mechanisms
despite highly signi®cant correlations, we feel that
this approach is extremely limited in identifying spe-
ci®c potential factors that may have driven popula-
tion declines in individual species. A more general
approach will be taken relating a single measure of
intensi®cation to patterns of bird declines.
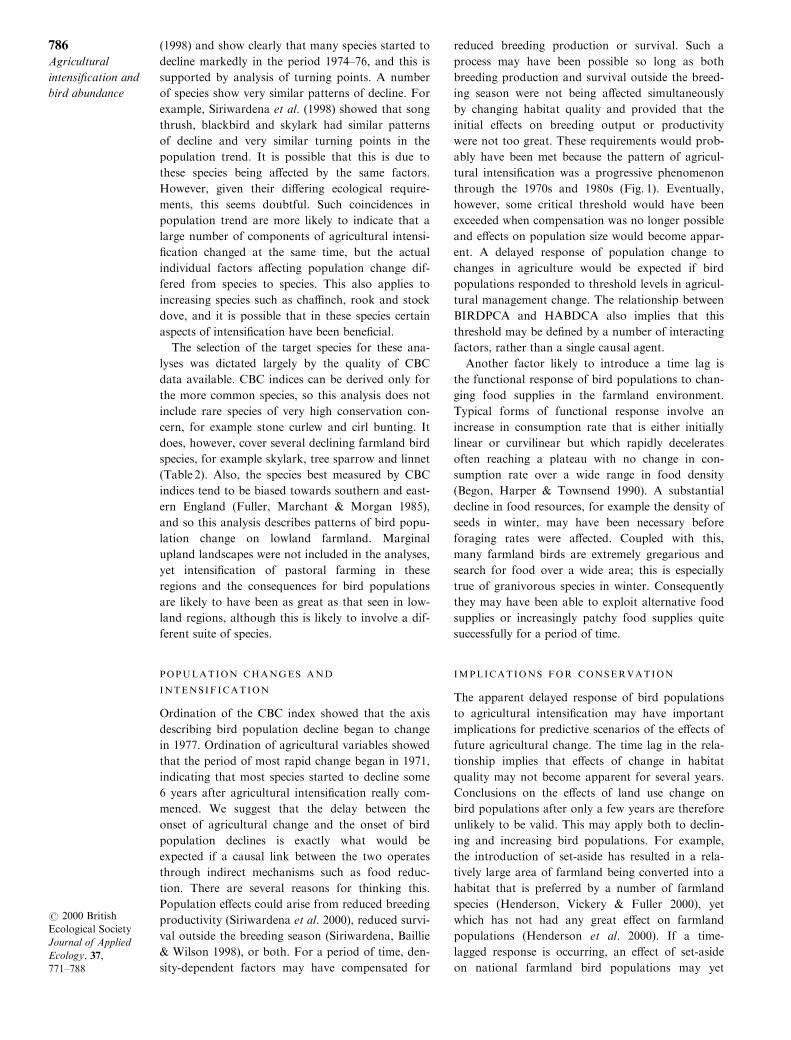
BIRDPCA scores for individual years derived
from CBC indices for all 29 target species were
plotted against HABDCA scores derived from agri-
cultural variables between 1962 and 1995 (in Fig. 2).
For both data sets, only the ®rst axes were consid-
ered as these described gradients of most relevance
to identifying e�ects of agricultural change on bird
populations. There was a high correlation (Spear-
man rank correlation r�ÿ0�87, n� 34, P<0�0001)between the ®rst axis scores of the bird and agricul-
tural data, and most of the years tended to be in
chronological order (Fig. 5). However, this was
neither a linear nor a simple curved relationship.
Attempts were made to transform the data, and
although this reduced some of the curvature it was
still not possible to ®t a simple model. A decision
was made not to ®t a more complex model because
the main aim was to describe the relationship rather
than to develop predictive models, and it was felt
the ®tting of such a model would not further the
interpretation.
Between 1962 and 1970 there were small changes
in BIRDPCA score, but little change in HABDCA
score (Fig. 5), suggesting that bird numbers were
¯uctuating independently of agriculture. The lowest
early BIRDPCA score was due to the crash in num-
bers of many resident species following the 1962±63
severe winter. Between 1971 and 1977 there was a
steep increase in HABDCA score, but little change
in BIRDPCA score, whilst between 1977 and 1982
Fig. 4. Annual scores from the ®rst axis of Principal com-
ponents analysis of Common Bird Census index of 29
farmland bird species.
Fig. 5. The relationship between the ®rst axis of BIRDPCA
(Common Bird Census indices) and the ®rst axis from
HABDCA (categorical agricultural variables; Table 4)
between 1962 and 1995. Years corresponding to BIRD-
PCA axis scores are given on the ®gure.
784Agricultural
intensi®cation and
bird abundance
# 2000 British
Ecological Society
Journal of Applied
Ecology, 37,
771±788

there was a more gradual increase in HABDCA
score combined with a steep decrease in BIRDPCA
score. Between 1982 and 1988 the HABDCA scores
increased sharply and the BIRDPCA scores contin-
ued to decrease. Finally there was a period of minor
¯uctuations but little major change in both BIRD-
PCA and HABDCA scores between 1989 and 1995,
indicating a period of relative stability. The nature
of this relationship, with a period of major change
in HABDCA score and little change in BIRDPCA
scores followed by the converse, suggests that a time
lag may be involved in the link between bird popula-
tions and agricultural change.
The above analyses were repeated, but using
HABPCA scores for agricultural variables in place
of HABDCA scores, which meant that fewer but
more accurately measured agricultural variables
from a smaller range of years (1974±91) were con-
sidered (Table 5). The relationship was similar to the
previous analysis, with years tending to appear in
order (Spearman correlation r�ÿ0�97, n� 18, P<
0�0001), but it was more linear in form (Fig. 6).
There was no indication of a time lag in bird popu-
lation change relative to agricultural change, but
this analysis was curtailed at either end relative to
the more comprehensive DCA analysis, so most of
the period of stability in bird populations was not
included in this analysis.
Discussion
AGRICULTURAL INTENSIFICATION
The data presented here provide an overview of the
nature and timing of changes in agricultural prac-
tices in lowland England and Wales. Many compo-
nents of change in agriculture have followed the
same general pattern over the past three decades.
The main underlying causes of these changes have
been technological developments. The development
of pesticides and fertilizers in particular, and also
the increased e�ciency of their application, has had
widespread e�ects on farming practice, including
changes in the timing of sowing of cereals, changes
in crop rotations, and changes in the management
and harvesting of grass. Changes in individual com-
ponents of agricultural intensi®cation have not
therefore proceeded independently of one another.
Rather, changes have been closely interlinked, a
change in one aspect of management often facilitat-
ing change in other aspects.
A number of agricultural variables showed consis-
tent trends that enabled ordination analyses to pro-
duce axes of environmental variation that were
good summaries of the major overall changes in
agricultural management. Hence, annual axis scores
are likely to be a good general index of agricultural
intensi®cation. The variables relating to crop and
grass management used in these analyses include
most of those likely to have potential e�ects on bird
populations (O'Connor & Shrubb 1986). However,
there were still some notable omissions. There were
few data on spring and autumn cereals in the late
1960s and early 1970s, a crucial period of change.
Time of sowing is likely to be important as spring
sowing tends to be associated with overwinter stub-
bles, an important habitat for a number of bird spe-
cies outside the breeding season (Wilson, Taylor &
Muirhead 1996), while spring cereals provide an
important nesting habitat for skylarks, particularly
later in the breeding season when winter cereals are
too tall and dense (Wilson et al. 1997; Chamberlain
et al. 1999). There was no information on grass leys
used in rotation. Crop rotations including grass leys
tend to be associated with greater habitat diversity,
which is likely to bene®t at least skylarks (Chamber-
lain & Gregory 1999) and lapwings (Galbraith 1988)
by providing a bene®cial mix of habitats for nesting
and feeding. Generally, changes in cropping and
annual changes in pesticide and fertilizer use were
fairly well covered by the data, with perhaps more
detail for variables associated with arable farming.
No adequate data were available on abundance and
quality of non-crop habitats, particularly hedge-
rows, which are a major feature a�ecting the farm-
land bird community (O'Connor & Shrubb 1986),
although Gillings & Fuller (1998) have argued that
loss of non-crop habitat has been of secondary
importance to reduction in habitat quality.
FARMLAND BIRD POPULATION CHANGES
Analysis of CBC indices using DCA showed that
from 1977 onwards a major shift in bird populations
began, continuing until the late 1980s. Trends for
individual species are presented in Siriwardena et al.
Fig. 6. The relationship between the ®rst axis of BIRDPCA
(Common Bird Census index) and the ®rst axis from
HABPCA (continuous agricultural variables; Table 5)
between 1974 and 1991. Years corresponding to BIRD-
PCA axis scores are given on the ®gure.
785D.E. Chamberlain
et al.
# 2000 British
Ecological Society
Journal of Applied
Ecology, 37,
771±788
(1998) and show clearly that many species started to
decline markedly in the period 1974±76, and this is
supported by analysis of turning points. A number
of species show very similar patterns of decline. For
example, Siriwardena et al. (1998) showed that song
thrush, blackbird and skylark had similar patterns
of decline and very similar turning points in the
population trend. It is possible that this is due to
these species being a�ected by the same factors.
However, given their di�ering ecological require-
ments, this seems doubtful. Such coincidences in
population trend are more likely to indicate that a
large number of components of agricultural intensi-
®cation changed at the same time, but the actual
individual factors a�ecting population change dif-
fered from species to species. This also applies to
increasing species such as cha�nch, rook and stock
dove, and it is possible that in these species certain
aspects of intensi®cation have been bene®cial.
The selection of the target species for these ana-
lyses was dictated largely by the quality of CBC
data available. CBC indices can be derived only for
the more common species, so this analysis does not
include rare species of very high conservation con-
cern, for example stone curlew and cirl bunting. It
does, however, cover several declining farmland bird
species, for example skylark, tree sparrow and linnet
(Table 2). Also, the species best measured by CBC
indices tend to be biased towards southern and east-
ern England (Fuller, Marchant & Morgan 1985),
and so this analysis describes patterns of bird popu-
lation change on lowland farmland. Marginal
upland landscapes were not included in the analyses,
yet intensi®cation of pastoral farming in these
regions and the consequences for bird populations
are likely to have been as great as that seen in low-
land regions, although this is likely to involve a dif-
ferent suite of species.
POPULATION CHANGES AND
INTENSIFICATION
Ordination of the CBC index showed that the axis
describing bird population decline began to change
in 1977. Ordination of agricultural variables showed
that the period of most rapid change began in 1971,
indicating that most species started to decline some
6 years after agricultural intensi®cation really com-
menced. We suggest that the delay between the
onset of agricultural change and the onset of bird
population declines is exactly what would be
expected if a causal link between the two operates
through indirect mechanisms such as food reduc-
tion. There are several reasons for thinking this.
Population e�ects could arise from reduced breeding
productivity (Siriwardena et al. 2000), reduced survi-
val outside the breeding season (Siriwardena, Baillie
& Wilson 1998), or both. For a period of time, den-
sity-dependent factors may have compensated for
reduced breeding production or survival. Such a
process may have been possible so long as both
breeding production and survival outside the breed-
ing season were not being a�ected simultaneously
by changing habitat quality and provided that the
initial e�ects on breeding output or productivity
were not too great. These requirements would prob-
ably have been met because the pattern of agricul-
tural intensi®cation was a progressive phenomenon
through the 1970s and 1980s (Fig. 1). Eventually,
however, some critical threshold would have been
exceeded when compensation was no longer possible
and e�ects on population size would become appar-
ent. A delayed response of population change to
changes in agriculture would be expected if bird
populations responded to threshold levels in agricul-
tural management change. The relationship between
BIRDPCA and HABDCA also implies that this
threshold may be de®ned by a number of interacting
factors, rather than a single causal agent.
Another factor likely to introduce a time lag is
the functional response of bird populations to chan-
ging food supplies in the farmland environment.
Typical forms of functional response involve an
increase in consumption rate that is either initially
linear or curvilinear but which rapidly decelerates
often reaching a plateau with no change in con-
sumption rate over a wide range in food density
(Begon, Harper & Townsend 1990). A substantial
decline in food resources, for example the density of
seeds in winter, may have been necessary before
foraging rates were a�ected. Coupled with this,
many farmland birds are extremely gregarious and
search for food over a wide area; this is especially
true of granivorous species in winter. Consequently
they may have been able to exploit alternative food
supplies or increasingly patchy food supplies quite
successfully for a period of time.
IMPLICATIONS FOR CONSERVATION
The apparent delayed response of bird populations
to agricultural intensi®cation may have important
implications for predictive scenarios of the e�ects of
future agricultural change. The time lag in the rela-
tionship implies that e�ects of change in habitat
quality may not become apparent for several years.
Conclusions on the e�ects of land use change on
bird populations after only a few years are therefore
unlikely to be valid. This may apply both to declin-
ing and increasing bird populations. For example,
the introduction of set-aside has resulted in a rela-
tively large area of farmland being converted into a
habitat that is preferred by a number of farmland
species (Henderson, Vickery & Fuller 2000), yet
which has not had any great e�ect on farmland
populations (Henderson et al. 2000). If a time-
lagged response is occurring, an e�ect of set-aside
on national farmland bird populations may yet
786Agricultural
intensi®cation and
bird abundance
# 2000 British
Ecological Society
Journal of Applied
Ecology, 37,
771±788

become apparent. Furthermore, if the time lag arises
due to response to a critical threshold of high qual-
ity habitat, then that habitat may have to reach a
certain area and a level of widespread distribution
before there is any impact on bird populations.
Attempting to identify individual variables that
may have been responsible for declines in individual
species was di�cult as so many variables showed
similar timing in their patterns of change. Conse-
quently, the individual agricultural management
variables that were selected as explaining the most
variation in CBC index were di�cult to link to likely
mechanisms causing an e�ect on the population of a
given species. Given that we know that individual
components of intensi®cation are closely interlinked
and for the most part highly correlated with each
other, it is unlikely that general correlations at wide
geographical scales could identify important factors
driving population declines. Signi®cant relationships
detected between individual management variables
and CBC indices are indicative of general intensi®-
cation, but cannot be taken as evidence of potential
causal e�ects. Further evidence is needed from
intensive studies at the farm level before drawing ®r-
mer conclusions on the e�ects of changes in speci®c
aspects of agricultural management on bird popula-
tion change. However, given the complexity of the
relationships between components of intensi®cation,
even intensive studies may struggle to isolate indivi-
dual agricultural practices that have had most
impact on a given bird species.
Manipulation of speci®c components of farming
systems can sometimes bring really worthwhile bene-
®ts for wildlife under some circumstances. For
example, the re-introduction of stubbles in parts of
south Devon has been linked with an increase in cirl
buntings (Lock 1999). However, the intensive, long-
term, project required to identify the speci®c factors
limiting the cirl bunting population is unlikely to be
feasible for the majority of declining farmland birds.
The likelihood that several interacting factors,
rather than one single overriding factor, have driven
population declines in a number of species has
important implications for future agri-environmen-
tal management. As factors in¯uencing intensi®ca-
tion are strongly interlinked, we suggest that general
extensi®cation is likely to have the greatest range of
bene®ts, as implied by the apparently bene®cial
e�ects of organic farming on local bird populations
(Wilson et al. 1997; Chamberlain, Wilson & Fuller
1999).
Acknowledgements
We would like to thank a number of people who
helped with this paper. Simon Gillings, Jeremy
Greenwood, John Marchant and Juliet Vickery gave
valuable comments on the manuscript; Will Peach
provided advice on the use of TRIM; Brian Cham-
bers and Ian Henderson helped with data sources;
Su Gough and Nicki Read produced the ®gures. We
are also most grateful to all volunteer ®eld workers
who have contributed to the Common Birds Census.
The Common Birds Census is funded by the BTO
and the Joint Nature Conservation Committee (on
behalf of the Countryside Council for Wales, Eng-
lish Nature, Scottish Natural Heritage and The
Environment and Heritage Service for Northern Ire-
land). The research in this paper was funded by the
Ministry of Agriculture, Fisheries and Food.
References
Baillie, S.R. (1990) Integrated population monitoring of
breeding birds in Britain and Ireland. Ibis, 132, 151±
166.
Begon, M., Harper, J.L. & Townsend, C.R. (1990) Ecology
± Individuals, Populations and Communities, 2nd edn.
Blackwell Scienti®c Publications, Oxford, UK.
ter Braak, C.J.F., van Strien, A.J., Meijer, R. & Verstrael,
T.J. (1994) Analysis of monitoring data with many
missing values: which method? Bird Numbers 1992.
Distribution, Monitoring and Ecological Aspects (eds
W. Hagemeijer & T. Verstrael), pp. 663±673. Proceed-
ings of the 12th International Conference of the Inter-
national Bird Census Council and European
Ornithological Atlas Committee. Sovon, Beek-Ubber-
gen, Netherlands.
Brickle, N.W., Harper, D.G.C., Aebischer, N.J. & Cock-
ayne, S.H. (2000) E�ects of agricultural intensi®cation
on the breeding success of corn buntings Miliaria
calandra. Journal of Applied Ecology, 37, 742±755.
Campbell, L.H., Avery, M.I., Donald, P., Evans, A.D.,
Green, R.E. & Wilson, J.D. (1997) A Review of the
Indirect E�ects of Pesticides on Birds. JNCC Report
No. 227. Joint Nature Conservation Committee, Peter-
borough, UK.
Chamberlain, D.E. & Crick, H.Q.P. (1999) Population
declines and reproductive performance in skylarks
Alauda arvensis in di�erent regions and habitats of the
United Kingdom. Ibis, 141, 38±51.
Chamberlain, D.E. & Fuller, R.J. (2000) Local extinctions
and changes in species richness of lowland farmland
birds in England and Wales in relation to recent
changes in agricultural land-use. Agriculture, Ecosys-
tems and Environment, 78, 1±17.
Chamberlain, D.E. & Gregory, R.D. (1999) Coarse and
®ne-scale habitat associations of breeding skylarks
Alauda arvensis in the UK. Bird Study, 46, 34±47.
Chamberlain, D.E., Wilson, A.M., Browne, S.J. & Vickery,
J.A. (1999) E�ects of habitat type and management on
the abundance of skylarks in the breeding season.
Journal of Applied Ecology, 36, 856±870.
Chamberlain, D.E., Wilson, J.D. & Fuller, R.J. (1999) A
comparison of bird populations on organic and con-
ventional farmland in southern Britain. Biological Con-
servation, 88, 307±320.
Crick, H.Q.P., Baillie, S.R., Balmer, D.E., Bashford, R.I.,
Beaven, L.P., Dudley, C., Glue, D.E., Gregory, R.D.,
Marchant, J.H., Peach, W.J. & Wilson, A.M. (1998)
Breeding Birds in the Wider Countryside: their Conser-
vation Status. British Trust for Ornithology, Thetford,
UK.
Crick, H.Q.P., Dudley, C., Evans, A.D. & Smith, K.W.
(1994) Causes of nest failure among buntings in the
UK. Bird Study, 41, 88±94.
787D.E. Chamberlain
et al.
# 2000 British
Ecological Society
Journal of Applied
Ecology, 37,
771±788
Donald, P.F. (1997) The corn bunting Miliaria calandra in
Britain: a review of current status, patterns of decline
and possible causes. The Ecology and Conservation of
Corn Buntings Miliaria calandra (eds P.F. Donald &
N.J. Aebischer), pp. 11±26. UK Nature Conservation
No. 13. Joint Nature Conservation Committee, Peter-
borough, UK.
Evans, A.D., Smith, K.W., Buckingham, D.L. & Evans, J.
(1997) Seasonal variation in breeding performance and
nestling diet of cirl buntings Emberiza cirlus in Eng-
land. Bird Study, 44, 66±79.
Fuller, R.J. & Gough, S. (1999) Changing patterns of
sheep stocking in Britain and implications for bird
populations. Biological Conservation, 91, 73±89.
Fuller, R.J., Gregory, R.D., Gibbons, D.W., Marchant,
J.H., Wilson, J.D., Baillie, S.R. & Carter, N. (1995)
Population declines and range contractions among
lowland farmland birds in Britain. Conservation Biol-
ogy, 9, 1425±1441.
Fuller, R.J., Marchant, J.H. & Morgan, R.A. (1985) How
representative of agricultural practice in Britain are
common birds census farmland plots? Bird Study, 32,
56±70.
Galbraith, H. (1988) E�ects of agriculture on the breeding
ecology of lapwings Vanellus vanellus. Journal of
Applied Ecology, 25, 487±503.
Gillings, S. & Fuller, R.J. (1998) Changes in bird popula-
tions on sample lowland English farms in relation to
loss of hedgerows and other non-crop habitats. Oecolo-
gia, 116, 120±127.
Gooch, S., Baillie, S.R. & Birkhead, T.R. (1991) Magpie
Pica pica and songbird populations, retrospective
investigation of trends in population density and
breeding success. Journal of Applied Ecology, 28, 1068±
1086.
Green, R.E. (1995) The decline of the corncrake Crex crex
in Britain continues. Bird Study, 42, 66±75.
Gregory, R.D. & Marchant, J.H. (1996) Population trends
of jays, magpies, jackdaws and carrion crows in the
United Kingdom. Bird Study, 43, 28±37.
Grigg, D. (1989) English Agriculture. An Historical Per-
spective. Blackwell Scienti®c Publications, Oxford,
UK.
Henderson, I.G., Cooper, J., Fuller, R.J. & Vickery, J.A.
(2000) The relative abundance of birds on set-aside
and neighbouring ®elds in summer. Journal of Applied
Ecology, 37, 335±347.
Henderson, I.G., Vickery, J.A. & Fuller, R.J. (2000) Sum-
mer bird abundance and distribution on set-aside ®elds
on intensive arable farms in southern England. Ecogra-
phy, 23, 50±59.
Hill, M.O. (1979) decorana: A fortran Program for
Detrended Correspondence Analysis and Reciprocal
Averaging. Section of Ecology and Systematics, Cornell
University, Ithaca, NY.
James, F.C. & McCulloch, C.E. (1990) Multivariate analy-
sis in community ecology and systematics: panacea or
Pandora's box? Annual Review of Ecology and Sys-
tematics, 21, 129±166.
Lock, L. (1999) Saving the cirl bunting 1/4 and lots more.
British Wildlife, 11, 17±22.
Marchant, J.H. & Gregory, R.D. (1994) Recent population
changes among seed-eating passerines in the United
Kingdom? Bird Numbers 1992. Distribution, Monitor-
ing and Ecological Aspects (eds W. Hagemeijer &
T. Verstrael), pp. 87±96. Proceedings of the 12th Inter-
national Conference of the International Bird Census
Council and European Ornithological Atlas Commit-
tee. International Bird Census Council and European
Ornithological Atlas Committee, Sovon, Beek-Ubber-
gen.
Marchant, J.H., Hudson, R., Carter, S.P. & Whittington,
P.A. (1990) Population Trends in British Breeding
Birds. British Trust for Ornithology, Tring, UK.
Newton, I. (1986) The Sparrowhawk. Poyser, Calton, UK.
Newton, I. (1993) Predation and limitation of bird num-
bers. Current Ornithology, 11, 143±194.
O'Connor, R.J. & Shrubb, M. (1986) Farming and Birds.
Cambridge University Press, Cambridge, UK.
Pannekoek, J. & van Strien, A.J., (1996) TRIM (Trends
and Indices for Monitoring Data). Statistics Nether-
lands, Voorburg, the Netherlands.
Potts, G.R. (1986) The Partridge: Pesticides, Predation and
Conservation. Collins, London, UK.
Redpath, S.M. & Thirgood, S.J. (1997) Birds of Prey and
Red Grouse. HMSO, London, UK.
Siriwardena, G.M., Baillie, S.R., Buckland, S.T., Fewster,
R.M., Marchant, J.H. & Wilson, J.D. (1998) Trends in
the abundance of farmland birds: a quantitative com-
parison of smoothed common birds census indices.
Journal of Applied Ecology, 35, 24±43.
Siriwardena, G.M., Baillie, S.R., Crick, H.P.Q. & Wilson,
J.D. (2000) The importance of variation in the breed-
ing performance of seed-eating birds in determining
their population trends on farmland. Journal of
Applied Ecology, 37, 128±148.
Siriwardena, G.M., Baillie, S.R. & Wilson, J.D. (1998)
Variation in the survival rates of some British passer-
ines with respect to their population trends on farm-
land. Bird Study, 45, 276±292.
Stoate, C. (1996) The changing face of lowland farming
and wildlife. II. 1945±1995. British Wildlife, 7, 162±
172.
Tapper, S.C., Potts, G.R. & Brockless, M.H. (1996) The
e�ect of an experimental reduction in predation pres-
sure on the breeding success and population density of
grey partridges Perdix perdix. Journal of Applied Ecol-
ogy, 33, 965±978.
Thomas, M.R. (1997) Review of Usage of Pesticides in
Agriculture and Horticulture Throughout Great Britain
1984±94. Pesticide Usage Report 100. MAFF, London,
UK.
Thomson, D.L., Green, R.E., Gregory, R.D. & Baillie,
S.R. (1998) The widespread declines of songbirds in
Britain do not correlate with the spread of avian pre-
dators. Proceedings of the Royal Society of London,
Series B, 265, 2057±2062.
Velleman, P.F. & Hoaglin, D.C. (1981) Applications, Basics
and Computing of Exploratory Data Analysis. Duxbury
Press, Boston, MA.
Wilkinson, M. (1997) A Review of Changes in Farm Man-
agement Practice Since 1970. ADAS Contract Report
to ITE. ADAS, Huntingdon, UK.
Wilson, J.D., Evans, J., Browne, S.J. & King, J.R. (1997)
Territory distribution and breeding success of skylarks
Alauda arvensis on organic and intensive farmland in
southern England. Journal of Applied Ecology, 34,
1462±1478.
Wilson, J.D., Taylor, R. & Muirhead, L.B. (1996) Field
use by farmland birds in winter: an analysis of ®eld
type preferences using resampling methods. Bird Study,
43, 320±332.
Received 10 March 1999; revision received 10 April 2000
788Agricultural
intensi®cation and
bird abundance
# 2000 British
Ecological Society
Journal of Applied
Ecology, 37,
771±788