changes in prudential policy instruments - a new cross
TRANSCRIPT

Changes in Prudential Policy Instruments—ANew Cross-Country Database∗
Eugenio Cerutti,a Ricardo Correa,b Elisabetta Fiorentino,c
and Esther Segallad
aInternational Monetary FundbFederal Reserve BoardcDeutsche Bundesbank
dOesterreichische Nationalbank
This paper documents a new database that focuses onchanges in the intensity in the usage of several widely usedprudential tools, taking into account both macroprudentialand microprudential objectives. The database coverage isbroad, spanning sixty-four countries, and with quarterly datafor the period 2000:Q1 through 2014:Q4. The five types ofprudential instruments in the database are capital buffers,interbank exposure limits, concentration limits, loan-to-value(LTV) ratio limits, and reserve requirements. A total of nineprudential tools are constructed since some useful further
∗This paper is part of the 2015 IBRN initiative on the domestic effects andinternational spillovers of prudential instruments. We would like to thank ClaudiaBuch, Stijn Claessens, Linda Goldberg, Claudia Jadrijevic, Steven Ongena, ananonymous referee, IBRN participants, IMF economists, and central banks andsupervisory authorities for their extremely valuable feedback on the constructionof the database. We also greatly appreciate the help provided by Calebe De Roure,Jacob Miller, and Marcus Pramor in the construction of the database. The viewsin this paper are solely the responsibility of the authors and should not be inter-preted as reflecting the views of the Board of Governors of the Federal ReserveSystem, the Deutsche Bundesbank, the International Monetary Fund, and theOesterreichische Nationalbank. The database on prudential instruments used inthe paper is available at http://www.newyorkfed.org/IBRN/index.html. Authorcontact: Cerutti: International Monetary Fund, 700 19th Street NW, Washing-ton, DC 20431, USA, [email protected]. Correa: Board of Governors of the FederalReserve System, 20th Street & C Street, NW, Washington, DC, 20551, USA,[email protected]. Fiorentino: Deutsche Bundesbank, Wilhelm-Epstein-Str.14, 60431, Frankfurt am Main, Germany, [email protected]: Oesterreichische Nationalbank, Otto-Wagner-Platz 3, A-1090 Vienna,Austria, [email protected].
477

478 International Journal of Central Banking March 2017
decompositions are presented, with capital buffers divided intofour sub-indexes: general capital requirements, specific capi-tal buffers related to real estate credit, specific capital buffersrelated to consumer credit, and other specific capital buffers;and with reserve requirements divided into two sub-indexes:domestic-currency capital requirements and foreign-currencycapital requirements. While general capital requirements havethe most changes from the cross-country perspective, LTVratio limits and reserve requirements have the largest num-ber of tightening and loosening episodes. We also analyze theinstruments’ usage in relation to the evolution of key variablessuch as credit, policy rates, and house prices, finding substan-tial differences in the patterns of loosening or tightening ofinstruments in relation to business and financial cycles.
JEL Codes: E43, E58, G18, G28.
1. Introduction
Prudential instruments involving the banking system are essentialin the policymaking toolkit to promote financial stability. Theyconstitute the tools most often used to implement both micropru-dential and macroprudential policies.1 A full distinction betweenthese two types of policies is blurry, and their differences are mostlybased on the particular perspective used (Crockett 2000; Borio 2003;Claessens 2015). Microprudential policy seeks to ensure the sound-ness of individual financial institutions, while macroprudential policyaims to contain systemic risks in the financial system as a whole.Independent of these objectives, which often intersect, there is aconsensus that having a systemwide perspective is a fundamentalattribute of a well-specified prudential regulatory framework (Inter-national Monetary Fund 2013). Such a prudential framework oftenseeks to increase the resilience of both individual firms and the finan-cial system to shocks (e.g., by building capital buffers); to containthe buildup of vulnerabilities over time (e.g., by reducing procyclical
1There are other instruments in the macroprudential toolkit, such as taxes,levies, and capital flow measurements. Nevertheless, most macroprudential toolsconsidered to date apply to the banking system, mainly given the presence ofmicroprudential regulatory tools that are easily adaptable and the more extensivetheoretical knowledge on these instruments.

Vol. 13 No. S1 Changes in Prudential Policy Instruments 479
feedback between asset prices and credit); and to control structuralvulnerabilities arising through interlinkages and the critical role ofindividual intermediaries in key markets that can render individualinstitutions “too big to fail.”
Prudential instruments have been used by a large number ofcountries with either microprudential or macroprudential objectives,but analyzing the effectiveness of these tools and their potentialunintended consequences (e.g., domestic and cross-border spillovers)is an undeveloped area at the international level, partly due tothe lack of detailed and consistent cross-country information onchanges—either loosening or tightening—in the use of prudentialinstruments. As part of the 2015 International Banking ResearchNetwork (IBRN) initiative, which examines domestic effects andinternational spillovers of changes in prudential instruments (seeBuch and Goldberg 2017), the main aim of this paper and its associ-ated database is to consistently document information on the cross-country usage of key prudential instruments during the 2000–14period, independently of the final microprudential or macropruden-tial objectives that authorities might have implicitly or explicitlyhad.2
In this context, our contribution to the literature is twofold. First,we compile a detailed and unique data set of widely used pruden-tial instruments covering the intensity in their usage over time insixty-four countries at a quarterly frequency. The five types of pru-dential instruments at the center of the database are capital buffers,interbank exposure limits, concentration limits, loan-to-value (LTV)ratio limits, and reserve requirements. A total of nine prudentialtools are constructed since we consider some useful breakdowns ofthe five types of prudential instruments analyzed (capital buffersinto four sub-indexes: general capital requirements, specific capitalbuffers related to real estate credit, specific capital buffers related toconsumer credit, and other specific capital buffers; and with reserverequirements divided into two sub-indexes: domestic-currency
2The 2015 initiative of the IBRN is a multi-study project on the domes-tic effects and international spillovers of prudential instruments, where teamsof researchers from fifteen central banks and two international organizationsused confidential micro-banking data and more precise measures of prudentialregulation to test their hypotheses.

480 International Journal of Central Banking March 2017
capital requirements and foreign-currency capital requirements).Second, we take advantage of these quarterly series and provide across-country view of their usage, taking also into account their cor-relation with key variables such as credit, policy rates, and houseprices. These statistics provide a valuable perspective on how coun-tries are effectively using prudential instruments through businessand financial cycles.
The selection of these five types of prudential instruments wasbased on the need to focus on the most widely used pruden-tial instruments across countries. Following Cerutti, Claessens, andLaeven (2015), which offers the largest coverage on the introductionof macroprudential tools within 119 countries during the 2000–13period, we selected concentration limits, reserve requirements, LTVratio limits, and interbank exposure limits, since they are the topfour instruments in terms of usage.3 In addition, since our objec-tive is to cover prudential instruments independent of their micro-prudential or macroprudential objective, we added capital buffers,a key instrument of modern bank regulation and also widely used(especially from a microprudential perspective).
The prudential database aggregates information from primarysources (e.g., central bank reports) and secondary sources (e.g.,the Global Macroprudential Policy Instruments [GMPI] surveyconducted by the International Monetary Fund [IMF] during2013). The sources used for each regulatory change are doc-umented in section 2 and in an online appendix available athttp://www.newyorkfed.org/IBRN/index.html. The resulting data-base provides a comprehensive, multi-country, longitudinal overviewof prudential policies at a quarterly frequency. Efforts to ensure theconsistency of the data set were the result of feedback receiveddirectly from country regulators on the accuracy of the policychanges recorded in the database.
3In Cerutti, Claessens, and Laeven (2015), an instrument is being used if it iswritten into a law or into regulatory rules. Their analysis shows that concentra-tion limits were used (in at least one year) in 64 percent of the 119 countries intheir sample, reserve requirements in 37 percent of the countries, and LTV ratiolimits and interbank exposure limits in 29 percent of the countries. The sametop four instruments are selected following their paper’s definition of use fre-quency (the ratio of country-years using a given instrument to the total numberof country-years using a macroprudential policy over the 2000–13 sample period).
Vol. 13 No. S1 Changes in Prudential Policy Instruments 481
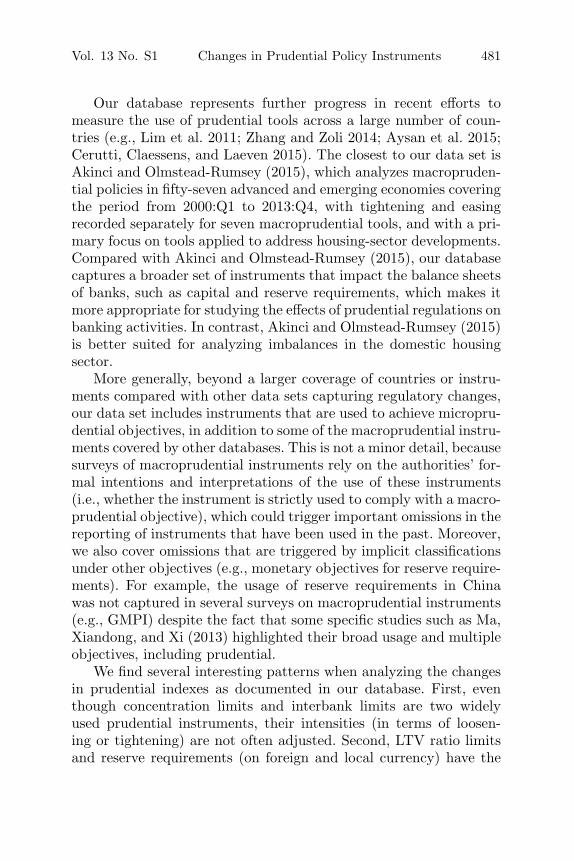
Our database represents further progress in recent efforts tomeasure the use of prudential tools across a large number of coun-tries (e.g., Lim et al. 2011; Zhang and Zoli 2014; Aysan et al. 2015;Cerutti, Claessens, and Laeven 2015). The closest to our data set isAkinci and Olmstead-Rumsey (2015), which analyzes macropruden-tial policies in fifty-seven advanced and emerging economies coveringthe period from 2000:Q1 to 2013:Q4, with tightening and easingrecorded separately for seven macroprudential tools, and with a pri-mary focus on tools applied to address housing-sector developments.Compared with Akinci and Olmstead-Rumsey (2015), our databasecaptures a broader set of instruments that impact the balance sheetsof banks, such as capital and reserve requirements, which makes itmore appropriate for studying the effects of prudential regulations onbanking activities. In contrast, Akinci and Olmstead-Rumsey (2015)is better suited for analyzing imbalances in the domestic housingsector.
More generally, beyond a larger coverage of countries or instru-ments compared with other data sets capturing regulatory changes,our data set includes instruments that are used to achieve micropru-dential objectives, in addition to some of the macroprudential instru-ments covered by other databases. This is not a minor detail, becausesurveys of macroprudential instruments rely on the authorities’ for-mal intentions and interpretations of the use of these instruments(i.e., whether the instrument is strictly used to comply with a macro-prudential objective), which could trigger important omissions in thereporting of instruments that have been used in the past. Moreover,we also cover omissions that are triggered by implicit classificationsunder other objectives (e.g., monetary objectives for reserve require-ments). For example, the usage of reserve requirements in Chinawas not captured in several surveys on macroprudential instruments(e.g., GMPI) despite the fact that some specific studies such as Ma,Xiandong, and Xi (2013) highlighted their broad usage and multipleobjectives, including prudential.
We find several interesting patterns when analyzing the changesin prudential indexes as documented in our database. First, eventhough concentration limits and interbank limits are two widelyused prudential instruments, their intensities (in terms of loosen-ing or tightening) are not often adjusted. Second, LTV ratio limitsand reserve requirements (on foreign and local currency) have the

482 International Journal of Central Banking March 2017
largest numbers of tightening and loosening episodes. Third, instru-ments linked to capital buffers, concentration limits, and interbankexposures have been used to achieve structural objectives, such ascreating capital buffers and lowering risks either with a micropru-dential or macroprudential perspective. Conditional on usage, thisobservation is supported by the low correlation between the changesin instrument intensity and key financial variables like credit, pol-icy rates, and house prices. Fourth, the correlations for LTV ratiolimits, and foreign- and local-currency reserve requirements, withcredit growth signals a countercyclical usage by authorities in mostcases. The correlations with respect to house prices are mostly notstatistically significant across most countries with available data,except for a few Asian countries. Last, the correlations of LTV ratiolimits and reserve requirements with countries’ policy interest ratesreveal heterogeneous policy actions across countries: many statisti-cally significant correlations indicate both complementarities andnon-complementarities between these prudential instruments andpolicy rates.
The rest of the paper is organized as follows. Section 2 documentsthe construction of the prudential instruments and the sources usedto code the changes in these indexes. Section 3 documents the vari-ation in the different prudential instruments over time and acrosscountries. Section 4 analyzes the usage of these prudential instru-ments in relation to the evolution of key variables such as credit,policy rates, and house prices. Section 5 concludes.
2. Description of the Database
The IBRN Prudential Instruments Database includes quarterlychanges for nine prudential policy indexes that have been usedby policymakers with some frequency across a sample of sixty-fourcountries during the period between 2000 and 2014.4 This sectionprovides a general description of the construction of the indexes, aswell as detailed information about each specific instrument.
4A list of the sixty-four countries included in the database is reported in table3 in the appendix. Out of these sixty-four countries, we have limited coverage forseven countries, which are highlighted in bold in table 3.
Vol. 13 No. S1 Changes in Prudential Policy Instruments 483
2.1 Construction of the Prudential Instrument Indexes
To construct the prudential policy indexes reported in the database,we use a method to map policy changes into simple indexes thathas recently been used in studies focusing on the intensity of capitalcontrols (Ahmed and Zlate 2014; Pasricha et al. 2015) and macropru-dential policies (Akinci and Olmstead-Rumsey 2015). Nine indexesare constructed for the five types of prudential instruments covered,and the indexes are presented in two ways. The first presentation ofindex data records the changes in a policy instrument with a 1 or–1 entry, depending on whether the prudential tool was tightenedor loosened in a given quarter. The index equals 0 in those quar-ters when no change occurs. The entries in the database for a giveninstrument are coded as missing if policymakers cannot use thatpolicy tool.5 An example of such a case is a country that has notenacted a rule to set LTV ratio limits; the index for this instrumentis coded as missing until such a rule is passed.
An advantage of this type of coding is that it can capture theintensity of a policy change while incorporating qualitative traitsfrom the policy that cannot be measured by a unique numericalstatistic. For example, in certain circumstances, policymakers maydecide to change LTV ratio limits on specific types of real estatetransactions while maintaining others unchanged. To fully measurethe intensity of such a change in the instrument as a single numer-ical statistic would require a weighted index of all LTV ratio limitsapplied to the different transactions. For this purpose, one wouldneed to have specific information on all types of real estate trans-actions. By recording the change with the discrete index describedabove, a policy change can simply be captured by entries of 1 and –1in the index. The intensity of the change, although captured imper-fectly by this index, measures the direction of the policy change.
For some policy instruments, we are able to record the intensityof the changes more precisely. This is the case for those instruments
5Observations are also coded as missing for a few countries without any infor-mation for the concentration and interbank exposure limits. We also record theentries for the general capital requirements index of seven countries, listed inbold in the appendix (table 3), as missing. This type of missing value is codeddifferently in the database from those that reflect the lack of availability of thepolicy instrument.

484 International Journal of Central Banking March 2017
that can be summarized by a single numerical indicator. An exam-ple of these instruments is reserve requirements on local- or foreign-currency deposits. Although there is some variation across countries,changes in reserve requirements can be captured by a single statistic(Cordella et al 2014; Federico, Vegh, and Vuletin 2014). Using thatstatistic, we use positive and negative integers to capture the inten-sity of the instrument’s change relative to the starting date, whichin the database is the first quarter of 2000.
Recording the intensity of the change in the policy instrumentallows us to produce a second class of index, which we call the “cumu-lative” index. In each quarter, the cumulative index is the sum, sincethe first quarter of 2000, of all changes in the policy index recordedprior to, and during, the quarter of interest. The purpose of thiscumulative index is to capture the level of “tightness” (“looseness”)of an instrument at a given point in time.
Although the properties of this index are appropriate for cap-turing the intensity of policy changes in a given country over time,they are not ideal for assessing differences in the policy stance acrosscountries. For example, the level of an instrument may be differentat the starting point in 2000 or the changes in the instruments mayhave different qualitative implications across countries, which maynot be captured by the index. Thus, the instrument indexes shouldbe used with caution when making cross-sectional comparisons withregards to the tightness (or looseness) of a particular instrument.
2.2 Sources of Information
We use a combination of primary and secondary sources to recordthe changes in the nine policy instruments included in the data-base. The starting point to determine these instruments’ changesis the GMPI survey (see Cerutti, Claessens, and Laeven 2015 fora description). This survey provides a comprehensive view of theset of macroprudential policies that have been used across a largesample of 125 countries.6 We also use primary information provideddirectly by national authorities either through the IBRN or the IMF
6Even though the GMPI survey included a question asking about the changesin the covered instruments from 2000 to 2013, the responses to these questions areto a large degree missing or incomplete, constituting one of the main challengesin our documentation not only on usage but also on the intensity of usage.

Vol. 13 No. S1 Changes in Prudential Policy Instruments 485
or our searches in national authorities’ web pages. We complementthese data with other secondary sources like the earlier IMF dataset compiled by Lim et al. (2011) and with information drawn fromother general databases that have been compiled in recent years byAkinci and Olmstead-Rumsey (2015), Kuttner and Shim (2013), andReinhardt and Sowerbutts (2015). Additionally, we also complementthis information with specific secondary sources of information thatapply to the different prudential instruments, as described in theonline appendix.
Lastly, one of the main contributions of the database is the par-ticipation of IBRN members in the process of constructing the data-base. All versions of the database were reviewed by staff from centralbanks participating in the IBRN to ensure its accuracy and com-pleteness. For instance, they provided information on instrumentchanges that were not recorded in the aforementioned databases, ornoted inaccuracies that were corrected. We also received valuablefeedback from country representatives who filled the GMPI surveythrough staff at the IMF.
2.3 Details on Specific Prudential Instruments
2.3.1 General Capital Requirements
The general capital requirements index is based on the regulatorychanges introduced in the Basel Accords through the four revisions:I, II, II.5, and III. The index takes a value of 1 when a capital regu-lation is implemented or tightened and 0 when no changes in capitalregulations take place. We assume that the implementation of theBasel Accords never loosens the existing regulation. Therefore, theindex never takes the value of –1. The main sources of information forthe implementation of the Basel II, II.5, and III agreements are theBasel Committee on Banking Supervision progress reports on mem-bers’ implementation and country supervision authorities’ websites.7
For those countries not covered by these publicly available sources,
7The Bank for International Settlements (BIS) sources are the “ProgressReport on Implementation of the Basel Regulatory Framework” (http://www.bis.org/bcbs/implementation.htm) and the “FSI Survey — Basel II, 2.5 and IIIImplementation” (http://www.bis.org/fsi/fsiop2015.htm).
486 International Journal of Central Banking March 2017
we directly submitted inquiries to the country authorities throughthe IBRN or IMF.
The capital requirements index records policy changes at thepoint in time when the law is implemented and not when it is passed.More importantly, we code the Basel I, II.5, and III agreements asa tightening (an entry equaling 1) of capital requirements, whereasBasel II is coded as neutral (an entry of 0). The decision to recordBasel II as not changing the intensity of capital requirements is basedon evidence that suggests that the introduction of this agreement didnot lead to a tightening nor a loosening of overall capital require-ment regulations.8 As stated by the Basel Committee, the objectiveof Basel II regarding the overall level of minimum capital require-ments was “to broadly maintain the aggregate level of minimumcapital requirements, while also providing incentives to adopt themore advanced risk-sensitive approaches of the revised framework”(Basel Committee on Banking Supervision 2006).
2.3.2 Sector-Specific Capital Buffers
The sector-specific capital buffer index is another bank-capital-basedindicator that captures regulatory changes that are aimed at cur-tailing the growth in bank claims to specific sectors of the economy.Changes in this type of prudential instrument usually take the formof adjustments to the risk weights of specific bank exposures, whichare tightened or loosened with the financial cycle.
We separately record changes for three categories of creditdepending on the borrower’s type, namely real estate credit, con-sumer credit, and other credit. The aggregate sector-specific capitalbuffer index is equal to the sum of prudential instrument changesacross the different types of credit. As such, the index can take onvalues greater or lower than 1 or –1 in a given quarter, which wouldsignal changes in the capital buffers for more than one sector at thesame time.
8For a detailed analysis of the quantitative impact of Basel II, see the FinancialStability Institute’s report titled “Results of the Fifth Quantitative Impact Study(QIS 5),” which can be found at http://www.bis.org/bcbs/qis/qis5results.pdf.

Vol. 13 No. S1 Changes in Prudential Policy Instruments 487
2.3.3 Reserve Requirements
Reserve requirements have typically been used as instruments to con-duct monetary policy. However, as noted by Cordella et al. (2014),these requirements have also been used as countercyclical macropru-dential tools by emerging economies. The GMPI survey explicitlyasked respondents whether they use this tool as a macroprudentialor monetary policy tool. We rely on this information to determinewhether changes in the instrument should be included in the data-base, which we complement with other sources if the GMPI doesnot report whether the country uses reserve requirements to achievemacroprudential objectives.
After we determine that reserve requirements are used in a coun-try to satisfy prudential objectives, we proceed to collect informationon the changes in these requirements over time. We separately collectinformation on changes in reserve requirements for deposit accountsdenominated in domestic and foreign currency. The principal sourcesof information to determine these policy changes are central banks’websites, the IMF’s Annual Report on Exchange Arrangements andExchange Restrictions (AREAER), and the database by Federico,Vegh, and Vuletin (2014).
Although reserve requirement ratios are typically reported as anumber, these requirements can apply to different types of accounts.For example, within deposit accounts, there may be several sub-categories, such as demand and savings accounts. Similarly, reserverequirement ratios may apply to deposits of different maturities. Weuse the numeric index defined earlier to capture the overall levelof reserve requirements within a broad category. Given the mostlyquantitative nature of this instrument, we also use numbers aboveor below 1 and –1 to record the intensity in the changes. As shownin figure 1, the cumulative index that records changes in reserverequirement ratios in China tracks the contour of the level of thisinstrument well. This is one of the strengths of the index, as it is ableto capture changes in these policies while at the same time implic-itly taking into account qualitative changes like the differentiatedtreatment of large, and small and medium depository institutions inmid-2008.

488 International Journal of Central Banking March 2017
Figure 1. Reserve Requirement Ratios andCumulative Index for China
05
1015
Cum
ulat
ive in
dex
(200
0q1=
0)
510
1520
25Pe
rcen
t
2000
q1
2002
q1
2004
q1
2006
q1
2008
q1
2010
q1
2012
q1
2014
q1
Reseve req. ratio for large depository institutions
Reseve req. ratio for small and medium depository institutions
Cumulative reserve req. (local currency) index [right axis]
2.3.4 Concentration Limits and Interbank Exposure Limits
Limits on concentrated exposures and on exposures to other banksare multifaceted policies that affect claims between banks and theirborrowers. As opposed to reserve requirement ratios, these limitscan be changed by modifying at least five elements that characterizethese exposures:
(i) The definition of large exposures: As defined by the BaselCommittee on Banking Supervision (2014), an exposureshould be classified as large if “the sum of all exposure val-ues of a bank to a counterparty or to a group of connectedcounterparties . . . is equal to or above 10% of the bank’s eli-gible capital base.” However, there are some differences in thespecific definitions across countries. For example, France char-acterizes large exposures as those representing 10 percent ofeligible capital of a bank or those with a value of more than300 million euros.
(ii) The level of the limit: The limit on these exposures may bedefined as a share of a bank’s capital or in monetary terms.These exposures are weighted by the appropriate risk weights.
(iii) Differentiation across counterparties: Weights on exposuresmay depend on the “riskiness” of the counterparty and theduration of the claims.

Vol. 13 No. S1 Changes in Prudential Policy Instruments 489
(iv) Aggregate limits: Banks may also face aggregate concentra-tion limits, totaled across all large exposures, which shouldnot exceed a threshold expressed as a share of eligible capital.
(v) Sectors and assets that are covered by the regulation: The reg-ulation may cover the exposures of depository institutions, orit may apply to a larger group, incorporating those of non-bank financial institutions. On the counterparty side, somesectors may be exempted from banks’ concentration limits. Inother cases, the definition of qualified assets that are countedtoward exposures limits may also change over time (e.g., inter-bank exposures).
These layers that encompass the concentration and interbankexposure limits require a careful assessment of the changes in thecharacteristics of these regulatory requirements over time. We useour index to record these changes using information from the GMPIsurvey. In the process, we rely on three assumptions to code thechanges. First, if multiple changes to the characteristics definedabove are implemented, we determine whether, on net, the policytightened or loosened these exposures limits. Second, if the rulesdetermining the concentration limits, including interbank exposures,are changed in a given quarter, we only code the change for concen-tration limits and not for interbank exposures. If the changes mostlyapply to interbank exposures, we only code a change for this index.Last, in cases when the authorities do not specify the exact quarter,within a year, when the policy changes were implemented, we usethe first quarter of that year as the date of implementation.
2.3.5 Loan-toValue Ratio Limits
LTV ratio limits, or caps, are restrictions on the maximum amountthat an individual or firm can borrow against their collateral. Themost common form of LTV cap is applied to real estate transactions.In this particular case, authorities may limit the amount that anindividual can borrow against the value of the property. The instru-ment is said to affect the demand for credit, as it applies to anytransactions covered by the policy regardless of the type of lender.
In our index, we record changes in LTV ratio limits that affectreal estate transactions. Changes in banks’ risk weights associated

490 International Journal of Central Banking March 2017
with LTV ratios are not considered since they do not necessarily con-strain the maximum borrowing capacity for borrowers. Nevertheless,two additional types of changes in maximum LTV ratio limits aretaken into account: (i) changes related to the maximum amountinsured in real estate transactions in Canada and Hong Kong; and(ii) changes in LTV regulations related to the maximum LTV allowedin covered bonds (Denmark and Finland). In those cases, althoughthe regulation does not directly target the characteristics of all theloans, the impact is broadly similar (e.g., covered bonds are the mainsource of mortgage funding in Nordic countries).
As is the case with reserve requirements, changes in LTV capscan be broadly tracked over time by following the evolution of thisnumeric variable. However, those changes can also affect subsamplesof the universe of mortgages, such as first residential purchases ormortgages on properties that fall in specific price ranges. For casesin which LTVs are tightened for specific types of transactions andloosened for others, we assess whether, on net, the policy changefalls in one category or the other and code it accordingly.
3. Usage of Prudential Policies
This section presents information on the changes recorded inthe indexes for the policy instruments described before, and fortheir subcomponents. The database contains information for fivetypes of prudential instruments and sixty-four countries. For twoof the instruments, we also calculate subcomponents. For thesector-specific capital buffers, we calculate indexes for buffers thatapply separately to real estate loans, consumer loans, and otherloans. Similarly, for reserve requirements, we calculate separateindexes for policy changes that apply to accounts denominated inforeign currency and domestic currency. Adding these subcompo-nents, the total number of prudential indexes increases to nine.
Table 1 presents information on the number of quarterly episodesrecorded in each of the nine indexes. As expected, in any given quar-ter most indexes do not change, which explains the large mass ofobservations at the value zero. LTV ratio limits and reserve require-ments (on foreign and local currency) have the largest numbersof tightening and loosening episodes. The index on general capitalrequirements differs from all the others because it only encompasses

Vol. 13 No. S1 Changes in Prudential Policy Instruments 491
Tab
le1.
Chan
ges
inth
eP
ruden
tial
Inst
rum
ent
Index
es
SSC
BLoa
n-t
o-R
eal
SSC
BSSC
BR
R:
RR
:V
alue
Gen
eral
Est
ate
Con
sum
erO
ther
Con
cent.
Inte
rban
kFor
eign
Loca
lR
atio
Cap
ital
Val
ue
Loa
ns
Loa
ns
Loa
ns
Lim
its
Expos
ure
sC
urr
ency
Curr
ency
Lim
its
Req
s.
–30
00
00
21
00
–20
01
00
88
00
–115
34
21
4115
725
00
3,78
73,
828
3,81
92,
023
1,10
03,
699
3,54
31,
201
3,32
01
389
1432
2485
126
7210
02
00
20
03
20
03
00
00
01
00
04
00
00
00
00
05
00
00
01
10
0Tot
al3,
840
3,84
03,
840
2,05
71,
125
3,84
03,
838
1,29
83,
420
Note
s:T
his
tabl
epr
esen
tsth
efr
eque
ncie
sof
non-
mis
sing
obse
rvat
ions
inth
epr
uden
tial
data
base
tabu
late
dby
inst
rum
ent
and
the
valu
eof
the
inde
xin
any
give
nqu
arte
r.SS
CB
stan
dsfo
rse
ctor
-spec
ific
capi
talbu
ffer
and
RR
stan
dsfo
rre
serv
ere
quir
emen
ts.W
eus
eal
lsu
bco
mpon
ents
ofth
ein
dexe
s,in
clud
ing
the
SSC
Bs
for
real
esta
te,co
nsum
er,an
dot
her
loan
s,an
dR
Rs
split
bet
wee
nth
ose
appl
ied
tolo
cal-
and
fore
ign-
curr
ency
depos
itac
coun
ts.
The
valu
e0
isco
ded
whe
na
give
npol
icy
inst
rum
ent
isno
tch
ange
din
aqu
arte
r.T
ight
enin
gep
isod
esar
ere
cord
edw
ith
pos
itiv
eva
lues
inth
ein
dex,
and
loos
enin
gep
isod
esar
ere
cord
edw
ith
nega
tive
valu
es.

492 International Journal of Central Banking March 2017
tightenings. These one-sided changes are explained by the way theindex is coded, which only incorporates information on the imple-mentation of the Basel Accords (these regulatory changes are codedas neutral or tightenings).
Note that the total number of episodes varies across instruments.As explained in the previous section, instruments that are not avail-able to policymakers due to the absence of legislation that authorizestheir use are coded as missing in the database. For some countries,instruments that are introduced during the sample period are codedas of the date the legislation to authorize them is passed. In thesecases, if the introduction of the instrument is considered a tighten-ing of the policy stance, it is coded as 1 in the index. There areother instances when the introduction of the instrument does notaffect the policy stance, such as introducing reserve requirementsand setting them at 0, which are coded as 0 in the index.
The information in table 2 reports the number of countries withpolicy changes in the sample period, as opposed to the numberof total episodes. As expected, most countries made changes tothe general capital requirements, as they adopted different versionsof the Basel Accords in the past fifteen years. Similarly, reserverequirements on local-currency accounts and LTV ratio limits areinstruments broadly used by countries in the sample, but in con-trast to capital requirements, these policy tools are both tightenedand loosened by many countries in the sample. On the other sideof the spectrum, we find that interbank exposures are only modi-fied by one-fifth of the sample, and most of these changes involve atightening.
As shown in these tables, the usage of prudential instrumentsvaries notably across the different types, both in the frequency ofchanges and in the direction of these changes. The use of pruden-tial instruments also changes markedly across the sample period.Figure 2 presents information on the number of countries tighten-ing or loosening three selected prudential policies in every quarterover the sample period. We focus on capital requirements, reserverequirements on local-currency deposits, and LTV ratio limits, someof the indexes with more variation or wider usage across countries.As noted previously, capital requirements are only shown to betightened during the sample period (graph A), which is explainedby the definition of the index. More importantly, those tightenings

Vol. 13 No. S1 Changes in Prudential Policy Instruments 493
Tab
le2.
Use
ofth
eP
ruden
tial
Inst
rum
ents
acro
ssC
ountr
ies
Dis
tinct
Cou
ntr
ies
wit
hC
ountr
ies
wit
hC
ountr
ies
wit
hC
ountr
ies
Inst
rum
ent
Tig
hte
nin
gLoos
enin
gw
ith
Chan
ges
Epis
odes
Epis
odes
Inst
rum
ent
SSC
BR
ealE
stat
eLoa
ns22
209
64SS
CB
Con
sum
erLoa
ns9
73
64SS
CB
Oth
erLoa
ns12
113
64C
once
ntra
tion
Lim
its
2221
236
Inte
rban
kE
xpos
ures
1413
122
RR
:Fo
reig
nC
urre
ncy
2120
1764
RR
:Loc
alC
urre
ncy
4629
4464
Loa
n-to
-Val
ueR
atio
Lim
its
3633
1438
Gen
eral
Cap
ital
Req
uire
men
ts55
550
57
Note
s:T
his
tabl
ere
por
tsin
form
atio
non
the
num
ber
ofco
untr
ies
with
pol
icy
chan
ges
for
each
inst
rum
ent.
The
data
base
cont
ains
ato
tal
ofsi
xty-
four
coun
trie
s.SS
CB
stan
dsfo
rse
ctor
-spec
ific
capi
tal
buffer
and
RR
stan
dsfo
rre
serv
ere
quir
emen
ts.
We
use
all
subco
mpon
ents
ofth
ein
dexe
s,in
clud
ing
the
SSC
Bs
for
real
esta
te,co
nsum
er,an
dot
her
loan
s,an
dR
Rs
split
bet
wee
nth
ose
appl
ied
tolo
cal-
and
fore
ign-
curr
ency
depos
itac
coun
ts.T
hela
stco
lum
nsh
ows
the
num
ber
ofco
untr
ies
with
acce
ssto
agi
ven
inst
rum
ent
atan
ypoi
ntin
tim
edu
ring
the
sam
ple
per
iod
orth
ose
coun
trie
sfo
rw
hich
we
have
any
info
rmat
ion.

494 International Journal of Central Banking March 2017
Figure 2. Changes in Prudential Instruments across Time0
1020
30N
umbe
r of c
ount
ries
2000
q1
2002
q1
2004
q1
2006
q1
2008
q1
2010
q1
2012
q1
2014
q1
A: General Capital Requirements
-4-2
02
46
Num
ber o
f cou
ntrie
s
2000
q1
2002
q1
2004
q1
2006
q1
2008
q1
2010
q1
2012
q1
2014
q1
C: LTV Ratio Limits
-20
-10
010
Num
ber o
f cou
ntrie
s
2000
q1
2002
q1
2004
q1
2006
q1
2008
q1
2010
q1
2012
q1
2014
q1
B: Reserve Requirements - Local Currency
are clustered after the global financial crisis, as regulators imple-mented the new requirements embedded in the Basel II.5 and IIIAccords. In contrast, reserve requirements (graph B) and LTV ratiolimits (graph C) exhibit changes throughout the sample period,with both tightenings and loosenings. In the case of reserve require-ments, there are two important loosening periods that coincidedwith the global financial crisis and the European sovereign debt cri-sis. LTV ratio limits were largely tightened after the global finan-cial crisis, perhaps as a result of loose monetary policies in severalcountries.
These patterns prompt several questions, especially about thereaction functions of regulators and supervisors to financial stabil-ity vulnerabilities and the use of prudential policies. Some instru-ments appear to be used more frequently and co-move with thefinancial cycle, while others are changed less often and perhaps asa reaction to financial crises. We explore these issues in the nextsection.

Vol. 13 No. S1 Changes in Prudential Policy Instruments 495
4. Cyclical or Countercyclical Usage?
This section analyzes whether changes in the usage of prudentialinstruments in each country are correlated with the evolution ofcredit growth, house prices, and policy rates. These correlationscannot fully reveal the underlying microprudential or macropru-dential emphasis used by the authorities (which could change overtime), but they offer an overview of the cyclicality of prudentialinstruments with respect to, for example, bank credit or houseprices.
In principle, if a prudential instrument is used with a macropru-dential intent, then, to some degree, we would expect a positive cor-relation between the intensity of this instrument and credit growth,indicating a countercyclical usage (e.g., tightening during high creditgrowth periods and loosening during low credit growth periods). Inaddition, the correlation of prudential instruments with respect tothe policy rate of each country offers some clues as to whether theusage of these financial stability tools has been complementary tothe monetary policy objectives, as captured by the evolution of thepolicy rate.
Figure 3 shows the distribution of the statistically significant cor-relations between the usage of prudential instruments and real creditgrowth in each country.9 These correlations are calculated based onthe cumulative index of seven prudential indexes presented in theprevious sections (with the three sector-specific capital buffers pre-sented as an aggregate) and real credit growth (annualized, usingthe most recent four quarters, and deflated using CPI inflation) fromseries produced by the Bank for International Settlements (BIS) andthe IMF International Financial Statistics (IFS).10 Countries thatregister some fluctuation in the usage of prudential instruments overtime are the only ones with correlations, so the number of correla-tions plotted varies across instruments. In the case of capital require-ments (Cap. Req.), it is possible to calculate correlations with credit
9Correlations are similar if we use nominal credit growth instead of real creditgrowth.
10Results are broken down into emerging markets (EM) and advancedeconomies (AE), following the IMF October 2015 World Economic Outlook(WEO) classification.

496 International Journal of Central Banking March 2017
Figure 3. Distribution of Correlations betweenIntensity Changes in Prudential Instruments and
Real Credit Growth
Note: Only statistically significant correlations at the 10 percent level or less areplotted.
growth for fifty-one countries, of which thirty-three are statisticallysignificant. Most of the distribution of these statistically significantcorrelations is clearly on the negative side (especially the distributionwithin the 25th and 75th percentiles that is captured by the boxes inthe standard box plot figure). This is driven by the fact that capitalrequirements are not frequently changed, and the timing of changesis linked with the implementation of Basel reforms that often happenafter crises or financial turmoil, coinciding with slowdowns in creditgrowth. The distribution of the correlations is more broadly dis-tributed in the case of the sector-specific capital buffer (Cap. SSB)than the general capital requirements (sixteen statistically signifi-cant correlations out of twenty-five available correlations), with themedian being slightly above zero for the EM and AE groupings.Despite being among the most widely used instruments (Cerutti,Claessens, and Laeven 2015), changes in the intensity of usage inthe concentration ratio (Conc. ratio) and interbank exposure (Inter-bank exp.) limits do not show many significant correlations with theevolution of credit growth. This result is not explained by the corre-lations being insignificant, but by the fact that the intensity in the

Vol. 13 No. S1 Changes in Prudential Policy Instruments 497
usage of these two instruments does not change for most countries(fourteen statistically significant correlations out of eighteen calcu-lated for concentration limits, and eight statistically significant outof eleven calculated for interbank exposure limits). Moreover, mostof these statistically significant correlations are for EMs, and thedistribution of correlations is broadly across positive and negativevalues. Therefore, this evidence suggests that instruments linked tocapital buffers, concentration limits, and interbank exposure lim-its are used with more structural objectives in mind (e.g., creat-ing capital buffers, and lowering risks either with a microprudentialor macroprudential perspective), instead of business or credit cycleconsiderations.
In contrast, the correlations for the LTV ratio limits (LTV cap)and foreign-currency (RR foreign) and local-currency (RR local)reserve requirements with credit growth signal a countercyclicalusage in most cases. The correlations of the local-currency reserverequirement index (twenty-six statistically significant correlationsout of thirty-nine calculated) are positive for both emerging marketsand advanced economies. With the exception of Argentina, thereare nine emerging markets (Hungary, Croatia, Ukraine, Romania,Philippines, Lithuania, Peru, Brazil, and Turkey) with signifi-cant positive correlations. The results are similar for the index offoreign-currency reserve requirements in emerging markets (eightstatistically significant correlations out of fourteen calculated; thesecountries are Romania, Argentina, Peru, Chile, Russia, Colombia,Brazil, and Croatia, which is an outlier on the negative side).These results are in line with those presented in the related lit-erature. For example, Federico, Vegh, and Vuletin (2014) find apositive correlation between the evolution of reserve requirementsand countries’ real GDP growth. Although not expected, there arefourteen advanced economies with local-currency reserve require-ments that exhibit positive and significant correlations (such as Italy,Spain, Portugal, Greece, Singapore, Netherlands, Slovenia, France,etc.).11 Foreign-currency reserve requirements appear to be irrele-vant in advanced economies, with only three calculated correlations,of which only one (Slovakia) is statistically significant.
11For euro-area countries, reserve requirements ratios are determined by theEuropean Central Bank.

498 International Journal of Central Banking March 2017
Figure 4. Distribution of Correlations between IntensityChanges in LTV Ratio Limits and House Prices
Note: Only statistically significant correlations at the 10 percent level or less areplotted.
The correlations between LTV ratio limits and credit growth(there are seventeen statistically significant correlations out oftwenty-one calculated) suggest that some advanced economies haveused this instrument more countercyclically. Several countries havepositive correlations with respect to credit growth (Spain, Nor-way, Denmark, Singapore, Iceland, Luxembourg, Hong Kong, andCanada), with the only exceptions being Korea and the Netherlands.As highlighted in the literature (Cerutti, Claessens, and Laeven2015), the effect of LTV ratio limits on house prices is not clearlyspecified on average across countries. This is also visible in figure 4for AEs, where the statistically significant correlations between LTVratio limits and house prices are above and below zero.12
12The positive significant correlations between LTV ratio limits and houseprices are mostly from Asia (e.g., Hong Kong, South Korea, Malaysia, and India).This correlation captures the effect of lending standards on house prices, and is
Vol. 13 No. S1 Changes in Prudential Policy Instruments 499
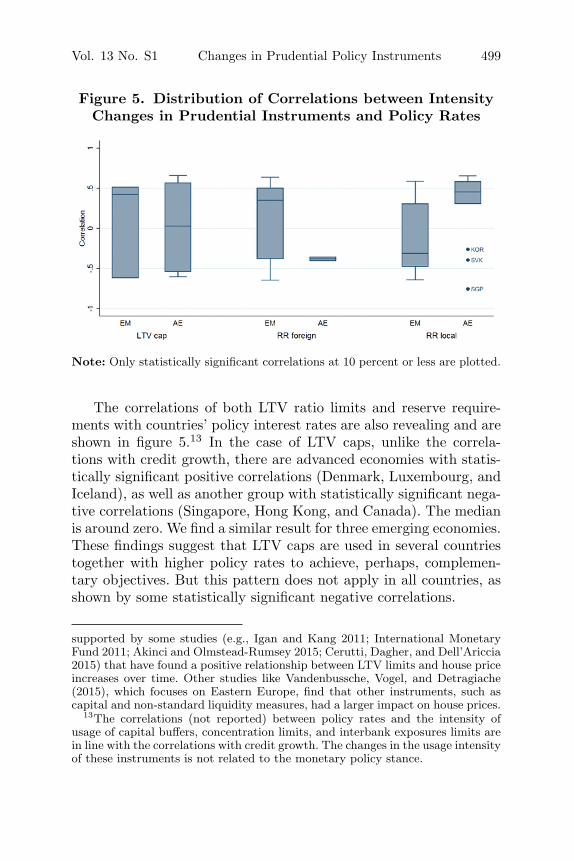
Figure 5. Distribution of Correlations between IntensityChanges in Prudential Instruments and Policy Rates
Note: Only statistically significant correlations at 10 percent or less are plotted.
The correlations of both LTV ratio limits and reserve require-ments with countries’ policy interest rates are also revealing and areshown in figure 5.13 In the case of LTV caps, unlike the correla-tions with credit growth, there are advanced economies with statis-tically significant positive correlations (Denmark, Luxembourg, andIceland), as well as another group with statistically significant nega-tive correlations (Singapore, Hong Kong, and Canada). The medianis around zero. We find a similar result for three emerging economies.These findings suggest that LTV caps are used in several countriestogether with higher policy rates to achieve, perhaps, complemen-tary objectives. But this pattern does not apply in all countries, asshown by some statistically significant negative correlations.
supported by some studies (e.g., Igan and Kang 2011; International MonetaryFund 2011; Akinci and Olmstead-Rumsey 2015; Cerutti, Dagher, and Dell’Ariccia2015) that have found a positive relationship between LTV limits and house priceincreases over time. Other studies like Vandenbussche, Vogel, and Detragiache(2015), which focuses on Eastern Europe, find that other instruments, such ascapital and non-standard liquidity measures, had a larger impact on house prices.
13The correlations (not reported) between policy rates and the intensity ofusage of capital buffers, concentration limits, and interbank exposures limits arein line with the correlations with credit growth. The changes in the usage intensityof these instruments is not related to the monetary policy stance.

500 International Journal of Central Banking March 2017
In the case of reserve requirements, many EMs appear to usethis instrument, especially for local-currency accounts, as a way to(at least partially) offset the effects of changes in the policy rate(for example, India, Argentina, the Philippines, China, and Bulgariahave negative and significant correlations between reserve require-ments and policy rates). However, we find the opposite pattern ina smaller group of countries, since Romania, Poland, and Lithua-nia display statistically significant positive correlations. Amongadvanced economies, changes in local-currency reserve requirementsare positively correlated with policy rates in ten countries (all mem-bers of the euro area), showing that in most cases, changes inlocal-currency reserve requirements and policy rates were used ascomplementary policies.
5. Conclusions
We have compiled and documented a unique data set measuringchanges in the intensity of use for nine widely used prudentialtools, covering a large sample of sixty-four countries over the periodbetween 2000:Q1 and 2014:Q4. We find that LTV caps and reserverequirements (on foreign and local currency) have the largest num-ber of tightening and loosening episodes. We also provide evidencerelated to the correlations between changes in prudential instru-ments and key financial variables such as credit, policy rates, andhouse prices. Changes in capital buffers, concentration limits, andinterbank exposures are aimed at achieving more structural objec-tives, such as enhancing the resilience of the banking sector, andlowering risks either with a microprudential or macroprudential per-spective. In contrast, we show that the use of LTV ratio limits andforeign and local-currency reserve requirements appear more consis-tent with countercyclical policy objectives in most cases, but withsome important heterogeneity across countries. Lastly, some of ourtests indicate complementary and non-complementary interactionsbetween a few of the prudential policy instruments and monetarypolicy rates.
As part of the initiative of the IBRN on cross-border pruden-tial policy spillovers, which consisted of a research project involv-ing multiple countries and international organizations, the data setdocumented in this paper makes a clear contribution. While this

Vol. 13 No. S1 Changes in Prudential Policy Instruments 501
database is used across all of the studies of that initiative, and helpsinform the analysis of the effectiveness of prudential instruments andtheir potential unintended consequences at the international level,the database has much broader relevance. Given the unique natureof the data set, it will further provide a service to future analysesin the research and policy communities on the use and the effective-ness of microprudential and macroprudential policies toward eithercontrolling credit growth or increasing the resilience of the financialsector.
Appendix
Table 3. List of Countries
Argentina Germany Malaysia SingaporeAustralia Greece Malta Slovak RepublicAustria Hong Kong Mexico SloveniaBelgium Hungary Mongolia South AfricaBrazil Iceland Netherlands South KoreaBulgaria India New Zealand SpainCanada Indonesia Nigeria SwedenChile Ireland Norway SwitzerlandChina Israel Peru TaiwanColombia Italy Philippines ThailandCroatia Japan Poland TurkeyCzech Republic Kuwait Portugal UkraineDenmark Latvia Romania United KingdomEstonia Lebanon Russian Federation United StatesFinland Lithuania Saudi Arabia UruguayFrance Luxembourg Serbia Vietnam
Note: Countries with limited information are in bold font.
References
Ahmed, S., and A. Zlate. 2014. “Capital Flows to Emerging Mar-ket Economies: A Brave New World?” Journal of InternationalMoney and Finance 48 (Part B): 221–48.
Akinci, O., and J. Olmstead-Rumsey. 2015. “How Effectiveare Macroprudential Policies? An Empirical Investigation.”
502 International Journal of Central Banking March 2017
International Finance Discussion Paper No. 1136 (May), Boardof Governors of the Federal Reserve System.
Aysan, A. F., S. Fendolu, M. Kılınc, and S. Yıldız. 2015. “CreditCycles and Capital Flows: Effectiveness of Macroprudential Pol-icy Framework in Emerging Countries.” Mimeo, Central Bank ofTurkey.
Basel Committee on Banking Supervision. 2006. “International Con-vergence of Capital Measurement and Capital Standards: ARevised Framework Comprehensive Version.” June. Available athttp://www.bis.org/publ/bcbs128.pdf.
———. 2014. “Supervisory Framework for Measuring and Control-ling Large Exposures.” April. Available at http://www.bis.org/publ/bcbs283.pdf.
Borio, C. 2003. “Towards a Macroprudential Framework for Finan-cial Supervision and Regulation?” BIS Working Paper No. 128(February).
Buch, C., and L. Goldberg. 2017. “Cross-Border Prudential Pol-icy Spillovers: How Much? How Important? Evidence from theInternational Banking Research Network.” International Journalof Central Banking 13 (S1).
Cerutti, E., S. Claessens, and L. Laeven. 2015. “The Use and Effec-tiveness of Macroprudential Policies: New Evidence.” Forthcom-ing in Journal of Financial Stability.
Cerutti, E., J. Dagher, and G. Dell’Ariccia. 2015. “Housing Financeand Real-Estate Booms: A Cross-Country Perspective.” IMFStaff Discussion Note No. 15/12.
Claessens, S. 2015. “An Overview of Macroprudential Policy Tools.”Annual Review of Financial Economics 7: 397–422.
Cordella, T., P. Federico, C. Vegh, and G. Vuletin. 2014. “ReserveRequirements in the Brave Macroprudential World.” Pol-icy Research Working Paper No. 6793 (February), WorldBank.
Crockett, A. 2000. “Marrying the Micro- and Macro-prudentialDimensions of Financial Stability.” Speech given at the EleventhInternational Conference of Banking Supervisors, Basel, Switzer-land, September 21.
Federico, P., C. Vegh, and G. Vuletin. 2014. “Reserve Require-ment Policy over the Business Cycle.” NBER Working PaperNo. 20612.

Vol. 13 No. S1 Changes in Prudential Policy Instruments 503
Igan, D., and H. Kang. 2011. “Do Loan-to-Value and Debt-to-IncomeLimits Work? Evidence from Korea.” IMF Working Paper No.11/297.
International Monetary Fund. 2011. “Housing Finance and FinancialStability—Back to Basics?” In Global Financial Stability Report:Durable Financial Stability: Getting There from Here, April, 111–57 (chapter 3). Washington, DC: International Monetary Fund.
———. 2013. “Key Aspects of Macroprudential Policy.” IMF PolicyPaper (June 10).
Kuttner, K. N., and I. Shim. 2013. “Can Non-interest Rate Poli-cies Stabilise Housing Markets? Evidence from a Panel of 57Economies.” BIS Working Paper No. 433.
Lim, C. H., F. Columba, A. Costa, P. Kongsamut, A. Otani, M.Saiyid, T. Wezel, and X. Wu. 2011. “Macroprudential Policy:What Instruments and How to Use Them? Lessons from CountryExperiences.” IMF Working Paper No. 11/238.
Ma, G., Y. Xiandong, and L. Xi. 2013. “China’s Evolving ReserveRequirements.” Journal of Chinese Economic and BusinessStudies 11 (2): 117–37.
Pasricha, G., M. Falagiarda, M. Bijsterbosch, and J. Aizenman.2015. “Domestic and Multilateral Effects of Capital Controls inEmerging Markets.” NBER Working Paper No. 20822.
Reinhardt, D., and R. Sowerbutts. 2015. “Regulatory Arbitrage inAction: Evidence from Banking Flows and Macroprudential Pol-icy.” Staff Working Paper No. 546, Bank of England (September).
Vandenbussche, J., U. Vogel, and E. Detragiache. 2015. “Macropru-dential Policies and Housing Prices: A New Database and Empir-ical Evidence for Central, Eastern, and Southeastern Europe.”Journal of Money, Credit and Banking 47 (1): 343–77.
Zhang, L., and E. Zoli. 2014. “Leaning Against the Wind: Macro-prudential Policy in Asia.” IMF Working Paper No. 14/22.