change in maternal and newborn health care
TRANSCRIPT
Interactions between families and frontline workers – their frequency, quality, and equity – and coverage of interventions for mothers and newborns
Change in maternal and newborn health care
MAY 2016Report from Gombe State, Nigeria, 2012-2015
© Society Family Health
© Society Family Health
© Nasir Umar
© Save the Children
xxxx
2 • Change in maternal and newborn health care
95% CI 95% confidence intervalDHS Demographic and
Health SurveyFOMWAN Federation of Muslim
Women’s Associations in Nigeria
IDEAS Informed Decisions for Action in maternal and newborn health
MNH Maternal and newborn health
PHC Primary Health Centre
Abbreviations and acronyms
2 • Change in maternal and newborn health care
This report is one of three country-specific reports on change in maternal and newborn health care between 2012-2015, and is based on research findings from Gombe State, Nigeria
Acknowledgements
This publication was written by Tanya Marchant and produced by the IDEAS project led by Professor Joanna Schellenberg at the London School of Hygiene & Tropical Medicine.
The IDEAS team wishes to acknowledge the work of Health Hub Ltd and Data Research and Mapping Consult Ltd. who implemented the surveys in 2012 and 2015 respectively, and the cooperation and contributions by the implementing partners in the state, Society for Family Health and PACT throughout the development and implementation process. We are also grateful to state officials in Gombe for their input and support, and to all households, facilities and individuals surveyed.
ISBN number: 978-0-9576834-3-3© London School of Hygiene & Tropical MedicineFunded by the Bill & Melinda Gates FoundationCoordination of publication: Rhys Williams
© iStockPhoto

Report from Gombe State, Nigeria • 3
Executive summary
Contents
Acknowledgements ......................... 02
Abbreviations and acronyms ............. 02
Executive summary ......................... 03
Chapter 1: Introduction and background .............................. 05
Chapter 2: Methodology .................. 09
Chapter 3: Characteristics of the health facilities surveyed ........ 13
Chapter 4: Characteristics of frontline workers interviewed ........ 14
Chapter 5: Characteristics of households and women interviewed .. 15
Chapter 6: Frontline worker contact with families in the community ......... 16
Chapter 7: Results on expected improvements ................................ 17
Chapter 8: Discussion ..................... 20
Annex 1: Long list of indicators for maternal and newborn health ...... 23
Executive summary
Background and methodsThe IDEAS study of interactions between families and frontline workers and coverage of critical interventions for mothers and newborns was conducted between June 2012 and June 2015 in Gombe State, Nigeria. In the context of Gombe State at this time, frontline workers included traditional birth attendants and the Federation of Muslim Women’s Association in Nigeria working in communities, junior community health extension workers and community health officers working between primary health facilities and communities, and auxiliary nurse midwives, nurses and doctors working in primary health facilities.
The aim was to estimate changes in maternal and newborn health care in areas where Bill & Melinda Gates Foundation implementation projects were operating. In Gombe State in 2012, when the study methods were defined, this included a learning grant awarded to the Society for Family Health in 2009 to test innovations for enhancing interactions, and a new grant 2012-2015 to scale-up a set of refined innovations across the state.
The study design was to collect data in 2012 and 2015 for an analysis of change over time. A representative sample of clusters (enumeration areas) was taken from across Gombe State and a population-level household survey was carried out to interview women with a birth in the 12 months preceding survey. In addition, in each cluster the frontline workers and primary health facilities providing maternal and newborn health services to surveyed households.
Because of adjustments to the funding strategy in 2015, and to prepare for future evaluation work in the state, the number of sampled clusters was doubled in 2015. In 2012, 40 clusters were sampled and 1,844 households and 349 women with a recent birth were interviewed. In 2015, 80 clusters were sampled and 5,939 households and 1,100 women with a recent birth were interviewed. For the same clusters, 61 frontline workers and 25 primary health facilities were surveyed
in 2012, 292 frontline workers and 106 health facilities in 2015.
Mapping evaluation of change to expected effectsThe main body of the report focuses on change in indicators that were expected to improve as a result of the specific implementation activities in place in the study area. These largely represent demand side behaviours rather than supply side actions. An expanded list of indicators is included in the Annex for a more comprehensive picture of maternal and newborn health care in the study area.
Evidence of changeSome targeted indicators of intervention coverage improved between the surveys, but access to routine care did not change.
There was no evidence of change in the frequency of routine interactions across the continuum of care from pregnancy to early newborn period. Among women with a live birth 12 months prior to survey, 60% had at least one antenatal care visit, 29% delivered in a health facility, 10% had postnatal care for herself and 7% reported that their newborn had a health check. The content of routine antenatal care, defined by seven core components of focussed antenatal care, did improve – driven by increases in the number of women having blood tests, urine tests, and receiving counselling during pregnancy. There was no evidence that the quality of delivery or postnatal care improved. Importantly, large inequities in access persisted, with women in the poorest households having the least health care at each point. But even the least poor families continued to receive very little care after birth.
More positively, the innovations were also targeting access to emergency care and there was evidence that this had improved for emergency events around the time of birth, with the number of women advised to seek extra care who actually did seek extra care doubling between survey years from 25% in 2012 to 55% in 2015.
Large inequities in access persist, with women in the
poorest households having the least health care at each point.
4 • Change in maternal and newborn health care
Executive summary
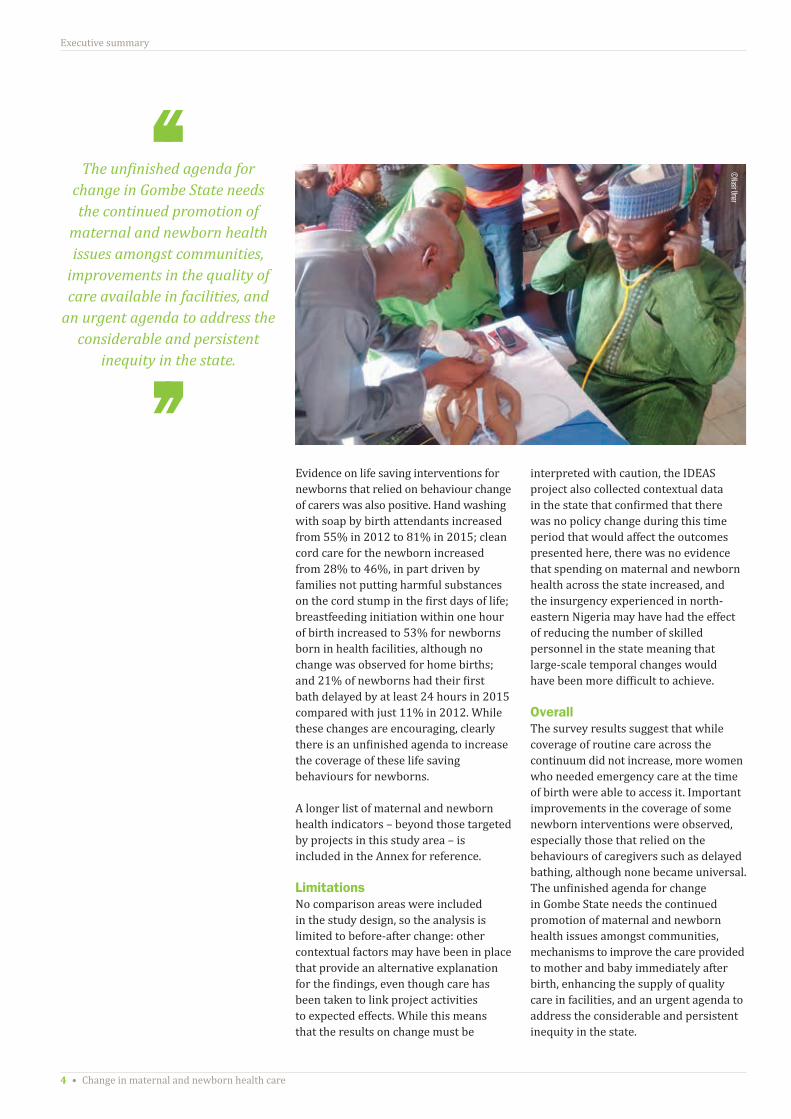
Evidence on life saving interventions for newborns that relied on behaviour change of carers was also positive. Hand washing with soap by birth attendants increased from 55% in 2012 to 81% in 2015; clean cord care for the newborn increased from 28% to 46%, in part driven by families not putting harmful substances on the cord stump in the first days of life; breastfeeding initiation within one hour of birth increased to 53% for newborns born in health facilities, although no change was observed for home births; and 21% of newborns had their first bath delayed by at least 24 hours in 2015 compared with just 11% in 2012. While these changes are encouraging, clearly there is an unfinished agenda to increase the coverage of these life saving behaviours for newborns.
A longer list of maternal and newborn health indicators – beyond those targeted by projects in this study area – is included in the Annex for reference.
LimitationsNo comparison areas were included in the study design, so the analysis is limited to before-after change: other contextual factors may have been in place that provide an alternative explanation for the findings, even though care has been taken to link project activities to expected effects. While this means that the results on change must be
interpreted with caution, the IDEAS project also collected contextual data in the state that confirmed that there was no policy change during this time period that would affect the outcomes presented here, there was no evidence that spending on maternal and newborn health across the state increased, and the insurgency experienced in north-eastern Nigeria may have had the effect of reducing the number of skilled personnel in the state meaning that large-scale temporal changes would have been more difficult to achieve.
OverallThe survey results suggest that while coverage of routine care across the continuum did not increase, more women who needed emergency care at the time of birth were able to access it. Important improvements in the coverage of some newborn interventions were observed, especially those that relied on the behaviours of caregivers such as delayed bathing, although none became universal. The unfinished agenda for change in Gombe State needs the continued promotion of maternal and newborn health issues amongst communities, mechanisms to improve the care provided to mother and baby immediately after birth, enhancing the supply of quality care in facilities, and an urgent agenda to address the considerable and persistent inequity in the state.
The unfinished agenda for change in Gombe State needs the continued promotion of
maternal and newborn health issues amongst communities,
improvements in the quality of care available in facilities, and
an urgent agenda to address the considerable and persistent
inequity in the state.
©Nasir Umar
Report from Gombe State, Nigeria • 5
Chapter 1
1.1: Maternal and newborn health profile in Gombe StateMaternal and newborn mortality in Nigeria is among the highest in the world. In 2015 there were an estimated 58,000 maternal deaths in the country.1 In 2015 the maternal mortality ratio (number of maternal deaths during a given time period per 100,000 live births during the same time period) was estimated to be 560 maternal deaths for every 100,000 live births, above the 300/100,000 Millennium Development Goal target. Child mortality also remained high by the end of the Millennium Development Goal era, with 109 child deaths per 1,000 live births in 2015 (above the target 71/1,000).2 Consistent with this, neonatal mortality is persistently high, estimated at 34 deaths per 1,000 live births.2 Beyond these national level statistics there is considerable geographical inequality, with the north-eastern and north-western states understood to have worse health outcomes than other parts of the country, although mortality data disaggregated to state level remains scarce.3
1.2: The context of this investigationThe work fits into a broad portfolio of investigation by the IDEAS project – Informed Decisions for Actions in Maternal and Newborn Health4 – based at the London School of Hygiene & Tropical Medicine and funded by the Bill & Melinda
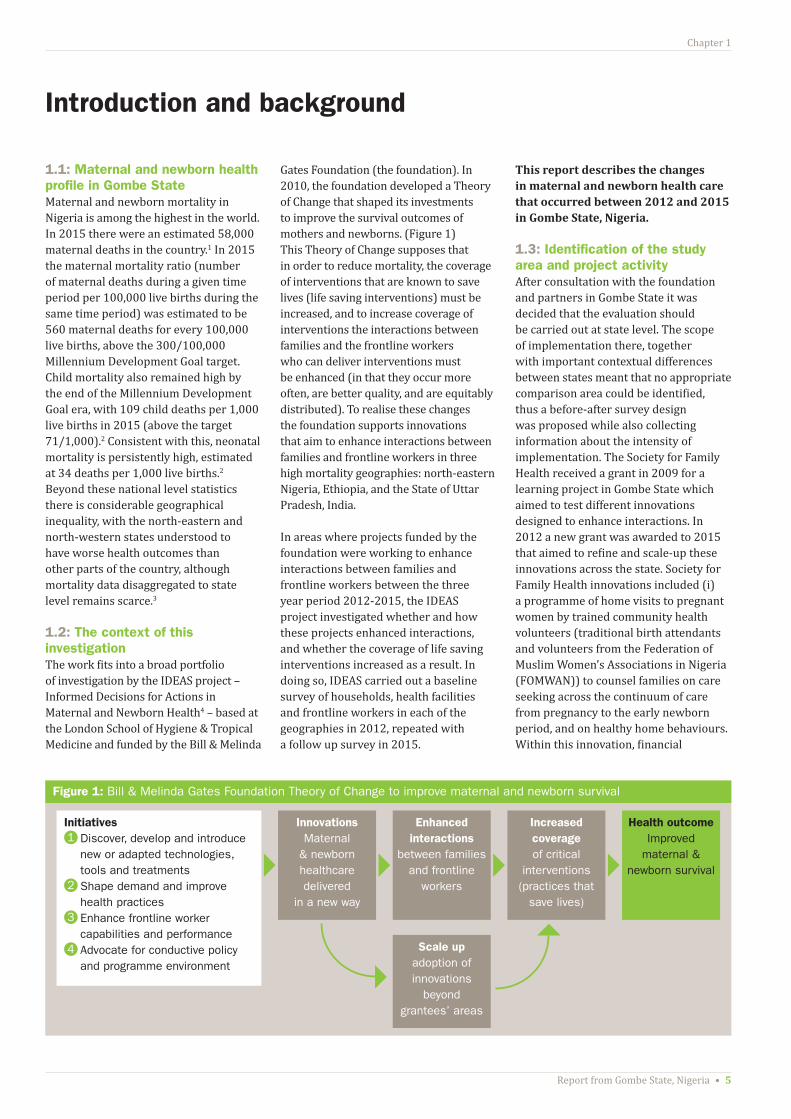
Gates Foundation (the foundation). In 2010, the foundation developed a Theory of Change that shaped its investments to improve the survival outcomes of mothers and newborns. (Figure 1) This Theory of Change supposes that in order to reduce mortality, the coverage of interventions that are known to save lives (life saving interventions) must be increased, and to increase coverage of interventions the interactions between families and the frontline workers who can deliver interventions must be enhanced (in that they occur more often, are better quality, and are equitably distributed). To realise these changes the foundation supports innovations that aim to enhance interactions between families and frontline workers in three high mortality geographies: north-eastern Nigeria, Ethiopia, and the State of Uttar Pradesh, India.
In areas where projects funded by the foundation were working to enhance interactions between families and frontline workers between the three year period 2012-2015, the IDEAS project investigated whether and how these projects enhanced interactions, and whether the coverage of life saving interventions increased as a result. In doing so, IDEAS carried out a baseline survey of households, health facilities and frontline workers in each of the geographies in 2012, repeated with a follow up survey in 2015.
This report describes the changes in maternal and newborn health care that occurred between 2012 and 2015 in Gombe State, Nigeria.
1.3: Identification of the study area and project activityAfter consultation with the foundation and partners in Gombe State it was decided that the evaluation should be carried out at state level. The scope of implementation there, together with important contextual differences between states meant that no appropriate comparison area could be identified, thus a before-after survey design was proposed while also collecting information about the intensity of implementation. The Society for Family Health received a grant in 2009 for a learning project in Gombe State which aimed to test different innovations designed to enhance interactions. In 2012 a new grant was awarded to 2015 that aimed to refine and scale-up these innovations across the state. Society for Family Health innovations included (i) a programme of home visits to pregnant women by trained community health volunteers (traditional birth attendants and volunteers from the Federation of Muslim Women’s Associations in Nigeria (FOMWAN)) to counsel families on care seeking across the continuum of care from pregnancy to the early newborn period, and on healthy home behaviours. Within this innovation, financial
Introduction and background
Figure 1: Bill & Melinda Gates Foundation Theory of Change to improve maternal and newborn survival
Initiatives1 Discover, develop and introduce
new or adapted technologies, tools and treatments
2 Shape demand and improve health practices
3 Enhance frontline worker capabilities and performance
4 Advocate for conductive policy and programme environment
InnovationsMaternal
& newborn healthcare delivered
in a new way
Enhanced interactions
between families and frontline
workers
Scale upadoption of innovations
beyond grantees’ areas
Increased coverage of critical
interventions (practices that
save lives)
Health outcomeImproved
maternal & newborn survival

6 • Change in maternal and newborn health care
Chapter 1
incentives were provided to volunteers for their contacts with families, and mothers-in-law and men were also targeted for advocacy purposes; (ii) a Call Centre to provide families with advice about maternal and newborn health care in the state; (iii) an Emergency Transport Scheme to provide free transport to health facilities in the event of a medical emergency; (iv) limited upgrading of primary health care facilities. Towards the end of this period PACT also received a grant from the foundation to strengthen the management and coordination of frontline worker organisations in Gombe, but that grant did not operate at the community level and so is not included here.
Further details about the work of these projects can be found on the IDEAS website.
1.4: Characterising the innovationsTypical of complex interventions, multiple innovations were present, and each innovation was expected to effect change on different outcomes along the pathway to improved maternal and newborn survival. In order to align measurement of change with the innovations in place, a characterisation process was undertaken by IDEAS in collaboration with the project leaders to identify the individual innovations, their mode of action and the expected improvements. Expected improvements were further categorised as those hypothesised to arise as a direct or indirect result of innovations. A summary of the expected direct improvements is presented in Table 1.
The main body of this report focuses on results mapped to these expected direct improvements. Additional results on maternal and newborn health care are presented in the Annex for information.
1. Trends in maternal mortality: 1990 to 2015. WHO, UNICEF, UNFPA, World Bank Group and the United Nations Population Division estimates. Available at http://apps.who.int/iris/bitstream/10665/194254/1/9789241565141_eng.pdf?ua=1
2. http://www.countdown2015mnch.org/documents/2015Report/Nigeria_2015.pdf 3. http://www.unicef.org/nigeria/children_1926.html (last accessed 18 May 2016)4. http://ideas.lshtm.ac.uk/
Table 1: Expected improvements in interactions and coverage of life saving interventions arising from innovations implemented by the Society for Family Health in Gombe State, 2012-2015
Expected improvement
Frequency of interactions
Antenatal care 4
Institutional delivery 4
Postnatal care for the mother 4
Postnatal care for the newborn 4
Quality of interactions
Timing Antenatal care 4
Intrapartum care 4
Postnatal care for the mother 4
Postnatal care for the newborn 4
Content Antenatal care 4
Intrapartum care 4
Postnatal care for the mother 4
Postnatal care for the newborn 4
Knowledge of danger signs 4
Facility readiness (equipment/ infrastructure) 4
Equity of interactions
Antenatal care 4
Intrapartum care 4
Postnatal care for the mother 4
Postnatal care for the newborn 4
Life saving interventions
Hand washing with soap by delivery attendant 4
Use of gloves by delivery attendant 4
Hygienic cord and skin care 4
Initiation of early breastfeeding 4
Exclusive breastfeeding for six months 4
Delayed bathing ≥24 hours of life (thermal care) 4

xxxx
Report from Gombe State, Nigeria • 7
© iStockPhoto

xxxx
8 • Change in maternal and newborn health care
© Tanya Marchant
Report from Gombe State, Nigeria • 9
Chapter 2
2.1: TimelineThe surveys were implemented in June 2012 and June 2015. The same methods were applied in both surveys.
Household interviews with women aged 13-49 who had a live birth refer to births that occurred in the 12 months preceding survey (June 2011 – May 2012 in 2012, June 2014 – May 2015 in 2015). Facility assessments refer to the availability of equipment and supplies on the day of survey (June in both 2012 and 2015), and data extracted from facility registers for the six month period prior to survey (December – May in both 2012 and 2015). Frontline worker interviews refer to their career as a frontline worker and to the last birth that they attended.
2.2: Survey modulesThe survey design used population level probability sampling to select household clusters, and also surveyed the primary health centres (PHCs) and the frontline workers assigned to provide maternal and newborn care services to those household clusters.
The household survey comprised of three modules. (1) A household module asked all household heads about characteristics of the household, ownership of commodities and registered all normally resident people in the household. (2) A women’s module asked all women aged 13-49 years and normally resident in the household about the health care available to them, their recent contact with frontline workers and their birth history in the two years preceding the survey. (3) A mother’s module asked all women who reported a birth in the last two years (identified in the women’s module) a detailed set of questions about their contact with health services across the continuum of care from pregnancy to postnatal care.
The facility survey comprised of four sections. (1) An inventory of equipment and supplies that were available and functioning on the day of survey. (2) An inventory of staff employed at the facility, their cadre, training and whether they
were present on the day of survey. (3) An interview with the in-charge of the facility about the services available at that facility and about recent supervision visits they had received. (4) Data extraction from facility registers recorded the number and outcomes of all births at the facility during the previous six months.
The frontline worker survey comprised of four sections. (1) The services provided by the frontline worker and the amount of time they typically spend on each service. (2) The training and supervision the frontline worker had received to provide those services. (3) The workload of the frontline worker during the month preceding survey, and their recall of activities that took place during the last delivery they attended. (4) An interview comprising unprompted questions about knowledge of appropriate care for mothers and newborns.
The content of each survey module or section was informed by existing large scale survey tools such as the Demographic and Health Surveys (DHS), the Service Provision Assessment and Averting Maternal Death and Disability, Safe Motherhood. All questionnaires were extensively pre-tested prior to survey implementation each year.
2.3: Sample size and selectionA map of Gombe State relative to the rest of Nigeria is shown in Figure 2, and a map
of the sampled households, facilities and frontline workers in 2012 shown in Figure 3. Each year a representative sample of households from the state was taken. In 2012, 40 clusters were sampled, increased to 80 clusters in 2015. Household clusters were selected using probability proportional to size of the cluster. A cluster was defined as an enumeration area and all households in each selected enumeration area were surveyed (or in a segment of between 50-75 households from the selected enumeration area if more than 50 households). In addition, the PHC assigned to provide primary level care to those households was visited, and any frontline workers providing maternal and newborn health services to the households were identified and interviewed.
In 2012 the minimum target number of households per cluster was set at 50 so that a minimum total number of 2,000 households would be visited. In this high fertility setting (the 2008 DHS estimated the total fertility rate in north-eastern states to be 7.2)5, this number of households would result in interviews with a minimum of 200 women with a live birth in the previous 12 months (i.e. one in every 10 households surveyed). This size of sample was sufficient to measure as statistically significant, and with 90% power, changes of 20 or fewer percentage points in a range of interaction and intervention coverage indicators across the continuum of care. Because of adjustments to the funding strategy in 2015, and to prepare for future evaluation work in the state, the number of sampled clusters was doubled in 2015, and cluster size increased to a uniform 75 households per cluster.
2.4: Survey implementationThe 2012 survey was implemented by Health Hub Ltd, the 2015 survey by Data Research and Mapping Consult Ltd. Questionnaires were written to handheld digital devices using Open Datakit in 2012, CSPro in 2015. Interviewers from Gombe State were recruited and trained. There were eight survey teams, each comprised of one supervisor, four
Methodology
The content of each survey module or section was informed
by existing large scale survey tools. The 2012 survey was
implemented by Health Hub Ltd, the 2015 survey by
Data Research and Mapping Consult Ltd.

10 • Change in maternal and newborn health care
Chapter 2
Figure 2: Map of Nigeria showing location of Gombe State
household interviewers, one facility and frontline worker interviewer, one mapper who listed households and segmented enumeration areas as necessary, and one data support person. Each team aimed to complete one cluster every two days.
Each year the survey teams were trained in-house for five days to familiarise themselves with the questionnaires and procedures, followed by a full pilot
(including a review of data downloads) in two clusters (not included in the final analysis).
In addition to pre-testing the questionnaires, training interviewers and pilot testing all protocols, during field work supervisors carried out at least three re-interviews a day and observed each interviewer in his team each day of data collection. These
re-interviews and observations were used as a means of providing feedback to interviewers, ensuring consistency between interviewers and continuously improving the standard of work.
2.6: Data management and analysisEvery day, data were synchronised from the interviewer devices to the supervisor’s laptop: these daily downloads were then
SokotoState
KebbiState
NigerState
KadunaState
KatsinaState
KanoState
JigawaState
YobeState
BornoState
BauchiState
AdamawaState
TarabaState
NasarawaState
PlateauState
BenueState
Cross RiverState
EboniState
Akwa lbomState
AbiaStateDelta
State
Bayelsa State
ImoState
KogiState
EdoState
OndoState
OsunState
OyoState
OgunState
GombeState
LagosState
KawaraState

Report from Gombe State, Nigeria • 11
Chapter 2
Figure 3: Map of Gombe State showing 2012 household cluster locations (purple dots), the location of the surveyed primary health facilities assigned to household clusters (orange dots) and the location of interviewed frontline workers providing services to household clusters (red dots)
copied to a labelled and securely stored memory device. In addition, when the team had internet connectivity, data were uploaded to a secure, dedicated server which senior supervisors checked for completeness and consistency.
Data modules were linked using a set of automatically generated unique identifiers and data tables for the analysis constructed. Data were analysed
5. http://www.dhsprogram.com/pubs/pdf/FR222/FR222.pdf
using STATA 12. Clustering was adjusted for using svy commands when tabulating percentages or calculating means.
2.7: Research ethicsThis work obtained ethical approval in Nigeria at federal level, from the National Health Research Ethics Committee, Federal Ministry of Health, Abuja, and at state level from the State Ministry of Health in Gombe. Ethical
approval was obtained from the London School of Hygiene & Tropical Medicine (reference 6088).
36 Kilometers04.59 18 27
Frontline Worker Health Facility Household Cluster
xxxx
12 • Change in maternal and newborn health care
© Tanya Marchant

Report from Gombe State, Nigeria • 13
Chapter 3
3.1: Sample selectionThe sample selection protocol was to identify and survey the government owned PHC allocated to provide routine maternal and newborn health (MNH) services to each household cluster. In reality, some household clusters shared a PHC so in 2012 only 25 PHC facilities were identified and surveyed for the 40 household clusters. In 2015 the protocol was revised to require survey teams to identify and survey the nearest
alternative government PHC facility in the event that multiple household clusters shared a PHC, and to include all PHCs in the event that more than one PHC fell within the cluster location. This resulted in a larger facility sample in 2015 (n=106).
3.2: Infrastructure of primary and community health facilitiesInfrastructure indicators were not part of the expected direct effects arising from
Characteristics of the health facilities surveyed
Table 2: Infrastructure of primary facilities in Gombe State 2012-2015
Infrastructure item PHC 2012 (N=25)
PHC 2015 (N=106)
Toilet for facility users 68% 77%
Electricity supply (usual) 52% 53%
Functional steriliser or stove 52% 42%
Running water 76% 38%
Room providing physical privacy 48% 80%
Any means of telephone communication* 48% 70%
Functional fridge 48% 54%
Motorised transport for referral 16% 13%
24 hour light source 12% 9%
*Includes staff-owned mobile phones
project activities but are described here to provide context about the health care available to women. In 2012, gaps in the basic infrastructure of PHCs had been identified and these were still present in 2015. (Table 2) Around half the facilities were connected to an electricity supply and had a functioning fridge and steriliser, but only approximately 10% had a 24 hour light source. The finding of a large reduction in the number of facilities with a source of clean running water deserves further follow up.
3.3: Staff employed and at work in health facilitiesIn 2012, 72% of PHCs employed at least one skilled birth attendant (clinician, registered nurse or auxiliary nurse midwife), 35% in 2015. There was a marked change in seniority of cadres employed between the two surveys (at least one clinician was employed in 60% of PHCs in 2012, 4% in 2015; at least one registered nurse was employed in 52% of PHCs in 2012, 14% in 2015; at least one auxiliary nurse midwife was employed in 16% of PHCs in 2012, 25% in 2015); at least one junior community health extension worker was employed in 96% of PHCs in both 2012 and 2015; at least one community health officer was employed in 28% of PHCs in 2012, 56% in 2015.
In 2012 only 40% of employed staff were at work on the day of survey, similar to the finding that 35% of employed staff were at work in 2015.
The proportional distribution of staff cadres employed by the health facilities is shown in Figure 4. Taking nurses and auxiliary nurse midwives together, and junior community health extension workers and community health officers together, we see these two groups remaining approximately consistent in proportional representation. But the pattern between survey years clearly illustrates the loss of clinicians from the overall pool of workers in primary health care.
Figure 4: Proportional distribution of staff cadres employed
PHCs in 2012 PHCs in 2015
Other (non heath staff): 34% Clinician: 27% CHO: 26% Registered Nurse: 7% ANM: 3% CHEW: 3%
Other (non heath staff): 42% Clinician: 7% CHO: 8% Registered Nurse: 15% ANM: 7% CHEW: 21%
14 • Change in maternal and newborn health care
Chapter 4
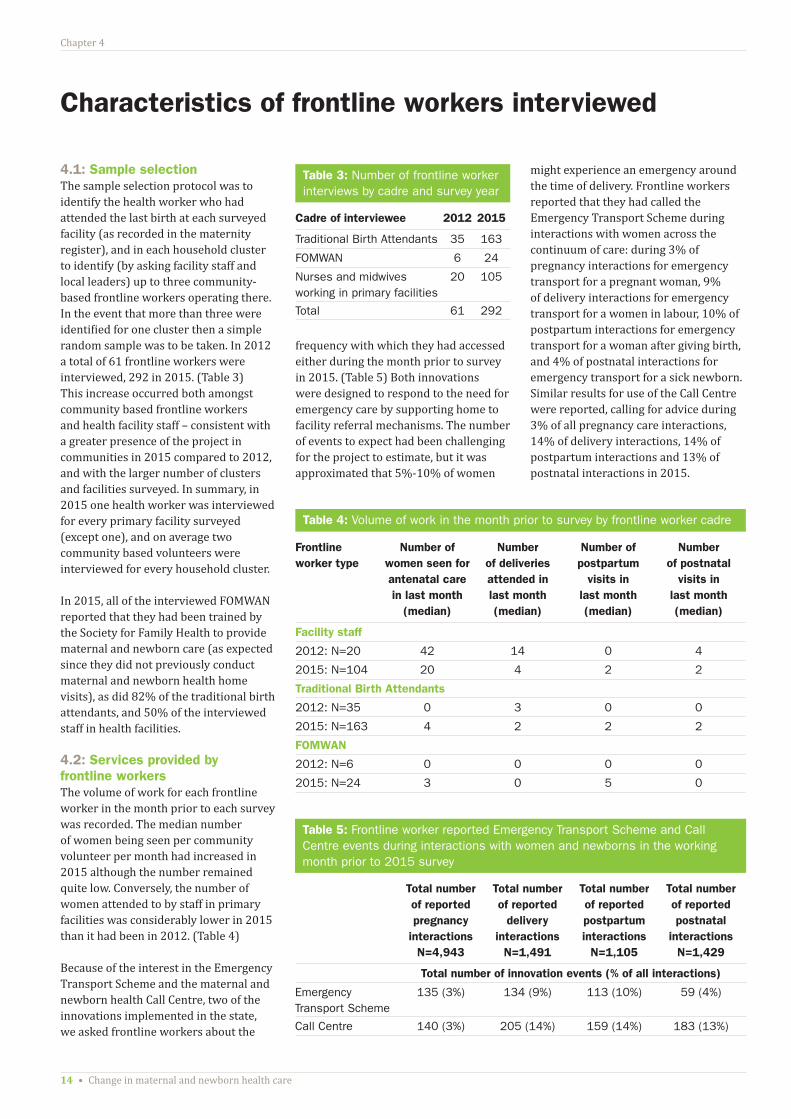
4.1: Sample selectionThe sample selection protocol was to identify the health worker who had attended the last birth at each surveyed facility (as recorded in the maternity register), and in each household cluster to identify (by asking facility staff and local leaders) up to three community-based frontline workers operating there. In the event that more than three were identified for one cluster then a simple random sample was to be taken. In 2012 a total of 61 frontline workers were interviewed, 292 in 2015. (Table 3) This increase occurred both amongst community based frontline workers and health facility staff – consistent with a greater presence of the project in communities in 2015 compared to 2012, and with the larger number of clusters and facilities surveyed. In summary, in 2015 one health worker was interviewed for every primary facility surveyed (except one), and on average two community based volunteers were interviewed for every household cluster.
In 2015, all of the interviewed FOMWAN reported that they had been trained by the Society for Family Health to provide maternal and newborn care (as expected since they did not previously conduct maternal and newborn health home visits), as did 82% of the traditional birth attendants, and 50% of the interviewed staff in health facilities.
4.2: Services provided by frontline workersThe volume of work for each frontline worker in the month prior to each survey was recorded. The median number of women being seen per community volunteer per month had increased in 2015 although the number remained quite low. Conversely, the number of women attended to by staff in primary facilities was considerably lower in 2015 than it had been in 2012. (Table 4)
Because of the interest in the Emergency Transport Scheme and the maternal and newborn health Call Centre, two of the innovations implemented in the state, we asked frontline workers about the
Table 3: Number of frontline worker interviews by cadre and survey year
Cadre of interviewee 2012 2015
Traditional Birth Attendants 35 163
FOMWAN 6 24
Nurses and midwives working in primary facilities
20 105
Total 61 292
Table 4: Volume of work in the month prior to survey by frontline worker cadre
Frontline worker type
Number of women seen for antenatal care in last month
(median)
Number of deliveries attended in last month (median)
Number of postpartum
visits in last month (median)
Number of postnatal
visits in last month (median)
Facility staff
2012: N=20 42 14 0 4
2015: N=104 20 4 2 2
Traditional Birth Attendants
2012: N=35 0 3 0 0
2015: N=163 4 2 2 2
FOMWAN
2012: N=6 0 0 0 0
2015: N=24 3 0 5 0
Table 5: Frontline worker reported Emergency Transport Scheme and Call Centre events during interactions with women and newborns in the working month prior to 2015 survey
Total number of reported pregnancy
interactions N=4,943
Total number of reported
delivery interactions
N=1,491
Total number of reported postpartum interactions
N=1,105
Total number of reported postnatal
interactions N=1,429
Total number of innovation events (% of all interactions)
Emergency Transport Scheme
135 (3%) 134 (9%) 113 (10%) 59 (4%)
Call Centre 140 (3%) 205 (14%) 159 (14%) 183 (13%)
Characteristics of frontline workers interviewed
frequency with which they had accessed either during the month prior to survey in 2015. (Table 5) Both innovations were designed to respond to the need for emergency care by supporting home to facility referral mechanisms. The number of events to expect had been challenging for the project to estimate, but it was approximated that 5%-10% of women
might experience an emergency around the time of delivery. Frontline workers reported that they had called the Emergency Transport Scheme during interactions with women across the continuum of care: during 3% of pregnancy interactions for emergency transport for a pregnant woman, 9% of delivery interactions for emergency transport for a women in labour, 10% of postpartum interactions for emergency transport for a woman after giving birth, and 4% of postnatal interactions for emergency transport for a sick newborn. Similar results for use of the Call Centre were reported, calling for advice during 3% of all pregnancy care interactions, 14% of delivery interactions, 14% of postpartum interactions and 13% of postnatal interactions in 2015.
Report from Gombe State, Nigeria • 15
Chapter 5
0 20 40 60 80 100
Iron roofFlush or latrine toilet
Ownership of a mobile phoneElectricity supply in house
Clean water supplyOwnership of a radio
Finished floorOwnership of a lampOwnership of a fridge
Ownership of a wristwatchBrick house walls
Ownership of a motorbikeCooking fuel electric or gas
Most poor quintile of households – Q1 (%)
Least poor quintile of households – Q5 (%)
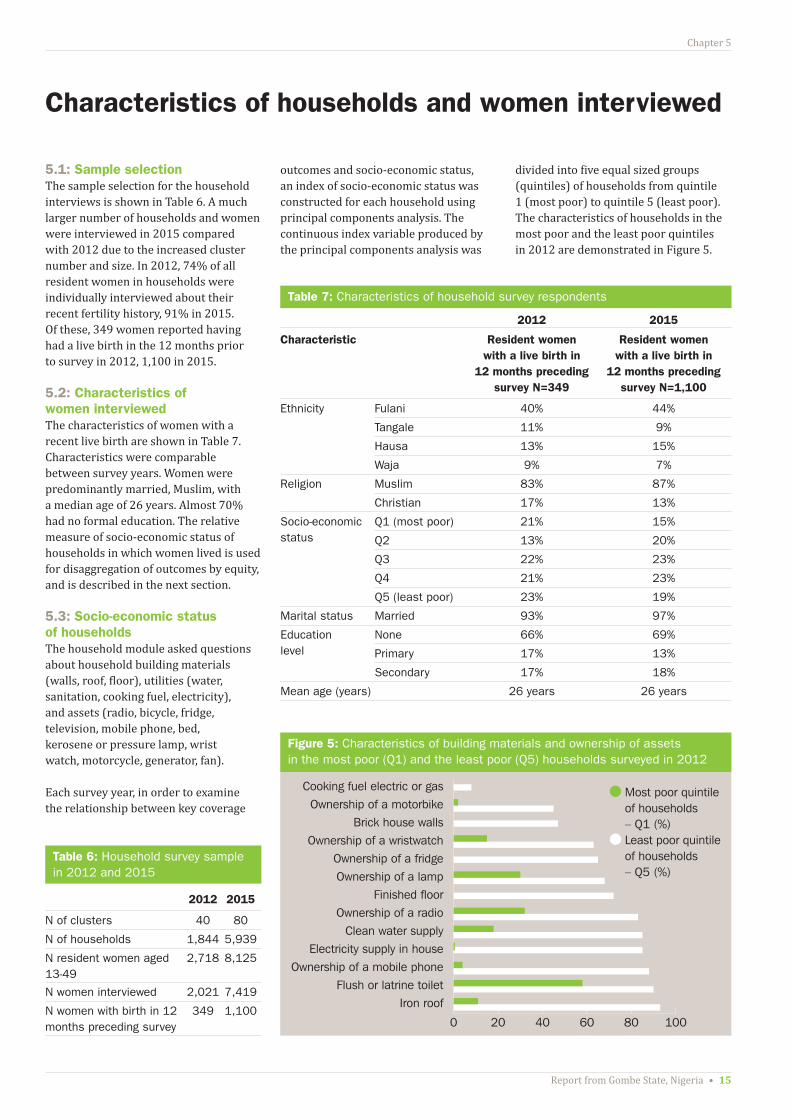
5.1: Sample selectionThe sample selection for the household interviews is shown in Table 6. A much larger number of households and women were interviewed in 2015 compared with 2012 due to the increased cluster number and size. In 2012, 74% of all resident women in households were individually interviewed about their recent fertility history, 91% in 2015. Of these, 349 women reported having had a live birth in the 12 months prior to survey in 2012, 1,100 in 2015.
5.2: Characteristics of women interviewedThe characteristics of women with a recent live birth are shown in Table 7. Characteristics were comparable between survey years. Women were predominantly married, Muslim, with a median age of 26 years. Almost 70% had no formal education. The relative measure of socio-economic status of households in which women lived is used for disaggregation of outcomes by equity, and is described in the next section.
5.3: Socio-economic status of householdsThe household module asked questions about household building materials (walls, roof, floor), utilities (water, sanitation, cooking fuel, electricity), and assets (radio, bicycle, fridge, television, mobile phone, bed, kerosene or pressure lamp, wrist watch, motorcycle, generator, fan).
Each survey year, in order to examine the relationship between key coverage
Characteristics of households and women interviewed
Table 7: Characteristics of household survey respondents
2012 2015
Characteristic Resident women with a live birth in
12 months preceding survey N=349
Resident women with a live birth in
12 months preceding survey N=1,100
Ethnicity Fulani 40% 44%
Tangale 11% 9%
Hausa 13% 15%
Waja 9% 7%
Religion Muslim 83% 87%
Christian 17% 13%
Socio-economic status
Q1 (most poor) 21% 15%
Q2 13% 20%
Q3 22% 23%
Q4 21% 23%
Q5 (least poor) 23% 19%
Marital status Married 93% 97%
Education level
None 66% 69%
Primary 17% 13%
Secondary 17% 18%
Mean age (years) 26 years 26 years
Table 6: Household survey sample in 2012 and 2015
2012 2015
N of clusters 40 80
N of households 1,844 5,939
N resident women aged 13-49
2,718 8,125
N women interviewed 2,021 7,419
N women with birth in 12 months preceding survey
349 1,100
outcomes and socio-economic status, an index of socio-economic status was constructed for each household using principal components analysis. The continuous index variable produced by the principal components analysis was
divided into five equal sized groups (quintiles) of households from quintile 1 (most poor) to quintile 5 (least poor). The characteristics of households in the most poor and the least poor quintiles in 2012 are demonstrated in Figure 5.
Figure 5: Characteristics of building materials and ownership of assets in the most poor (Q1) and the least poor (Q5) households surveyed in 2012
16 • Change in maternal and newborn health care
Chapter 6
In the household survey, women with a live birth in the 12 months preceding survey were asked about the contact that they and their families had with frontline workers in their own homes and communities.
6.1 Contact with frontline workers in own homeIn 2012, just 5% of women with a recent birth reported having been visited at home during pregnancy by a community-based frontline health worker (traditional birth attendant, FOMWAN, or junior community health extension worker) to talk about health care during pregnancy and childbirth. This increased to 29% of women reporting at least one visit in 2015, with visited women having two home visits on average. Traditional birth attendants made 75% of all the reported home visits in 2015.
6.2 Contact with frontline workers at community meetingsIn 2012, only 4% of women had attended a community meeting in the last six months to talk about health-related issues, 3% in 2015. These meetings were reported to be convened by the PHC team or by village health committees.
6.3 Visiting health facilitiesIn 2012, 40% (29-52) of women with a recent birth had attended a primary health facility at least once in the previous six months. The most common reason for going to a facility was for child immunisation (52% of last visits), to seek care for an episode of illness (18% of last visits), for antenatal care (14% of last visits) or for a child health check (7% of last visits).
Frontline worker contact with families
Knowledge and uptake of the emergency transport scheme and the call centre increased
between 2012 and 2015, although levels remained low.
The 2015 situation was very similar to 2012 with 55% (48-61) of women with a recent birth reporting having attended a primary health facility at least once in the previous six months. The most common reasons were for child immunisation (40% of last visits), care seeking for illness (32%), antenatal care (12%) and child health checks (6% of last visits made).
6.4 Knowledge and use of Call Centre and the Emergency Transport SchemeAs for the frontline workers, women with a recent birth were asked about their knowledge and use of the Call Centre and Emergency Transport Scheme. These are reported here because of their overlap with exposure to frontline workers.
Knowledge and uptake of the Call Centre and Emergency Transport Scheme increased between 2012 and 2015. Levels overall remained low, which may reflect insufficient awareness and access to the innovations, but may also be a reflection of the rarity of emergency events at population level.
In 2012, 6% (3-8) of women with a recent birth had ever heard about the Call Centre and just 0.5% reported having ever used it. By 2015 this had increased to 18% (14-23) having heard and 3% (0-4) having ever used it. In 2012, 3% (0-5) had heard about the Emergency Transport Scheme, with just 0.2% reported that they had ever used it. By 2015 this had increased to 10% (8-13) having heard and 2% (0-3) having used it.

Report from Gombe State, Nigeria • 17
Chapter 7
just under half of women reporting that their attendant wore gloves in both survey years. And the evidence of very large differences by place of birth persisted, with around 20% of women with home births reporting use of gloves compared to over 90% of women with a facility birth, also reflected by the large inequity in coverage between most poor
This chapter presents results on the expected improvements arising from the implemented innovations, including frequency of interactions, the quality of those interactions and the coverage of life saving interventions. Where appropriate, coverage is disaggregated by place of birth to reflect changes occurring in facilities and in households. Coverage is also broken down by socio-economic status of households.
7.1 Interaction coverage and equityThere was no evidence of positive change in the frequency of interactions between 2012 and 2015 across the continuum of care. (Table 8) In 2015, 60% of women had at least one antenatal care visit in a health facility, 36% had at least four visits. Large inequities persisted between different socio-economic quintiles, ranging from 28% of women in the most poor households having at least four antenatal care visits in 2015, to 57% of women in the least poor households. Twenty-nine percent of women delivered in a health facility and, as for antenatal care, large inequities were present in both survey years. In 2015 coverage of institutional delivery ranged from 17% among the most poor women to 61% amongst the least poor. In 2015, 10% of women had a postnatal check, and just 7% of newborns had a health check within 48 hours of birth. Coverage was too low for both these interactions to observe differences by socio-economic groups. (Figure 6)
However there was evidence to suggest that referral processes had improved. Among women who reported that they had been advised to seek extra care at the time of delivery (either from home to a first facility, or to seek care at a higher level facility), there was an increase in the percent of women who said that they followed the advice and sought extra care (from 25% (11-39) in 2012 to 55% (46-63) in 2015).
7.2 Intervention coverage and equity Some positive findings were observed for targeted interventions. (Table 8)
Handwashing with soap by birth attendants increased from 55% (95% CI 45-65) in 2012 to 81% (77-84) in 2015. This increase was driven largely by change for home births, rising from 38% (29-48) in 2012 to 74% (69-78) in 2015.
The use of gloves by birth attendants did not change between survey years with
Results on expected improvements
Table 8: Coverage of interactions and coverage of life saving interventions in Gombe State, Nigeria in 2012 and 2015 (showing % and 95% confidence interval (CI))
Expected improvement 2012 % (95% CI)
2015 % (95% CI)
Number of observations 349 1,100
Frequency of interactions
At least one antenatal care visit in a health facility
59% (48-71) 60% (53-69)
At least four antenatal care visits
40% (30-51) 36% (30-43)
Institutional delivery 30% (20-40) 29% (13-33)
Postnatal care for mother ≤ 48 hours of delivery
7% (4-9) 10% (7-13)
Home births 6% (3-11) 6% (4-8)
Facility births 8% (4-14) 19% (14-27)
Postnatal care for newborn ≤ 48 hours of delivery
4% (2-8) 7% (5-10)
Home births 3% (1-7) 6% (4-8)
Facility births 7% (3-16) 10% (7-16)
Life saving interventions1
Hand washing with soap by delivery attendant
55% (45-65) 81% (77-84)
Home births 38% (29-48) 74% (69-78)
Facility births 82% (69-90) 98% (95-99)
Use of gloves by delivery attendant
45% (34-58) 44% (38-51)
Home births 18% (11-28) 22% (17-27)
Facility births 91% (82-96) 97% (94-99)
Hygienic cord care2 28% (20-36) 46% (42-50)
Home births 33% (24-44) 46% (42-51)
Facility births 18% (8-35) 46% (39-42)
Initiation of early breastfeeding 40% (33-47) 49% (45-53)
Home births 48% (35-60) 48% (43-52)
Facility births 36% (30-44) 53% (46-59)
Delayed bathing ≥24 hours of life (thermal care)
11% (7-15) 21% (17-26)
Home births 9% (5-16) 14% (11-19)
Facility births 28% (19-38) 38% (31-45)
1. ‘Don’t know’ responses removed from denominator2. Newborn had cord cut and tied with sterile instruments and nothing harmful put on the cord

18 • Change in maternal and newborn health care
Chapter 7
Antenatal care (4 visits)
Use of gloves by birth attendant
Institutional delivery
Clean cord care for newborn
Postnatal care for newborn (48 hours)
Immediate breastfeeding for newborn (1hr)
Postnatal care for mother (48 hours)
Delayed bathing for newborn (24hrs)
0
20
40
60
80
100
Q1mostpoor
Q2 Q3 Q4 Q5leastpoor
2012 2015
0
20
40
60
80
100
Q1mostpoor
Q2 Q3 Q4 Q5leastpoor
2012 2015
0
20
40
60
80
100
Q1mostpoor
Q2 Q3 Q4 Q5leastpoor
2012 2015
0
20
40
60
80
100
Q1mostpoor
Q2 Q3 Q4 Q5leastpoor
2012 2015
0
20
40
60
80
100
Q1mostpoor
Q2 Q3 Q4 Q5leastpoor
2012 2015
0
20
40
60
80
100
Q1mostpoor
Q2 Q3 Q4 Q5leastpoor
2012 2015
0
20
40
60
80
100
Q1mostpoor
Q2 Q3 Q4 Q5leastpoor
2012 2015
0
20
40
60
80
100
Q1mostpoor
Q2 Q3 Q4 Q5leastpoor
2012 2015
Figure 6: Coverage of interactions across the continuum of care, disaggregated by socio-economic status of households
Figure 7: Coverage of interventions across the continuum of care, disaggregated by socio-economic status of households
(31%) and least poor (78%) women. (Figure 7)
Clean cord care for the newborn (cord cut and tied using sterile instruments and nothing harmful applied to the cord stump) increased from 28% (20-36) in 2012 to 46% (42-50) in 2015. This change was particularly apparent amongst newborns born in facilities, rising from 18% (8-35) in 2012 to 46% (39-42) in 2015. The breakdown by socio-economic quintiles revealed that clean cord care improved for all groups simultaneously and it is interesting to note that clean cord care was persistently better in the poorest households than in
the least poor households: it would be interesting to learn more about the cord care practises among high socio-economic groups.
The point estimates for coverage of breastfeeding initiation within one hour of birth increased between survey years but because of overlapping confidence intervals there was no evidence of improvement overall. However, again coverage for the sub-group of newborns born in health facilities improved from 36% (30-44) in 2012 to 53% (46-59) in 2015, with some evidence of a reduction in inequity for this behaviour.
Delayed bathing of newborns improved for all. For facility births, clean cord care and
initiation of immediate breastfeeding increased.
For home births, hand washing with soap improved.

Report from Gombe State, Nigeria • 19
Chapter 7
Table 9: Indicators of interaction quality, Gombe State, Nigeria 2012 and 2015
Expected improvement 2012 2015
Quality of interactions
Timing1 Antenatal care (median weeks gestation at first visit)
16 weeks 20 weeks
Postnatal care for the mother (median days since birth at first visit)
2 days 2 days
Postnatal care for the newborn (median days since birth at first visit)
2 days 2 days
Content2 Components of focussed antenatal care delivered (mean number delivered)
3.4 (3.0-3.8)
5.9 (5.7-6.2)
Components of recommended postnatal care for newborn (mean number delivered)
1.3 (0.7-2.0)
1.2 (0.8-1.4)
Knowledge of danger signs3
Mean number pregnancy signs cited 1.7 (1.4-2.0)
2.6 (2.4-2.8)
Mean number of intrapartum signs cited 1.4 (1.0-1.8)
1.8 (1.7-2.0)
1. Among people receiving care2. Antenatal care from a total of seven components; postnatal care for newborn from a total
of five components3. Among all women with a recent birth. From a total of 10 coded danger signs for each
of pregnancy and intrapartum stages
Finally, the practise of delaying the newborn’s first bath beyond the first 24 hours of life also had positive evidence of change from 11% (7-15) in 2012 to 21% (17-26) in 2015. However, despite increasing point estimates for home and facility births separately the overlapping confidence intervals for these sub-groups meant that change by place of birth could not be confirmed.
7.3 Indicators of interaction quality Indicators of interaction quality targeted by the project reflected timing of care, content of care, knowledge of danger signs, and readiness of primary health facilities to provide basic care. (Table 9)
There was no evidence that timing of care changed between survey years. The finding that the median weeks of gestation at first antenatal care visit in 2012 was 16 weeks is almost certainly a measurement error for gestational age, with heaping of gestation months at four-weekly intervals. (For example, the maximum gestational age at first antenatal care visit in 2012 was reported to be 36 weeks, a product of nine months multiplied by four.)
On the content of care, there was evidence that a larger number of components of focussed antenatal care were delivered to women who had at least one antenatal care visit in 2015 (mean 5.9 components) compared with 2012 (mean 3.4 components). Most notable were increases in the number of women having blood tests during pregnancy (linked to detection of syphilis), the number providing a urine sample to detect protein, and the number reporting that they had been counselled about danger signs, breastfeeding and birth preparedness. The content of postnatal care for the mother and for the newborn did not improve between survey years. Further details about the content of care across the continuum are provided in the Annex.
Knowledge of danger signs that should prompt care seeking in pregnancy increased from a mean of 1.7 (1.4-2.0)
being cited unprompted in 2012 to 2.6 (2.4-2.8) in 2015. Knowledge of danger signs during delivery did not change, at fewer than two danger signs each year.
The readiness of primary facilities to provide basic care did not improve between survey years. Further details are provided in the Annex, but using a composite indicator for the availability of essential commodities needed to provide antenatal care (defined by fetostethoscope, single use syringes, stethoscope, blood pressure cuff, thermometer, adult weighing scale, disposable gloves, ferrous sulphate/folic acid supplements, tetanus toxoid vaccinations, watch or timing device), we observed 16% (0-31) of facilities to have all items in 2012, 14% (9-22) in 2015. And using a similar composite indicator for essential commodities to provide basic delivery care (defined by fetostethoscope, stethoscope, thermometer, blood pressure cuff, infant weighing scale, steriliser, speculum, manual vacuum aspirator and vacuum extractor), we observed 8% (0-20) of facilities to have all items in 2012, 5% (0-9) in 2015.
The readiness of primary facilities to provide basic
care did not improve between survey years.

20 • Change in maternal and newborn health care
Chapter 8
There was no evidence of change in the frequency of routine interactions across the continuum of care from pregnancy to early newborn period, and large inequities in access persisted with women in the poorest households having the least health care. For example, in 2015 coverage of at least four antenatal care visits, facility delivery, and postnatal care for the mother and for the newborn were 28%, 17%, 7% and 5% respectively for the most poor, but 57%, 61%, 15% and 9% respectively for the least poor. But these figures reveal that even among the least poor families, postnatal care for the woman and the newborn within 48 hours of birth remained very low.
Innovations during this period were also targeting access to emergency care and there was evidence that this had improved for emergency events around the time of birth, with the number of women advised to seek extra care who actually did seek extra care doubling between survey years from 25% to 55% in 2015.
In contrast to coverage of routine interactions, many of the life saving interventions targeted for change did improve, especially those that relied on a change of behaviour rather than commodities. Hand washing with soap by birth attendants increased from 55% in 2012 to 81% in 2015, but use of gloves by birth attendants did not, remaining at just under 50% coverage. Clean cord care for the newborn increased from 28% to 46% between survey years, in part driven by families not putting harmful substances on the cord stump in the first days of life. Breastfeeding initiation within one hour of birth increased to 53% for newborns born in health facilities, and 21% of newborns had their first bath delayed by at least 24 hours in 2015 compared with just 11% in 2012. While encouraging, clearly there is still scope to markedly increase the coverage of these life saving behaviours.
In the context of these findings it is perhaps surprising that evidence of contact between families and the innovations being implemented was limited. By 2015 only 29% of women with a birth in the 12 months before survey reported that they had been visited at home by a frontline worker and just 3% had attended a community meeting where health issues were discussed. Frontline workers themselves reported a relatively low volume of work: traditional birth attendants made the most home visits but even this group had a monthly median volume of only four home visits for pregnancy care, two for deliveries, and two for postnatal care for the mother and for the newborn in 2015.
Regarding the maternal and newborn health Call Centre, 18% of women had heard about it and 3% had ever used it. And only 10% of women had heard about the Emergency Transport Scheme and 2% had ever used it. But reflecting again on frontline workers, we learned that they reported using the Call Centre during their interactions with women between 3% and 14% of times (depending on the point of care), and used the Emergency Transport Scheme between 3% and 10% of interactions (again depending on the point of care).
Neither the Call Centre, nor the Emergency Transport Scheme were designed for universal coverage of use – only 5%-10% of women being expected to have an emergency event – and perhaps it was appropriate that frontline workers had more direct contact with these innovations than did individual women. Nonetheless, community awareness of both innovations needs to be addressed.
A number of limitations are present. First, survey data collection approaches to measure behaviours that occur during pregnancy, intrapartum and newborn periods may be susceptible both to recall and measurement bias. We tried to limit recall bias by only analysing data on births from the last 12 months in the household survey and the last birth
Discussion
In summary, some but not all targeted indicators were observed to have increased between the surveys.
While some results are encouraging, there is still
scope to markedly increase the coverage of life saving behaviours
Report from Gombe State, Nigeria • 21
Chapter 8
attended by frontline workers. Measurement bias is harder to control (for example, a woman may have difficulty in accurately reporting the timing of events). However, there is no reason to expect that this bias would have a systematic effect on analysis of change between two survey points given that the same methods were applied each time.
Second, no comparison areas were included in the study design, so the analysis is limited to before-after change: other contextual factors may have been in place that provide an alternative explanation for the findings, even though care has been taken to link project activities to expected effects. While this means that the results on change must be
interpreted with caution, the contextual data collected by the IDEAS project confirmed that there was no policy change during this time period that would affect the outcomes presented here, spending on health across the state was very limited, and the insurgency experienced across north-eastern Nigeria throughout this period may have had the effect of reducing the number of skilled personnel available to support large-scale temporal changes.
Third, some of the evidence on uptake of innovations was derived from interviews with frontline workers themselves. The possibility of responder bias leading to inflated estimates of use of the Call Centre and the Emergency Transport Scheme cannot be discounted. Finally,
this study was not designed to evaluate the progress of an individual grant but to understand changes arising as a result of investments made by the Bill & Melinda Gates Foundation strategy for maternal and newborn health. By 2015 the foundation strategy in Gombe had already adapted to also include a more purposeful focus on working with government to improve the capacity of primary facilities to provide quality care, on increasing the demand for routine care, and on advocating for policies that affect the skilled workforce. The findings from this report suggest that the challenge of inequitable access to health care, and inadequate routine care for mothers and newborns in the first days after birth are two additional areas in urgent need of attention.
© Nasir Umar

xxxx
22 • Change in maternal and newborn health care
© Nasir Umar

Report from Gombe State, Nigeria • 23
Annex 1
Table A1.1: Household survey results on pregnancy care in Gombe State in 2012 and 2015 (showing % and 95% confidence interval (CI))
Expected improvement 2012 % (95% CI)
2015 % (95% CI)
Number of observations 349 1,100
Frequency of interactions
Any antenatal care (≥ one visit) 61% (50-72) 64% (56-71)
Antenatal care with a skilled provider (≥ one visit) 35% (26-43) 23% (18-28)
Antenatal care (≥ four visits, any provider) 40% (30-51) 36% (30-43)
Quality of interactions
Coverage of good quality antenatal care
Weighed 56% (45-67) 59% (52-67)
Blood pressure testing at least once 57% (47-68) 59% (52-66)
Blood sample taken 45% (34-55) 53% (45-60)
Urine sample taken 36% (25-47) 54% (47-61)
Counselled on birth preparedness 46% (35-57) 56% (49-63)
Counselled on danger signs 41% (30-50) 52% (45-58)
Counselled on breastfeeding 49% (39-60) 55% (48-62)
Coverage of birth preparedness
Finances 26% (19-34) 21% (18-25)
Transport 14% (7-20) 17% (14-20)
Identification of health facility 5% (1-8) 5% (3-6)
Identification of birth attendant 6% (3-10) 3% (2-4)
Food 32% (22-41) 39% (34-44)
Life saving interventions
Iron supplementation received 53% (41-64) 60% (53-67)
Tetanus toxoid protection 44% (33-54) 44% (37-50)
Syphilis prevention (test result received) 6% (3-9) 18% (14-21)
Intermittent presumptive treatment for malaria 41% (32-50) 52% (46-58)
Long list of indicators for maternal and newborn health

24 • Change in maternal and newborn health care
Annex 1
Table A1.2: Household survey results on intrapartum care in Gombe State in 2012 and 2015 (showing % and 95% confidence interval (CI))
Expected improvement 2012 % (95% CI)
2015 % (95% CI)
Number of observations 349 1,100
Frequency of interactions
Institutional delivery (any facility) 30% (20-40) 29% (23-35)
Births attended by a skilled birth attendant 22% (14-29) 17% (13-22)
Births by caesarean section 2% (0-3) 1% (0-2)
Women advised to seek extra care who sought extra care1 25% (11-39) 55% (46-63)
Quality of interactions
Mean number of intrapartum danger signs cited 1.4 (1.0-1.8) 1.8 (1.7-2.0)
Life saving interventions2
Hand washing with soap by delivery attendant 55% (45-65) 81% (77-84)
Use of gloves by delivery attendant 45% (34-58) 44% (38-51)
Prophylactic uterotonics3 13% (6-18) 26% (24-29)
1. Denominator is number of women advised to seek care2. Don’t know responses excluded from denominator3. Calculated by linking reports from birth attendants about use of uterotonics at last birth attended to household survey reports
on cadre of attendant at birth

Report from Gombe State, Nigeria • 25
Annex 1
Table A1.3: Household survey results on postnatal care in Gombe State in 2012 and 2015 (showing % and 95% confidence interval (CI))
Expected improvement 2012 % (95% CI)
2015 % (95% CI)
Number of observations 349 1,100
Frequency of interactions
Postnatal care for the mother (≥ 1 within 48hrs of birth) 7% (4-9) 10% (7-13)
Postnatal care for the newborn (≥ 1 within 48hrs of birth) 4% (2-8) 7% (5-10)
Quality of interactions
Coverage of good quality postnatal care for mother
Breasts checked 3% (0-5) 2% (1-3)
Bleeding checked 1% (0-2) 4% (2-5)
Counselled on nutrition 5% (2-7) 6% (3-8)
Counselled on family planning 2% (0-4) 3% (1-5)
Counselled on danger signs 0% 4% (2-5)
Coverage of good quality postnatal care for newborn
Newborn weighed 2% (1-6) 4% (2-8)
Newborn cord checked 3% (1-5) 6% (3-10)
Newborn checked for danger signs 3% (1-5) 3% (2-5)
Caregiver counselled on breastfeeding 3% (1-5) 8% (4-15)
Caregiver counselled on thermal care 1% (0-3) 2% (1-6)
Life saving interventions1
Hygienic cord care 28% (20-36) 46% (42-50)
Cut with sterile blade 77% (70-83) 98% (97-99)
Tied with sterile instrument 61% (51-70) 78% (73-83)
Nothing harmful put on cord 74% (67-80) 72% (68-76)
Initiation of early breastfeeding (<1 hour of birth) 40% (33-47) 49% (45-53)
Immediate thermal care:
Immediate drying (< 5 minutes of birth) 53% (44-61) 39% (33-44)
Wrapping (< 5 minutes of birth) 22% (17-28) 29% (24-33)
Delayed bathing (> 24 hours after birth) 11% (7-15) 21% (17-26)
1. Don’t know responses removed from denominator
26 • Change in maternal and newborn health care
Annex 1
Table A1.4: Essential equipment and supplies to provide basic maternal and newborn health care at primary health centres
2012 2015 2012 2015
Item PHC with item N=25
% (95% CI)
PHC with item N=106
% (95% CI)
Item PHC with item N=25
% (95% CI)
PHC with item N=82
% (95% CI)
General items for basic MNH Diagnostics for MNH
Soap 84% (64-95) 78% (70-86) Pregnancy test kit 64% (43-82) 73% (64-81)
Single use syringes/needles 96% (80-100) 99% (97-100) Malaria rapid test kits 16% (5-36) 95% (91-99)
Blood pressure cuff 84% (64-95) 92% (87-98) Haemoglobin test 60% (39-79) 55% (45-64)
Thermometer 88% (69-97) 73% (64-81) Urine dipstick 60% (39-79) 46% (37-56)
Sterile scissors or blade 88% (69-97) 92% (87-98) Partographs 36% (18-57) 8% (2-13)
Disinfectant 84% (64-95) 74% (65-82) Syphilis rapid test kit 8% (1-26) 10% (4-16)
Stethoscope 92% (74-99) 94% (90-99) HIV rapid test kit 72% (51-88) 59% (50-69)
IV fluids with infusion set 68% (46-85) 69% (60-78) Medications for MNH
Suture material with needle 72% (51-88) 68% (59-77) IV gentamycin 36% (18-57) 33% (24-42)
Infant weighing scale 68% (46-85) 78% (70-86) Ferrous sulphate/FA 76% (55-91) 81% (73-89)
Disposable gloves 76% (55-91) 93% (89-98) Oral antibiotics 72% (51-88) 75% (67-84)
Needle holder 64% (43-82) 69% (60-78) IV metronidazole 60% (39-79) 51% (41-61)
Waste receptacle with lid 60% (39-79) 71% (62-80) Cotrimoxizole 68% (46-85) 64% (55-73)
Watch/timing device 48% (28-69) 46% (37-56) Uterotonics 64% (43-82) 83% (75-89)
Speculum 36% (18-57) 55% (45-64) Corticosteroids 12% (3-31) 10% (4-16)
Bag and mask for resuscitation 16% (5-36) 38% (30-46) IV ampicillin 12% (3-31) 2% (0-4)
Disposable clamp/umbilical tie 76% (55-91) 75% (67-84) Local anaesthetics 60% (39-79) 42% (32-51)
Oxygen 4% (1-20) 2% (0-4) Diazepam 44% (24-65) 30% (21-39)
Sharps container 84% (64-95) 97% (94-100) Vitamin K 44% (24-65) 30% (21-39)
Blanket for newborn 28% (12-49) 25% (16-33) Sulphadoxine pyrimethamine 84% (64-95) 50% (40-50)
Suction bulb for mucus extraction 16% (5-36) 25% (17-34) Tetracycline/eye ointment 40% (21-61) 36% (27-45)
Disposable paper towels 44% (24-65) 41% (31-50) Vaccinations for MNH:
Vacuum extractor 16% (5-36) 17% (10-24) Bacille Calmette-Guerin 56% (35-76) 76% (68-84)
Baby warmer 8% (1-26) 8% (2-13) Tetanus toxoid vaccines 72% (51-88) 75% (67-84)
Fetal stethoscope 100% 90% (84-96) Oral Polio Vaccine (OPV) 68% (46-85) 76% (68-84)
Manual vacuum aspirator 32% (15-54) 29% (20-38)
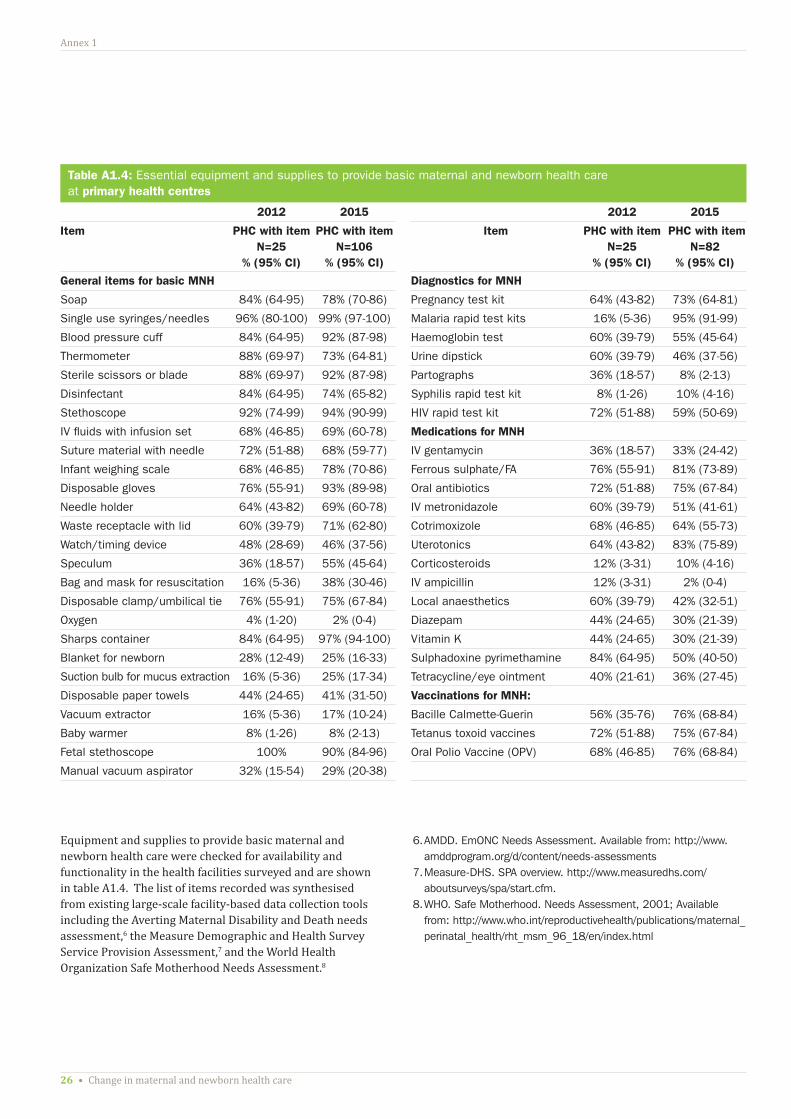
Equipment and supplies to provide basic maternal and newborn health care were checked for availability and functionality in the health facilities surveyed and are shown in table A1.4. The list of items recorded was synthesised from existing large-scale facility-based data collection tools including the Averting Maternal Disability and Death needs assessment,6 the Measure Demographic and Health Survey Service Provision Assessment,7 and the World Health Organization Safe Motherhood Needs Assessment.8
6. AMDD. EmONC Needs Assessment. Available from: http://www.amddprogram.org/d/content/needs-assessments
7. Measure-DHS. SPA overview. http://www.measuredhs.com/aboutsurveys/spa/start.cfm.
8. WHO. Safe Motherhood. Needs Assessment, 2001; Available from: http://www.who.int/reproductivehealth/publications/maternal_perinatal_health/rht_msm_96_18/en/index.html

Report from Gombe State, Nigeria • 27
Annex 1
© Nasir Umar

IDEAS project
IDEAS (Informed Decisions for Actions in Maternal and Newborn Health) aims to improve the health and survival of mothers and babies through generating evidence to inform policy and practice. Working in Ethiopia, North-Eastern Nigeria and the State of Uttar Pradesh in India, IDEAS uses measurement, learning and evaluation to find out what works, why, and how in maternal and newborn health programmes.
IDEAS is funded between 2010 and 2017 by a grant from the Bill & Melinda Gates Foundation to the London School of Hygiene &Tropical Medicine.
ideas.lshtm.ac.uk
London School of Hygiene & Tropical Medicine
The London School of Hygiene & Tropical Medicine is a world-leading centre for research and postgraduate education in pubic and global health, with 4000 students and more than 13000 staff working in over 100 countries. The school is one of the highest-rated research institutions in the UK, and was recently cited as one of the world’s top universities for collaborative research.
www.lshtm.ac.uk
IDEAS project London School of Hygiene & Tropical Medicine, Keppel Street, London, WC1E 7HT, UKt +44 (0)207 927 2871/2257 w ideas.lshtm.ac.uk
@LSHTM_IDEAS
© Bilal Avan
© Nasir Umar