change committing to action - hankyu hanshin … · responding to change committing to action....
TRANSCRIPT

Hankyu H
anshin Holdings, Inc. A
NN
UA
L REPORT 2017
Hankyu Hanshin HoldingsSecurities code: 9042
ANNUAL REPORT
2017
Responding to ChangeCommitting to Action

ANNUAL REPORT 2017
Contents
Key Facts 1 Group Management Philosophy
3 Corporate Social Responsibility (CSR)
4 At a Glance
6 Location of Our Business Base
8 Performance Highlights (Consolidated)
12 ESG Highlights
Business Policies and Strategies 14 To Our Stakeholders 20 Special Feature:
Long-Term Management Vision for 2025 20 From Management Integration to the Present Day
22 Long-Term Vision Summary
23 Strategies under Long-Term Management Vision for 2025
26 Management Indicators
26 Organisational Improvements Aimed at Realising the
Long-Term Vision
27 Medium-Term Management Plan (Fiscal 2016–Fiscal 2019)
29 From Enhancing the Value of Line-Side Areas to Enhancing
Corporate Value
30 CSR and Corporate Value Enhancement
Core Businesses: Overview and Outlook 34 Business Environment
36 Urban Transportation
38 Real Estate
40 Entertainment and Communications
42 Travel
44 International Transportation
46 Hotels
Management Organisation 48 Directors and Audit & Supervisory Board Members
50 A Message from an External Director
52 Management Organisation
61 Initiatives Aimed at Reducing the Group’s Risk
62 Principal Risks and Countermeasures
64 Safety Initiatives in the Railway Business
Financial Section and Corporate Data 68 Consolidated Six-Year Summary
69 Consolidated Financial Review
73 Business Risks
74 Consolidated Balance Sheets
76 Consolidated Statements of Income /
Consolidated Statements of Comprehensive Income
77 Consolidated Statements of Changes in Net Assets
79 Consolidated Statements of Cash Flows
80 Notes to the Consolidated Financial Statements
106 Major Rental Properties / Major Sales Properties
107 Major Group Companies
108 Group History
109 Investor Information
Group Overview1–13, 106–109
2017 Financial and Business Performances8–11, 15, 68–72
Forecasts for Fiscal 2018 and OnwardUrban Transportation: 37Real Estate: 39Entertainment and Communications: 41Travel: 43International Transportation: 45Hotels: 47
Long-Term Management Vision for 2025 / Medium-Term Management Plan16–28
Corporate Governance15, 48–61
Safety Initiatives in the Railway Business64–67
Financial Policy and Shareholder Returns11, 15
Search Index
Forward-Looking StatementsThe reader is advised that this annual report contains forward-looking statements regarding the future plans, strategies, and earnings performance of Hankyu Hanshin Holdings, Inc., which are not statements of historical fact but constitute estimates or projections based on facts known to the Company’s management as of the time of writing. Actual results may therefore differ substantially from such statements.
About the Compilation of this Annual Report and the Auditing Company UsedThe financial section of this annual report includes a digest of information including con-solidated financial statements in the Company’s Securities Report for the 179th period, audited by KPMG AZSA LLC and presented in a somewhat modified format. We have pre-sented this information in such a way as to ensure that there is no discrepancy with the data presented in the annual securities report. However, the annual report itself has not been audited by KPMG AZSA LLC.
Definition“Fiscal 2017” refers to the fiscal year ended 31st March 2017. Other fiscal years are referred to in a corresponding manner in this annual report. Figures are basically rounded off. Sums expressed in units of ¥100 million are rounded to the nearest ¥100 million.
Definition of the areas served by the Hankyu and Hanshin lines: Below are lists of areas with Hankyu Corporation and Hanshin Electric Railway stations (including tier 2 railway operators).
Osaka Prefecture: Osaka City (Fukushima, Konohana, Nishi, Naniwa, Nishi-Yodogawa, Higashi-Yodogawa, Yodogawa, Kita, and Chuo, out of a total of 24 wards); and Toyonaka, Ikeda, Suita, Takatsuki, Ibaraki, Minoh, and Settsu cities and Shimamoto townHyogo Prefecture: Kobe City (Higashi-Nada, Nada, Hyogo, Nagata, and Chuo, out of a total of 9 wards); and Amagasaki, Nishinomiya, Ashiya, Itami, Takarazuka and Kawanishi citiesKyoto Prefecture: Kyoto City (Nakagyo, Shimogyo, Ukyo, and Nishikyo, out of a total of 11 wards); and Muko and Nagaokakyo cities and Oyamazaki town

Group Management Philosophy
What we try to achieve
By delivering “Safety and Comfort” and “Dreams and Excitement,”
we create satisfaction among our customers and contribute to society.
Mission
Hankyu Hanshin Holdings • Annual Report 2017 1

Group Management Philosophy
Customers First
Everything we do is for the customer.That’s where it all starts.
Sincerity
Gain customers’ confidence by always being sincere.
Foresight & Creativity
With our pioneer spirit and flexible thinking,
we create a new value.
Respect for People
Everyone is absolutely invaluable to the Group.
What is important to usValues
Hankyu Hanshin Holdings • Annual Report 20172

Corporate Social Responsibility (CSR)
We believe that contributing to local communities and preserving the environment are social responsibilities that are incum-bent upon us to fulfill and which are essential for our medium-to-long-term development. Therefore, the two pillars of our CSR activities are social contribution activities, which develop towns and cities in partnership with local communities, and environmental preservation activities promoting environment-friendly business activities.
Social Contribution Activities
Basic Policy
We intend to promote the creation of towns
and cities along our railway lines that
people will truly want to live in.
Environmental Preservation Activities
Basic Concept
Mindful that global environmental preservation is
a task facing all mankind, the Hankyu Hanshin
Holdings Group works for a sustainable society
through environmental activities aimed at handing
down a sounder global and human environment
to the next generation.
Hankyu Hanshin Holdings • Annual Report 2017 3

©Takarazuka Revue Company
Real Estate
Entertainment and Communications
Travel
Hotels
Urban Transportation
Major Operating Companies*
At a Glance
* For Major Group Companies, please see page 107.
Fiscal 2017 Results
International Transportation
Hankyu Corporation
Hanshin Electric Railway
阪神電気鉄道
Hankyu Travel International
Hankyu Hanshin Express
Hankyu Hanshin Hotels
Revenues from Operations ¥237.1 billion (YoY –1.0%)
Operating Income ¥42.2 billion (YoY +2.3%)
Segment Assets ¥802.2 billion (YoY +1.0%)
Revenues from Operations ¥215.7 billion (YoY –2.4%)
Operating Income ¥42.0 billion (YoY –15.8%)
Segment Assets ¥1,056.7 billion (YoY +3.3%)
Revenues from Operations ¥115.2 billion (YoY +2.4%)
Operating Income ¥15.7 billion (YoY +2.3%)
Segment Assets ¥147.3 billion (YoY +3.2%)
Revenues from Operations ¥29.9 billion (YoY –1.8%)
Operating Income ¥0.6 billion (YoY –6.4%)
Segment Assets ¥73.9 billion (YoY +13.3%)
Revenues from Operations ¥71.7 billion (YoY –5.8%)
Operating Income ¥1.6 billion (YoY –11.2%)
Segment Assets ¥38.7 billion (YoY –3.1%)
Revenues from Operations ¥65.6 billion (YoY –3.5%)
Operating Income ¥2.8 billion (YoY –15.2%)
Segment Assets ¥82.6 billion (YoY –0.2%)
Hankyu Hanshin Holdings • Annual Report 20174

At a Glance
Nature of Business
Railway operations: These operations form a network in the Kansai area that centres on the railway lines of Hankyu Corporation and Hanshin Electric Railway. Hankyu Corporation’s railway lines link Osaka-Umeda with Kobe, Takarazuka, and Kyoto. Meanwhile, Hanshin Electric Railway is the only private (non-JR) railway operator with railway lines that di-rectly link Kobe with Osaka’s major northern and southern terminals, which are Osaka-Umeda and Namba, respectively. The operating kilometres of Hankyu Corporation and Hanshin Electric Railway are 143.6 km* and 48.9 km*, respectively.* Including tier 2 railway operatorsAutomobile business (bus, taxi): This business manages and operates bus and taxi services, which coordinate with railway services to increase convenience in line-side areas.Retailing business: This business manages and operates convenience stores and other shops mainly inside railway stations on the Hankyu and Hanshin lines.Advertising business: This business provides advertising media that are based on digital signage inside railway stations and space inside trains.
Real estate leasing business: This business owns numerous office buildings and facilities, mainly in Osaka-Umeda and the line-side areas of the Hankyu and Hanshin lines. In recent years, the business has been actively pursuing develop-ment of real estate in the Tokyo metropolitan area. (For a list of principal rental properties, please see page 106.)Real estate sales and other business: This business markets condominiums, residential land lots, and detached houses, mainly in the line-side areas of the Hankyu and Hanshin lines and the Tokyo metropolitan area. In recent years the business has entered the ASEAN region. The business is engaged in property management, building maintenance, and other building operation and management services as well as real estate fund management, including private placement funds and J-REIT businesses.
Sports business: This business manages the Hanshin Tigers professional baseball team, which has a history of more than 80 years, as well as the team’s home ground and high-school baseball mecca Hanshin Koshien Stadium and man-ages related businesses. The business also operates a music business (Billboard Live).Stage business: This business manages the performances of the Takarazuka Revue—an organisation which has more than a century of history—sells related products, and manages and operates related businesses engaged in video and music distribution. Further, the business operates Umeda Arts Theatre and promotes stage productions.Communication and media business: This business operates a broadcast and communications business, which pro-vides cable television services (including multichannel broadcasts, Internet, and fixed telephone line services), and an information services business, which provides a variety of services based on system development and other IT.
Travel business: This business plans, markets, arranges, and supports travel for Japanese people in Japan and overseas and for non-Japanese visitors in Japan.
International transportation business: This business operates air freight, sea freight, and logistics businesses as well as a comprehensive portfolio of businesses that are ancillary or related to these operations. The business has 46 bases in Japan and 119 bases overseas as of 1st July 2017.
Hotels business: This business operates a wide range of hotel formats, from “city hotels” through to business hotels mainly comprising guest rooms for overnight stays. The business operated 48 hotels, consisting of 19 directly managed hotels and 29 franchise hotels, with 10,693 guest rooms as of 1st April 2017. In addition to the above hotels, the business manages The Ritz-Carlton, Osaka, based on an alliance with the Ritz-Carlton chain of international luxury hotels.
Note: Figures for percentage of revenues from operations and operating income are calculated based on the simple aggregate amount (including intersegment transactions) of each segment.
% of Revenues from Operations, Operating Income, and Segment Assets
30.5
14.8
3.8
8.4
9.2
5.5
39.8
39.5
14.7
0.61.52.6
1.3
35.9
47.3
3.3
1.73.7
1.5
27.7
6.6
Hankyu Hanshin Holdings • Annual Report 2017 5

HankyuSenriLine
Hankyu Mino-o Line
Osaka Prefecture
Nara Prefecture
Kintetsu-Nara
Hankyu Kyoto Line
Arashiyama
Kawaramachi
Kyoto
Kyoto Prefecture
Katsura
Hankyu Arashiyama Line
Hanshin Namba Line
Hankyu Kobe Line
HankyuKoyo Line
Hankyu Imazu Line
HankyuItami Line Hankyu
TakarazukaLine
Hanshin Mukogawa Line
HanshinMain Line
Kobe Rapid TransitRailway Line
Nishidai
Minatogawa
KobeSannomiyaKobeSannomiya
Shin-Kobe
Tanigami
Motomachi
Hokushin Kyuko
Railway Line
ShinkaichiShinkaichi
Kobe Airport
Kansai InternationalAirport
Subway
Sakaisuji Line
Kintetsu Nara Line
Tenjimbashisuji6-chome
Juso
Awaji
Umeda
Esaka
Kita-Osaka Kyuko
Kita-senri
Senri-chuo
Mino-o
OsakaInternational
Airport Ishibashi
Nissei-chuo
Myokenguchi
Takarazuka
Kawanishi-noseguchi
Hyogo Prefecture
Nosé Electric
Railway Line
Koyoen
Nishinomiya-kitaguchi
Shuku-gawa
Imazu
Itami
Mukogawa
Amagasaki
Daimotsu
Tsukaguchi
Imazu
Mukogawadanchi-mae
Osaka-Namba
Osaka Bay
N
Shin
kanse
n
Minatogawa
Shin-OsakaShin-Osaka
OsakaInternational
Airport
Myokenguchi
Subway
Sakaisuji Line
Osaka-Namba
Tsukaguchi
DaimotsuTenjimbashisuji6-chome
Location of Our Business Base
The Hankyu Hanshin Holdings Group’s business base is the Kansai
area, which has a population of approximately 20 million. This is
second only to the Tokyo metropolitan area. Further, the Kansai area
is one of Asia’s economic powerhouses. According to a Cabinet
Office survey*, in fiscal 2015 the Kansai area’s gross production
reached US$734.5 billion, surpassing the combined gross domestic
product of Thailand and Singapore.* Cabinet Office, Report on Prefectural Accounts for the Fiscal Year Ended 31st March 2015
Kansai International AirportThe largest airport in western Japan, this is the Kansai area’s gateway to the world.
Hyogo
Kyoto
Shiga
Osaka
Wakayama
Nara
Kobe City
KyotoCity
Osaka City
Tokyo
Areas of high population densities
Survey of prospective condominium purchasers regarding their preferred Kansai residential area, conducted in fiscal 2017
Ranking Station
1 Nishinomiya-kitaguchi
2 Shukugawa
3 Okamoto
4 Umeda
5 Takarazuka
6 Ashiyagawa
7 Mikage
8 Senri-chuo
9 Toyonaka
10 Ashiya
Source: A survey of prospective condominium purchasers regarding their preferred residential area, conducted by seven major real estate de-velopers (Sumitomo Realty & Development Co., Ltd., Daikyo Incorporated, Tokyu Land Corpora-tion, Tokyo Tatemono Co., Ltd., Nomura Real Estate Development Co., Ltd., Mitsui Fudosan Residential Co., Ltd., and Mitsubishi Jisho Resi-dence Co., Ltd.) and included in a press release dated 29th September 2016Note: indicates the locations of the above
railway stations
With a railway network linking the Kansai area’s major cities—Osaka-
Umeda, Kobe, and Kyoto—the Group has established an unshakable
presence in the Kansai area. Since the earliest days of its railway opera-
tions, the Group has developed housing, entertainment facilities, and
commercial facilities in the areas served by its lines. Further, thanks to
efforts to attract universities, almost 50 universities and colleges are
located in the areas served by our lines. Easy access to the Kansai area’s
major cities and plentiful infrastructure for everyday life make our line-
side areas some of the most popular places to live in the region. A survey
of prospective condominium purchasers regarding their preferred Kansai
residential area conducted in fiscal 2017 reflects this popularity. The
survey revealed that areas centred on the Group’s railway stations
accounted for all of the most popular areas. The above factors have led to
high population densities in our line-side areas, which enable highly
efficient transportation.
Hankyu Hanshin Holdings • Annual Report 20176

HankyuSenriLine
Hankyu Mino-o Line
Osaka Prefecture
Nara Prefecture
Kintetsu-Nara
Hankyu Kyoto Line
Arashiyama
Kawaramachi
Kyoto
Kyoto Prefecture
Katsura
Hankyu Arashiyama Line
Hanshin Namba Line
Hankyu Kobe Line
HankyuKoyo Line
Hankyu Imazu Line
HankyuItami Line Hankyu
TakarazukaLine
Hanshin Mukogawa Line
HanshinMain Line
Kobe Rapid TransitRailway Line
Nishidai
Minatogawa
KobeSannomiyaKobeSannomiya
Shin-Kobe
Tanigami
Motomachi
Hokushin Kyuko
Railway Line
ShinkaichiShinkaichi
Kobe Airport
Kansai InternationalAirport
Subway
Sakaisuji Line
Kintetsu Nara Line
Tenjimbashisuji6-chome
Juso
Awaji
Umeda
Esaka
Kita-Osaka Kyuko
Kita-senri
Senri-chuo
Mino-o
OsakaInternational
Airport Ishibashi
Nissei-chuo
Myokenguchi
Takarazuka
Kawanishi-noseguchi
Hyogo Prefecture
Nosé Electric
Railway Line
Koyoen
Nishinomiya-kitaguchi
Shuku-gawa
Imazu
Itami
Mukogawa
Amagasaki
Daimotsu
Tsukaguchi
Imazu
Mukogawadanchi-mae
Osaka-Namba
Osaka Bay
N
Shin
kanse
n
Minatogawa
Shin-OsakaShin-Osaka
OsakaInternational
Airport
Myokenguchi
Subway
Sakaisuji Line
Osaka-Namba
Tsukaguchi
DaimotsuTenjimbashisuji6-chome
5 km
KyotoJapan’s iconic tourism destination, Kyoto welcomes 50 million visitors from other parts of Japan and from overseas every year.
Hankyu Railway Network 143.6 km
Kobe Line 46.9 km (Kobe Line, Imazu Line, Itami Line, Koyo Line)
Takarazuka Line 28.5 km (Takarazuka Line, Mino-o Line)
Kyoto Line 65.4 km (Kyoto Line, Senri Line, Arashiyama Line)
Kobe Rapid Transit Railway Line 2.8 km
Hanshin Electric Railway Network 48.9 km
Hanshin Line 43.9 km ( Hanshin Main Line, Hanshin Namba Line,
Mukogawa Line)
Kobe Rapid Transit Railway Line 5.0 km
Average number of passengers per day using stations of private (non-JR) railway operators in fiscal 2017(Thousands of people)
Odakyu Shinjuku Station
Seibu Ikebukuro Station
Hanshin Umeda Station
Keio Shinjuku Station
Hankyu Umeda Station
Tokyu Shibuya Station
505
1,149
770
500
485
164
Source: Prepared by the Group based on documents released by respective companies
UmedaThe Group’s most important base, the Umeda area, is the Kansai economic bloc’s hub and one of Japan’s most popular shopping and entertainment districts.
Hankyu Hanshin Holdings • Annual Report 2017 7

(Millions of yen)
FY 2008 2009 2010 2011 2012 2013 2014 2015 20168 2017
Result of Operations:
Revenues from operations ¥ 752,300 ¥ 683,715 ¥ 653,287 ¥ 638,770 ¥ 649,703 ¥ 682,439 ¥ 679,157 ¥ 685,906 ¥ 746,792 ¥ 736,763
Operating income 90,724 77,823 70,126 64,743 73,809 87,921 91,828 94,026 110,293 104,058
EBITDA1 145,200 135,300 133,200 127,100 133,500 145,100 149,200 150,100 166,500 159,300
Ordinary income 74,882 57,445 50,409 46,494 65,393 74,914 81,191 85,590 104,479 100,607
Income before income taxes 26,098 34,064 33,899 32,760 43,419 62,192 83,542 77,620 96,087 100,805
Net income attributable to owners of the parent 627 20,550 10,793 18,068 39,252 39,702 46,352 54,201 69,971 71,302
Comprehensive income — — 12,541 14,728 44,992 54,081 55,941 71,034 63,842 79,288
Capital expenditure 134,307 109,688 132,386 68,431 55,267 59,512 80,722 68,115 66,639 86,212
Depreciation and amortisation 51,577 54,798 60,418 59,669 56,968 54,540 54,474 53,143 53,701 52,800
Cash Flows:
Cash flows from operating activities ¥ 74,902 ¥ 108,597 ¥ 146,955 ¥ 103,252 ¥ 124,525 ¥ 127,655 ¥ 146,991 ¥ 131,881 ¥ 124,838 ¥ 115,633
Cash flows from investing activities (100,058) (115,047) (132,737) (62,516) (44,295) (58,923) (45,517) (52,529) (78,843) (84,845)
Free cash flow2 (25,155) (6,449) 14,217 40,735 80,230 68,732 101,474 79,352 45,995 30,788
Cash flows from financing activities 36,718 7,014 (24,200) (39,544) (78,978) (69,195) (105,079) (81,746) (47,278) (30,595)
Financial Position:
Total assets ¥2,348,476 ¥2,307,332 ¥2,337,331 ¥2,314,669 ¥2,274,380 ¥2,281,007 ¥2,286,928 ¥2,279,638 ¥2,282,180 ¥2,349,831
Total net assets 476,639 473,878 480,633 486,947 524,801 573,154 617,598 679,482 724,237 804,659
Interest-bearing debt 1,271,100 1,275,620 1,282,583 1,251,665 1,183,647 1,126,633 1,032,307 955,828 916,570 899,523
Per Share Data (Yen):
Net income attributable to owners of the parent
Basic ¥ 0.50 ¥ 16.28 ¥ 8.55 ¥ 14.32 ¥ 31.13 ¥ 31.48 ¥ 36.76 ¥ 42.98 ¥ 277.88 ¥ 285.11
Diluted 0.41 16.18 8.51 14.27 31.13 31.47 36.75 42.95 277.67 284.86
Net assets 369.25 366.96 371.70 377.17 407.01 443.63 477.69 525.56 2,815.96 3,150.67
Dividend 5.00 5.00 5.00 5.00 5.00 5.00 6.00 6.00 35.00 35.00
Ratios:
Operating income margin (%) 12.1 11.4 10.7 10.1 11.4 12.9 13.5 13.7 14.8 14.1
ROA (%)3 3.2 2.5 2.2 2.0 2.8 3.3 3.6 3.7 4.6 4.3
ROE (%)4 0.1 4.4 2.3 3.8 7.9 7.4 8.0 8.6 10.3 9.4
Interest-bearing debt/EBITDA (Times) 8.8 9.4 9.6 9.8 8.9 7.8 6.9 6.4 5.5 5.6
Equity ratio (%) 19.9 20.1 20.1 20.6 22.6 24.5 26.3 29.1 31.0 33.5
Debt/equity (D/E) ratio (Times)5 2.7 2.8 2.7 2.6 2.3 2.0 1.7 1.4 1.3 1.1
Stock Price Index:
Stock price at the end of fiscal year (Yen) ¥ 431 ¥ 447 ¥ 433 ¥ 384 ¥ 361 ¥ 569 ¥ 562 ¥ 743 ¥ 718 ¥ 3,620
Market capitalisation (¥ billion) 5,480 5,683 5,505 4,882 4,590 7,234 7,145 9,447 9,129 9,205
PER (Times) 862.0 27.5 50.6 26.8 11.6 18.1 15.3 17.3 12.9 12.7
PBR (Times) 1.2 1.2 1.2 1.0 0.9 1.3 1.2 1.4 1.3 1.1
Business Data:
Hankyu Railway (Thousand)6 618,373 618,585 605,963 603,233 608,632 615,324 629,125 627,536 644,563 647,369
Hanshin Electric Railway (Thousand)6 180,906 182,997 193,620 205,202 218,560 221,133 226,004 227,203 234,226 236,766
Average vacancy rates of rental office buildings (Umeda area, Osaka; %)7 3.08 5.88 8.90 11.22 7.29 11.50 9.22 7.84 5.54 3.20
Key Financial Indicators
Performance Highlights (Consolidated)
1. EBITDA = operating income + depreciation expenses + amortisation of goodwill EBITDA figures are rounded to the nearest ¥100 million.
2. Free cash flow = cash flows from operating activities + cash flows from investing activities3. ROA = ordinary income / total assets (average of period-start and period-end totals)4. ROE = net income attributable to owners of the parent / equity (average of period-start and period-end totals)5. D/E ratio = interest-bearing debt / equity6. Annual number of passengers carried7. Average vacancy rate figures are overall rates for the Umeda city centre area at the end of March for major rental office buildings (including properties not owned by the Group) with a
total floor area of at least 3,300 m2 and are based on “Latest Trends in the Office-Building Market in Osaka,” Miki Shoji, “Office Data.”8. Regarding transactions related to such items as the export of mixed cargo of the International Transportation Business, the Company has changed the recognition of revenues from
operations from net presentation to gross presentation as of fiscal 2017. As a result of this change, the amount of revenues from operations for fiscal 2016 is the amount after retrospec-tive application (gross presentation). Further, the Company consolidated shares at the ratio of 5 shares to 1 share with an effective date of 1st August 2016. Net income per share, diluted net income attributable to owners of the parent per share, net assets per share, and dividend per share have been calculated based on the assumption that the said reverse stock split was executed on 1st April 2015.
Hankyu Hanshin Holdings • Annual Report 20178

(Millions of yen)
FY 2008 2009 2010 2011 2012 2013 2014 2015 20168 2017
Result of Operations:
Revenues from operations ¥ 752,300 ¥ 683,715 ¥ 653,287 ¥ 638,770 ¥ 649,703 ¥ 682,439 ¥ 679,157 ¥ 685,906 ¥ 746,792 ¥ 736,763
Operating income 90,724 77,823 70,126 64,743 73,809 87,921 91,828 94,026 110,293 104,058
EBITDA1 145,200 135,300 133,200 127,100 133,500 145,100 149,200 150,100 166,500 159,300
Ordinary income 74,882 57,445 50,409 46,494 65,393 74,914 81,191 85,590 104,479 100,607
Income before income taxes 26,098 34,064 33,899 32,760 43,419 62,192 83,542 77,620 96,087 100,805
Net income attributable to owners of the parent 627 20,550 10,793 18,068 39,252 39,702 46,352 54,201 69,971 71,302
Comprehensive income — — 12,541 14,728 44,992 54,081 55,941 71,034 63,842 79,288
Capital expenditure 134,307 109,688 132,386 68,431 55,267 59,512 80,722 68,115 66,639 86,212
Depreciation and amortisation 51,577 54,798 60,418 59,669 56,968 54,540 54,474 53,143 53,701 52,800
Cash Flows:
Cash flows from operating activities ¥ 74,902 ¥ 108,597 ¥ 146,955 ¥ 103,252 ¥ 124,525 ¥ 127,655 ¥ 146,991 ¥ 131,881 ¥ 124,838 ¥ 115,633
Cash flows from investing activities (100,058) (115,047) (132,737) (62,516) (44,295) (58,923) (45,517) (52,529) (78,843) (84,845)
Free cash flow2 (25,155) (6,449) 14,217 40,735 80,230 68,732 101,474 79,352 45,995 30,788
Cash flows from financing activities 36,718 7,014 (24,200) (39,544) (78,978) (69,195) (105,079) (81,746) (47,278) (30,595)
Financial Position:
Total assets ¥2,348,476 ¥2,307,332 ¥2,337,331 ¥2,314,669 ¥2,274,380 ¥2,281,007 ¥2,286,928 ¥2,279,638 ¥2,282,180 ¥2,349,831
Total net assets 476,639 473,878 480,633 486,947 524,801 573,154 617,598 679,482 724,237 804,659
Interest-bearing debt 1,271,100 1,275,620 1,282,583 1,251,665 1,183,647 1,126,633 1,032,307 955,828 916,570 899,523
Per Share Data (Yen):
Net income attributable to owners of the parent
Basic ¥ 0.50 ¥ 16.28 ¥ 8.55 ¥ 14.32 ¥ 31.13 ¥ 31.48 ¥ 36.76 ¥ 42.98 ¥ 277.88 ¥ 285.11
Diluted 0.41 16.18 8.51 14.27 31.13 31.47 36.75 42.95 277.67 284.86
Net assets 369.25 366.96 371.70 377.17 407.01 443.63 477.69 525.56 2,815.96 3,150.67
Dividend 5.00 5.00 5.00 5.00 5.00 5.00 6.00 6.00 35.00 35.00
Ratios:
Operating income margin (%) 12.1 11.4 10.7 10.1 11.4 12.9 13.5 13.7 14.8 14.1
ROA (%)3 3.2 2.5 2.2 2.0 2.8 3.3 3.6 3.7 4.6 4.3
ROE (%)4 0.1 4.4 2.3 3.8 7.9 7.4 8.0 8.6 10.3 9.4
Interest-bearing debt/EBITDA (Times) 8.8 9.4 9.6 9.8 8.9 7.8 6.9 6.4 5.5 5.6
Equity ratio (%) 19.9 20.1 20.1 20.6 22.6 24.5 26.3 29.1 31.0 33.5
Debt/equity (D/E) ratio (Times)5 2.7 2.8 2.7 2.6 2.3 2.0 1.7 1.4 1.3 1.1
Stock Price Index:
Stock price at the end of fiscal year (Yen) ¥ 431 ¥ 447 ¥ 433 ¥ 384 ¥ 361 ¥ 569 ¥ 562 ¥ 743 ¥ 718 ¥ 3,620
Market capitalisation (¥ billion) 5,480 5,683 5,505 4,882 4,590 7,234 7,145 9,447 9,129 9,205
PER (Times) 862.0 27.5 50.6 26.8 11.6 18.1 15.3 17.3 12.9 12.7
PBR (Times) 1.2 1.2 1.2 1.0 0.9 1.3 1.2 1.4 1.3 1.1
Business Data:
Hankyu Railway (Thousand)6 618,373 618,585 605,963 603,233 608,632 615,324 629,125 627,536 644,563 647,369
Hanshin Electric Railway (Thousand)6 180,906 182,997 193,620 205,202 218,560 221,133 226,004 227,203 234,226 236,766
Average vacancy rates of rental office buildings (Umeda area, Osaka; %)7 3.08 5.88 8.90 11.22 7.29 11.50 9.22 7.84 5.54 3.20
Key Financial Indicators
Net income attributable to owners of the parent: ¥71.3 billion (up 1.9%, or ¥1.3 billion, from the previous fiscal year)Net non-operating loss (total non-operating expenses net of total non-operating income)
declined ¥2.4 billion, year on year, to ¥3.5 billion, due to an increase in equity in income of
affiliates. Total extraordinary income net of total extraordinary loss was ¥0.2 billion, an
improvement compared with the previous fiscal year’s loss of ¥8.6 billion. This
improvement reflected decreases in losses on revaluation of investment securities and in
impairment loss.
Due to the above, net income attributable to owners of the parent increased 1.9%, or
¥1.3 billion, year on year, to ¥71.3 billion.
Net income attributable to owners of the parent: Factor analysis (YoY change)
Improvement in total extraordinary income net of total extraordinary loss +¥8.6 billion
Increase in equity in income of affiliates +¥2.9 billion
Increase in total income taxes –¥3.4 billion
Decrease in operating income –¥6.2 billion
Interest-bearing debt: ¥899.5 billion (down 1.9%, or ¥17.0 billion, from the previous fiscal year-end)The outstanding balance of interest-bearing debt at the end of the fiscal year under
review amounted to ¥899.5 billion, a decrease of 1.9%, or ¥17.0 billion, from the previous
fiscal year-end. This was because free cash flow was used to repay interest-bearing debt.
Performance Highlights (Consolidated)
Note: Billions of yen figures are rounded to one decimal place.
Revenues from operations8: ¥736.8 billion (down 1.3%, or ¥10.0 billion, from the previous fiscal year)Operating income: ¥104.1 billion (down 5.7%, or ¥6.2 billion, from the previous fiscal year)The Group recorded year-on-year declines of 1.3%, or ¥10.0 billion, in revenues from
operations, to ¥736.8 billion, and 5.7%, or ¥6.2 billion, in operating income, to ¥104.1
billion, due to the sale of land for facilities in the Real Estate Business in the previous fiscal
year and the lower yen-equivalent value of revenues and earnings in the International
Transportation Business.
Operating income: Factor analysis (YoY change)(¥ million)
FY2016
FY2017
Urban Transportation +967
+354
–43
–200
–502
–7,881
+372
+698
104,058
110,293
Entertainment and Communications
Travel
International Transportation
Hotels
Real Estate
Other
Adjustment
Hankyu Hanshin Holdings • Annual Report 2017 9

Key Financial Indicators (Graphs)
Operating income Operating income margin (right axis)
Net income attributable to owners of the parent ROE (right axis)
Revenues from operations decreased 1.3%, or ¥10.0 billion, year on year, to ¥736.8 billion, due to the sale of land for facilities in the Real Estate Business in the previous fiscal year and the lower yen-equivalent value of revenues and earnings in the International Transportation Business.
Operating income was down 5.7%, or ¥6.2 billion, year on year, to ¥104.1 billion, due to the above-mentioned decrease in revenues from operations and lower revenues from the accommodation and banquet areas in the Hotels Business.
Operating income decreased 5.7%, or ¥6.2 billion, year on year, to ¥104.1 billion; depreciation and am-ortisation declined 1.7%, or ¥0.9 billion, to ¥52.8 bil-lion; and amortisation of goodwill declined 1.8%, to ¥2.4 billion. As a result, EBITDA was ¥159.3 billion.
Total income taxes were up from the previous fiscal year, but higher income before income taxes caused net income attributable to owners of the parent to increase 1.9%, or ¥1.3 billion, year on year, to ¥71.3 billion, breaking the previous record for the sixth consecutive year. Due to higher equity, ROE decreased 0.9 percentage point, to 9.4%.
Revenues from operations(¥ billion)
Operating income and operating income margin(¥ billion) (%)
Net income attributable to owners of the parent and ROE(¥ billion) (%)
EBITDA(¥ billion)
Performance Highlights (Consolidated)
752.3683.7 653.3 638.8 649.7 682.4 679.2 685.9
736.8746.8
0
300
600
900
1708 09 10 11 12 13 14 15 16
77.890.7
11.412.1 70.1
10.7
64.7
10.1
73.8
11.4
87.9
12.9
91.8
13.5
94.0
110.3104.1
13.7
14.114.8
0
40
80
120
0
7
14
21
1708 09 10 11 12 13 14 15 16
0
4
8
12
16
20.6
0.6
4.410.8
2.3
18.13.8
39.3
7.9
39.7
7.4
46.4
8.0
54.2
8.6
70.0 71.3
9.410.3
0.10
20
40
60
80
1708 09 10 11 12 13 14 15 16
0
60
120
180
135.3 133.2 127.1 133.5145.1 149.2 150.1
166.5 159.3145.2
1708 09 10 11 12 13 14 15 16 (FY)
(FY)
(FY)
(FY)
Hankyu Hanshin Holdings • Annual Report 201710

Total assets ROA (right axis)
Interest-bearing debt D/E ratio (right axis) Interest-bearing debt/EBITDA (right axis)
Dividend per share Total payout ratio (right axis) Notes: The total payout ratio for fiscal 2017 includes purchase of treasury stock (amounting to ¥9.1 billion).
The Company conducted a 1-for-5 reverse stock split with an effective date of 1st August 2016. The figures for dividend per share above are after the reverse stock split.
Net cash provided by operating activities Net cash used in investing activities Free cash flow
Total assets rose ¥67.7 billion from the previous fiscal year-end, to ¥2,349.8 billion, due to an increase in construction in progress. ROA edged down 0.3 per-centage point, to 4.3%, reflecting lower ordinary income.
The outstanding balance of interest-bearing debt at the end of the fiscal year under review amounted to ¥899.5 billion, a decrease of 1.9%, or ¥17.0 billion, from the previous fiscal year-end. As a result, the Group reduced interest-bearing debt to less than ¥900 billion ahead of the previous medium-term management plan’s schedule, which envisaged achieving this by the end of fiscal 2019. Conse-quently, the D/E ratio decreased to 1.1 times. Further, the interest-bearing debt/EBITDA ratio was 5.6 times, remaining below 6 times for the second con-secutive fiscal year.
Net cash provided by operating activities was ¥115.6 billion, reflecting income before income taxes, de-preciation and amortisation, and income taxes paid. Net cash used in investing activities was ¥84.8 billion due to purchases of noncurrent assets. Net cash used in financing activities was ¥30.6 billion as a result of redemption of bonds.
The Company’s basic policy is to pay stable annual dividends and acquire treasury stock with a total payout ratio (the total of purchases of treasury stock and the total annual dividend as a percentage of net income attributable to owners of the parent) of 25% as a target. Regarding dividend payments from profits in fiscal 2017, the Company paid a dividend of ¥35 per share, which was the same as the divi-dend paid in the previous fiscal year. The Company purchased treasury stock (amounting to ¥9.1 billion) based on the target of a total payout ratio of 25%.
Total assets and ROA(¥ trillion) (%)
Interest-bearing debt, D/E ratio, and interest-bearing debt/EBITDA(¥ trillion) (Times)
Cash flows(¥ billion)
Returns to shareholders(Yen) (%)
Performance Highlights (Consolidated)
2.312.35 2.34 2.31 2.27 2.28 2.29 2.28 2.35
0
2
4
6
0
1
2
3
2.5
3.2
2.2 2.02.8
3.33.6
3.7 4.3
2.284.6
1708 09 10 11 12 13 14 15 16
1.28
2.82.7
8.8 9.4
1.28
9.6
2.7
1.25
9.8
2.6
1.18
8.9
2.3
1.13
7.8
2.0
1.03
6.9
1.7
0.960.900.92
6.4
1.4
5.65.5
1.11.3
1.27
0
0.5
1.0
1.5
0
5
10
15
1708 09 10 11 12 13 14 15 16
–25.2–6.4
14.240.7
80.2 68.7101.5
79.4
–100.1
–115.0
–132.7
–62.5–44.3 –58.9 –45.5 –52.5
74.9108.6
147.0
103.3124.5 127.7
147.0 131.9
30.846.0
–84.8–78.8
124.8 115.6
–200
–150
–10
–50
0
50
100
150
1708 09 10 11 12 13 14 15 16
30.7
1,000.0
58.5
34.9
16.1 15.9 16.3 14.0 25.025.0
5.00 5.00 5.00 5.00 5.00 5.006.00 6.00
35.00 35.00
0
15
30
45
60
1,000
0
10.00
20.00
30.00
40.00
50.00
1708 09 10 11 12 13 14 15 16 (FY)
(FY)
(FY)
(FY)
Hankyu Hanshin Holdings • Annual Report 2017 11

ESG Highlights
Environmental Factors
In fiscal 2016, overall emissions were down 1.0% year on year, to 642,366 t-CO2. While CO2 emissions jumped in fiscal 2013, this rise was the result of an increase in the portion of electricity supplied from thermal power generation after the halt in opera-tions of nuclear power plants following the March 2011 Great East Japan Earthquake. Further, energy consumption on a crude oil- conversion basis decreased for the fifth consecutive year as a result of efforts by Group companies to reduce energy consumption. These efforts included measures by Hankyu Corporation and Hanshin Elec-tric Railway to switch to light-emitting diode (LED) lighting in railway stations and other facilities and to introduce more new rolling stock with better energy efficiency than existing rolling stock.
CO2 emissions volumes and energy consumption on crude oil-conversion basis(t-CO2) (kl)
Urban Transportation Real Estate Entertainment and Communications Travel International Transportation Hotels Other Energy consumption on crude oil-conversion basis (right axis)
800,000 800,000
600,000
400,000
200,000
0
600,000
400,000
200,000
0
476,265
602,586658,607 648,955
309,143327,014 320,753 317,491
2012 2013 2014 2015
642,366
302,303
2016
Social Factors
As a railway operator, the Group provides a form of public infrastructure. We therefore make giving priority to the safety of our customers a fundamen-tal policy of management, and conduct ongoing safety-related capital investments in our railway operations accordingly. In fiscal 2017, such invest-ments totalled ¥12.7 billion at Hankyu Corporation and ¥3.7 billion at Hanshin Electric Railway. These investments were primarily used to conduct station up-grades, including track elevation, seismic reinforce-ment of elevated tracks, expansion of platforms, and measures for making stations barrier-free.
Note: Please see “Safety Initiatives in the Railway Business” on pages 64–67 of this report.
Capital investment in railway operations(¥ billion)
Safety-related capital investment Other capital investmentNote: The total length of lines operated is 143.6 km for Hankyu Corporation and 48.9 km for Hanshin Electric Railway.
0
25
20
15
10
5
Hankyu Hanshin2013
Hankyu Hanshin2014
Hankyu Hanshin2015
Hankyu Hanshin2016
Hankyu Hanshin2017
11.4
2.9
3.8
1.2
13.7
1.8
4.9
1.5
16.1
3.3
4.0 4.4 3.7
1.1
13.0 12.7
2.8 3.3
0.6 0.9
(FY)
The Group has been endeavouring to lower its elec-tricity consumption over the peak usage months from July to September. As a result, total electricity consumption from July to September 2016 was 261,738 kWh, down 0.2% year on year (a decrease of approximately 15% from the equivalent period in 2010, before the Great East Japan Earthquake).
Electricity consumption during summer months (July–September)(Thousand kWh)
Note: Figures above are for Hankyu Hanshin Holdings, Inc., and its domestic consolidated subsidiaries, but exclude certain business sites for which electricity consumption is difficult to track.
300,000
285,000
270,000
255,000
0
20172013 2014 2015 2016
281,759277,219
268,581
262,261 261,738
(FY)
(FY)
Hankyu Hanshin Holdings • Annual Report 201712

Governance Factors
To support external directors and external Audit & Supervisory Board members, the Company has established secretariats for the Board of Directors and the Audit & Supervisory Board. In particular, the Company has appointed to the secretariat of the Audit & Supervisory Board dedicated personnel who provide information to Board members and liaise with relevant in-house departments and divisions. The Company provides external directors and exter-nal Audit & Supervisory Board members with infor-mation about the Company’s businesses, financial position, and organisations mainly at meetings of the Corporate Governance Committee. Also, the secretariat of the Board of Directors sends Board members documents detailing agenda items for submission to the Board of Directors, in principle, seven days prior to the dates of meetings.
Rate of attendance of external directors and external Audit & Supervisory Board members at meetings of the Audit & Supervisory Board and the Board of Directors(%)
2014 2015 2016 20172013
96.3 96.7 96.7
90.085.083.3 85.0
65.0
96.7 100.0
97.2 97.2 97.297.297.2
0
20
40
60
80
100
The General Meeting of Shareholders held in June 2017 approved a reduction in the number of direc-tors from 14 to nine, thereby increasing the propor-tion of external directors. Five directors of the Company concurrently serve as directors of Group companies to ensure that business management reflects viewpoints from the Group’s operations. In addition, two of the Company’s part-time directors have been appointed from H2O Retailing Corpora-tion and Toho Co., Ltd., with the aim of strengthen-ing coordination with other companies in the Hankyu Hanshin Toho Group.
Membership of the Board of Directors(People)
Directors with operational execution responsibilities Internal directors without operational execution responsibilities Independent external directors
0
15
10
5
20172013 2014 2015 2016
7
5
6
5
6
5
6
6
22 2
2
3
4
2
The Group conducts a variety of activities focused on its line-side areas in accordance with a basic policy of creating towns and cities that people will truly want to live in. Particularly popular among local residents are programmes that take advantage of the unique business expertise of Group companies to provide primary school students with opportuni-ties to experience a diverse range of workplaces. Since we began this initiative in 2010, we have in-vited 12,404 students to participate in programmes from an aggregate total of roughly 92,000 applica-tions. In fiscal 2017, these activities received a special commendation from the judges of an award recog-nising companies that offer experiential activities for young people, organised by the Ministry of Educa-tion, Culture, Sports, Science and Technology.
Note: Please see “CSR and Corporate Value Enhancement” on pages 30–33 of this report.
Number of programmes and participants of the Hankyu Hanshin Dreams and Communities Challenge Troop(Programmes) (Participants)
Programmes Invited participants (right axis)
0
50 3,000
1,500
0
25
20122011 2012 2014 2015 2016 2017 2018
2,6282,6022,501
2,024
1,200
600445404
45 4543
3936
27
1713
(FY)
(FY)
ESG Highlights
External directors, Board of Directors’ meetings External Audit & Supervisory Board members, Board of Directors’ meetings External Audit & Supervisory Board members, Audit & Supervisory Board meetings
(As of the conclusion of the General Meeting of Shareholders for each fiscal year)
Hankyu Hanshin Holdings • Annual Report 2017 13

Kazuo SumiIn June 2017, appointed Chairman and Representative Director, Group Chief Executive Officer
Takehiro SugiyamaIn June 2017, appointed President and Representative Director
To Our Stakeholders
Aiming to be a corporate group that continues growing amid social change, we recently established Long-Term Management Vision for 2025. We will steadily advance various measures to realise this vision, thereby enhancing corporate value continually.
Hankyu Hanshin Holdings • Annual Report 201714
Fiscal 2017 business results overview (Billions of yen)
FY2017 results FY2016 resultsYoY
Increase / Decrease (%)
Revenues from operations 736.8 746.8 –10.0 –1.3
Operating income 104.1 110.3 –6.2 –5.7
Ordinary income 100.6 104.5 –3.9 –3.7
Net income attributable to owners of the parent 71.3 70.0 1.3 1.9
Interest-bearing debt 899.5 916.6 –17.0 –1.9
Interest-bearing debt/EBITDA ratio (Times) 5.6 5.5 0.1 pt
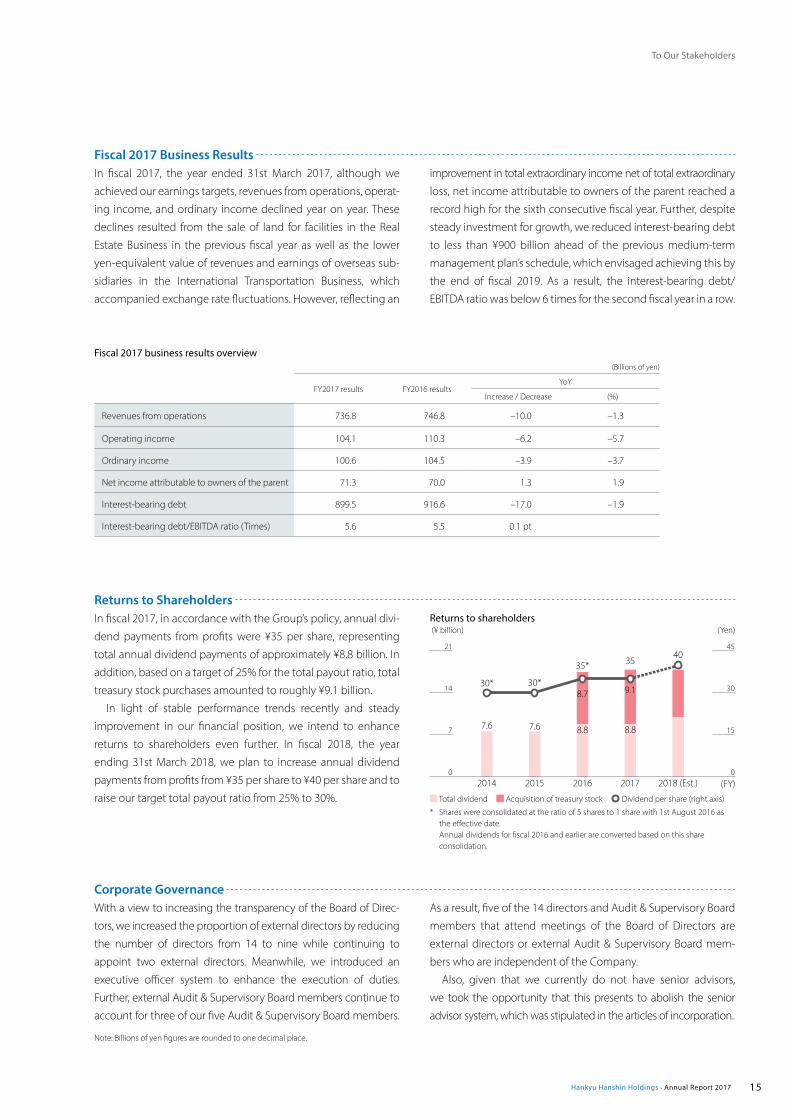
Returns to shareholders (¥ billion) (Yen)
2018 (Est.)2014 20172015 2016
7.6
30* 30*
35* 3540
7.6 8.8 8.8
9.18.7
0
7
14
21
(FY)0
15
30
45
Total dividend Acquisition of treasury stock Dividend per share (right axis)
* Shares were consolidated at the ratio of 5 shares to 1 share with 1st August 2016 as the effective date.
Annual dividends for fiscal 2016 and earlier are converted based on this share consolidation.
Fiscal 2017 Business Results In fiscal 2017, the year ended 31st March 2017, although we
achieved our earnings targets, revenues from operations, operat-
ing income, and ordinary income declined year on year. These
declines resulted from the sale of land for facilities in the Real
Estate Business in the previous fiscal year as well as the lower
yen-equivalent value of revenues and earnings of overseas sub-
sidiaries in the International Transportation Business, which
accompanied exchange rate fluctuations. However, reflecting an
improvement in total extraordinary income net of total extra ordinary
loss, net income attributable to owners of the parent reached a
record high for the sixth consecutive fiscal year. Further, despite
steady investment for growth, we reduced interest-bearing debt
to less than ¥900 billion ahead of the previous medium-term
management plan’s schedule, which envisaged achieving this by
the end of fiscal 2019. As a result, the interest-bearing debt/
EBITDA ratio was below 6 times for the second fiscal year in a row.
Returns to Shareholders In fiscal 2017, in accordance with the Group’s policy, annual divi-
dend payments from profits were ¥35 per share, representing
total annual dividend payments of approximately ¥8.8 billion. In
addition, based on a target of 25% for the total payout ratio, total
treasury stock purchases amounted to roughly ¥9.1 billion.
In light of stable performance trends recently and steady
improvement in our financial position, we intend to enhance
returns to shareholders even further. In fiscal 2018, the year
ending 31st March 2018, we plan to increase annual dividend
payments from profits from ¥35 per share to ¥40 per share and to
raise our target total payout ratio from 25% to 30%.
Corporate Governance With a view to increasing the transparency of the Board of Direc-
tors, we increased the proportion of external directors by reducing
the number of directors from 14 to nine while continuing to
appoint two external directors. Meanwhile, we introduced an
executive officer system to enhance the execution of duties.
Further, external Audit & Supervisory Board members continue to
account for three of our five Audit & Supervisory Board members.
As a result, five of the 14 directors and Audit & Supervisory Board
members that attend meetings of the Board of Directors are
external directors or external Audit & Supervisory Board mem-
bers who are independent of the Company.
Also, given that we currently do not have senior advisors,
we took the opportunity that this presents to abolish the senior
advisor system, which was stipulated in the articles of incorporation.
To Our Stakeholders
Note: Billions of yen figures are rounded to one decimal place.
Hankyu Hanshin Holdings • Annual Report 2017 15

To Our Stakeholders
Background to the Establishment of a Long-Term Vision Overview of the Group’s Current PositionMore than 10 years have passed since the management integra-
tion of Hankyu Holdings and Hanshin Electric Railway. During
this period, we have reorganised operations in respective busi-
ness areas. The many integration benefits that have resulted
from this reorganisation as well as the progress of large projects
have given us one of the highest levels of operating income
among major private (non-JR) railway operators. Meanwhile, our
financial position is improving steadily thanks to interest-bearing
debt reduction. Among major private (non-JR) railway operators,
we have an industry-leading interest-bearing debt/EBITDA ratio.
In fiscal 2017, the Group posted operating income of ¥104.1
billion. Breaking this down by business area (Umeda and line-
side areas versus the Tokyo metropolitan area and overseas)
and by business model (“stock” businesses*1 versus “flow”
businesses*2), stock businesses in Umeda and line-side areas
currently account for approximately two-thirds of the Group’s
overall operating income. Adding flow businesses shows that
the Group depends on Umeda and line-side areas for more
than 90% of operating income.
Given this situation, whether the Group can sustain growth
going forward while remaining dependent on Umeda and line-
side areas, particularly on stock businesses, is a moot point.
FY2017 Operating income
¥104.1 billion
Tokyo metropolitan area and overseas markets + Flow businesses
Umeda and line-side areas
+ Flow
businesses
Umeda and line-side areas +
Stock businesses 2/3 of the Group’s overall
operating income
Tokyo metropolitan area and overseas markets + Stock businesses
*1 Businesses that own or use such stock as property and other fixed assets (including the railway business, real estate leasing business, broadcast and communications business, and Hotels Business)
*2 Businesses that, instead of owning large-scale stock, use business know-how, human resources, brand assets, and other intangible assets (including the real estate sales business and other businesses, sports business, stage business, information services business, Travel Business, and International Transportation Business)
Businesses in Umeda
and line-side areas
generate 90% of operating income.
Hankyu Hanshin Holdings • Annual Report 201716

To Our Stakeholders
Changes in Future Business ConditionsNaturally, the external environment will change going forward.
In particular, the decline in Japan’s population is expected to
accelerate from 2025. In 2040, the Kansai area’s population is
projected to be 16% lower than it was in 2015. Further, due to a
continuous rise in the population group aged 65 or above, soci-
ety will become increasingly aged as 2040 approaches.
Consequently, there will be fewer consumers of the Group’s
products and services. Moreover, higher workforce participation
by women and the elderly could reduce the time available for
consumption and leisure activities. Meanwhile, securing employ-
ees will become more problematic as supply tightens in the
labour market. As the above trends advance, they will inevitably
have a correspondingly negative effect across a range of busi-
nesses in the Group. Given this scenario, remaining significantly
dependent on stock businesses in Umeda and line-side areas
would expose the Group to risk. Therefore, we must slough off
over-reliance on these areas.
On the other hand, not all changes in business conditions will
impact the Group negatively. Various factors will bring
opportunities. One such factor is demand from overseas visitors
to Japan. The past several years have seen a steep rise in the
number of overseas visitors to Japan, with the increase being
particularly dramatic in the Kansai area. This increase has
contributed significantly to the growth of our railway operation
revenue and earnings from the Hotels Business. Japan’s
government aims to increase the number of overseas visitors
to Japan from 2016’s level of 24 million to 40 million by 2020
and 60 million by 2030. Thus, demand promises to continue
robust growth.
Further, our line-side areas enjoy advantages over other line-
side areas in the Kansai area. They are comparatively close to
such international hubs as Osaka International Airport and
Kobe Airport as well as to Shin-Osaka Station, which provides
access to the Kansai area from the Tokyo–Nagoya–Osaka axis.
Also, our line-side areas are seeing steady progress in the
development of road and rail infrastructure. For example, a new
direct rail link between the Umeda area and Kansai International
Airport is planned.
Population of the Kansai area(Millions of people) (%)
204020252015 2020
17.515.4
18.3
58.5 53.5
27.6 29.8 30.836.7
18.0
(CY)0
5
10
15
20
0
20
40
60
80
60.0 58.7
Total population Average working-age population percentage (right axis) Average elderly population percentage (right axis)
Source: National Institute of Population and Social Security Research, “Population Projection for Japan by Prefectures”
Note: “The Kansai area” comprises Osaka, Kyoto, Hyogo, and Nara prefectures.
Overseas visitors to Japan(Millions of people)
2030Target
2020Target
2013 2014 201620150
20
40
60
80
(CY)
10.43.5 4.8 7.9
10.2 18.013.419.7
24.0
40.0
60.0
Overseas visitors to Japan (total) Overseas visitors to the Kansai areaSources: Japan National Tourism Organization (JNTO), “Visitors Arrivals, Japanese Overseas
Travellers”; Japan Tourism Agency, “Consumption Trend Survey for Foreigners Visiting Japan”; KANSAI Tourism Bureau, “Kansai International Tourism Policy 2016–2018”
Note: Overseas visitors to the Kansai area have been calculated based on the numbers of overseas visitors to Japan announced by JNTO, the “Consumption Trend Survey for Foreigners Visiting Japan” of the Japan Tourism Agency, and overseas visitors to the Kansai area as percentages of overseas visitors to Japan, which are included in the “Kansai International Tourism Policy 2016–2018” of the KANSAI Tourism Bureau.
Hankyu Hanshin Holdings • Annual Report 2017 17

204020252015 2020
35.232.3
35.9
1.01.1 1.2
1.2
35.7
(CY)0
10
20
30
40
0
0.4
0.8
1.2
1.6
Population of the Tokyo metropolitan area and Tokyo’s five central business districts(Millions of people) (Millions of people)
Total population of the Tokyo metropolitan area Population of Tokyo’s five central business districts (right axis)
Sources: National Institute of Population and Social Security Research, “Population Pro-jection for Japan by Prefectures”; Tokyo Metropolitan Government Bureau of General Affairs, “Population Projection for Tokyo by Ward, City, Town, and Village”
Note: “The Tokyo metropolitan area” comprises Saitama, Chiba, Tokyo, and Kanagawa prefectures.
204020252015 2020
698.9768.7
633.4 667.6
(As of 1st July of each year)
0
200
400
600
800
Population of the ASEAN region(Millions of people)
Source: United Nations, “World Population Prospects: The 2017 Revision” Note: The medium variant has been used.
Meanwhile, the real estate leasing business will lead efforts to
increase our presence in Tokyo’s five central business districts (Chi-
yoda, Chuo, Minato, Shinjuku, and Shibuya), which are expected to
still have their current population levels in the 2040s. Overseas,
we are making forays into the ASEAN region, where population
growth and strong economic growth are likely to continue.
If we can deftly capitalise on the business opportunities
accompanying such changes in business conditions and tap into
the ASEAN region’s growth, we can realign our line-side areas.
Particularly with respect to the Umeda area, we can develop
from “Umeda in Kansai” into “Umeda in Asia.” Also, the Tokyo met-
ropolitan area and other countries will offer ample opportunities
to apply the business strengths and expertise that we have
developed over many years in line-side areas.
Other positives include technological advances anticipated
in such fields as artificial intelligence (AI) and the Internet of
Things (IoT). Society is on the brink of a major transformation,
which has been dubbed “the fourth industrial revolution.” By
actively exploiting or repurposing the array of new technolo-
gies emerging from this revolution, our businesses will be able
to curb costs and eliminate labour shortages. In addition, they
will be able to transform existing business models and create
new growth opportunities.
To Our Stakeholders
Hankyu Hanshin Holdings • Annual Report 201718

Kazuo SumiChairman and Representative Director, Group Chief Executive Officer
Takehiro SugiyamaPresident and Representative Director
Establishment of a Long-Term Vision In light of the abovementioned changes in business conditions,
we decided to prepare a long-term vision. Reflecting our
determination to have advanced as a growth-focused corporate
group by fiscal 2026—the 20th anniversary of management
integration—and to continue advancing thereafter, the vision
sets out the company we hope to be in the long term as well as the
basic approach and strategies for achieving this target profile. In
preparing the vision, we outlined the company we hope to be
in fiscal 2026, while to some extent looking ahead to the
significant effect of demographic changes by the 2040s.
Based on the categorisation by business area and business
model mentioned earlier and taking into consideration changes
in business conditions going forward, the long-term vision
describes our target profile and strategies in each category.
The vision sets out four goals based on the company we hope
to be. Stating these goals in order, the vision calls on (1) stock
businesses in Umeda and line-side areas to make our railway the
absolute best among the Kansai networks, (2) stock businesses in
the Tokyo metropolitan area and overseas to construct a stable
revenue base in the Tokyo metropolitan area and overseas
markets, and (3) flow businesses to strengthen competitiveness
by thoroughly pursuing brand optimisation and differentiation.
Lastly, to complement and raise the basic level of efforts focused
on achieving the above goals, the vision calls on (4) businesses to
make greater use of the Group’s collective strength and develop
new business fields. (For details, please see pages 22–25.)
Going forward, the Hankyu Hanshin Holdings Group will
make concerted efforts to steadily advance measures aimed at
realising the above long-term vision, thereby enhancing the
whole Group’s corporate value continually.
September 2017
To Our Stakeholders
Hankyu Hanshin Holdings • Annual Report 2017 19

Special Feature: Long-Term Management Vision for 2025
From Management Integration to the Present Day
The Hankyu Hanshin Holdings Group celebrated its 10th anniversary in October 2016. During this decade, the Group worked unstintingly to enhance overall corporate value. The section below explains 10 years of progress by breaking down our history into three manage-ment phases.
First PhaseAdvancing large projects for growth (fiscal 2007–fiscal 2011)
Immediately after the management integration of Hankyu Holdings and Hanshin Electric Railway, we took measures to realise numerous integration benefits while forging ahead with large projects for growth. Improving its financial position was of course an important task, but the Group made large projects that were in progress before integration the first priority as they promised to generate significant, stable cash flows. These projects included the rebuilding of Umeda Hankyu Building and the implementation of plans for the Hanshin Namba Line. However, the high level of development investment accompanying such projects pushed up interest-bearing debt to a peak of ¥1,280 billion. Meanwhile, earnings dipped due to the global recession triggered by the credit crisis. As a result, the interest-bearing debt/EBITDA ratio rose as high as 9.8 times.
Second PhaseImproving financial position steadily (fiscal 2012–fiscal 2015)
After major investments peaked around fiscal 2012, improving the Group’s financial position became the top priority in business man-agement. Interest-bearing debt reduction was uppermost in our minds as we allocated funds. Consequently, by the end of fiscal 2015 we had lowered interest-bearing debt to the ¥950 billion level. More-over, during this phase completion of the abovementioned large projects helped grow EBITDA to the ¥150 billion level. As a result, the interest-bearing debt/EBITDA ratio improved significantly, decreas-ing to 6.4 times.
Third PhaseDeveloping foundations for medium-to-long-term growth (fiscal 2016–)
With the prospect of a better financial position having come largely within reach, in fiscal 2016 we established a new medium-term management plan with the aim of shifting the focus of business management toward achieving further growth. To this end, the plan set out two business strategies: enhance the value of Umeda and other line-side areas and develop new markets for medium-to-long-term growth. While pursuing these overriding strategies, we are bal-ancing three tasks: investment for the future, continuous strengthening of our financial position, and returns to shareholders.
Setting our sights even further ahead, in 2017 we prepared the Hankyu Hanshin Holdings Group Long-Term Management Vision for 2025.
(¥ billion) (¥ billion)
2008 2009 2010 2011 2012 2013 2014 2015 2016 2019 20262017 2018 (FY)
800
1,100
1,400
1,700
8.8 times
9.4 times9.6 times
9.8 times
8.9 times
7.8 times
6.9 times 6.4 times
5.5 times
5.6 times
6.0 times 5.9 times
Target
Target
1,271.1
1,275.6 1,282.61,251.7
1,183.6
1,126.6
1,032.3 955.8916.6
899.5920.0910.0
150.1
166.5
159.3
152.0157.0
¥200.0 billion
149.2145.1
133.5
127.1133.2135.3
145.2
100
140
180
220Interest-bearing debt/
EBITDA ratio
Interest-bearing debt(left axis)
EBITDA (right axis)
Between 5 and 6 times
Approx. ¥130 billion
Approx. ¥190 billion
Approx. ¥320 billion*
FY2008 – FY2011
3/2008 3/2009 3/2010 3/2011
Hankyu Nishinomiya Gardens Development (September 2004 – November 2008)
Extension of Hanshin Namba Line (Opening of new extension) (October 2003 – March 2009)
Renovation of Hanshin Koshien Stadium* (October 2007 – March 2010)
September 2009: Opening of Department Store Building (Phase I)
April 2010: Completion of Office Tower
Steady improvement in financial standing
* Excluding capital investment related to the repurchase of securitised assets and the exchange of the assets with Hankyu REIT, Inc.
* Renovation work conducted during three off-seasons.
Capital investment
Advancing large projects for growth
Realised numerous integration benefits and advanced large projects
Hankyu Hanshin Holdings • Annual Report 201720

Special Feature: Long-Term Management Vision for 2025Special Feature: Long-Term Management Vision for 2025
(¥ billion) (¥ billion)
2008 2009 2010 2011 2012 2013 2014 2015 2016 2019 20262017 2018 (FY)
800
1,100
1,400
1,700
8.8 times
9.4 times9.6 times
9.8 times
8.9 times
7.8 times
6.9 times 6.4 times
5.5 times
5.6 times
6.0 times 5.9 times
Target
Target
1,271.1
1,275.6 1,282.61,251.7
1,183.6
1,126.6
1,032.3 955.8916.6
899.5920.0910.0
150.1
166.5
159.3
152.0157.0
¥200.0 billion
149.2145.1
133.5
127.1133.2135.3
145.2
100
140
180
220Interest-bearing debt/
EBITDA ratio
Interest-bearing debt(left axis)
EBITDA (right axis)
Between 5 and 6 times
Approx. ¥60 billion
Approx. ¥180 billion
Approx. ¥240 billion*
FY2012 – FY2015
Investment in major development projects and new market development
Approx. ¥170 billion
Investment in maintenance and renewal of existing
infrastructure, etc.
Approx. ¥220 billion
Approx. ¥390 billion
FY2016 – FY2019
3/2012 3/2013 3/2014 3/2015
Umeda 1-1 Project (around spring 2022)
Kobe Hankyu Building, Rebuilding of East Building and Renewal of West Building Project (around spring 2021)
Development of Nishinomiya Kitaguchi Hankyu Building (provisional name) (around autumn 2018)
Other projects ( Strategy 1, Strategy 2, Strategy 3) Ebie 1-Chome Development Plan Kita-Osaka Kyuko Railway Line Extension Project (around spring 2021) Redevelopment Project for Area in Front of JR Yotsuya Station (around winter 2019) Kyobashi 2-6 Redevelopment Plan (around spring 2019) Sale of condominiums and detached houses in Vietnam, Indonesia, Thailand, and the Philippines
Note: Project start times are as of works commencement. Also, finish times are project completion dates (completion of A and B blocks for Osaka Station North District (Umekita) Phase I Develop-ment Area Project).
Completion of phase I construction (around spring 2018) Completion of phase II construction (around autumn 2021)
Rebuilding of Umeda Hankyu Building (May 2005 – November 2012)
Osaka Station North District (Umekita) Phase I Development Area Project (GRAND FRONT OSAKA) (March 2010 – March 2013)
November 2012: Grand opening of the Umeda Flagship Store of Hankyu Department Store
3/2016 3/2017 3/20193/2018
Steady improvement in financial standing
* Renovation work conducted during three off-seasons.
Advancing large projects for growth
Investment for growth Investment in maintenance and renewal
Development of foundations for medium-to-long-term growth
First step toward realisation of long-term vision
Hankyu Hanshin Holdings • Annual Report 2017 21
Reduced interest-bearing debt by growing EBITDA and curbing capital investment
Established long-term vision

Looking at the Group’s business conditions over the medium-
to-long term, the population of line-side areas is expected to
decrease due to declining birth rates. Also, as technological
innovation progresses, lifestyles and living environments are
likely to change significantly.
Aiming to advance as a growth-focused corporate group in
these conditions, we established the Hankyu Hanshin Holdings
Group Long-Term Management Vision for 2025, which sets out
the company we hope to be in the long term as well as the basic
approach and strategies for achieving this target profile.
Anticipating the abovementioned changes in business
conditions, the long-term vision sets out four business strate-
gies based on two categories: business areas and business
models. With enhancing line-side areas and expanding fields as
a slogan, the vision targets fiscal 2026. By this fiscal year, the
Group will have begun stable operations of the flagship proj-
ect of management integration, the Umeda 1-1 Project, due
for completion around spring 2022.
Long-Term Vision Summary
Umeda and line-side areas + Stock businessesMake our railway the absolute best among
the Kansai networks.
We aim to increase the resident and non-resident population of line-side areas. To this end, we will channel into these areas the dynamism of the Tokyo-Nagoya-Osaka axis and the power of Asia and other regions of the world, attract new industries and cutting-edge tech-nologies ahead of other companies, and support efforts to develop thriving local communities.
Flow businessesStrengthen competitiveness by thoroughly pursuing
brand optimisation and differentiation.
Thoroughly optimise the Hankyu Hanshin brand value and differ entiate the products and services from the competition so as to strengthen competitive edge and achieve further business expansion.
Groupwide initiatives and new business fieldsMake greater use of the Group’s collective strength
and develop new business fields.
In addition to pursuing Groupwide initiatives, we will introduce cutting-edge technologies into existing businesses, venture into new busi-ness fields, and thereby provide culturally enriched and innovative lifestyle options.
Tokyo metropolitan area and overseas markets + Stock businesses
Construct a stable revenue base in the Tokyo metropolitan area and overseas markets.
(Diversify the portfolio, which is currently concentrated in Umeda and line-side areas.)
Our property portfolio is currently concentrated in Umea and line-side areas. To compensate for reduction in the scale of businesses in the Kansai area, we will diversify our property profile by acquiring addi-tional assets including rental property in the Tokyo metropolitan area’s large market and in overseas markets that are set to grow.
Sustainably enhance corporate value
Enhance daily life (customer) value Enhance social value Enhance economic value
Slogan for the Hankyu Hanshin Holdings Group Long-Term Management Vision for 2025 (Fiscal 2026)
“Enhancing line-side areas and expanding fields”
Strategy 1
Strategy 3
Strategy 2
Strategy 4
Special Feature: Long-Term Management Vision for 2025
Hankyu Hanshin Holdings • Annual Report 201722

Special Feature: Long-Term Management Vision for 2025
Strategies under Long-Term Management Vision for 2025
As mentioned in the “To Our Stakeholders” section, the Group’s
line-side areas enjoy advantages over other line-side areas in the
Kansai area and have tremendous potential. In addition to the
growth opportunities resulting from expected increases in over-
seas visitors to Japan, new possibilities are emerging. For exam-
ple, in the fields of health and medicine such industrial clusters
as the KOBE Biomedical Innovation Cluster and the Umekita
Phase II Development Project could develop further.
With this potential in mind, we aim to increase the resident
and non-resident population of line-side areas. To this end, our
stock businesses in Umeda and line-side areas will benefit these
areas by leveraging the dynamism of the Tokyo–Nagoya–Osaka
axis and the economic power of Asia and other overseas regions.
At the same time, ahead of competitors we will attract new
industries and leading-edge technology companies. In addition,
we will develop appealing towns in line-side areas.
Specifically, the Group plans to tap into the growth of the
ASEAN region and demand from overseas visitors to Japan by
advancing plans for new railway lines, such as the Shin-Osaka rail
link, and by strategically rebuilding and enhancing the value of
buildings in the Umeda area through the Umeda 1-1 Project and
other projects. Further, we will encourage the formation of
clusters of companies belonging to new industries in the fields
of health and medicine. Other initiatives will give concrete form
to the “Umeda in Asia” goal by transforming the Umeda area into
a hub city connected to the Tokyo–Nagoya–Osaka axis and inter-
national airports.
In addition, with the compact cities concept* in mind, the
Group will capitalise on new technologies and collaborations
with outside partners to introduce highly convenient services
that make its line-side areas desirable places to live. Also, in
developing towns we will not only provide safety and peace of
mind but also numerous educational and cultural facilities. As
part of these efforts, the Group plans to redevelop and renovate
key line-side areas.
As stated in the “To Our Stakeholders” section, maintaining the
current degree of reliance on stock businesses in Umeda and
line-side areas going forward would expose the Hankyu Hanshin
Holdings Group to risks. However, invigorating Umeda and other
line-side areas remains the greatest mission of the Group, and
these areas will continue to be its most important business
foundations. * A town planning concept that entails concentrating commercial and residential facili-
ties as well as essential everyday services within walking distance of railway stations
Umeda 1-1 Project (Dai Hanshin Building and Shin Hankyu Building Rebuilding Project)
Symbolizing management integration, this project entails
creating a single integrated building by reconstructing the
Dai Hanshin Building and the adjacent Shin Hankyu Build-
ing. Moreover, the project will use the space above a road
separating the two buildings.
Increasing total floor space from 150,000 square metres to
260,000 square metres and situated at the centre of the Umeda
area, the new multipurpose building for commercial prem-
ises and offices will have outstanding accessibility.
A rendering of the Umeda 1-1 Project upon completion
Major Development Projects in Umeda and Line-Side Areas
Projects in Progress
· Umeda 1-1 Project (Dai Hanshin Building and Shin Hankyu Building Rebuilding Project)
· Kobe Hankyu Building, Rebuilding of East Building and Renewal of West Building Project
· Development of Nishinomiya Kitaguchi Hankyu Building (provisional name)
· Ebie 1-Chome Development Plan
Project summary
Location 1-1 Umeda, Kita-ku, Osaka
Site area Approx. 12,200 square metres*
Total floor space Approx. 260,000 square metres
Size 38 floors above ground and 3 below ground
Purpose Department store, offices, halls, etc.
Planned total investment ¥89.7 billion
Construction completion Around spring 2022
* Including 750 square metres of road between Dai Hanshin Building and Shin Hankyu Building
Strategy 1 Umeda and line-side areas + Stock businesses
Hankyu Hanshin Holdings • Annual Report 2017 23

Kita-Osaka Kyuko Railway Line Extension ProjectMinoh City and Kita-Osaka Kyuko Railway Co., Ltd., are
advancing a project to extend the Kita-Osaka Kyuko Railway
Line approximately 2.5 kilometres from Senri-Chuo Station
to Minoh City. Scheduled to open in fiscal 2021, the extension
will improve the convenience of public transportation and
increase the non-resident population.
Development plan summary• Extension distance: 2.5 km, from Senri-Chuo Station to
Shin-Mino-o Station (provisional name)
• New stations: Mino-o-Semba Station (provisional name) and Shin-Mino-o Station (provisional name)
• Demand: 45,000 people per day
• Estimated project cost: ¥65.0 billion (Of which, Kita-Osaka Kyuko Railway’s contribution to be ¥11.0 billion, which corresponds to expected earnings*)
* Including the expected increase in demand arising from related town development
At present, the Hankyu Hanshin Holdings Group’s stock businesses
are concentrated in Umeda and line-side areas. Given projected
demographic changes, we need to give due attention to the
concentration of risk that this entails. Meanwhile, as described in
the “To Our Stakeholders” section, in the Tokyo metropolitan area
and overseas there are extensive markets which promise excel-
lent stability and growth going forward.
In response to the above trends, we are taking far-sighted
measures to offset the expected contraction of businesses in the
Kansai area. These measures include the acquisition of additional
rental property and other assets for stock businesses in the Tokyo
metropolitan area’s large market and in overseas markets that are
set to grow. At the same time, we have begun diversifying our
portfolio to mitigate its focus on Umeda and line-side areas.
Specifically, focusing on Tokyo’s five central business districts—
where even in the 2040s the effect of population decline is likely
to be very limited—the real estate leasing business will steadily
accumulate “stock” in the Tokyo metropolitan area while carefully
monitoring market conditions. We aim to increase assets in the
Tokyo metropolitan area to approximately ¥200 billion, or around
20% of the assets of the real estate leasing business. Overseas,
meanwhile, this business will develop logistics and real estate
businesses (logistics centres) in the ASEAN region. In the future,
with our sights set on exploring trial developments of commercial
facilities in the region, we will ascertain whether it is possible to
accumulate “stock.”
Further, in acquiring assets we will continue to rigorously
analyse and monitor fluctuations in economic conditions and
market climates and proceed in light of due consideration of
each project’s significance, business potential, and risks.
Projects in Progress
· Yotsuya Station District Redevelopment Project
· Kyobashi 2-6 Redevelopment Plan
· Ginza 3-chome Project
Strategies under Long-Term Management Vision for 2025
Special Feature: Long-Term Management Vision for 2025
Strategy 2 Tokyo metropolitan area and overseas markets + Stock businesses
A rendering of the Kyobashi 2-6 Redevelopment Plan upon completion
Hankyu Hanshin Holdings • Annual Report 201724
Flow businesses leverage business expertise, human resources,
or brand assets in business activities but do not own “stock.”
These businesses will maximise the value of the Hankyu Hanshin
brand and thoroughly differentiate their offerings to create
unique products and services. Such initiatives will increase the
competitiveness and scale of businesses even further.
Among the above businesses, the sports business and the
stage business own unique content that already has strong
brand value. Therefore, while continuing to hone and heighten
this brand value, both businesses will take on new challenges
and initiatives.
On the other hand, due to lower market entry barriers, the
real estate sales, information services, Travel, and International
Transportation businesses have many competitors.
Of these businesses, given the likely gradual contraction of the
Kansai area’s market, plans call for the real estate sales business to
expand businesses in the Tokyo metropolitan area and overseas
in stages. Our goal is to achieve the same level of sales in the
Tokyo metropolitan area as we have in the Kansai area, namely
sales of approximately 800 condominium units and 100 detached
houses annually.
Overseas, we are already engaged in multiple housing sales
projects in Vietnam. We plan to develop such projects in several
countries in the ASEAN region and generate operating income
on a scale commensurate with this expansion in business size.
Also, we will assess the current competitiveness of information
services, Travel, and International Transportation businesses and
then either expand operations to establish unique businesses or
reform business portfolios and business models. These efforts
will strengthen each business.
Strategy 3 Flow businesses
To prevail amid increasingly fierce competition in markets, the
Group must draw on its collective strength through such mea-
sures as the combination of stock businesses and flow businesses.
Also, it is vital to open up new business fields by exploiting the
opportunities that emerge from changes in social conditions.
With this in mind, as well as advancing Groupwide initiatives
even further, we aim to use leading-edge technologies in exist-
ing businesses and take on the challenge of opening up new
business fields. Our goal in these efforts will be to provide cultur-
ally enriched and innovative lifestyle options into the future.
We intend to consider specific initiatives based on the three
approaches outlined below. First, we will use existing resources
to pursue Groupwide initiatives. For example, the Group is cur-
rently making concerted efforts to further credit and point card
measures. Also, the International Transportation and Real Estate
businesses are collaborating to develop logistics centre opera-
tions overseas. Going forward, we will accelerate such Group-
wide initiatives.
Second, we want to rejuvenate Group assets and utilise human
resources. Decreases in asset utilisation rates as the population
declines is a concern. Even in such business conditions, however, we
will revitalise assets in the same way that we have been developing
domestic logistics and real estate businesses—by proactively
collaborating with outside partners and incorporating new per-
spectives. In addition, the Group will explore new business fields
by leveraging its human resources to the utmost. These efforts
will include extending a new-business-proposal system through-
out the Group.
Third, the Group will explore the potential for utilising leading-
edge technologies throughout the Group. Further advances in AI
and the IoT are expected. Although not directly engaged in com-
petition over the development of leading-edge technologies,
the Group will gather information about the many different
types of new technology that open source initiatives are creating
worldwide. By actively using or repurposing these technologies
in our various businesses, we will enhance services for customers
and strengthen the competitiveness of businesses.
Strategy 4 Groupwide initiatives and new business fields
Hankyu Hanshin Holdings • Annual Report 2017 25
Special Feature: Long-Term Management Vision for 2025

So that it can advance strategies and measures more decisively and thereby realise the long-term vision, the Group will improve its
organisation as explained below.
Unification within Hankyu Hanshin Holdings of the Divisions for New Business Development of Hankyu Corporation and Hanshin Electric Railway (implemented in April 2017)
To advance measures under strategy 4, which is focused on
Groupwide initiatives and new business fields, we have estab-
lished a framework that is stepping up the pace of initiatives for
new businesses. Specifically, the Group unified the divisions for
new business development of Hankyu Corporation and Hanshin
Electric Railway within Hankyu Hanshin Holdings.
Integration and Reorganisation of the Real Estate Divisions of Hankyu Corporation and Hanshin Electric Railway Aimed at Establishing a Core Company for the Real Estate Business (assessment under way with a view to implementation in April 2018)
The long-term vision calls on the Group to strengthen and
expand the real estate leasing business in Umeda and line-side
areas as well as in the Tokyo metropolitan area and overseas mar-
kets (strategies 1 and 2) and to rigorously differentiate the real
estate sales business (strategy 3). To these ends, we will establish
a core company for the Real Estate Business by reorganising the
real estate divisions of Hankyu Corporation and Hanshin Electric
Railway and other core real estate businesses.
This core company will maximise the collective strength of the
Group’s Real Estate Business and advance and accelerate initia-
tives aimed at growing the business.
Organisational Improvements Aimed at Realising the Long-Term Vision
We will steadily move forward with initiatives under strategies 1 through 4 to become a corporate group that can sustain operating
income at its current level or higher even when the effect of demographic changes becomes marked in the 2040s. In fiscal 2026, we aim
to have operating income of ¥120 billion, EBITDA of ¥200 billion, and an interest-bearing debt/EBITDA ratio between 5 and 6 times.
By achieving these targets, we will remain an industry leader among major private (non-JR) railway operators based on indicators of
profitability and financial soundness.
Profitability
Operating income ¥ 120 billion
EBITDA ¥ 200 billion
Financial soundness
Interest-bearing debt/EBITDA ratio
Between 5 and 6 times
Management Indicators
Special Feature: Long-Term Management Vision for 2025
Hankyu Hanshin Holdings • Annual Report 201726

Medium-Term Management Plan (Fiscal 2016–Fiscal 2019)
Business StrategiesDuring the medium-term management plan, which covers fiscal 2016 through fiscal 2019, we aim to develop foundations for medium-
to-long-term growth and take the first step toward achieving the long-term vision. Therefore, we will advance measures in accordance
with strategies 1 through 4 of the long-term vision.
Financial PolicyAiming to realise the long-term vision and grow operating
income and EBITDA further, we will allocate funds by giving pri-
ority to growth investment in accordance with strategies 1
through 4. Specifically, the updated medium-term management
plan calls for increased growth investment in the Tokyo metro-
politan area and other areas. Compared with the previous plan,
the amount earmarked for investment in major development
projects and new market development has risen by ¥40 billion,
to ¥170 billion.
However, we intend to maintain financial soundness. Given
that we will implement growth investment in accordance with
strategies 1 through 4 of the long-term vision, we will ensure
financial soundness by emphasizing the interest-bearing debt/
EBITDA ratio rather than interest-bearing debt.
As for returns to shareholders, in fiscal 2018 we project year-
on-year increases in annual dividend payments from profits, from
¥35 per share to ¥40 per share, as well as in the total payout ratio.
Strategy 1Further strengthen stock businesses in Umeda and line-side areas (e.g., railways, real estate leasing, media and communications, hotels)
Strategy 2 Accumulate stock in the Tokyo metropolitan area and overseas markets
Strategy 3Strengthen competitiveness of flow businesses (real estate sales, sports, stage, information services, travel, and international transportation)
Strategy 4 Make greater use of the Group’s collective strength and venture into new business fields
Forward-looking investment
While striking a balance with financial soundness, we will prioritise growth investment under strategies 1 to 4.
Maintaining financial soundness
Prioritise the interest-bearing debt/EBITDA ratio over interest-bearing debt as a benchmark
for financial soundness.
Returns to shareholders
For the period of the plan, we envisage a total payout ratio of 25% for fiscal 2017, and 30% for fiscal 2018
and onward.
Special Feature: Long-Term Management Vision for 2025
Hankyu Hanshin Holdings • Annual Report 2017 27

Outlook for Management IndicatorsIn fiscal 2018, due to a rise in sales expenses in the development
and sale of condominiums and higher depreciation and amorti-
sation in the Urban Transportation Business, the Group is expected
to record operating income of ¥96 billion, net income attribut-
able to owners of the parent of ¥60 billion, and an interest-
bearing debt/EBITDA ratio of 6.0 times.
Further, in fiscal 2019 we forecast operating income of ¥98 bil-
lion, net income attributable to owners of the parent of ¥61 bil-
lion, and an interest-bearing debt/EBITDA ratio of 5.9 times.
Approx. ¥220 billion
Approx. ¥350 billion
Approx.¥130 billion
Approx.¥170 billion
Approx. ¥220 billion
Approx. ¥390 billion
Tokyo metropolitan area and overseas markets
Approx. 40%
Umeda and line-side areas
Approx. 60%
Investment in maintenance and renewal of existing infrastructure Investment in major development projects and new market development
Previous plan Current plan
Capital investment (including lending) from fiscal 2016 to fiscal 2019
FY2018 forecasts FY2019 forecasts
Profitability
Operating income ¥96.0 billion ¥98.0 billion
EBITDA ¥152.0 billion ¥157.0 billion
Net income attributable to owners of the parent ¥60.0 billion ¥61.0 billion
Capital efficiency ROE 7.5% 7.2%
Financial soundness
Interest-bearing debt ¥910.0 billion ¥920.0 billion
Interest-bearing debt/EBITDA ratio 6.0 times 5.9 times
D/E ratio 1.1 times 1.1 times
Medium-Term Management Plan (Fiscal 2016–Fiscal 2019)
Special Feature: Long-Term Management Vision for 2025
Hankyu Hanshin Holdings • Annual Report 201728

From Enhancing the Value of Line-Side Areas to Enhancing Corporate Value
Developing towns that people want to live in long term or
visit frequently is the Hankyu Hanshin Holdings Group’s
unchanging mission. These efforts are the Group’s most
important strategy, as they promote a virtuous cycle. Spe-
cifically, heightening the appeal of line-side areas increases
resident and non-resident populations, thereby creating
stable cash flows and strengthening brand power. In turn,
these benefits enable further investment for growth,
which enhances corporate value.
The Group has enhanced the value of line-side areas
through a range of businesses in the fields of urban trans-
portation, real estate, and entertainment. For example, a
testament to the strong support that the Group has
earned from local residents is the fact that the Japan
Productivity Center’s survey of customer satisfaction
levels* has ranked Hankyu Corporation first in the urban
rail transportation category for eight consecutive years
and ranked Takarazuka Revue Company first in the enter-
tainment industry category.
Given that population decline is unavoidable, enhanc-
ing the value of line-side areas further is paramount. Long-
Term Management Vision for 2025 calls on us to make our
railway the absolute best among the Kansai networks.
Accordingly, the Group will continue taking on the chal-
lenge of enhancing the value of line-side areas tirelessly. * Research by SPRING (Service Productivity & Innovation for Growth) for the fiscal year
ended 31st March 2017
Corporate value enhancement
Enhancement of the value of line-side areas
• People want to live in areas long term• People want to visit areas frequently
Real estate sales businessCondominiums and detached houses
New businesses in the lifestyle support field
Real estate leasing businessOffices and commercial facilities
Entertainment business Hanshin Tigers Takarazuka Revue
Hotels Business
Expansion of earnings base Strengthening of the Hankyu Hanshin brand
Urban Transportation Business(railways, buses, taxis)
Increase in non-resident population
Increase in resident population
Hankyu Hanshin Holdings • Annual Report 2017 29

CSR and Corporate Value Enhancement
Creating Communities People Will Truly Want to Live in“Enhancing the value of line-side areas is indispensable for the
Group’s medium-to-long-term growth. Therefore, even though
our social contribution activities may not seem to immediately
benefit short-term business results, they build the value of our
line-side areas and brand,” explains Yukiko Sagara of Hankyu Han-
shin Holdings. Ms. Sagara has been responsible for the Hankyu
Hanshin Dreams and Communities Project since its launch.
Regarding social contribution activities, our basic policy is to
promote the creation of towns and cities that people will truly
want to live in. Moreover, the Group conducts activities in col-
laboration with Group companies, citizens’ groups, employees,
and other stakeholders.
Increasing Effectiveness through CollaborationWe collaborate with stakeholders so that our social contribution
activities produce even greater benefits. To give an example of
collaborative efforts, Ms. Sagara describes the Hankyu Hanshin
Dreams and Communities Challenge Troop, which invites primary
school students from line-side areas to participate in interactive
educational programmes free of charge. “Acting as instructors,
employees conduct programmes at Group work sites. Every year,
we receive more than 20,000 applications and increase the
number of programmes. In 2017, we hosted 45 programmes. So,
offering more programmes allows us to invite more children, but
we could not provide such a range of programmes without the
participation of Group companies.”
Ms. Sagara adds that the Group conducts one-time classes at
schools to complement the national government’s recent focus
on career education for children. “At classes held in primary
schools, Hankyu Corporation employees explain their jobs to
students. By drawing attention to the wide variety of jobs in local
communities, these classes aim to help children in our line-side
areas cultivate ideas about future careers. Also, aiming to provide
equal access to education, we conduct classes in collaboration
with citizens’ groups that support disadvantaged children. We
are focusing on this area because at schools with many such
children teachers are often too busy providing lifestyle guidance
and carrying out other duties to even accommodate our classes.
However, it is particularly important for these children to receive
career education that broadens their view of future possibilities. I
feel this is a good example of how collaboration can bring to
light social problems and increase the effectiveness of social
contribution activities.”
Enhancing Brand Value Even FurtherEvery three years, the Group conducts an Internet survey of 1,000
line-side area residents about the project. The results show that
as awareness of the project heightens, favourable opinions of the
Group increase, and respondents’ desire to live in its line-side
areas strengthens. Thus, our social contribution activities are
gradually having a positive effect on the value of our brand and
line-side areas.
Line-side areas are the foundations of the Hankyu Hanshin Holdings Group’s businesses. We view heightening the value of
these areas as a social responsibility and a source of growth. Our CSR activities come under two categories: social contribu-
tion and environmental preservation. In these two categories, the Group will advance CSR activities in tandem with business
activities to enhance the value of line-side areas even further.
The Hankyu Hanshin Dreams and Communities Challenge Troop The Dreams and Communities Exciting Work Program
Hankyu Hanshin Holdings • Annual Report 201730

Business activitiesCSR activities
Earnings growth
Corporate value enhancement
Enhancement of brand value
Enhancement of the value of
line-side areas
CSR and Corporate Value Enhancement
“Our activities for children are aimed at fostering important
human resources for town development. In other words, we
want to help the growth of children who will form the basis of
local communities. Moreover, the survey results confirmed that
our activities have the added benefit of making the families of
these children fans of the Hankyu Hanshin Holdings Group.”
Ms. Sagara’s hope is to proactively pursue collaborations with
customers as well as with Group companies, citizens’ groups, and
employees. “Our social contributions are based on the needs of
communities. We believe that by identifying the problems and
needs of those who live in or spend time in towns, we can make
our activities even more effective.” As of this summer, we have
been encouraging customers to participate in large numbers by
advancing activities centred on railway stations and commercial
facilities in collaboration with citizens’ groups. Through these
social contribution activities, we will continue to promote the
creation of towns and cities that people will truly want to live in.
The Long-Term Management Vision for 2025 calls on us to make our railway the absolute best among the Kansai networks. To this end, we will steadily extend social contribution activities.
Yukiko SagaraManager, General Affairs Dept. (in charge of social contribution), Personnel and General Affairs Div.
Our reputation(%)
42.946.4
46.8
22.9
65.873.4
81.7
27.034.9
0
20
40
60
80
100
Respondents familiarwith the Dreams and
Communities Project (284)
Respondents familiarwith the Group (830)
All respondents(1,000)
Positive opinion of the Group Fairly positive opinion of the Group
Respondents who want to live in our line-side areas(%)
26.3 28.3
34.2
17.9 19.927.8
0
20
40
60
80
100
44.2 48.2
62.0
Respondents familiarwith the Dreams and
Communities Project (284)
Respondents familiarwith the Group (830)
All respondents(1,000)
Want to live in them May want to live in them
Hankyu Hanshin Holdings • Annual Report 2017 31

CSR and Corporate Value Enhancement
Social Contribution Activities Under the Hankyu Hanshin Dreams and Communities Project, the Group aims to develop communities centred
on line-side areas. Accordingly, we are moving forward with various social contribution activities in partnership
with such stakeholders as customers, citizens’ groups, Group companies, and employees.
Basic Policy We intend to promote the creation of towns and cities along our line-side areas that people will truly want to live in.
Priority Areas
Our social contribution activities focus on two priority areas: environment-friendly development, which improves the environment in towns and
cities, and human capital development, aimed at fostering the generation that will be responsible for the future of communities.
Environment-Friendly Development
As a Group with strong local roots, we are com-
mitted to sustainable community building with
environment-friendly developments that provide
local residents with security, peace of mind, and
cultural enrichment.
Human Capital Development
We are creating opportunities for the healthy
development of ambitious children, upon whose
shoulders the task of building the communities
of the future rests.
The Dreams and Communities Project has a dedicated quarterly
magazine entitled Dreams and Communities of the Future, which tar-
gets Group employees. We believe that it is important to update
employees and other stakeholders about social contribution activi-
ties as we implement them. For this reason, we also include the
magazine on our website.
Featuring articles about citizens’ groups that receive grants from
the Hankyu Hanshin Dreams and Communities of the Future Fund,
the magazine also reports on Group employees’ volunteer activities
and other events.
The Hankyu Hanshin Dreams and Communities of the Future
Fund comprises donations from Group employees and matching
amounts from Hankyu Hanshin Holdings. We receive applications
from citizens’ groups located in line-side areas, select those engaged
in activities that coincide with the policies of the project, and provide
these groups with grants and public relations support. Over eight
years, we have provided grants totalling ¥49.5 million to 97 groups.
Issuing a Magazine for the Dreams and Communities Project
The Hankyu Hanshin Holdings Group conducts a wide range of other social contribu-
tion activities. For details about these activities, please visit the Group’s website.
http://www.hankyu-hanshin.co.jp/yume-machi/top.html
(Available only in Japanese)
Dreams and Communities of the Future magazine covers
Example Initiative
External Evaluations
In fiscal 2017, one of our initiatives, the Hankyu Hanshin Dreams and Communities Challenge Troop interactive educational programmes,
received a special commendation from the judges of an award recognising companies that offer experiential activities for young people,
organised by the Ministry of Education, Culture, Sports, Science and Technology. Also, the Dreams and Communities Exciting Work Program
classes, which Hankyu Corporation conducts at schools, have received a favourable evaluation from The Japanese Society for the Study of
Career Education and been presented as a case study in Tokyo and South Korea.
Hankyu Hanshin Holdings • Annual Report 201732

Environmental Preservation Activities The Group has established a Basic Environmental Philosophy and Basic Environmental Policies, which guide environmental preservation activi-
ties. Further, to advance such activities, the Group has established the Environment Committee, chaired by the president of Hankyu Hanshin
Holdings, which exercises control over all environmental preservation activities that Group companies implement within each core business.
We conduct a variety of activities, including efforts to reduce environmental burden through business activities and the dissemination of infor-
mation about environmental preservation.
CSR and Corporate Value Enhancement
Basic ConceptMindful that global environmental preservation is a task facing all mankind, the Hankyu Hanshin Holdings Group works
for a sustainable society through environmental activities aimed at handing down a sounder global and human environ-
ment to the next generation.
As part of climate change countermeasures, the Hankyu Hanshin
Holdings Group saves energy in its business activities. For example,
we are introducing new energy-saving rolling stock and using LED
lighting at our facilities. Moreover, we use carbon offsetting* contin-
uously for some of the CO2 emissions from energy use in business
activities. In fiscal 2017, we used carbon offsetting for the operations
of Hankyu Settsu-shi Station, an initiative that we began in 2010; for
the administration of the General Meeting of Shareholders, a mea-
sure that dates back to 2011; and for our Takarazuka Grand Theatre
Carbon Offset Shows, which comprised 46 performances. For the
operations of Settsu-shi Station and the administration of the Gen-
eral Meeting of Shareholders, we use offset credits earned under the
Japan Verified Emission Reduction (J-VER) Scheme by preserving
forests in Shiso, Hyogo Prefecture. As for the Takarazuka Grand
Reducing Environmental Burden through Business Activities
Theatre performances, we use the J-Credit Scheme, a certification
system administered by the national government. Thus, the three
initiatives above are carbon neutral.
* The national government certifies as “credit” the respective reduction or absorption of CO2 and other greenhouse gas emissions that results from introducing energy-saving equipment or from establishing carbon sinks through forestry management.
Hankyu Settsu-shi Station General Meeting of Shareholders
We actively disseminate information with a view to heightening the
environmental awareness of employees and informing customers
and local communities about our environmental preservation activi-
ties. One way in which we do this is by displaying environment-
themed posters inside the trains of Hankyu Corporation, Hanshin
Electric Railway, Nosé Electric Railway, and Kita-Osaka Kyuko Railway.
Disseminating Information to Raise Environmental Awareness
The Hankyu Hanshin Holdings Group conducts a wide range of other environmental
preservation activities. For details about these activities, please visit the Group’s website.
http://www.hankyu-hanshin.co.jp/csr/eco/
(Available only in Japanese)
Environment-themed posters
Highlighting such topics as the use of solar energy, forest thinning,
and recycling, the posters showcase Group companies’ initiatives. In
addition, at LOHAS FESTA 2017 we opened a display booth that
highlighted the importance of environmental initiatives and publi-
cised our activities in this regard.
LOHAS FESTA 2017
Example Initiative
Example Initiative
Hankyu Hanshin Holdings • Annual Report 2017 33
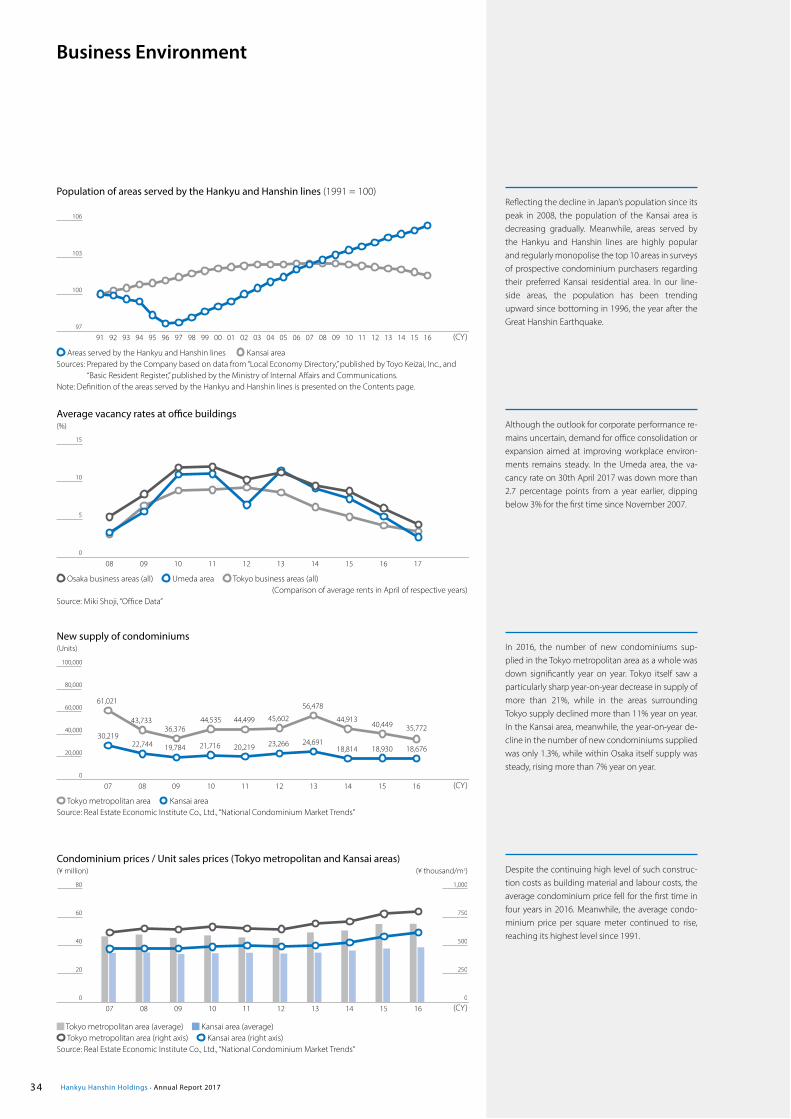
Average vacancy rates at office buildings(%)
Business Environment
Reflecting the decline in Japan’s population since its peak in 2008, the population of the Kansai area is decreasing gradually. Meanwhile, areas served by the Hankyu and Hanshin lines are highly popular and regularly monopolise the top 10 areas in surveys of prospective condominium purchasers regarding their preferred Kansai residential area. In our line-side areas, the population has been trending upward since bottoming in 1996, the year after the Great Hanshin Earthquake.
In 2016, the number of new condominiums sup-plied in the Tokyo metropolitan area as a whole was down significantly year on year. Tokyo itself saw a particularly sharp year-on-year decrease in supply of more than 21%, while in the areas surrounding Tokyo supply declined more than 11% year on year. In the Kansai area, meanwhile, the year-on-year de-cline in the number of new condominiums supplied was only 1.3%, while within Osaka itself supply was steady, rising more than 7% year on year.
Despite the continuing high level of such construc-tion costs as building material and labour costs, the average condominium price fell for the first time in four years in 2016. Meanwhile, the average condo-minium price per square meter continued to rise, reaching its highest level since 1991.
Although the outlook for corporate performance re-mains uncertain, demand for office consolidation or expansion aimed at improving workplace environ-ments remains steady. In the Umeda area, the va-cancy rate on 30th April 2017 was down more than 2.7 percentage points from a year earlier, dipping below 3% for the first time since November 2007.
Osaka business areas (all) Umeda area Tokyo business areas (all) (Comparison of average rents in April of respective years)Source: Miki Shoji, “Office Data”
1708 09 10 11 12 13 14 15 160
5
10
15
New supply of condominiums(Units)
Population of areas served by the Hankyu and Hanshin lines (1991 = 100)
Condominium prices / Unit sales prices (Tokyo metropolitan and Kansai areas)(¥ million) (¥ thousand/m2)
Tokyo metropolitan area Kansai areaSource: Real Estate Economic Institute Co., Ltd., “National Condominium Market Trends”
1607 08 09 10 11 12 13 14 15
30,21922,744 19,784 21,716 20,219 23,266 24,691
18,814 18,930
61,021
43,733 36,376
44,535 44,499 45,602
56,478
44,913 40,449
18,676
35,772
0
20,000
40,000
60,000
80,000
100,000
Areas served by the Hankyu and Hanshin lines Kansai area Sources: Prepared by the Company based on data from “Local Economy Directory,” published by Toyo Keizai, Inc., and
“Basic Resident Register,” published by the Ministry of Internal Affairs and Communications.Note: Definition of the areas served by the Hankyu and Hanshin lines is presented on the Contents page.
(CY)
0691 92 93 94 95 96 97 98 99 00 01 02 03 04 05 07 08 09 10 11 12 13 15 161497
100
103
106
Tokyo metropolitan area (average) Kansai area (average) Tokyo metropolitan area (right axis) Kansai area (right axis)
Source: Real Estate Economic Institute Co., Ltd., “National Condominium Market Trends”
1607 08 09 10 11 12 13 14 150
20
40
60
80
0
250
500
750
1,000
(CY)
(CY)
Hankyu Hanshin Holdings • Annual Report 201734

Business Environment
Economies worldwide are trending toward modest recovery. In the United States, domestic demand is increasing steadily as the employment market im-proves. As for China, although the economic growth rate is softening, growth is continuing. An indicator of handling volume in the international logistics market, container transportation volume was steady in 2016. The international logistics market is ex-pected to continue expanding centred on Asia.
In 2016, the number of overseas visitors to Japan rose for the fifth consecutive year, increasing 21.8% year on year, to more than 24 million. Based on a survey of the consumption behaviour of overseas visitors to Japan, a breakdown of travel spending by expense item shows that while spending on shop-ping accounted for a smaller percentage of con-sumption year on year, spending on accommodation, food and drink, and transportation increased year on year. Thus, these visitors are not only interested in shopping but increasingly are interested in experi-encing Japan’s lifestyle and culture. Further, in 2016 the number of Japanese travellers going overseas rose for the first time in four years, increasing 5.6%, year on year, to 17 million.
Driven by steady demand for domestic travel and an increase in overseas visitors to Japan, hotel revenues continued to grow, rising 2.5% year on year in 2016. Anticipating market growth in the run up to the Tokyo 2020 Olympic and Paralympic Games, the supply of new guest rooms is trending upward mainly in large cities. For the time being, however, a shortage of guest rooms is likely to continue given such factors as tight supply and demand in certain cities.
Volume of maritime container cargo movement worldwide(Millions of TEUs)
Hotel market(¥ billion)
Sports-spectating and theatre markets(¥ billion)
Overseas visitors to Japan and Japanese travellers going overseas(Millions of people)
Source: Japan Maritime Center, “Volume of Container Cargo Movement Worldwide”
Source: Japan Productivity Center, “White Paper on Leisure Industry 2017”
Sports-spectating TheatreSource: Japan Productivity Center, “White Paper on Leisure Industry 2017”
1607 08 09 10 11 12 13 14 15
101.9 105.595.1
110.5117.9 119.7 122.4
129.0127.6 132.3
0
50
100
150
1607 08 09 10 11 12 13 14 15
1,093 1,038 976 976 949 9791,082
1,2841,201
1,316
0
500
1,000
1,500
1607 08 09 10 11 12 13 14 15
118 127140 133
109 104 102 102 104 112
139 135145 139
132 136 141 148156 160
0
60
120
180
Overseas visitors to Japan Japanese travellers going overseasSource: Japan National Tourism Organization (JNTO), “Visitor Arrivals, Japanese Overseas Travellers”
1607 08 09 10 11 12 13 14 15
8.3 8.46.8
8.66.2
8.410.4
13.4
16.2 17.1
19.7
24.0
17.316.0 15.4
16.6 17.018.5 17.5 16.9
0
5
10
15
20
25
(CY)
(CY)
(CY)
(CY)
In 2016, interest in sports increased as the Tokyo 2020 Olympic and Paralympic Games attracted more attention. Conditions in the sports-spectating market were favourable. For example, baseball game attendances rose for the fourth consecutive year. The live entertainment market, including the-atre productions and musicals, is expanding, while the customer base of this market is broadening.
Hankyu Hanshin Holdings • Annual Report 2017 35

Urban Transportation
1 Provide quality urban transportation services and other related services
Develop personnel
Strengthen Group collaboration
Enhance services and convenience
Enhance value of line-side areas and
publicise them
Enhance appeal of railway stations
2 Increase convenience and reliability of existing infrastructure and expand railway network
Develop railway stations and lines
Expand and strengthen railway network
3 Ensure reliable transportation
Enhance security
Develop rolling stock
4 Expand feeder services and extend catchment areas of railway lines and stations
Advance sales measures in the bus
business
Enhance bicycle parking areas at railway
stations and bicycle rental services
Collaborate with line-side area municipal
authorities, chambers of commerce and
industry, and companies
Basic Policies
The Urban Transportation Business will achieve
medium-to-long-term growth by cementing
operational foundations, thereby enabling
the provision of services that realise greater
safety, reliability, and comfort. At the same
time, in an environmentally and socially
responsible manner, we will improve urban
transportation services even further. Specif-
ically, we will strengthen and extend coor-
dination with connecting transportation
services and feeder services. We will also
improve the services and information that
railway stations provide. Such efforts will
increase the Group’s business opportunities
in line-side areas, attract outside companies
to the areas, strengthen lifestyle services
and economic functions, and heighten line-
side value.
Business Strategies
Hankyu Hanshin Holdings • Annual Report 201736

Urban Transportation
In the Urban Transportation Business, railway operation revenue
increased due to such factors as favourable performances by
the Hankyu and Hanshin lines, reflecting increases in line-side area
populations and overseas visitors to Japan. However, as a result
of ready-cooked meal provider Iina Dining Co., Ltd., changing from a
consolidated subsidiary to an equity-method affiliate, the business
segment’s revenues from operations decreased 1.0%, or ¥2,407 million,
year on year, to ¥237,136 million. Nonetheless, thanks to lower power
costs in the railway business and other factors, operating income
was up 2.3%, or ¥967 million, year on year, to ¥42,237 million.
The railway business installed new ticket gates on the east side
of Hankyu Saiin Station, enhanced the convenience of transfers to
Keifuku Electric Railroad Co., Ltd., services, and installed new eleva-
tors to establish a barrier-free area. Also, in a project for continuous
grade separation on the Hanshin Main Line within Nishinomiya City
(between Koshien and Mukogawa stations), we elevated the railway
track of the inbound line, thereby completing the track elevation of
outbound and inbound lines and increasing the safety of train op-
erations even further. Meanwhile, we enhanced the convenience of
services for customers. For example, we began offering downloads
of the TOKK App for smartphones, which provides notifications
about the train services and line-side areas of Hankyu lines. In addition,
we launched parcel-receiving services based on “open-type” delivery
lockers that are shared by multiple delivery service providers in or
near the station concourses of certain railway stations on the Hankyu
and Hanshin lines.
The automobile business took various steps to increase passenger
convenience. These included introducing bus location services and
enabling customers to use smartphones to check bus service status and
expected arrival times for routes managed by the operating bases of
Hankyu Bus Co., Ltd., in Hyogo Prefecture as well as for all Hanshin
Bus Co., Ltd., routes. Also, in March 2016 Hanshin Bus extended its
route network to all areas of Amagasaki by assuming all municipal
bus routes of the Amagasaki Municipal Transportation Bureau.
The retailing business heightened railway stations’ appeal through
such initiatives as opening Nescafe Stands in certain railway stations
on Hankyu lines under a new business format established jointly
with Nestlé Japan Limited.
Fiscal 2017 Review of Operations
Hankyu Corporation and Hanshin Electric Railway: Performance results
Fare revenues (Millions of yen)* Passenger volumes (Thousands)*
FY2017 FY2016 Change % FY2017 FY2016 Change %
HankyuOther tickets 62,720 62,920 (199) (0.3) 318,064 319,023 (958) (0.3)
Commuter pass 32,628 32,272 355 1.1 329,305 325,540 3,764 1.2
Total 95,348 95,192 156 0.2 647,369 644,563 2,805 0.4
HanshinOther tickets 21,136 21,035 101 0.5 116,998 116,440 557 0.5
Commuter pass 11,563 11,372 190 1.7 119,768 117,786 1,982 1.7
Total 32,699 32,407 291 0.9 236,766 234,226 2,540 1.1
* Sum of tier 1 and tier 2 railway operators for both Hankyu and Hanshin
Revenues from operations are expected to decrease 1.1%, or ¥2.6
billion, year on year, to ¥234.5 billion, due to such factors as Iina
Dining Co., Ltd., changing from a consolidated subsidiary to an
equity-method affiliate. We expect that an increase in depreciation
and amortisation in the railway business and higher fuel costs in the
automobile business will result in a 6.2%, or ¥2.6 billion, year-on-year
decline in operating income, to ¥39.6 billion.
Hankyu Corporation and Hanshin Electric Railway: Performance forecasts (Fiscal 2018)
Fare revenues (Millions of yen)*FY2018 FY2017 Change %
Hankyu 95,649 95,348 300 0.3
Hanshin 32,707 32,699 7 0.0
Passenger volumes (Thousands)*FY2018 FY2017 Change %
Hankyu 650,112 647,369 2,742 0.4
Hanshin 237,616 236,766 849 0.4
* Sum of tier 1 and tier 2 railway operators for both Hankyu and Hanshin
Outlook for revenues from operations and operating income margin (¥ billion) (%)
2018(Est.)
2014 20172015 2016
237.1 234.5234.6 233.4 239.5
(FY)
0
50
100
150
200
250
0
5
10
15
20
25
16.4 16.5 17.2 17.8 16.9
Revenues from operations Operating income margin (right axis)
Fiscal 2018 Outlook
Hankyu Hanshin Holdings • Annual Report 2017 37

The Real Estate Business will strengthen its
management and operation of the real
estate leasing business and maintain or
improve the profitability of owned proper-
ties with a focus on areas served by the
Hankyu and Hanshin lines and the Umeda
area, which are important business bases
of the Hankyu Hanshin Holdings Group. In
par ticular, we will step up efforts to foster
intan gible assets that heighten the entire
Umeda area’s appeal and ability to attract
customers. Further, through the real estate
sales business we will heighten the value of
line-side areas.
Also, we will take maximum advantage
of expertise and human resources devel-
oped in Umeda and line-side areas to steadily
develop a presence in such new markets
as the Tokyo metropolitan area and over-
seas markets.
Basic PoliciesBusiness Strategies
1 Enhance appeal of and revitalise Umeda area and other areas served by our lines
Advance Umeda 1-1 Project (Dai Han-shin Building and Shin Hankyu Building rebuilding project) and other develop-ment projects steadily
Step up efforts to foster intangible assets that heighten the Umeda area’s appeal
Enhance value of the Umeda area and other areas served by the Hankyu and Hanshin lines by planning and advanc-ing new development projects and implementing plans for renewal of commercial facilities
2 Maintain and heighten earnings level of the real estate sales business
Plan and develop condominiums matching customer needs and advance business and sales in anticipation of changes in market conditions
Develop detached houses in towns while marketing residential land lots steadily (Yamatedai and Saito)
Develop supply network and acquire business opportunities in the Tokyo metropolitan area
Ensure stable revenues from the real estate sales business by increasing efforts focused on medium-to-long-term projects
3 Strengthen and grow real estate funds and REIT businesses
Pursue external growth of the Real Estate Business through linkage with Hankyu REIT Asset Management
Increase fee-based revenues from asset and property management
4 Strengthen business in the Tokyo metro-politan area and develop businesses overseas
Expand business over the medium- to-long term by acquiring revenue- generating properties and participating in redevelopment projects in the Tokyo metropolitan area
Develop and own logistics warehouses and participate in condominium busi-nesses overseas to accumulate business expertise and gather information with a view to further business expansion
Real Estate
Hankyu Hanshin Holdings • Annual Report 201738

Fiscal 2017 Review of Operations
The Real Estate Business recorded year-on-year declines of 2.4%, or
¥5,213 million, in revenues from operations, to ¥215,709 million, and
15.8%, or ¥7,881 million, in operating income, to ¥41,970 million, due
to a non-recurring gain on sale of land for facilities in the central area
of Saito (Ibaraki, Osaka Prefecture) in the previous fiscal year.
The real estate leasing business took a range of measures to
increase the competitiveness of commercial facilities and office
buildings and to maintain and raise their occupancy rates. These
measures included refurbishing the restaurant floor of HERBIS PLAZA
(Kita-ku, Osaka), which celebrated its 20th anniversary.
Further, we began new construction for the Nishinomiya Kitaguchi
Hankyu Building (provisional name) (Nishinomiya, Hyogo Prefecture)
and in the Yotsuya Station District Redevelopment Project (Shinjuku-
ku, Tokyo), which is a joint initiative that we are advancing with busi-
ness partners. In addition, we undertook demolition of existing
buildings in the Kobe Hankyu Building, East Building Rebuilding
Project (Chuo-ku, Kobe) and in the 2-6 Kyobashi Redevelopment
Project (Chuo-ku, Tokyo). As for the Umeda 1-1 Project (Dai Hanshin
Building and Shin Hankyu Building rebuilding project) (Kita-ku,
Osaka), which is a large-scale development project, we are advanc-
ing the new construction work of phase I in earnest with a view to
completing all construction around spring 2022.
In the real estate sales business, sales of condominiums included Geo
Senri Chuo The Residence (Toyonaka, Osaka Prefecture), Geo Takatsuki
Muse Resis (Takatsuki, Osaka Prefecture), Geo Gyoen Naitomachi
(Shinjuku-ku, Tokyo), Geo Kyodo (Setagaya-ku, Tokyo), and the com-
pletely renovated Brod Takatsuki (Takatsuki, Osaka Prefecture). As for
sales of residential land lots and detached houses, we sold Hankyu
Saito Garden Front (Minoh, Osaka Prefecture), Hankyu Takarazuka
Yamatedai Skyle (Takarazuka, Hyogo Prefecture), and Osaka Nakajima
Koen Toshi Hapia Garden Shiki no Machi (Nishi-Yodogawa-ku, Osaka).
HERBIS PLAZA
Geo Senri Chuo The Residence
Hankyu Saito Garden Front
We expect revenues from operations to grow 4.5%, or ¥9.8 billion,
year on year, to ¥225.5 billion, as a result of higher condominium unit
sales. However, we expect such factors as higher sales expenses arising
from the condominium projects will lead to a 9.3%, or ¥3.9 billion,
year-on-year decrease in operating income, to ¥38.1 billion.
Fiscal 2018 Outlook
215.7225.5
208.6 206.4
220.9
0
50
100
150
200
250
0
5
10
15
20
25
18.2 18.0
22.6
19.5
16.9
2018(Est.)
2014 20172015 2016 (FY)
Revenues from operations Operating income margin (right axis)
Outlook for revenues from operations and operating income margin (¥ billion) (%)
Real Estate
Hankyu Hanshin Holdings • Annual Report 2017 39

©Takarazuka Revue Company
Entertainment and Communications
Basic PoliciesBusiness Strategies
1 Maximise value of the Hanshin Tigers and Koshien brands
Form a team that can contend for the championships and attract more cus-tomers and increase profitability
Maintain and expand the Hanshin Koshien Stadium business
2 Maximise value of the Takarazuka brand
Maintain high capacity utilisation of Takarazuka Revue performances
Increase overseas business Develop content business actively
The Entertainment and Communications
Business is a unique advantage of the Hankyu
Hanshin Holdings Group that other companies
in the industry do not possess. With loyal
fans and fame not only in the Kansai area but
also nationwide, the Hanshin Tigers, Hanshin
Koshien Stadium, and Takarazuka Revue
contribute significantly to the enhance-
ment of the Group’s brand value. By con-
tinuing to develop powerful brands and
high-quality performances that inspire and
excite customers, we will enhance cus-
tomer loyalty and maximise brand value.
Further, the communication and media
businesses will grow earnings in the infor-
mation services business, which is likely to
see market growth.
3 Sustain growth of the communication and media businesses
Grow earnings in the information ser-vices business continuously by increas-ing earnings in target growth markets, developing businesses outside the Group with focus on the Kanto and Chubu areas, and catering to new IT markets
Achieve stable earnings in the broad-cast and communications business by expanding and improving regionally based products and services, acquiring customers mainly through communica-tions services, and retaining customers through the introduction and develop-ment of lifestyle services
4 Advance growth of other sports busi-nesses and the leisure business
Increase scale of the music business, businesses peripheral to sports, and the leisure business
Hankyu Hanshin Holdings • Annual Report 201740

Entertainment and Communications
The Entertainment and Communications Business posted a 2.4%, or
¥2,703 million, year-on-year increase in revenues from operations, to
¥115,193 million, thanks to the robust results of the communication
and media businesses. As a consequence of the sports business be-
ginning live distribution through a sports broadcasting website from
the 2016 season and the favourable results of performances in the
stage business, operating income rose 2.3%, or ¥354 million, year on
year, to ¥15,655 million.
In the sports business, the Hanshin Tigers competed in the Pen-
nant Race under the “Fighting Spirit” team slogan and enjoyed vocal
support from numerous fans. Further, merchandise concessions’
player-related products and limited edition products proved popular
at Hanshin Koshien Stadium. In addition, we enhanced the appeal
of the stadium by improving and expanding the menus of food
concessions.
As for the stage business, all performances of the stage revue
business were well-received, such as the Cosmos Troupe’s per-
formance of Elisabeth: The Rondo of Love & Death and the Snow
Troupe’s performance of Caleb Hunt, Private Eye / Greatest HITS!
Meanwhile, the theatre business produced a range of performances
that attracted strong public interest. For example, we marked the
20th anniversary of the Takarazuka Revue’s first performance with the
Elisabeth TAKARAZUKA 20th Anniversary Special Gala Concert and
produced Biohazard–Voice of Gaia, a musical based on a popular game.
In the communication and media businesses, the information
services business performed favourably in the areas of systems de-
velopment outsourcing and e-commerce website construction and
maintenance. Also, the broadcast and communications business
sought to increase cable television subscriber numbers. In addition,
the business saw a steady rise in subscriber numbers for consumer
Internet services based on local broadband wireless access services.
In the Mt. Rokko area, we attracted more customers through
events and promotions integrating diverse content with the natural
beauty of Mt. Rokko.
Fiscal 2017 Review of Operations
In light of an expected rise in cable television subscriber numbers in
the communication and media businesses, the Entertainment and
Communications Business is projected to record a 0.1%, or ¥0.1 bil-
lion, year-on-year increase in revenues from operations, to ¥115.3
billion. However, due to expectations of a decline in the high capacity
utilisation of Takarazuka Revue performances as well as lower sales of
related products in the stage business, operating income is forecast
to decrease 7.6%, or ¥1.2 billion, year on year, to ¥14.5 billion.
115.2 115.3110.4 112.6 112.5
12.9 13.3 13.6 13.612.6
0
40
80
120
160
0
4
8
12
16
2018(Est.)
2014 20172015 2016 (FY)
Revenues from operations Operating income margin (right axis)
Fiscal 2018 Outlook
Outlook for revenues from operations and operating income margin (¥ billion) (%)
Total attendance at Hanshin Tigers home games(Thousands of people)
20162012 20152013 2014
2,9112,690
2,8782,728 2,772
0
1,000
2,000
3,000
4,000
(CY)
Hankyu Hanshin Holdings • Annual Report 2017 41
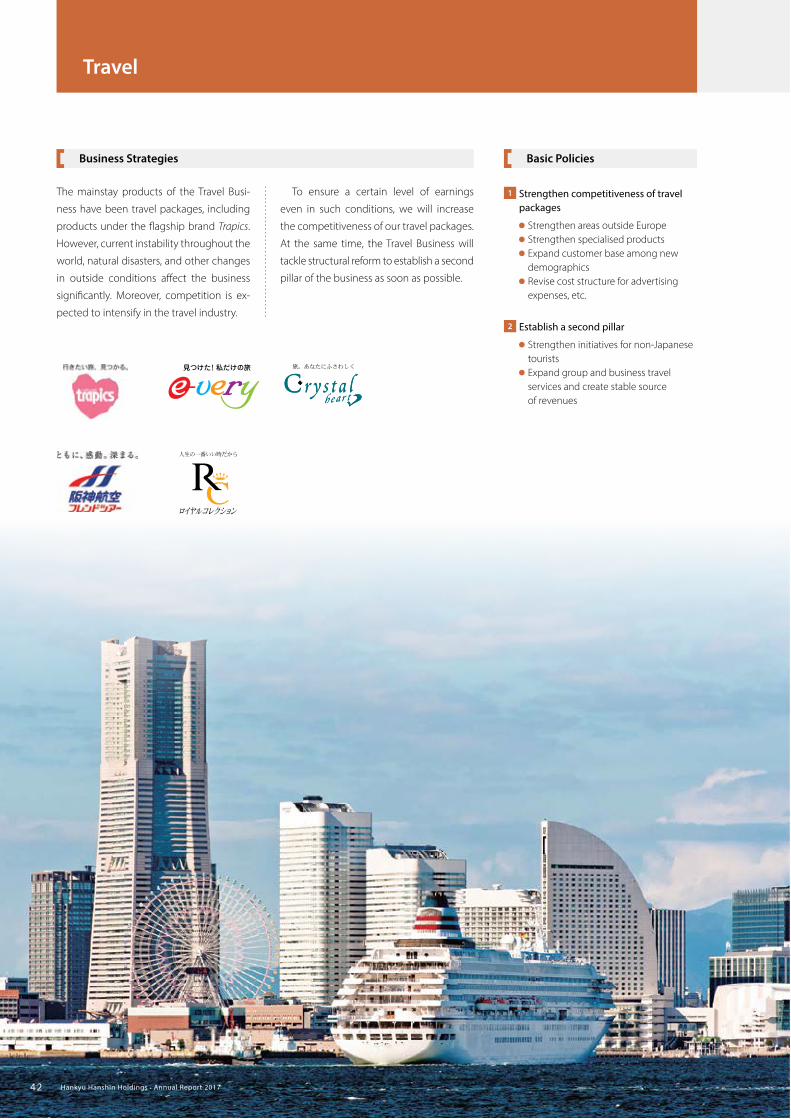
Travel
1 Strengthen competitiveness of travel packages
Strengthen areas outside Europe Strengthen specialised products Expand customer base among new
demographics Revise cost structure for advertising
expenses, etc.
2 Establish a second pillar
Strengthen initiatives for non-Japanese tourists
Expand group and business travel services and create stable source of revenues
The mainstay products of the Travel Busi-
ness have been travel packages, including
products under the flagship brand Trapics.
However, current instability throughout the
world, natural disasters, and other changes
in outside conditions affect the business
significantly. Moreover, competition is ex-
pected to intensify in the travel industry.
To ensure a certain level of earnings
even in such conditions, we will increase
the competitiveness of our travel packages.
At the same time, the Travel Business will
tackle structural reform to establish a second
pillar of the business as soon as possible.
Basic PoliciesBusiness Strategies
Hankyu Hanshin Holdings • Annual Report 201742

Travel
Due to the significant effect of lower revenues from overseas and
domestic travel products, the Travel Business recorded year-on-year
decreases of 1.8%, or ¥563 million, in revenues from operations, to
¥29,938 million, and 6.4%, or ¥43 million, in operating income, to
¥637 million.
Regarding overseas travel products, although demand for travel
to Oceania and East Asia was favourable, demand for travel to Europe
declined as the international situation worsened.
As for domestic travel products, demand for travel to Shikoku was
brisk thanks to the interest that the reverse-order Shikoku Pilgrim-
age* generated. However, due to the major earthquakes that hit
Kumamoto in April 2016, demand for travel to Kyushu decreased.
Meanwhile, we tapped into growing overseas demand by proac-
tively marketing travel products for visitors to Japan. In particular, we
enjoyed strong demand from European visitors. * Performing the Shikoku Pilgrimage in reverse order in leap years is considered auspicious.
Total travel billings (Fiscal 2017)
Rank Company name ¥ billion
1 JTB 1,477.1
2 Rakuten 556.8
3 KNT-CT Holdings 483.0
4 HIS 438.8
5 Nippon Travel Agency 426.7
6 Hankyu Travel International* 318.7
7 JTB World Vacations 204.7
8 ANA Sales 195.8
9 JALPAK 179.6
10 Tobu Top Tours 139.0
Overseas travel billings (Fiscal 2017)
Rank Company name ¥ billion
1 JTB 413.9
2 HIS 355.2
3 JTB World Vacations 204.7
4 Hankyu Travel International* 186.9
5 KNT-CT Holdings 139.5
6 Nippon Travel Agency 116.6
7 JTB Business Travel Solutions 61.1
8 JALPAK 53.9
9 DeNA Travel 48.9
10 Nissin Travel Service 44.1
Domestic travel billings (Fiscal 2017)
Rank Company name ¥ billion
1 JTB 977.2
2 Rakuten 514.1
3 KNT-CT Holdings 323.5
4 Nippon Travel Agency 274.3
5 ANA Sales 174.0
6 Hankyu Travel International* 129.0
7 JALPAK 125.7
8 Tobu Top Tours 101.7
9 JR TOKAI TOURS 93.4
10 Meitetsu World Travel 76.3
Source: Japan Tourism Agency Bulletin, “Business Volume for Major Travel Agents (April 2016 to March 2017)”Note: Billings are rounded down to the nearest ¥100 million.* The total of Hankyu Travel International Co., Ltd., Hankyu Hanshin Business Travel Co., Ltd., and Hanshin Travel International Co., Ltd.
Fiscal 2017 Review of Operations
We expect that higher demand for overseas and domestic travel
products will produce an 8.0%, or ¥2.4 billion, year-on-year increase
in revenues from operations, to ¥32.3 billion. Operating income is
projected to decline 16.7%, or ¥0.1 billion, year on year, to ¥0.5 billion,
due to higher expenses arising from forward-looking structural
reform of the business.
Fiscal 2018 Outlook
Revenues from operations Operating income margin (right axis)
29.932.3
33.032.0
30.5
0
10
20
30
40
50
0
1
2
3
4
5
3.63.8
2.32.0
1.5
2018(Est.)
2014 20172015 2016 (FY)
Outlook for revenues from operations and operating income margin (¥ billion) (%)
Hankyu Hanshin Holdings • Annual Report 2017 43
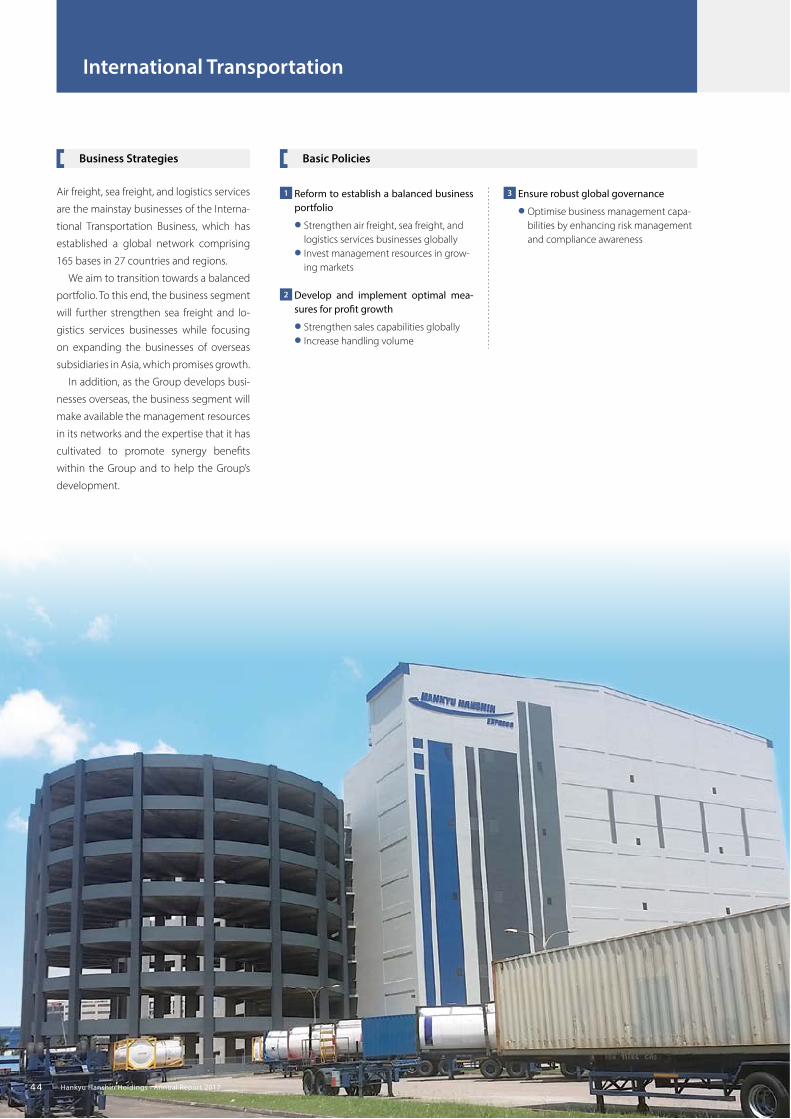
International Transportation
1 Reform to establish a balanced business portfolio
Strengthen air freight, sea freight, and logistics services businesses globally
Invest management resources in grow-ing markets
2 Develop and implement optimal mea-sures for profit growth
Strengthen sales capabilities globally Increase handling volume
Air freight, sea freight, and logistics services
are the mainstay businesses of the Interna-
tional Transportation Business, which has
established a global network comprising
165 bases in 27 countries and regions.
We aim to transition towards a balanced
portfolio. To this end, the business segment
will further strengthen sea freight and lo-
gistics services businesses while focusing
on expanding the businesses of overseas
subsidiaries in Asia, which promises growth.
In addition, as the Group develops busi-
nesses overseas, the business segment will
make available the management resources
in its networks and the expertise that it has
cultivated to promote synergy benefits
within the Group and to help the Group’s
development.
3 Ensure robust global governance
Optimise business management capa-bilities by enhancing risk management and compliance awareness
Basic PoliciesBusiness Strategies
Hankyu Hanshin Holdings • Annual Report 201744

Seattle
Bajio
San FranciscoLos Angeles
New YorkBoston
Kaohsiung
Busan
IncheonBucheon
CebuHai Phong
Laem Chabang
Chiang MaiBawal
Mumbai
Dubai
Nairobi
Bangalore
PuneChennai
Penang
Port KlangJohor Bharu
ButterworthPasir Gudang
Ho Chi Minh CityBinh DuongPhnom Penh
Atlanta
Sao Paulo
TorontoDetroit
Cincinnati
DallasMcAllen
Rotterdam
Dusseldorf
MoscowBrussels
Paris
MilanPrague
Johannesburg
Taichung
Dong Nai
Chicago
Mexico City
Beijing Seoul
Shanghai
Manila
Taipei
Hong Kong
Guangzhou
Bangkok
Yangon
Hanoi
Singapore
Kuala LumpurJakarta
Delhi
AmsterdamFrankfurtLondon
International Transportation
Due to a decline in the yen-equivalent value of overseas subsidiaries’
revenues and earnings that accompanied exchange rate fluctua-
tions, the business segment recorded year-on-year decreases of
5.8%, or ¥4,422 million, in revenues from operations, to ¥71,670 million,
and 11.2%, or ¥200 million, in operating income, to ¥1,587 million.
In East Asia and the ASEAN region, air freight and sea freight busi-
nesses performed steadily. Meanwhile, the performance of air freight
businesses in the Americas and Europe was sluggish. Also, subsidiar-
ies in Japan saw steady sea freight exports but continued to face
challenging conditions for air freight imports.
In response to the above conditions, we expanded businesses in
the ASEAN region, which is likely to continue growing. Specifically,
we opened logistics centres in Indonesia in March 2016 and in Singa-
pore in May 2017.
Network of bases: 119 overseas bases (as of 1st July 2017)
Strengthening of business develop-ment in East Africa
In June 2017, the Group sent an employee to an affiliated agency in Nairobi, Kenya. In coordination with the personnel of our representative office in Johannesburg, South Africa, these employees will step up business development in East Africa—a region into which growing numbers of Japanese companies are making forays.
Establishment of new base in India
In July 2017, we opened a sales base in the Neemrana / Bawal area, for which we used to conduct sales ac-tivities from our headquarters in Delhi. By strength-ening our sales network, we aim to develop new business in the area, which has the highest concen-tration of Japanese companies in northern India.
Local subsidiary Branch Representative office
Expansion of the logistics business in the United States
Aiming to expand operations as demand for logistics centres increases in the Chicago area, we added to our existing logistics centre in the area by opening a facility near Chicago O’Hare International Airport in February 2017.
Construction of new logistics centres in the ASEAN region
Following on from the 2016 opening of a logistics centre in Indonesia, in May 2017 the Group opened its largest logistics centre in Singapore, which has major advantages as an international logistics hub. The new logistics centre conducts high-value-added operations, handling electronic components, medical equipment, pharmaceuticals, and other products of Singapore’s priority industrial fields.
Fiscal 2017 Review of Operations
We expect that higher handling volume will result in year-on-year
in creases of 2.0%, or ¥1.4 billion, in revenues from operations, to
¥73.1 billion, and 6.3%, or ¥0.1 billion, in operating income, to ¥1.7 billion.
71.7 73.1
37.7 39.4
76.1
0
20
40
60
80
100
0
2
4
6
8
10
5.6
7.9
2.3 2.2 2.3
2018(Est.)
2014 20172015 2016 (FY)
Revenues from operations Operating income margin (right axis)Note: As of fiscal 2016, revenues from operations will be presented on a gross basis
rather than a net basis (total transactions net of freight costs).
Fiscal 2018 Outlook
Outlook for revenues from operations and operating income margin (¥ billion) (%)
Hankyu Hanshin Holdings • Annual Report 2017 45

Hotel network of the Hankyu-Hanshin-Daiichi Hotel GroupHotels Guest rooms
Directly managed hotels (Hankyu Hanshin Hotels) 19 4,933
Other (franchises, etc.) 29 5,760
Total 48 10,693
Tokyo metropolitan area
× 7 × 4
Kyoto, Osaka, Kobe × 11 × 1
Hotels
1 Improve profitability of existing hotels
Maintain and enhance product value through appropriate investment
2 Expand network by opening new hotels
Implement plan to open new REMM hotels, which mainly comprise guest rooms for overnight stays
In the Hotels Business, Hankyu Hanshin
Hotels Co., Ltd., directly manages 19 hotels
with 4,933 guest rooms mainly in the Kinki
region and the Tokyo metropolitan area. To
heighten the profitability of these hotels,
we will take a range of measures, such as
refurbishing guest rooms and restaurants
and developing high-value-added products.
In addition, we will grow earnings by ex-
ploiting opportunities that the increase in
visitors to Japan presents. Specifically, we
will select locations carefully and focus on
opening REMM hotels, which mainly com-
prise guest rooms for overnight stays.
Basic PoliciesBusiness Strategies
Hankyu Hanshin Holdings • Annual Report 201746

ホホホホホ
Withdrawal from the management of certain non-hotel restaurants
and a year-on-year decrease in revenues from the accommodation
and banquet areas resulted in the Hotels Business posting year-on-
year declines of 3.5%, or ¥2,401 million, in revenues from operations,
to ¥65,640 million, and 15.2%, or ¥502 million, in operating income,
to ¥2,795 million.
In fiscal 2017, we stepped-up efforts to capture accommodation
demand by refurbishing facilities steadily. As part of these efforts, we
increased the number of guest rooms of Hotel new Hankyu Osaka.
Moreover, we opened REMM Roppongi as our fifth hotel that mainly
comprises guest rooms for overnight stays. Further, we advanced
sales activities energetically. For example, we held various types of
marketing campaigns to mark the 35th anniversary of Hotel new
Hankyu Kyoto and the 90th anniversary of the Takarazuka Hotel. We
also opened our inaugural overseas sales office in Singapore with
our sights set on capturing the anticipated growth in demand as
more tourists from the ASEAN region visit Japan.
Average daily rates (ADR) and occupancy rates of Hankyu Hanshin Hotels in the Tokyo metropolitan area and Kansai area(Yen) (%)
Non-Japanese guests as a percentage of overnight-stay guests (%)
20172015 2016
17,221 16,665
94.392.2
15,853
93.9
0
5,000
10,000
15,000
20,000
0
25
50
75
100
11,616
14,619 14,140
88.6 90.590.8
(FY)
12.710.0
12.3
17.3
25.0
36.9
38.1
16.413.1
14.9
22.7
31.4
38.6
37.0
2011 2012 2013 2014 2015 2016 2017
0
10
20
30
40
(FY)
Tokyo metropolitan area ADR Kansai area ADR Tokyo metropolitan area occupancy rate (right axis) Kansai area occupancy rate (right axis)
Tokyo metropolitan area Kansai area
Fiscal 2017 Review of Operations
The recent opening of REMM Roppongi and other factors are likely
to enable a 3.5%, or ¥2.3 billion, year-on-year increase in revenues
from operations, to ¥67.9 billion. Higher costs accompanying the
opening and refurbishment of hotels are expected to lead to a 7.1%, or
¥0.2 billion, year-on-year decline in operating income, to ¥2.6 billion.
Fiscal 2018 Outlook
Hotels
65.6 67.963.7 63.0
68.0
0
20
40
60
80
100
0
2
4
6
8
10
1.3
1.9
4.94.3
3.8
2018(Est.)
2014 20172015 2016 (FY)
Revenues from operations Operating income margin (right axis)
Visitors to Japan (Millions of people) (%)
2012 2013 2014 2015 2016
0
8.4
32.633.3
35.7
2.7
10.4
3.5
19.7
24.0
13.4
7.910.2
40.0
42.6
4.8
(CY)
33
36
39
42
45
0
5
10
15
20
25
Nationwide Kansai area Percentage visiting Kansai area (right axis)Source: “Consumption Trend Survey for Foreigners Visiting Japan,” Japan National
Tourism Organization (JNTO), Japan Tourism Agency
Outlook for revenues from operations and operating income margin (¥ billion) (%)
Hankyu Hanshin Holdings • Annual Report 2017 47

Directors and Audit & Supervisory Board Members(As of 13th June 2017)
Yoshihiro NakagawaDirector (Part-time)
1976 Joined Hankyu Corporation2005 Director, Hankyu Corporation2007 Managing Director, Hankyu Corporation2013 Representative and Senior Managing Director, Hankyu Corporation2014 President, Hankyu Corporation (Current position)2014 Director, Hankyu Hanshin Holdings (Current position)2017 Chairman, Hankyu Hanshin Hotels (Current position)
Naoya ArakiDirector (Part-time)
1981 Joined Hankyu Department Store2012 President, Hankyu Hanshin Department Stores (Current position)2012 Representative Director, H2O Retailing (Current position)2017 Director, Hankyu Hanshin Holdings (Current position)
Yoshishige ShimataniDirector (Part-time)
1975 Joined Toho2011 President, Toho (Current position)2015 Director, Hankyu Hanshin Holdings (Current position)
Takaoki FujiwaraRepresentative Director
1975 Joined Hanshin Electric Railway2005 Director, Hanshin Electric Railway2007 Managing Director, Hanshin Electric Railway2011 President, Hanshin Electric Railway2011 Director, Hankyu Hanshin Holdings2015 Chairman, Hanshin Hotel Systems (Current position)2017 Chairman, Hanshin Electric Railway (Current position)2017 Director, Hankyu Hanshin Holdings (Current position)
Noriyuki InoueDirector (External*1)
1957 Joined Daikin Industries1994 President, Daikin Industries2002 Chairman and CEO, Daikin Industries2003 Director, Hankyu Corporation2005 Director, Hankyu Holdings2006 Director, Hankyu Hanshin Holdings (Current position)2014 Chairman of Daikin Industries and Chief Global Group Officer
(Current position)
Shosuke MoriDirector (External*1)
1963 Joined Kansai Electric Power2005 President, Kansai Electric Power2010 Director, Hankyu Hanshin Holdings (Current position)2010 Chairman, Kansai Electric Power2016 Senior Advisor, Kansai Electric Power (Current position)
Kazuo SumiChairman and Representative Director, Group Chief Executive Officer
1973 Joined Hankyu Corporation2000 Director, Hankyu Corporation2002 Managing Director, Hankyu Corporation2003 President, Hankyu Corporation2005 President, Hankyu Holdings2006 President, Hankyu Hanshin Holdings2008 Director, Hankyu Hanshin Hotels (Current position)2014 Chairman, Hankyu Corporation (Current position)2017 Chairman, Hankyu Hanshin Holdings (Current position)
Masao ShinExecutive Vice President and Representative Director
1981 Joined Hanshin Electric Railway2006 Director, Hanshin Electric Railway2006 Director, Hankyu Hanshin Holdings2008 Managing Director, Hanshin Electric Railway2014 Senior Managing Director, Hanshin Electric Railway2016 Director, Hankyu Corporation (Current position)2017 President, Hanshin Electric Railway (Current position)2017 Executive Vice President, Hankyu Hanshin Holdings (Current position)
Takehiro SugiyamaPresident and Representative Director
1982 Joined Hankyu Corporation2005 Director, Hankyu Corporation2006 Director, Hankyu Holdings2006 Director, Hankyu Hanshin Holdings2007 Managing Director, Hankyu Corporation2016 Executive Vice President, Hankyu Corporation2016 Executive Vice President, Hankyu Hanshin Holdings2016 Director, Hanshin Electric Railway (Current position)2016 Director, Hankyu Travel International (Current position)2016 Director, Hankyu Hanshin Express (Current position)2017 President, Hankyu Corporation (Current position)2017 President, Hankyu Hanshin Holdings (Current position)
Directors
Hankyu Hanshin Holdings • Annual Report 201748

*1 Mr. Noriyuki Inoue and Mr. Shosuke Mori satisfy the qualifications of external directors as provided in Article 2, Paragraph 15 of the Corporate Law. The Company has submitted notifications to the stock exchanges on which its shares are listed, naming Mr. Inoue and Mr. Mori as external (independent) directors.
*2 Mr. Haruo Sakaguchi, Mr. Junzo Ishii, and Mr. Michiari Komiyama satisfy the qualifications of external Audit & Supervisory Board members as provided in Article 2, Paragraph 16 of the Corporate Law.
The Company has submitted notifications to the stock exchanges on which its shares are listed, naming Mr. Sakaguchi, Mr. Ishii, and Mr. Komiyama as external (independent) Audit & Supervisory Board members.
Haruo SakaguchiAudit & Supervisory Board Member (External*2)
1958 Lawyer (Current position)1989 Vice Chairman, Japan Federation of Bar Associations2006 Audit & Supervisory Board Member, Hankyu Holdings2006 Audit & Supervisory Board Member, Hankyu Corporation
(Current position)2006 Audit & Supervisory Board Member, Hankyu Hanshin Holdings
(Current position)2013 Audit & Supervisory Board Member, Hankyu Hanshin Hotels
(Current position)
Junzo IshiiAudit & Supervisory Board Member (External*2)
1986 Professor of Faculty of Commerce, Doshisha University1989 Professor of Faculty of Business Administration, Kobe University1999 Professor of Faculty of Business Administration, Graduate School of
Kobe University2008 President of the University of Marketing and Distribution Sciences2010 Audit & Supervisory Board Member, Hankyu Hanshin Holdings
(Current position)2010 Audit & Supervisory Board Member, Hanshin Electric Railway
(Current position)2016 Director, Distribution Science Research Center (Current position)
Koichi KobayashiStanding Audit & Supervisory Board Member
1982 Joined Hankyu Corporation2005 Director, Hankyu Holdings2006 Director, Hankyu Hanshin Holdings2013 Director, Hankyu Corporation2015 Managing Director, Hankyu Corporation2016 Standing Audit & Supervisory Board Member, Hankyu Corporation
(Current position)2016 Standing Audit & Supervisory Board Member, Hankyu Hanshin Holdings
(Current position)
Michiari KomiyamaAudit & Supervisory Board Member (External*2)
1971 Prosecutor1999 Prosecutor, Supreme Public Prosecutor’s Office1999 Chief Prosecutor, Saga District Public Prosecutor’s Office2002 Chief Prosecutor, Kobe District Public Prosecutor’s Office2003 Notary, Osaka Legal Affairs Bureau2013 Lawyer (Current position)2017 Audit & Supervisory Board Member, Hankyu Hanshin Holdings
(Current position)2017 Audit & Supervisory Board Member, Hankyu Corporation
(Current position)
Masayoshi IshibashiStanding Audit & Supervisory Board Member
1979 Joined Hanshin Electric Railway2013 Standing Audit & Supervisory Board Member, Hanshin Electric Railway
(Current position)2013 Standing Audit & Supervisory Board Member, Hankyu Hanshin Holdings
(Current position)
Audit & Supervisory Board Members
Directors and Audit & Supervisory Board Members
Hankyu Hanshin Holdings • Annual Report 2017 49

I think the Group has done well to overcome a range of difficulties and realise a highly successful management integration.
Since becoming an external director of the Hankyu Corporation in
2003, I have seen many different phases of business management,
including the management integration of Hankyu Holdings and
Hanshin Electric Railway.
At the time of my appointment, Hankyu Corporation and the Group
it subsequently became part of were in a phase of balanced contrac-
tion. Consequently, many of the agenda items submitted to meet-
ings of the Board of Directors concerned business reorganisation or
disposal of the Group’s negative legacy. However, this process was
essential to ensure the Group’s sustainability and growth potential.
In my view, correct decisions that the management team made in this
period to dispose of nonperforming assets and withdraw from unprof-
itable businesses enabled the current recovery in performance.
In addition, the 2006 management integration became a major driver
of the significant advances that the Group subsequently made. Since
management integration, both companies have respected each
other’s values while increasing integration and heightening employ-
ees’ sense of belonging to the Group. Further, the management
team reorganised similar businesses to build a structure that shared
strengths while reinforcing areas of weaknesses. At the same time,
the Group steadily advanced large-scale projects, which have
become an important part of the Group’s earnings foundations.
Thanks to the cumulative effect of the above efforts, business
results have seen a V-shaped turnaround over the past several years.
Moreover, the Group has paved the way for improvement of its finan-
cial position, which was an issue. As a result, returns to shareholders
have been rising steadily, and shareholders’ evaluation of the Group
has become increasingly positive. Thinking back to the time of the
Group’s inception, I believe the decision to pursue management
integration was bold and far-sighted.
Recently, agenda items related to business expansion in the Tokyo
metropolitan area and overseas forays are more prevalent at meet-
ings of the Board of Directors. This change in topics underscores
business management’s entry into a new phase and suggests fur-
ther growth going forward.
The Group is seeking approaches to corporate governance that will continuously enhance corporate value.
In 2016, the Group established the Corporate Governance Committee,
which comprises the president and representative director, external
directors, standing Audit & Supervisory Board members, and exter-
nal Audit & Supervisory Board members. In addition to providing
consultation in relation to the appointment and compensation of
executives, the committee enables external directors to coordinate
and share information. Further, the Group’s steady bolstering of
corporate governance to make it more visible to outsiders is com-
mendable. As part of these efforts, in 2017 the Group reduced the
number of directors to increase the ratio of external directors to
directors and abolished its senior advisor system.
However, companies cannot achieve truly effective corporate
governance just by satisfying formal requirements. Therefore, I
believe that it is important for companies to establish their own
unique approaches to governance that will contribute to continu-
ous enhancement of corporate value. For example, Hankyu Hanshin
Holdings, Inc., is a pure holding company, which means that, in
principle, Group companies under the management of the Company
are responsible for operational implementation, while the Company
monitors and supervises the Group as a whole. In this way, oversight
and execution are separated. The above system enables prompt,
appropriate operational implementation, and as such I think it is
effective for the Group, which encompasses a wide variety of busi-
nesses. Meanwhile, the Group’s Board of Directors receives the infor-
mation about businesses that it needs, enabling it to reach important
management decisions without impediment.
As an external director, naturally I perform monitoring and oversight
functions. I think another important role entails using my expertise
to help raise the level of the Group’s business management. I intend
to fulfill this role by encouraging decision making that enhances
corporate value.
A Message from an External Director
From Management Integration to the Present Day
Current Corporate Governance
Hankyu Hanshin Holdings • Annual Report 201750

I will support the Group as it takes on challenges to sustain growth.
Since its establishment, the Hankyu Hanshin Holdings Group has
built a firm position based on the business model established by
Hankyu Corporation’s founder, Ichizo Kobayashi. Specifically, the
Group is centred on the Urban Transportation Business, develops
real estate in Umeda and line-side areas, and heightens the value of
line-side areas and brand power through the leisure business, the
Hotels Business, and other operations. Looking ahead, however,
there is no doubt that society will become increasingly aged. This
means that the Group’s existing business model, premised on popu-
lation growth, is at a crossroads. Against this backdrop, I think that
the management team’s decisions based on the Long-Term
Management Vision for 2025 are appropriate. In other words, I
endorse the Group’s efforts to enhance the stability of earnings foun-
dations and heighten the value of line-side areas while developing
businesses in the Tokyo metropolitan area and overseas with a view
to the future.
The Group’s entry into new business fields is of course accompa-
nied by corresponding amounts of risk. Conversely, without risk
there are no opportunities. Also, risk has the added benefit of
increasing companies’ resilience. In addition, given the dizzying
speed of change in business conditions that technological innova-
tion has spurred in recent years, there is no guarantee that
approaches that have succeeded in the past will continue to do so.
Companies whose decisions are not timely can lose growth oppor-
tunities. Therefore, I feel that the ability to objectively weigh the
significance and profit potential of projects against their attendant
risks and arrive at bold decisions promptly will be more important
than ever in business management going forward. As an external
director, I also want to incorporate this sense of urgency and support
the Group as it takes on challenges to sustain growth.
If I may digress slightly, at Daikin Industries, Ltd., where I serve as
chairman, we believe that the potential of each person is limitless
and that companies only prosper when individual employees grow.
Accordingly, we have pursued employee-oriented business man-
agement. Our overseas sales have grown significantly and now
account for 75% of net sales. I think we have achieved this because
in countries worldwide we have proactively developed and utilised
personnel, and their realisation of diverse capabilities has benefited
the company. At present, the Hankyu Hanshin Holdings Group has
moved into a phase of actively pursuing overseas development.
Therefore, its development and promotion of critical personnel has
just begun. With this in mind, I expect that there will be opportuni-
ties for me to offer advice about personnel and other matters based
on my experience.
The slogan of the recently announced long-term vision is “enhanc-
ing line-side areas and expanding fields,” which I think clearly states
the direction in which the Group is traveling. The Group will take
maximum advantage of the collective strength and brand power it
has accumulated through diverse businesses to rigorously pursue its
eternal mission of enhancing the value of line-side areas. In addition,
the Group will discover new geographical areas and business fields
for its activities. Each employee should be made fully aware that
these are the two overriding strategies through which the Group
aims to sustain growth. I am confident that all employees will drive
the Group toward realisation of the long-term vision by leveraging
their collective strength and demonstrating commitment to and
pride in the Group’s future.
Toward Realisation of the Long-Term Vision
I will reflect the viewpoints of stakeholders, particularly those of shareholders, in conducting monitoring and supervising of business management. At the same time, by making proposals based on my corporate management experience, I intend to support the Group as it takes on challenges to sustain growth.
Noriyuki InoueExternal Director
A Message from an External Director
Hankyu Hanshin Holdings • Annual Report 2017 51

Management Organisation
Basic Approach to Corporate GovernancePrinciples 2-1 2-2 3-1
Based on the Group mission and values set out in its Group Management Philosophy, the Company aims to remain a company that customers and other stakeholders trust. To this end, the Company is strengthening and increasing corporate governance by heightening the transparency and soundness of business manage-ment and ensuring appropriate, timely disclosure. Reflecting this basic approach, the Company has established the policies below with a view to sustaining growth and enhancing cor-porate value over the medium-to-long term.
We shall respect shareholders’ rights and ensure equality. We shall take into consideration the interests of shareholders and other stakeholders and cooperate with stakeholders appropriately. We shall disclose corporate information appropriately and ensure transparency. We shall ensure that the Board of Directors performs its roles and duties appropriately and ensure advanced oversight and decision making. We shall have constructive dialogue with shareholders with a view to sustaining our growth and enhancing corporate value over the medium-to-long term.
Corporate Governance SystemPrinciples 4-1 4-10
Hankyu Hanshin Holdings, Inc. (the Company), is a pure holding company, and the conduct of operations is basically the respon-sibility of Group member companies. Hankyu Hanshin Holdings’ principal role is supervision and oversight of the entire Group—meaning that these functions are separate from the conduct of Group businesses. Through this system, the Company realises supervision and over-sight and enhances the overall governance of the Group by:
Making decisions regarding the Group’s management policies and strategies,
Deciding on the approval of the medium-term or annual man-agement plans of all core businesses,
Requiring timely submission of progress reports by operating companies, and
Having Group companies obtain approval before taking actions that affect the Group’s management significantly (for example, investments above a certain threshold).
With regard to the above matters, the Board of Directors, which includes external directors, makes approval decisions and receives reports. Moreover, to undertake preliminary reviews the Company has established a Group Management Committee, which includes representatives of the Group’s core businesses. Further, to ensure transparency in the appointment and compen-sation of the Company’s directors and to facilitate coordination among external directors, the Group has established the Corporate Governance Committee, which comprises external directors and external Audit & Supervisory Board members who are independent of the Company, the president and representative director, and standing Audit & Supervisory Board members. In addition, as part of efforts to strengthen its overall capabilities, the Company is strengthening the governance of funding. Measures include centralising funding under the Company and distributing funds to operating companies within the limits set out in business plans that the Company has approved.
Corporate Governance System
General Meeting of Shareholders
Appointment / Dismissal
Call
Audit
Participate
Call / Report on execution situation
Consultation (nomination,
compensation)
Selection / Dismissal / Supervision
Participate (as observer)
Appointment / Dismissal
Audit
Report
Report Cooperation
Report
Accounting audit
Cooperation
Appointment / Dismissal
Accounting Auditors (CPAs)Full-time: 4
Part-time: 5(including 2
External Directors)
Chairman & PresidentCorporate Governance Committee
Group Auditing Division
Staff of Audit & Supervisory Board
Members
Group Management Committee
Board of Directors
Directors (representative of each core business)
Group Companies
Standing Audit & Supervisory Board Members: 2
External Audit & Supervisory Board Members: 3
Audit & Supervisory Board
Corporate Governance
X-X Figures in boxes correspond to the principles of Japan’s Corporate Governance Code.
Hankyu Hanshin Holdings • Annual Report 201752

Audit & Supervisory
Board
Board of Directors
Management Organisation(1) Board of Directors and DirectorsPrinciples 4-1 4-2 4-6 4-11
The Board of Directors enhances governance of the entire Group and oversight of respective companies by deciding on matters pursuant to statutory laws and regulations and the articles of incor-poration based on regulations and standards that the Board of Directors has established, by deciding on the approval of manage-ment policies and strategies of the Company and the Group as well as the management plans of core businesses, and by requiring timely reporting from operating companies about Group companies’ significant investments. Aiming to strengthen the management oversight of the Board of Directors and ensure the transparency of business management by increasing the proportion of external directors, the Company reduced the number of directors from 14 to nine at the General Meeting of Shareholders held in June 2017. Under the new system, the Company is strengthening monitoring and oversight and raising the standard of decision making by appointing five of its nine direc-tors as part-time directors, including two external directors who are independent of the Company and have abundant experience in corporate management.
Notes:1. Number of members of the Board of Directors The articles of incorporation of the Company stipulate that the number of members of
the Company’s Board of Directors shall be three or more.2. Requirements for the election of directors The articles of incorporation of the Company stipulate that the approval of resolutions
for the election of directors shall require the attendance of shareholders that have at least one-third of the voting rights of shareholders for which voting rights can be exer-cised and shall require a majority of these voting rights. Further, the articles of incorpo-ration stipulate that such resolutions shall not be approved through cumulative voting.
(2) Audit & Supervisory Board and Audit & Supervisory Board Members
Principle 4-4 The Company has adopted the Audit & Supervisory Board system to ensure adequate management oversight. We have five Audit & Supervisory Board members, who monitor the business operations and financial position of the Company and its subsidiaries, and audit the performance of duties by the directors. Three of the five Audit & Supervisory Board members are external, to provide an independent viewpoint and ensure a high degree of professionalism in Group auditing. In this way, we are working to further ensure sound deci-sion making in the conduct of operations. We provide full backup to Audit & Supervisory Board members, for example by involving them in the Group Management Committee and other meetings within the Group. The Audit & Supervisory Board meets once a month, in principle, to discuss and pass resolutions on important matters. In addition, as part of the auditing of the Group’s business opera-tions, the Audit & Supervisory Board members peruse when appro-priate auditing plans and results of audits of the Group Auditing Division, composed of internal audit staff. The Audit & Supervisory Board members also receive from the Group Auditing Division regular reports (and ad hoc reports when required) on internal audits at the Company and its subsidiaries, including on the state of opera-tion of the whistle-blowing system. At the same time, the Audit & Supervisory Board members receive regular status reports from the accounting auditors (CPAs) and take part in on-site audits by the accounting auditors including those of Group companies.
Management Organisation
System reflecting the business management viewpoints of operating companies in the holding Company’s governance
Hankyu Hanshin Holdings Core companiesName Position Name of company Position
Kazuo Sumi Chairman and Representative Director, Group CEO
Hankyu CorporationHankyu Hanshin Hotels
ChairmanDirector (Part-time)
Takehiro Sugiyama President and Representative Director Hankyu CorporationHanshin Electric RailwayHankyu Travel InternationalHankyu Hanshin Express
PresidentDirector (Part-time)Director (Part-time)Director (Part-time)
Masao Shin Executive Vice President and Representative Director
Hankyu CorporationHanshin Electric Railway
Director (Part-time)President
Takaoki Fujiwara Representative Director Hanshin Electric Railway Chairman
Noriyuki Inoue Director (External)
Shosuke Mori Director (External)
Yoshishige Shimatani
Director (Part-time)
Naoya Araki Director (Part-time)
Yoshihiro Nakagawa Director (Part-time) Hankyu Hanshin Hotels Chairman
Masayoshi Ishibashi Standing Audit & Supervisory Board Member
Hanshin Electric Railway Standing Audit & Supervisory Board Member
Koichi Kobayashi Standing Audit & Supervisory Board Member
Hankyu Corporation Standing Audit & Supervisory Board Member
Haruo Sakaguchi Audit & Supervisory Board Member (External)
Hankyu CorporationHankyu Hanshin Hotels
Audit & Supervisory Board MemberAudit & Supervisory Board Member
Junzo Ishii Audit & Supervisory Board Member (External)
Hanshin Electric Railway Audit & Supervisory Board Member
Michiari Komiyama Audit & Supervisory Board Member (External)
Hankyu Corporation Audit & Supervisory Board Member
Hankyu Hanshin Holdings • Annual Report 2017 53

(3) Roles and Functions of External Directors and External Audit & Supervisory Board Members
Principles 4-7 4-9
The Company appoints independent external directors and Audit & Supervisory Board members with the aim of further enhancing the governance of the Group through their contributions to meetings of the Board of Directors and the Audit & Supervisory Board, as well as other activities. The external directors appointed to the Board are selected from amongst persons with extensive experience in corporate manage-ment, with the aim of strengthening the management oversight function of the Board of Directors with respect to the Group as a whole, and also in the expectation that the external directors will provide advice to the Company’s management from a broad per-spective. Similarly, the external Audit & Supervisory Board members whom we appoint are selected from amongst persons possessing high-level specialist expertise in the fields of compliance and busi-ness administration. Further, to ensure that it assesses the independence of external directors and external Audit & Supervisory Board members objectively, in light of the Tokyo Stock Exchange’s independence requirements, the Company has established the Independence Criteria below.
Independence CriteriaTo be deemed independent, external directors and external Audit & Supervisory Board members must not belong to any of the following categories.1. Executing persons*1 of the Company’s major shareholders (share-
holders owning 10% or more of the Company’s total voting rights)2. Executing persons of entities for which the Company is a major
business partner*2 or executing persons of the Company’s major business partners
3. Consultants, accounting experts, or legal experts receiving signifi-cant amounts of money or property*3 from the Company that are other than executive compensation (or if a company, union, or other organisation receives the said property, this refers to per-sons belonging to the said organisation)
4. Persons*4 who have recently belonged to any of the categories (a) through (d) below
(a) Persons stated in 1, 2, or 3 above (b) Executing persons of the Company’s parent company or direc-
tors of the Company’s parent company who are not executing persons
(c) Audit & Supervisory Board members of the Company’s parent company (This item applies when external Audit & Supervisory Board members are to be appointed as independent external Audit & Supervisory Board members.)
(d) Executing persons of the Company’s fellow subsidiaries5. Close relatives (within the second degree of kinship) of any of the
persons stated in (a) through (h) below (excluding persons who are not significant)
(a) Persons stated in 1, 2, 3, or 4 above (b) Accounting advisors of the Company (This includes employ-
ees conducting required duties if the said accounting advisor is a company. Same hereinafter.) (This item applies when
external Audit & Supervisory Board members are to be appointed as independent external Audit & Supervisory Board members.)
(c) Executing persons of the Company’s subsidiaries (d) Accounting advisors of the Company’s subsidiaries or directors
of the Company’s subsidiaries who are not executing persons (This item applies when external Audit & Supervisory Board members are to be appointed as independent external Audit & Supervisory Board members.)
(e) Executing persons of the Company’s parent company or direc-tors of the Company’s parent company who are not executing persons
(f ) Audit & Supervisory Board members of the Company’s parent company (This item applies when external Audit & Supervisory Board members are to be appointed as independent external Audit & Supervisory Board members.)
(g) Executing persons of the Company’s fellow subsidiaries (h) Persons who have recently belonged to the categories (b)
through (d) above or who have been executing persons of the Company (This includes directors who are not executing per-sons when external Audit & Supervisory Board members are to be appointed as independent external Audit & Supervisory Board members.)
6. Executing persons of the Hankyu Hanshin Toho Group *1. Executing persons refers to executive directors, executive officers, corporate officers,
managers, and other employees.*2. Major business partners refers to entities belonging to any of the following
categories. (1) Entities that in their most recent fiscal year have received payments equivalent to
2% or more of total annual consolidated sales from the Company or its core compa-nies (Hankyu Corporation, Hanshin Electric Railway, Hankyu Travel International, Hankyu Hanshin Express, and Hankyu Hanshin Hotels)
(2) Entities that in the Company’s most recent fiscal year have made payments to the Company or its core companies equivalent to 2% or more of total annual consoli-dated sales
(3) Regardless of (1) and (2) above, entities that, in relation to financial institutions from which the Company borrows funds, are indispensable in fund-raising of the Company and upon which it is reliant to the extent that there are no substitutes for the said entities
*3. Significant amounts of money or property refers to money or property equivalent to an average of ¥10 million or more per year over the previous three fiscal years.
*4. “Persons who have recently belonged to any of the categories (a) through (d) below” refers to persons who can be deemed equivalent to persons who at present materially belong to any of the categories (a) through (d). For example, this includes persons who belong to any of the categories (a) through (d) when the General Meeting of Shareholders approves resolutions appointing the said independent Board members as external directors or external Audit & Supervisory Board members.
(4) Policies and Procedures for the Appointment of Directors and Audit & Supervisory Board Members
Principle 3-1
Policy for the Appointment of DirectorsThe Company appoints personnel who are well acquainted with the businesses of the Hankyu Hanshin Holdings Group as directors as well as appointing personnel from H2O Retailing Corporation and Toho Co., Ltd., as directors to strengthen collaborative relationships with the Hankyu Hanshin Toho Group. In addition, to raise the standard of decision making and strengthen oversight, the Company appoints independent external directors who have abundant experience and expertise.
Management Organisation
Hankyu Hanshin Holdings • Annual Report 201754

Management Organisation
Policy for the Appointment of Audit & Supervisory Board MembersTo ensure Audit & Supervisory Board members conduct audits effectively and efficiently, the Company has established the Audit & Supervisory Board and appoints internal standing Audit & Supervisory Board members and external Audit & Supervisory Board members. The Company appoints internal Audit & Supervisory Board members who have appropriate expertise in finance, accounting, or law and abundant experience in business fields. Also, the Company appoints external Audit & Supervisory Board members who are independent of the Company and have abundant experi-ence and expertise.
Appointment ProcedureFollowing consultation with the Corporate Governance Committee, the Board of Directors decides on the appointment of candidates for the positions of Audit & Supervisory Board member and director based on the abovementioned appointment policies.
Positions Held Concurrently by Audit & Supervisory Board Members and DirectorsPrinciple 4-11
Name Positions held concurrently at other listed companies
Kazuo Sumi
Director, H2O Retailing CorporationExternal director (Audit & Supervisory Board member, etc.), Toho Co., Ltd.External director, Tokyo Rakutenchi Co., Ltd.
Takaoki Fujiwara
External director, Sanyo Electric Railway Co., Ltd.
Noriyuki Inoue
Chairman and Chief Global Group Officer, Daikin Industries, Ltd.External director, Kansai Electric Power Co., Inc.
Shosuke MoriSenior advisor, Kansai Electric Power Co., Inc.External director, ANA HOLDINGS INC.External director, The Royal Hotel, Ltd.
Yoshishige Shimatani
President and representative director, Toho Co., Ltd.External director, Tokyo Rakutenchi Co., Ltd.External director, Fuji Media Holdings, Inc.
Naoya Araki Representative Director, H2O Retailing Corporation
Junzo Ishii External Audit & Supervisory Board member, Rengo Co., Ltd.
Relations with External DirectorsPrinciple 3-1
Name Reasons for appointment
Noriyuki Inoue
(Independent
Director)
Representative director for many years at Daikin Industries, Ltd. Also served as vice-chairman of Kansai Economic Federation. Appointed for his wealth of management experience, perspective from top business circles, and ability to provide independent input.
Shosuke Mori(Independent
Director)
Representative director for many years at Kansai Electric Power Co., Inc., a company whose opera-tions, like those of the Hankyu Hanshin Holdings Group, are closely bound up with the public good. Also served as chairman of Kansai Economic Feder-ation for many years. Appointed for his wealth of management experience, perspective from top business circles, opinions from the viewpoint of CSR, and ability to provide independent input.
Relations with External Audit & Supervisory Board MembersPrinciple 3-1
Name Reasons for appointment
Haruo Sakaguchi(Independent
Board Member)
Currently a lawyer. Appointed to advise on more compliance-based management and for his ability to provide independent input.
Junzo Ishii(Independent
Board Member)
Former Professor of Faculty of Business Administra-tion within the Graduate School of Kobe University and former President of the University of Marketing and Distribution Sciences. Appointed for his ability to express useful opinions based on his high-level specialist expertise in business administration and for his ability to provide independent input.
Michiari Komiyama(Independent
Board Member)
A member of the legal profession who has served in important positions, including chief prosecutor of the Kobe District Public Prosecutor’s Office, and who is currently active as a lawyer. Appointed because, given his experience, he is expected to provide valuable opinions, particularly about ensur-ing compliance in business management.
Other Deliberative Bodies(1) Corporate Governance CommitteeWith a view to ensuring the transparency of executive appointments and compensation and enabling coordination among external directors and external Audit & Supervisory Board members, the Company has established the Corporate Governance Committee, which comprises four representative directors, two external directors, two standing Audit & Supervisory Board members, and three exter-nal Audit & Supervisory Board members. The committee acts in an advisory capacity with respect to the appointment of candidates to the position of director and the details of the compensation system for directors. Also, the committee provides external directors with information in relation to the Group’s businesses, financial status, and organisation.
(2) Group Management CommitteeThe members of the Group Management Committee include full-time directors, specifically the chairman and representative director, the president and representative director, the executive vice presi-dent and representative director, and the representative director; executive officers; and representatives of each of the Group’s core businesses. The committee convenes to deliberate and decide on the approval of resolutions of the Board of Directors; the manage-ment strategies and business plans of Group companies; systems and rules for maintenance of the holding company system; and sig-nificant Group management matters, such as investments above a certain threshold and reorganisation.
Hankyu Hanshin Holdings • Annual Report 2017 55

Management Organisation
(3) Core Business Strategy CouncilsEach core business has a Core Business Strategy Council, comprising the Company’s chairman and representative director, president and representative director, executive vice president and representative director, representative director, the executive officer in charge of the Group Planning Division, and representatives of each core business. In relation to respective core businesses, the councils delib-erate significant matters concerning future business development as well as the preparation and progress management (performance evaluation) of business plans.
(4) The Group Presidents’ Meeting—Initiatives to Foster Solidarity within the Group
The Hankyu Hanshin Holdings Group comprises over 150 Group companies. The Group Presidents’ Meeting, held twice a year, brings together presidents of those Group subsidiaries and affiliates. It is designed to foster a deeper sense of solidarity within the Group and ensure that the Group philosophy and management policies perme-ate the entire organisation. The Group Presidents’ Meeting aims to encourage a joint sense of commitment to the Medium-Term Management Plan. Awards are given to companies that boost earn-ings or individuals and groups that successfully launch initiatives or make significant contributions at their units.
Compensation of DirectorsPrinciple 3-1 (1) PolicyThe Company’s compensation system for directors motivates them to enhance the Company’s enterprise value and business perfor-mance. Compensation comprises two elements: basic monetary compensation paid according to position and compensation linked to business performance. However, the compensation of external directors and other part-time directors only comprises monetary compensation paid based on the type of duties positions entail. Note: The payment of retirement benefits to directors was discontinued in April 2004 to
heighten transparency of the compensation system.
Further, stock-based compensation is paid through a trust to directors who concurrently serve as directors of Hankyu Corporation and Hanshin Electric Railway as part of compensation from the Company. Thus, as with other shareholders, directors who concur-rently serve as directors of these two core companies of the Group benefit if share prices rise but incur losses if they decline. The inten-tion of the system is to motivate directors to improve companies’ business performances and thereby enhance the enterprise value of the entire Group over the medium-to-long term.
(2) ProcedureFollowing consultation with the Corporate Governance Committee with respect to the compensation system and content of compensa-tion, the Board of Directors decides on compensation based on the abovementioned policy.
Shares Held for Strategic ReasonsPrinciple 1-4 The Company acquires shares held for strategic reasons with a view to building relationships of trust with various stakeholders and enhancing corporate value over the medium-to-long term by main-taining business relationships or strengthening collaborations with partner companies and maintaining relationships with regional companies. In exercising voting rights associated with the shares, the Company’s criterion is whether proposals will contribute to the enhancement of the investee’s corporate value over the medium-to- long term. Further, the Board of Directors verifies the economic rationality and aims of owning shares held for strategic reasons.
Introduction of Measures to Prevent TakeoversPrinciple 1-5 The Company aims to secure and further enhance its enterprise value and the common interests of its shareholders. To this end, con-ducting business operations from a medium-to-long-term perspec-tive, building and maintaining a relationship of trust with local government institutions and residents in the areas served by the Company’s railway lines, and conducting business management that is focused on strengthening cohesion and collaboration within the Group to enhance its collective strength are indispensable. For this reason, we have introduced measures to prevent a takeover of the Company. In the event of the appearance of a potential buyer of the Company that wishes to raise their stake to 20% or more of the Company’s outstanding shares, to confirm the potential buyer’s intention, new share subscription rights will be granted to share-holders who are de facto shareholders other than the potential buyer. The General Meeting of Shareholders held on 16th June 2015 approved this system, which will remain in effect for three years. For more details about the Company’s basic policies regarding governance of joint-stock companies, which include the abovemen-tioned measures to prevent takeovers, please see: http://www.hankyu-hanshin.co.jp/ir/library/others/data/bouei.pdf(Available only in Japanese).
Abolition of Senior Advisors SystemTo strengthen corporate governance and heighten the transparency of business management and given that it has not elected senior advisors at present, the Company received approval from the General Meeting of Shareholders held on 13th June 2017 to abolish a provision of the articles of incorporation concerning the election of senior advisors.
Hankyu Hanshin Holdings • Annual Report 201756

Management Organisation
Dialogue with Shareholders and Investors
Measures to Enhance the Effectiveness of the Company’s General Meeting of Shareholders and Facilitate the Exercise of Voting Rights
Principle 1-2 Remarks
Early dispatch of notices of convocation
To allow shareholders sufficient time to exam-ine the items for resolution at the sharehold-ers’ meeting before exercising their voting rights, the Company sends out notices of convocation at the earliest possible date. For the General Meeting of Shareholders held in June 2017, the Company sent out notices of convocation on 23rd May 2017, 21 days before the meeting.
Avoidance of the “busiest day” for shareholder meetings
To enable as many shareholders as possible to attend its General Meeting of Shareholders, the Company held its 2016 General Meeting of Shareholders on 13th June 2017, 15 days before the “busiest day” on which a large pro-portion of Japanese companies hold their general shareholders’ meetings.
Online and electronic voting
To enable shareholders who cannot attend the Company’s General Meeting of Share-holders to exercise their voting rights and to make voting more convenient, the Company accepts votes exercised via the Internet. Also, the Company participates in the elec-tronic voting platform operated by ICJ Inc.
Other
On its website, the Company posts notices of convocation of the General Meeting of Shareholders and notices of resolutions passed at the meeting in Japanese and English.
Investor Relations (IR) ActivitiesPrinciple 5-1 The executive officer in charge of the Group Planning Division is responsible for and exercises overall control of general IR activities. The Group Planning Division has an IR manager and promotes cohe-sive IR activities by sharing information regularly with divisions responsible for finance and accounting, general and legal affairs, and public relations. As a rule, twice a year in Japan the Company holds briefings on earnings results for analysts and institutional investors, in which the president explains earnings results and business plans. The Company is increasing and improving disclosure via its web-site (http://www.hankyu-hanshin.co.jp/en/ir/) by posting a range of documents that aid investment decisions, such as earnings results, securities reports, timely disclosure documents, and documents from briefings on earnings results. (Most of these documents are in Japanese.) Also, for individual investors the website includes an over-view of the Group and its competitive advantages. In addition, as required, the Company organises interviews with shareholders and institutional investors that are primarily themed on the enhancement of corporate value over the medium-to-long term. In principle, the IR manager participates in these interviews. However, in light of the number of shares that shareholders own or their areas of interest, executive officers responsible for other areas of the Company participate as required. Further, the IR man-ager prepares reports, as required, that are based on feedback from the interviews, including opinions stated or summaries of questions and answers, and submits them to the senior management team.Number of interviews in fiscal 2017: 147
Activities in Fiscal 2017
Recent General Meetings of Shareholders and Fiscal Years
June 2015 General Meeting of
Shareholders
April 2015
Fiscal year FY2016 FY2017 FY2018
April 2016 April 2017
June 2016 General Meeting of
Shareholders
June 2017 General Meeting of
Shareholders
13 directors, 5 Audit & Supervisory Board members 14 directors, 5 Audit & Supervisory Board members
1 director appointed1 Audit & Supervisory Board member retired1 Audit & Supervisory Board member appointed
6 directors retired1 director appointed1 Audit & Supervisory Board member retired1 Audit & Supervisory Board member appointed
9 directors, 5 Audit & Supervisory Board members
Hankyu Hanshin Holdings • Annual Report 2017 57

Management Organisation
Attendance at Meetings of the Board of Directors and the Audit & Supervisory Board
External Directors
NameAttendance at meetings of the Board
of Directors
Noriyuki Inoue Attended 8 of 10 meetings
Shosuke Mori Attended 9 of 10 meetings
External Audit & Supervisory Board Members
NameAttendance at meetings of the
Board of Directors
Attendance at meetings of the
Audit & Supervisory Board
Takaharu Dohi
Attended all 10 meetings
Attended all 12 meetings
Haruo Sakaguchi
Attended all 10 meetings
Attended all 12 meetings
Junzo IshiiAttended all 10
meetingsAttended 11 of 12
meetings
Compensation Paid to Directors and Audit & Supervisory Board Members
Category No. of recipientsTotal paid out in fiscal 2017
(Millions of yen)
Directors(External)
14(2)
127(19)
Audit & Supervisory Board members
(External)
6(3)
17(6)
Total(External)
20(5)
144(25)
Notes1. Recipients of compensation in fiscal 2017 include one Audit & Supervisory Board
member who retired at the conclusion of the General Meeting of Shareholders held on 14th June 2016.
2. In addition to the above, compensation received by external directors and external Audit & Supervisory Board members from subsidiaries of the Company for their duties as directors and Audit & Supervisory Board members amounted to ¥27 million for fiscal 2017.
3. Of the Company’s full-time directors with terms of office lasting until the conclusion of the General Meeting of Shareholders held on 13th June 2017, Kazuo Sumi, Takehiro Sugiyama, Mitsuo Nozaki, Naohisa Nogami, and Masao Shin concurrently served as directors of the Company and as senior officers of the Company’s subsidiary Hankyu Corporation. Of the Company’s Audit & Supervisory Board members with terms of office lasting until the conclusion of the General Meeting of Shareholders held on 13th June 2017, Koichi Kobayashi concurrently served as a standing Audit & Supervisory Board member of the Company and as a standing Audit & Supervisory Board member of the Company’s subsidiary Hankyu Corporation. Further, Shinya Sakai, Takehiro Sugiyama, and Masao Shin concurrently served as directors of the Company and as senior officers of the Company’s subsidiary Hanshin Electric Railway. Also, Masayoshi Ishibashi concurrently served as an Audit & Supervisory Board member of the Company and as a senior officer of Hanshin Electric Railway. The abovementioned persons received additional compensation from the abovementioned companies.
Support for Directors and Audit & Supervisory Board Members
With the exception of external directors and external Audit & Supervisory Board members, the Company provides directors and Audit & Supervisory Board members with the training that they require to fulfill their roles appropriately. In addition, the Company
offers directors and Audit & Supervisory Board members training opportunities by introducing and paying for various types of training and seminars. Also, such committees as the Corporate Governance Committee give external directors and external Audit & Supervisory Board members information about the Group’s businesses, financial position, and organisation. Further, in fiscal 2017 the Company con-ducted briefings about the management tasks and initiatives of each core business at meetings of the Board of Directors held in November and December.
Evaluation of the Board of Directors’ Effectiveness
A summary of the process, items, and results of an evaluation of the effectiveness of the Board of Directors conducted in fiscal 2018 is as shown below.
1. Evaluation ProcessAt a meeting of the Board of Directors held on April 2017, all direc-tors were interviewed with respect to the administration of the Board of Directors in fiscal 2017.
2. Evaluation Items
AccountabilityContent of handouts, content and method of explanations at meetings of the Board of Directors, etc.
Appropriateness of conduct of meetings
Duration, questions and answers, etc.
OtherOther points about overall administration of the Board of Directors
3. Evaluation ResultsThe results of investigative interviews indicated that conduct of meetings of the Board of Directors was adequate, explanations of the status of business management were appropriate, and the Board of Directors was effective and generally administered appropriately in fiscal 2017. Further, evaluation results for fiscal 2016 included requests for more information about the management tasks of each core busi-ness. In response, the Company conducted briefings about the management tasks and initiatives of each core business at meetings of the Board of Directors held in November and December 2016.
Number of Meetings of Deliberative Bodies Held
Corporate Governance Committee 1 meeting
Group Management Committee 15 meetings
Core Business Strategy Councils 2 meetings
The Group Presidents’ Meeting 2 meetings
Hankyu Hanshin Holdings • Annual Report 201758

As a system to ensure compliance-focused management, the Group has set up a dedicated compliance office, and is working to raise awareness of compliance issues among executives and employees by means of the measures detailed below.
Compliance Manual and Training ProgrammesThe Company’s Compliance Manual and Compliance Card express the determination of the Company not to tolerate violation of laws or social norms or betrayal of customer trust by any of its Group companies’ approximately 22,000 officers and employees. It also aims to raise awareness by pointing out cases where compliance errors can easily be made. The Company provides intensive compli-ance training on a Groupwide basis for new employees, midcareer hires, and newly appointed executives. In addition, all Group compa-nies arrange their own training programmes tailored to job grade and function, with the aim of further increasing compliance awareness.
Corporate Ethics Consultation Desk (Internal Whistle-Blower Procedures)Principle 2-5
We have set up a dedicated whistle-blower hotline enabling all employees to discuss or quickly bring to management’s attention suspected or known legal violations and unethical conduct. Business partners are also welcome to use this consultation and notification facility, and when necessary we will use lawyers and other outside specialists to improve its effectiveness.
Compliance
Principles 2-1 2-2 4-3
Recognising the importance of ensuring that the business opera-tions of the Company are conducted in an appropriate manner, we have established an internal control system for the entire Group, and revise it when deemed necessary. As things stand, our internal con-trol system is characterised as follows:
A Group Management Philosophy was compiled following the management integration of Hankyu Holdings and Hanshin Electric Railway, along with a Group mission (what we try to achieve), a statement of values (what is important to us), and a code of con-duct (what actions to take to realise them). We ensure that all employees from executive down understand them.
We ensure compliance-focused management by compiling and distributing a Compliance Manual, and have established a dedicated whistle-blowing system. (For further information on the Company’s compliance activities, please refer to the follow-ing section.) We have established the Group Auditing Division, composed of internal audit staff under the direct control of the president, for independent monitoring of Groupwide business activities. It car-ries out internal audits into the Hankyu Hanshin Holdings Group and all its operating companies. To create a structure for ensuring appropriate operations, the Group vests Audit & Supervisory Board members of each Group company with authority not only in accounting but also in opera-tional audits, and at the same time provides guidance to smaller Group companies on Board of Directors’ resolutions for the cre-ation of an internal control system. Audit & Supervisory Board members and the Group Auditing Division receive regular reports from the Risk Management Office with regard to creation and operation of internal controls at the Company and its subsidiaries (including implementation status for risk management and promotion of compliance-based manage-ment measures). Through such measures, they deepen their links with, and strengthen the role of, internal control divisions.
With regard to systems for “Management Assessment and Audit Concerning Internal Control Over Financial Reporting,” a section of the Financial Instruments and Exchange Act, the Company responds appropriately by carrying out management evaluations on a consolidated basis, in line with in-house rules.
Internal Control System
Management Organisation
Corporate Ethics Consultation Desk
Consultation Desk
Consultation Desk
Consultation Desk
President
Audit & Supervisory
Board member
President
Audit & Supervisory
Board member
Reports
Reports Reports
Directs Reports
Approves / Directs
Reporting of investigation progress and findings
Hankyu Hanshin Holdings • Annual Report 2017 59

Information to Group companies
Guidance and training for Group companies
Risk management
Risk Management Committee secretariat
Corporate Ethics Consultation Desk ( internal whistle-blower procedures)
Internal auditing
Hankyu Hanshin Holdings
Cross-Organisational Companies
[Symbols]
Establishment of Risk Management CommitteesIn the case of identification of a major compliance issue during the course of an Ethics Consultation, a risk management committee is convened as soon as possible to discuss and decide on appropriate responses. In addition, we are setting up compliance promotion offices at major Group companies such as Hankyu Corporation, Hanshin Electric Railway, Hankyu Travel International, Hankyu Hanshin Express, and Hankyu Hanshin Hotels. At other companies we are appointing “compliance leaders,” to ensure our response is on a Groupwide basis.
Principle 4-3
At the Company, risks to which many different divisions are exposed are managed by the Risk Management Office, while risks arising in the business operations of individual divisions are managed by risk management units within the divisions themselves. In both cases, risks are identified and analysed, and risk management systems are overhauled from time to time. We evaluate the likelihood of materiali-sation of each risk and its frequency, as well as the extent of impact in the event of materialisation and its importance. On that basis, we draw up measures to prevent the materialisation of risk or to mitigate its impact (“risk mitigation measures”). These measures are docu-mented in the form of risk management manuals, and the results of risk analysis and how such a risk is being handled when a risk arises are reported, as appropriate, to the Board of Directors. We have also established a liaison system enabling the effective transmission of information in the event of unforeseen circumstances. Under this system, in the event of materialisation of a risk, executives and employees immediately take risk mitigation measures as speci-fied in the abovementioned documentation and other measures to prevent the further spread of the impact. They also submit reports to pre-appointed risk management liaison personnel. The Company provides supervision to all companies in the Group so that the same system is operated by them all, and has set up a system enabling transmission to the Company of accurate informa-tion in the event of an unforeseen development. A particular area of importance in this regard is the Company’s core railway business, which entails direct risk to people’s lives through accidents. Even in the event of minor mistakes and problems where no individual responsibility arises, it is important to make every effort to bring the number of problems and mistakes that could cause an accident as close to zero as possible, by continuing to meticulously train railway business staff, and share and analyse data. Such painstaking efforts to forestall even one human error are one of the building blocks on which the Company ensures safety of opera-tions and meets public expectations.
Pages 64–67 explain measures to ensure the safety of the railway business of
Hankyu Corporation and Hanshin Electric Railway.
Overview of Group Compliance
Compliance leadersLiaise with compliance departments of higher-level companies
or
Hankyu Corporation
Hanshin Electric Railway
Hankyu Travel International
Hankyu Hanshin Express
Hankyu Hanshin Hotels
Group Company
Group Company
Group Company
Group Company
Group Company
Group Company
Group Company
Group Company
Group Company
Group Company
or
or
or
or
Risk Management
Management Organisation
Compliance promotion officeInternal whistle-blowing, respon-sible for planning and organising seminars and other awareness-raising activities
Hankyu Hanshin Holdings • Annual Report 201760

Operating subsidiaries
Our Current Risk Management FrameworkBased on six core businesses, the Hankyu Hanshin Holdings Group
conducts diverse business activities. Consequently, in a wide range
of areas the Group incurs risks meriting attention. Therefore, each
fiscal year the Company and its operating subsidiaries coordinate to
identify and assess business risks. Specifically, from among general
risk items, which the Company prepares in advance based on a
Groupwide management viewpoint, operating subsidiaries select
risks that should be addressed as a priority. In selecting these priority
risks, the operating subsidiaries use as criteria the likelihood of risk
manifestation and the effect this would have on operations. Next,
the operating subsidiaries establish risk reduction measures targeting
the selected priority risks, discuss the countermeasures at meetings
of their boards of directors and other meetings, and then report con-
clusions to Hankyu Hanshin Holdings as the holding company. The
Company regularly collates and reports information about the prog-
ress of operating subsidiaries’ risk management measures to the
Board of Directors.
As for the monitoring of risk management measures, operating
subsidiaries must submit progress reports to the Company periodi-
cally. In addition, as the officer responsible for risk management, I and
other risk managers conduct face-to-face interviews with members
of subsidiaries’ senior management teams at least once a year,
checking the progress of their measures for priority risks through a
plan–do–check–act (PDCA) cycle. Interviews at operating subsidiaries
not only help me understand changes in the status of risks but also
give me an opportunity to share management know-how about
such issues as best practices within the Group.
Risk Management Framework
Initiatives Aimed at Reducing the Group’s Risk
Initiatives Going ForwardLooking to the future, a pressing task is to strengthen the manage-
ment of risk associated with overseas businesses, which aim to
expand in accordance with the Long-Term Management Vision for
2025. While leveraging the expertise and information of the
International Transportation Business—which has a strong track
record in overseas business development—we will address this task
by establishing a management system aimed at selecting and
reducing priority risks. Further, I believe we need to heighten our
sensitivity to risk related to the environment, society, and gover-
nance (ESG). In particular, four years ago we began a Groupwide ini-
tiative to rigorously introduce appropriate management of working
hours. As part of this ongoing initiative, we are advancing efforts to
identify and address issues arising from characteristics of each oper-
ating subsidiary’s business.
The Hankyu Hanshin Holdings Group’s risk management has
changed significantly since the Company stepped up its involve-
ment with operating subsidiaries following a compliance incident
several years ago. The Company will continue to increase risk man-
agement awareness across the Group, prevent the occurrence of
risk-related events, and heighten its ability to respond to risks.
Hankyu Hanshin Holdings
Boards of Directors’ and other meetings
The Board of Directors of Hankyu Hanshin Holdings
Assessing and identifying Effect level Manifestation likelihood
Selecting priority risksEstablishing countermeasures
Risk reduction measures Schedules
Implementing countermeasures
Assessing
Collating and reporting
ReportingProviding risk items from a Groupwide management viewpoint
Interviewing and advising Reporting
ReportingReporting
Mitsuo NozakiExecutive Officer,In charge of Personnel and General Affairs Div.,Hankyu Hanshin Holdings
Management Organisation
Hankyu Hanshin Holdings • Annual Report 2017 61

Principal Risks and Countermeasures
The Hankyu Hanshin Holdings Group’s approaches to risks related to businesses and other risks that may be of concern to
investors are stated below.
Further, forward-looking statements in this report reflect the Group’s assessments as of 31st March 2017. Moreover, these
statements do not negate the possibility of the said risks affecting the Group’s business results or financial position.
Principal risks The Group’s countermeasures
Risks related to economic conditions
Borrowing rates could increase due to changes in financial markets or
fund-raising from markets could become difficult.
Sudden changes in financial markets could affect the Group’s business
results or financial position.
The Group limits exposure to the risk of interest rate increases by giving
priority to the undertaking of long-term loans with fixed interest rates.
The Group secures financing by establishing backup lines of credit
based on commitment lines set up with correspondent financial
institutions.
Changes in the economic climate could cause exchange rate volatility.
Greater-than-expected volatility could affect the Group’s business
results or financial position.
The Group uses forward exchange contracts, currency swap contracts,
and currency option contracts to mitigate exchange rate fluctuation
risk associated with certain foreign currency-denominated monetary
payables and receivables.
Further, the Group’s overseas sales were less than 10% of consoli-
dated revenues from operations as of 31st March 2017.
Risks related to businesses
The further aging of society is expected to increase capital invest-
ment for safety countermeasures and construction to make facilities
barrier-free.
Due to population decline resulting from lower birth rates, the Group’s
railways, buses, and taxis could see demand for passenger transporta-
tion decrease. Also, demand could decrease in other businesses.
Through continuous initiatives to heighten the value of the Umeda
area and other areas served by the Hankyu and Hanshin lines, the
Group creates line-side areas in which people want to live in long term
or visit frequently.
The Group will develop such new markets as the Tokyo metropolitan
area and overseas markets.
The Group has established the Long-Term Management Vision for 2025
and will take various measures to become the company we hope to be.
The four elements of this target corporate profile are stated below.
1. Make our railway the absolute best among the Kansai networks.
2. Construct a stable revenue base in the Tokyo metropolitan area and
overseas markets. (Diversify the portfolio, which is currently concen-
trated in Umeda and line-side areas.)
3. Strengthen competitiveness by thoroughly pursuing brand optimi-
sation and differentiation.
4. Make greater use of the Group’s collective strength and develop new
business fields.
An accident in the railway business could cause customers great
suffering.
The Group is keenly aware that being entrusted with passengers’ lives is a serious responsibility. Therefore, placing first priority on ensuring the safety of customers is the basis of its business management.
Based on its strong commitment to putting customers first and giving
the highest priority to safety, the Group is implementing a wide range
of measures to upgrade tangible and intangible infrastructure and
provide customers with improved safety. For details about safety measures in the Urban Transportation Business, please see pages 64–67.
Hankyu Hanshin Holdings • Annual Report 201762

Principal risks The Group’s countermeasures
Higher electric utility rates could increase power and other costs. The Group is steadily introducing energy-saving equipment to curb
power consumption as much as possible.
The Group takes rigorous measures to ensure employees are aware of
the importance of cost reductions.
A loss of trust in the quality and safety of products and services that the
Group sells and offers or in the information it provides about them
could lower revenues and lead to a deterioration in business results.
The Group ensures the quality and safety of its products and services
and the appropriateness of the information it provides about them by
confirming compliance with relevant laws and regulations and check-
ing quality and hygiene management and food labelling.
Natural disasters, such as earthquakes, typhoons, or floods, or acts of
terrorism could significantly damage the Group’s businesses or trans-
portation network infrastructure.
In the areas alongside their railway lines, Hankyu Corporation and
Hanshin Electric Railway have installed water meters for rivers and rain
and wind gauges for collecting observation data. Also, they use real-
time information from meteorological observatories to ensure safe
train operations.
If seismographs detect an earthquake with a seismic intensity of four
or above, or if earthquake early warning systems forecast an earth-
quake of the same seismic intensity, the Group immediately begins
procedures for the emergency suspension of the operations of all
trains on line segments in earthquake zones.
If the Group recognises that continued vigilance is required with respect
to acts of terrorism or other acts, or if suspicious items or persons are
discovered or damage is incurred, it conducts crisis management
appropriate to the threat level.
The Group has established emergency response systems for minimiz-
ing the effect on society in the unlikely event of an incident that causes
a long disruption to transportation services or results in a large number
of casualties.
For further information on risks related to businesses and other risks, please see page 73.
Principal Risks and Countermeasures
Hankyu Hanshin Holdings • Annual Report 2017 63

Safety Initiatives in the Railway Business
The shared mission of Hankyu Corporation and Hanshin Electric Railway is to ensure the absolute safety of railway transportation. All day-to-day safety enhancement measures as well as measures to ensure safety in emergencies reflect the safety policy and safety objective below.
Hankyu Corporation Safety Objective• Maintaining the elimination of accidents for which we bear responsibilityFor the fiscal years from fiscal 2017 onward, we again set elimination of accidents for which we bear responsibility as our safety objective. This has been our safety objective since 2006, and we will continue to do our utmost to achieve it.
Safety Policy and Safety Objective
Safety Policy and Safety Priority MeasuresProvide safe, high-quality transportation services that fully justify public trust—Hankyu Corporation: Safety and comfort
b. Conduct highly effective training to realise rapid, reliable emer-gency measures
3. Enhance employees’ safety awareness and increase communication a. Conduct training to heighten employees’ safety awareness even
further b. Continue training aimed at ensuring personnel development and
the passing on of skills c. Establish workplaces with an open atmosphere
1. Promote accident reoccurrence prevention and accident prevention measures
a. Ensure rigorous accident reoccurrence prevention by steadily implementing countermeasures
b. Prevent accidents by using accident precursor information and accident examples
c. Upgrade and introduce equipment and facilities to realise even safer railways
2. Strengthen responses when disasters occur a. Identify risks that threaten business continuity and prepare and
implement countermeasures
Positions and Roles President
The President determines the implementation, management organisation, and rules of the railway business. In addition, when formulating the Medium-Term Management Plan, which includes facilities and transportation, personnel, investment, and budget, the President verifies and ascertains the situation from the perspectives of safety and feasibility and instructs on improvements.
Chief Safety ManagerIn order to prioritise securing the safety of railway facilities and rolling stock and the handling of operations, and to control and manage transportation operations in each division, the Chief Safety Manager works to disseminate safety management regulations and to ensure compliance with related laws and regulations; to increase awareness of safety as the Group’s most impor-tant priority; to confirm the implementation of transportation operations, management conditions, and the progress made in implementing the safety improvement measures stipulated in the Medium-Term Management Plan; and to implement improvement measures.
Chief Train Operations ManagerThe Chief Train Operations Manager manages operations-related duties, including utilising the employees involved in operations, railway facilities, and rolling stock; setting and revising the operations plan; managing train crews, the operations of rolling stock, and train operations; and providing training for train crews and maintaining their capabilities.
Chief Crew Training ManagerBased on the instructions and orders of the Chief Train Operations Manager, the Chief Crew Training Manager maintains and manages the capabilities of train crews and periodically confirms and submits reports on the progress being made in improving their capabilities.
Other Managers and Responsible PersonsIn each division, other managers and responsible persons maintain and manage the facilities they are responsible for in order to ensure there are no obstacles to realising safe transportation.
Safety Management Promotion CommitteesSafety Management Promotion Committees discuss, investigate, and report on a variety of proposals for transportation safety. These committees include the Group Safety Management Promotion Committee, on which the President serves as chairperson; the Business Division Safety Management Promotion Committee, on which the Chief Safety Manager serves as chairperson; and the divisional safety management promotion committees.
Directors
Safety Management System
President
Manager, Takarazuka Line
Operations
Manager, Kobe Line
Operations
Manager, Kyoto Line Operations
Deputy Head of Urban Transportation Business
Head of Urban Transportation Business (Chief Safety Manager: Director)
Manager, Urban Transportation
Planning (Head of Investment and Financing Team)
Manager, Technical Division
(Chief Civil Engineering
Facilities Manager)
Manager, Transport Division
(Chief Train Operations Manager)
Manager, Technical Division
(Chief Electrical Facilities Manager)
Manager, Technical Division
(Chief Rolling Stock Manager)
Deputy Operations Manager (Crew
Training Manager)
Deputy Operations Manager (Crew
Training Manager)
Deputy Operations Manager (Crew
Training Manager)
Safety Management Promotion Committees
Transport Division Safety Management
Promotion Committee
Technical Division (civil engineering facilities) Safety Management
Promotion Committee
Technical Division (electrical facilities)
Safety Management Promotion Committee
Technical Division (rolling stock)
Safety Management Promotion Committee
Group Safety Management Promotion Committee
Business Division Safety Management Promotion Committee
Investigative Committee to Improve the Safety and Security of Operations
Investigative Committee for Measures to Prevent Accidents
Hankyu Hanshin Holdings • Annual Report 201764

Hanshin Electric Railway Safety Objective
• Maintaining the elimination of accidents for which we bear responsibilityWe have maintained elimination of accidents for which we bear responsibility as our safety objective since April 1985.
Safety PolicyMaximum priority on safety
The President, directors, and employees shall do everything possible to ensure safety of operations, based on the understanding that putting the highest priority on ensuring safety is the mission of railway businesses.
Compliance with laws and regulations The Company shall comply with all laws and regulations related to safety and apply them rigorously and sincerely in its operations.
Maintenance of safety management systems
The Company shall implement continu-ous verification procedures to ensure that safety management systems are operating appropriately.
Safety Initiatives in the Railway Business
Positions and Roles
PresidentThe President has the ultimate responsibility for ensuring transport safety.
Chief Safety Manager (Head of Urban Transportation Business)The Chief Safety Manager is responsible for overseeing all activities related to ensuring transport safety.
Chief Train Operations Manager (Transportation Division Manager)Under the direction of the Chief Safety Manager, the Chief Train Operations Manager is responsible for operations including train operations, maintaining the capabilities of train crews, and other related operations.
Chief Crew Training Managers (the Heads of the East Rolling Stock Yard and the West Rolling Stock Yard)
Under the direction of the Chief Train Operations Manager, the Chief Crew Training Managers are responsible for ensuring all crew are properly qualified.
Electrical Division ManagerUnder the direction of the Chief Safety Manager, the Electrical Division Manager has overall control of items relating to electrical facilities.
Rolling Stock Division ManagerUnder the direction of the Chief Safety Manager, the Rolling Stock Division Manager has overall control of items relating to rolling stock.
Engineering Division ManagerUnder the direction of the Chief Safety Manager, the Engineering Division Manager has overall control of items relating to track, civil engineering, and construction facilities.
Safety Management System
Chief Train Operations Manager
(Manager, Transportation
Division)
Chief Crew Training Managers(Head, East Rolling Stock Yard)(Head, West Rolling Stock Yard)
Manager, Engineering
Division
Manager, Rolling Stock
Division
Manager, Electrical Division
President
Directors
Urban Transportation Business
Railway Safety Council
Chief Safety Manager (Head of Urban
Transportation Business)
The Railway Safety Council has been established as an organisation that specialises in promoting safety management.
Deputy Head of Urban Transportation Business
Hankyu Hanshin Holdings • Annual Report 2017 65

Safety Initiatives in the Railway Business
Use of Safety-Related Suggestion Boxes to Reduce Potential Risks
With a view to preventing accidents, Hanshin Electric Railway collects and uses risk information about the potential causes of accidents and near misses. As an additional initiative to reduce potential risks, the company began a safety-related suggestion box system in 2014. The suggestion boxes allow employees engaged in railway operations to anonymously submit comments about instances when they have felt situations were dangerous
or about things they have realised in the course of day-to-day duties, regardless of whether these comments concern an opera-tional area for which they are responsible. Without fail, railway operations’ safety-related committees check these suggestions and take the necessary countermeasures. Moreover, by sharing examples of improvements, we heighten each employee’s sensi-tivity to danger and thereby encourage further improvements.
Initiatives to Reinforce the Safety Management System (Using the PDCA Cycle)
By applying our safety management system (the PDCA cycle) to a range of safety initia-tives, we are aiming to create a virtuous cycle of improvement based on even higher safety goals.
DOSafety management
implementation and operation
ACTImprovements (proposals
for improvements) and revisions to safety
management plans and systems
PLANCreation of safety
control plans and systems
CHECKSafety management
and operational checks
Continuous improvement
Revisions to the Railway Business Law in October 2006 required rail-way companies to create new safety management systems dedi-cated to transport safety. Under our new safety management system, we are realising even higher levels of safety by applying the
plan–do–check–act (PDCA) cycle, ensuring compliance with all related laws and regulations, conducting operations that place the highest priority on safety, and fostering greater awareness of safety issues among employees from directors on down.
There is an area in the west part of Kusugawa Station that does not have an intrusion prevention fence. Train photog-raphers and small children putting out their hands gave me a fright.
By installing a new intrusion prevention fence, we ensured safe train operations.
Before improvement After improvement
Suggestion received
Countermeasure
Hankyu Hanshin Holdings • Annual Report 201766

Safety Initiatives in the Railway Business
2. Initiatives for Natural Disasters 1. Responding to rain stormsDuring rain storms, we direct trains to reduce speed or suspend operations based on information obtained from the rain gauges, wind gauges, and water meters installed alongside our railway lines and meteorological information from the Japan Meteorological Agency.
2. Responding to earthquakesIf earthquake early warning systems forecast an earthquake with a seismic intensity of four or above, or if seismographs that we have installed alongside our railway lines detect an earthquake of the same seismic intensity, we immediately begin procedures for the emergency suspension of operations of trains on line segments in earthquake zones.
3. Responding to actions of third parties, such as acts of terrorism
If there is a warning that the actions of third parties, such as acts of terrorism, could cause serious incidents with extremely significant effects on society, or if such a warning calls for continued vigilance, or if suspicious items or persons are discovered or damage is incurred, we take measures appropriate to the threat level. Further, we are advancing the installation of security cameras on station platforms and in station concourses to prevent crime.
3. Maintenance Work: Indispensable for Safe, Comfortable Operations
1. Inspecting electrical equipmentWe have many different types of electrical equipment, including signal safety equipment, secure communications equipment, railway crossing safety equipment, power equipment, railway track equipment, and substation equipment, which we inspect regularly based on prescribed inspection schedules.
2. Inspecting railway tracksWe regularly inspect railway tracks, rails, ties, and other components to ensure the safe operation of trains.
3. Inspecting structuresWe inspect elevated tracks, bridges, tunnels, and other railway civil engineering structures regularly.
4. Inspecting rolling stockWe conduct inspections at our plants and train depots to maintain the safety of rolling stock. Regular inspections include train inspections, status and function inspections, main component inspections, and overall inspections. In addition, we conduct unscheduled inspections as required.
Safety Enhancement Initiatives
To ensure the safety of customers, we are proactively taking personnel-related measures to enhance education and training as well as infrastructure-related measures to improve equipment and facilities.
1. Training and Education At government-designated in-house training centres, Hankyu Corporation and Hanshin Electric Railway foster train drivers and train conductors. During the training period, trainees receive educa-tion on academic subjects and practical skills in accordance with a national curriculum. Also, experienced drivers and train conductors
act as instructors and provide rigorous one-on-one, on-site training. Even after personnel have passed certification exams, we maintain and heighten the skills, awareness, and qualifications of drivers, con-ductors, and operations personnel by holding safety workshops and seminars and by conducting training based on a range of scenarios.
Hankyu Hanshin Holdings • Annual Report 2017 67

Consolidated Six-Year Summary
FY 2012 2013 2014 2015 2016 6 2017 2017
Result of Operations (Millions of yen and thousands of U.S. dollars)1:
Revenues from operations ¥ 649,703 ¥ 682,439 ¥ 679,157 ¥ 685,906 ¥ 746,792 ¥ 736,763 $ 6,578,241
Operating income 73,809 87,921 91,828 94,026 110,293 104,058 929,089
EBITDA2 133,500 145,100 149,200 150,100 166,500 159,300 1,422,321
Ordinary income 65,393 74,914 81,191 85,590 104,479 100,607 898,277
Income before income taxes 43,419 62,192 83,542 77,620 96,087 100,805 900,045
Net income attributable to owners of the parent 39,252 39,702 46,352 54,201 69,971 71,302 636,625
Comprehensive income 44,992 54,081 55,941 71,034 63,842 79,288 707,929
Capital expenditure 55,267 59,512 80,722 68,115 66,639 86,212 769,750
Depreciation and amortisation 56,968 54,540 54,474 53,143 53,701 52,800 471,429
Cash Flows (Millions of yen and thousands of U.S. dollars):
Cash flows from operating activities ¥ 124,525 ¥ 127,655 ¥ 146,991 ¥ 131,881 ¥ 124,838 ¥ 115,633 $ 1,032,438
Cash flows from investing activities (44,295) (58,923) (45,517) (52,529) (78,843) (84,845) (757,545)
Cash flows from financing activities (78,978) (69,195) (105,079) (81,746) (47,278) (30,595) (273,170)
Increase (decrease) in cash and cash equivalents 767 817 (1,840) (1,125) (1,978) (480) (4,286)
Cash and cash equivalents at end of year 23,572 25,581 24,497 23,497 22,363 22,530 201,161
Financial Position (Millions of yen and thousands of U.S. dollars):
Total assets ¥2,274,380 ¥2,281,007 ¥2,286,928 ¥2,279,638 ¥2,282,180 ¥2,349,831 $20,980,634
Total net assets 524,801 573,154 617,598 679,482 724,237 804,659 7,184,455
Interest-bearing debt 1,183,647 1,126,633 1,032,307 955,828 916,570 899,523 8,031,455
Per Share Data (Yen and U.S. dollars):
Net income attributable to owners of the parent
Basic ¥ 31.13 ¥ 31.48 ¥ 36.76 ¥ 42.98 ¥ 277.88 ¥ 285.11 $ 2.55
Diluted 31.13 31.47 36.75 42.95 277.67 284.86 2.54
Net assets 407.01 443.63 477.69 525.56 2,815.96 3,150.67 28.13
Dividend 5.00 5.00 6.00 6.00 35.00 35.00 0.31
Ratios:
Operating income margin (%) 11.4 12.9 13.5 13.7 14.8 14.1 —
ROA (%)3 2.8 3.3 3.6 3.7 4.6 4.3 —
ROE (%)4 7.9 7.4 8.0 8.6 10.3 9.4 —
Interest-bearing debt/EBITDA (Times) 8.9 7.8 6.9 6.4 5.5 5.6 —
Equity ratio (%) 22.6 24.5 26.3 29.1 31.0 33.5 —
Debt/equity (D/E) ratio (Times)5 2.3 2.0 1.7 1.4 1.3 1.1 —
Others:
Number of outstanding shares (Thousands) 1,271,406 1,271,406 1,271,406 1,271,406 254,281 254,281 —
Number of employees 20,811 20,751 20,913 21,037 21,607 21,860 —
1. The U.S. dollar amounts have been translated, for convenience only, at ¥112 = US$1, the prevailing exchange rate on the Tokyo Foreign Exchange Market as of 31st March 2017.2. EBITDA = operating income + depreciation expenses + amortisation of goodwill
EBITDA figures are rounded to the nearest ¥100 million.3. ROA = ordinary income / total assets (average of period-start and period-end totals)4. ROE = net income attributable to owners of the parent / equity (average of period-start and period-end totals)5. D/E ratio = interest-bearing debt / equity6. Regarding transactions related to such items as the export of mixed cargo of the International Transportation Business, the Company has changed the recognition of revenues
from operations from net presentation to gross presentation as of fiscal 2017. As a result of this change, the amount of revenues from operations for fiscal 2016 is the amount after retrospective application (gross presentation).
Further, the Company consolidated shares at the ratio of 5 shares to 1 share with an effective date of 1st August 2016. Net income per share, diluted net income attributable to owners of the parent per share, net assets per share, dividend per share, and number of outstanding shares have been calculated based on the assumption that the said reverse stock split was executed on 1st April 2015.
Hankyu Hanshin Holdings • Annual Report 201768

Consolidated Financial Review
Analysis of Operating Results for Fiscal 2017 (Year ended 31st March 2017)Although the Group was able to achieve its profit targets, revenues from operations declined 1.3%, or ¥10,029 million, year on year, to ¥736,763 million. This decrease was attributable to the sale of land for facilities in the Real Estate Business in the previous fiscal year and the lower yen-equivalent value of revenues and earnings in the International Transportation Business that accompanied exchange rate fluctuations. As a result of the abovementioned decrease in rev-enues from operations, operating income was down 5.7%, or ¥6,234 million, year on year, to ¥104,058 million. Further, ordinary income declined 3.7%, or ¥3,872 million, year on year, to ¥100,607 million, because the abovementioned decrease
in revenues from operations counteracted higher equity in income of affiliates and a decrease in interest expenses accompanying lower interest-bearing debt. Total extraordinary income net of total extraordinary loss was ¥197 million, compared with a loss of ¥8,391 million in the previous fiscal year, due to the recording of losses on revaluation of invest-ment securities in the previous fiscal year. Reflecting the improve-ment in total extraordinary income net of total extraordinary loss, net income attributable to owners of the parent increased 1.9%, or ¥1,331 million, year on year, to ¥71,302 million.
Segment InformationThe following table shows business performance for each core business segment. For reviews of these results, please see the respective refer-ence pages at the bottom of the columns in the table below.
(Millions of yen)Urban
TransportationReal Estate
Entertainment and Communications
TravelInternational
TransportationHotels Other Adjustment Consolidated
Revenues from operations
FY2017 237,136 215,709 115,193 29,938 71,670 65,640 42,646 (41,172) 736,763
FY2016 239,544 220,923 112,490 30,502 76,092 68,042 38,859 (39,660) 746,792
YoY difference –2,407 –5,213 +2,703 –563 –4,422 –2,401 +3,787 –1,512 –10,029
Operating income
FY2017 42,237 41,970 15,655 637 1,587 2,795 1,340 (2,167) 104,058
FY2016 41,270 49,851 15,301 680 1,788 3,298 967 (2,866) 110,293
YoY difference +967 –7,881 +354 –43 –200 –502 +372 +698 –6,234
Reference page P.37 P.39 P.41 P.43 P.45 P.47 — — —
Note: Regarding transactions related to such items as the export of consolidated cargo of the International Transportation Business, the Company has changed the recognition of revenues from operations from net presentation to gross presentation as of the fiscal year under review. As a result of this change, the amount of revenues from operations for the previous fiscal year is the figure after retrospective application (gross presentation). Further, this change has not affected operating income.
Analysis of operating income(¥ million)
* Included in cost of revenues from operations, retirement benefit expenses increased ¥2,088 million.
FY2017
FY2016
Decrease in revenues from operations –10,029
+2,251Decrease in operating expenses and cost of sales*
+1,031Decrease in personnel expenses
+543Decrease in expenses Decrease in selling, general and administrative expenses*+1,543
–116Increase in taxes
+39Decrease in depreciation and amortisation
+44 Decrease in amortisation of goodwill
110,293
104,058
YoY difference –6,234
Hankyu Hanshin Holdings • Annual Report 2017 69

Review of Financial Position1. Assets, Liabilities, and Net AssetsTotal assets at the end of the fiscal year under review stood at ¥2,349,831 million, a rise of ¥67,650 million from the previous fiscal year-end. This increase mainly stemmed from investment that exceeded depreciation and amortisation, the recognition of an increase in equity in income of affiliates, a rise in the market value of listed investment securities owned, and an increase in construction in progress. Further, construction in progress increased in tandem with the advancement of the Ginza 3-chome Project and the Umeda 1-1 Project.
As for liabilities, the primary causes of higher total long-term lia-bilities were increases in long-term debt and bonds. Meanwhile, a decrease in total current liabilities mainly resulted from lower short-term borrowings. Consequently, interest-bearing debt was ¥17,046 million lower than at the previous fiscal year-end. Total liabilities decreased ¥12,771 million from the previous fiscal year-end, to ¥1,545,171 million. Net assets increased ¥80,422 million from the previous fiscal year-end, to ¥804,659 million, due mainly to higher retained earnings. As a result, the equity ratio stood at 33.5%, and ROE was 9.4%.
456.1
1,101.8
724.2
419.3
1,125.9
804.7
255.5
1,697.1
40.5289.1
270.0
1,734.7
37.3307.9
Liabilities and net assets(¥ billion)
Assets(¥ billion)
Current assets +14.5
Main cause: Increase in trade
receivables
Current liabilities –36.8
Main cause:Decrease in
short-term borrowings
Noncurrent assets +53.2
Main cause:Increase in
construction in progress
Total assets ¥2,282.2 billion
Total liabilities and net assets ¥2,282.2 billion
Total assets ¥2,349.8 billion
Total liabilities and net assets ¥2,349.8 billion
Long-term liabilities +24.1
Main cause:Increase in
long-term debt
Net assets +80.4
Main cause:Increase in
capital surplus
FY2016 FY2016FY2017 FY2017
Current assets Property and equipment Intangible assets Investments and other assets
Current liabilities Long-term liabilities Net assets
Consolidated Financial Review
Hankyu Hanshin Holdings • Annual Report 201770

3. Fund ProcurementThe outstanding balance of interest-bearing debt at the end of the fiscal year under review amounted to ¥899,523 million, a decrease of ¥17,046 million from the previous fiscal year-end. This was because net cash provided by operating activities more than compensated for capital expenditure for the Ginza 3-chome Project and the build-ing of new rolling stock.
The ratio of interest-bearing debt/EBITDA (operating income + depreciation expenses + amortisation of goodwill), which is the benchmark the Company uses for assessing the soundness of its financial position, stood at 5.6 times at the end of the fiscal year under review, compared with 5.5 times at the previous fiscal year-end.
2. Cash FlowsCash and cash equivalents at end of year increased ¥167 million from the previous fiscal year-end, to ¥22,530 million.
(1) Cash Flows from Operating ActivitiesNet cash provided by operating activities was ¥115,633 million (down 7.4% year on year). The main factors were income before income taxes of ¥100,805 million, depreciation and amortisation of ¥52,800 million, and income taxes paid of ¥22,714 million.
(2) Cash Flows from Investing ActivitiesNet cash used in investing activities amounted to ¥84,845 million (up 7.6% year on year). This primarily reflected purchases of noncurrent assets of ¥92,767 million, purchases of investment securities of ¥11,527 million, and receipt of contributions for construction of ¥13,973 million.
(3) Cash Flows from Financing ActivitiesNet cash used in financing activities totalled ¥30,595 million (down 35.3% year on year). This was due partly to a net decrease in borrow-ings of ¥3,932 million, proceeds from new bonds issued of ¥19,858 million, redemption of bonds of ¥30,000 million, purchase of trea-sury stock of ¥5,271 million, and dividends paid of ¥8,803 million.
22.4+4.7 –0.9
+6.9 –20.0
–0.1+2.7 –6.7
–2.0
+21.1
+19.9 –30.0
–1.5 –0.6
+7.8 22.5
Cash flows(¥ billion)
Year ended 31st March 2016
Income before incom
e taxes
Depreciation and am
ortisation
Income taxes paid
Other
Purchases of noncurrent assets
Purchases of investment securities
Receipt of contributions for construction
Other
Net decrease in short-term
borrowings
Proceeds from new
bonds issued
Redemption of bonds
Purchases of treasury stock
Dividends paid
Other
Year ended 31st March 2017
Cash flows from operating activities
–9.2
Cash flows from investing activities
–6.0
Cash flows from financing activities
+16.7
Consolidated Financial Review
Hankyu Hanshin Holdings • Annual Report 2017 71

Consolidated Financial Review
Consolidated Capital Expenditure and Depreciation and AmortisationCapital expenditure in the fiscal year under review (on a consolidated basis; including intangible assets) increased ¥19,573 million, or 29.4%, year on year, to ¥86,212 million.
Urban TransportationThe railway business carried out capital investment with a focus on safety and service improvement, built new rolling stock, and improved existing rolling stock.
Real EstateThe Real Estate Business moved forward with the Ginza 3-chome Project and continued implementing the Umeda 1-1 Project.
Entertainment and CommunicationsThe Entertainment and Communications Business renewed the transmission lines of main lines.
TravelIn the Travel Business, Hankyu Travel International stepped-up Internet sales and invested in IT systems for in-house operations.
International TransportationIn the International Transportation Business, Hankyu Hanshin Express invested in IT systems for in-house operations.
HotelsIn the Hotels Business, Hankyu Hanshin Hotels refurbished the guest rooms of its hotels.
Depreciation and amortisation decreased ¥901 million, or 1.7%, from the previous year (on a consolidated basis), to ¥52,800 million.
The following is a breakdown for each business segment.
(Millions of yen) (%)
FY2017 YoY
Urban Transportation 31,158 11.4
Real Estate 43,144 52.5
Entertainment and Communications 7,388 24.8
Travel 528 4.1
International Transportation 384 –63.4
Hotels 3,182 42.5
Other 618 –13.7
Total 86,406 29.6
Adjustment (193) –272.6
Consolidated 86,212 29.4
Hankyu Hanshin Holdings • Annual Report 201772

Business Risks
Legal RiskIn accordance with the stipulations of Article 3 of the Railway Business Law, the Group must obtain separate permissions from the Ministry of Land, Infrastructure, Transport and Tourism (MLIT) for each category of railway operations on each route that it intends to operate. Moreover, under Article 16 of the Law, a railway operator must obtain the Ministry’s approval for the passenger fares it intends to set and on each occasion when it wishes to change the fares. Consequently, there is a certain risk that the Group’s railway opera-tions may be constrained in some way by the MLIT’s administration of these regulations.
Interest-Bearing DebtThe balance of interest-bearing debt held by the Group as of the end of March 2017, on a consolidated basis, was ¥899,523 million. As a result of the acquisition of shares in Hanshin Electric Railway through a successful public tender offer (takeover bid) on 27th June 2006, Hanshin Electric Railway has become a consolidated subsidiary of Hankyu Holdings. This acquisition has resulted in an increase in the balance of interest-bearing debt of the Group. On the other hand, management integration between the Hankyu Holdings Group and Hanshin Electric Railway Group has increased cash flows, so the Group is not expected to have any significant difficulty in repaying its debts. The Group will take measures to diversify its fund procurement methods to deal with an increase in interest-bearing debt resulting from the integration, and will use all possible means to minimise the negative impact of interest rate movements. But in the unlikely event that interest rates rise suddenly and in excess of our projec-tions, this could exert an adverse effect on the business performance and financial position of the Group.
Affiliated CompaniesIn order to ensure greater convenience for users of the Hokushin Kyuko Railway Line (run by consolidated subsidiary Hokushin Kyuko Railway), Hankyu Corporation (a consolidated subsidiary) has agreed to a plan transferring railway facilities held by Hokushin Kyuko Railway to Kobe Rapid Transit Railway (a consolidated subsidiary) and retaining railway business as a tier 2 railway operator. To facilitate the plan, in fiscal 2003 Hankyu Corporation provided Kobe Rapid Transit Railway with financing for part of the funds nec-essary to purchase the facilities.
In September 2007, Kobe Electric Railway (an equity-method affiliate) temporarily suspended support for the rehabilitation of Hokushin Kyuko Railway. To uphold the rehabilitation project, additional financing was extended to Hokushin Kyuko Railway by Hankyu Corporation. We will continue to provide assistance to ensure that Hokushin Kyuko Railway can conduct smooth and efficient operations as a tier 2 railway operator. However, the business performance and financial position of the Group could be affected by changes in this plan.
Decline in the Market Value of Assets Held by Members of the Hankyu Hanshin Holdings GroupIn the case of a substantial decline in the market value of inventory assets, property and equipment and intangible assets, investment securities, and other assets, the recording of impairment losses or valuation losses would likely have a negative impact on the earnings performance and financial position of the Hankyu Hanshin HoldingsGroup.
Declining Birth RateIn the Group’s mainstay Kyoto-Osaka-Kobe area, demographic changes accompanying the declining birth rate are expected to lower demand for railway, bus, and taxi services and other types of passenger transportation and to lower demand in other business areas. In addition, securing personnel is likely to become difficult as an imbalance between supply and demand develops in the labour market. Such contingencies could affect the business performance and financial position of the Group.
Natural DisastersOperating as it does across an extremely wide range of businesses in its Urban Transportation, Real Estate, Entertainment and Communications, Travel, International Transportation, and Hotels segments, the Group has a correspondingly large assortment of facilities necessary for the conduct of business, such as railway installations and buildings and retail outlets for rent. In the event of earthquakes or other major disasters, the business performance and financial position of the Group could be adversely affected by damage to these facilities.
The various categories of risk to which the business performance, stock price, financial position, and other aspects of operations of the Hankyu Hanshin Holdings Group are subject are detailed below. Nevertheless, these dangers do not encompass all risks attendant on Group activities and there are risks other than those stated below which are difficult to foresee. Information about future events that appears in this annual report was determined by the Group to be current as of 31st March 2017.
Hankyu Hanshin Holdings • Annual Report 2017 73

Consolidated Balance SheetsAs of 31st March 2016 and 2017
Millions of yen Thousands of U.S. dollars
2016 2017 2017
Assets:
Current assets:
Cash and deposits ¥ 24,225 ¥ 24,255 $ 216,563
Trade receivables 73,141 83,492 745,464
Land and buildings for sale 103,060 107,234 957,446
Finished products and merchandise 2,605 2,368 21,143
Work in progress 4,656 3,724 33,250
Materials and supplies 4,466 4,524 40,393
Deferred tax assets 6,427 7,044 62,893
Other 37,188 37,606 335,768
Allowance for doubtful receivables (234) (260) (2,321)
Total current assets 255,535 269,992 2,410,643
Noncurrent assets:
Property and equipment:
Buildings and structures–net [NOTE 5 ③] 572,227 563,652 5,032,607
Machinery, equipment and vehicles–net [NOTE 5 ③] 53,529 57,525 513,616
Land [NOTES 5 ③ and ⑤] 931,355 935,126 8,349,339
Construction in progress 120,589 158,847 1,418,277
Other–net [NOTE 5 ③] 19,369 19,552 174,571
Total property and equipment [NOTES 5 ① and ②] 1,697,070 1,734,702 15,488,411
Intangible assets:
Goodwill 23,295 20,822 185,911
Other [NOTES 5 ② and ③] 17,211 16,461 146,973
Total intangible assets 40,507 37,284 332,893
Investments and other assets:
Investment securities [NOTES 5 ③ and ④] 248,097 267,979 2,392,670
Deferred tax assets 4,323 4,146 37,018
Net defined benefit asset 5,947 7,194 64,232
Other [NOTE 5 ③] 31,046 28,810 257,232
Allowance for doubtful receivables (347) (279) (2,491)
Total investments and other assets 289,066 307,852 2,748,679
Total noncurrent assets 2,026,644 2,079,839 18,569,991
Total assets 2,282,180 2,349,831 20,980,634
Hankyu Hanshin Holdings • Annual Report 201774

Consolidated Balance Sheets
Millions of yen Thousands of U.S. dollars
2016 2017 2017
Liabilities:
Current liabilities:
Trade payables ¥ 37,480 ¥ 40,086 $ 357,911
Accrued expenses 18,199 17,938 160,161
Short-term borrowings [NOTE 5 ③] 205,909 178,408 1,592,929
Current portion of bonds 30,000 10,000 89,286
Lease obligations 1,794 1,795 16,027
Income taxes payable 6,188 9,704 86,643
Provision for bonuses 4,638 4,620 41,250
Other [NOTE 5 ③] 151,924 156,737 1,399,438
Total current liabilities 456,134 419,291 3,743,670
Long-term liabilities:
Long-term debt [NOTE 5 ③] 589,100 610,523 5,451,098
Bonds 82,000 92,000 821,429
Lease obligations 7,765 6,795 60,670
Deferred tax liabilities 189,812 179,530 1,602,946
Deferred tax liabilities related to land revaluation [NOTE 5 ⑤] 5,152 5,152 46,000
Net defined benefit liability 61,839 61,459 548,741
Long-term deferred contribution for construction 54,614 60,846 543,268
Other 111,521 109,571 978,313
Total long-term liabilities 1,101,807 1,125,879 10,052,491
Total liabilities 1,557,942 1,545,171 13,796,170
Net assets:
Shareholders’ equity:
Common stock 99,474 99,474 888,161
Capital surplus 145,974 146,053 1,304,045
Retained earnings 449,535 527,884 4,713,250
Less treasury stock, at cost (8,289) (13,537) (120,866)
Total shareholders’ equity 686,695 759,875 6,784,598
Accumulated other comprehensive income:
Valuation difference on available-for-sale securities 17,684 22,545 201,295
Deferred gains or losses on hedges (896) 472 4,214
Revaluation reserve for land [NOTE 5 ⑤] 5,598 5,546 49,518
Foreign currency translation adjustments 1,072 100 893
Cumulative adjustments related to retirement benefit plans (2,818) (1,591) (14,205)
Total accumulated other comprehensive income 20,639 27,074 241,732
Subscription rights to shares 424 496 4,429
Non-controlling interests [NOTE 5 ⑤] 16,478 17,213 153,688
Total net assets 724,237 804,659 7,184,455
Total liabilities and net assets 2,282,180 2,349,831 20,980,634
Hankyu Hanshin Holdings • Annual Report 2017 75
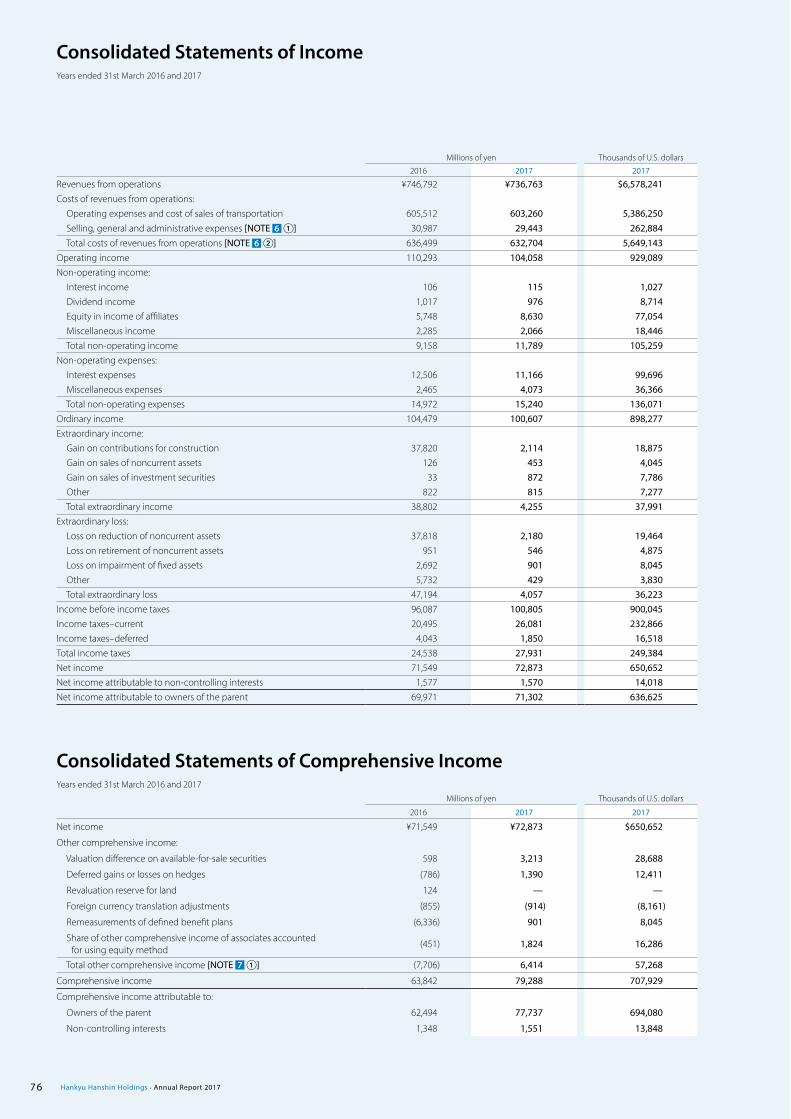
Consolidated Statements of IncomeYears ended 31st March 2016 and 2017
Consolidated Statements of Comprehensive IncomeYears ended 31st March 2016 and 2017
Millions of yen Thousands of U.S. dollars
2016 2017 2017
Revenues from operations ¥746,792 ¥736,763 $6,578,241Costs of revenues from operations: Operating expenses and cost of sales of transportation 605,512 603,260 5,386,250 Selling, general and administrative expenses [NOTE 6 ①] 30,987 29,443 262,884 Total costs of revenues from operations [NOTE 6 ②] 636,499 632,704 5,649,143Operating income 110,293 104,058 929,089Non-operating income: Interest income 106 115 1,027 Dividend income 1,017 976 8,714 Equity in income of affiliates 5,748 8,630 77,054 Miscellaneous income 2,285 2,066 18,446 Total non-operating income 9,158 11,789 105,259Non-operating expenses: Interest expenses 12,506 11,166 99,696 Miscellaneous expenses 2,465 4,073 36,366 Total non-operating expenses 14,972 15,240 136,071Ordinary income 104,479 100,607 898,277Extraordinary income: Gain on contributions for construction 37,820 2,114 18,875 Gain on sales of noncurrent assets 126 453 4,045 Gain on sales of investment securities 33 872 7,786 Other 822 815 7,277 Total extraordinary income 38,802 4,255 37,991Extraordinary loss: Loss on reduction of noncurrent assets 37,818 2,180 19,464 Loss on retirement of noncurrent assets 951 546 4,875 Loss on impairment of fixed assets 2,692 901 8,045 Other 5,732 429 3,830 Total extraordinary loss 47,194 4,057 36,223Income before income taxes 96,087 100,805 900,045Income taxes–current 20,495 26,081 232,866Income taxes–deferred 4,043 1,850 16,518Total income taxes 24,538 27,931 249,384Net income 71,549 72,873 650,652Net income attributable to non-controlling interests 1,577 1,570 14,018Net income attributable to owners of the parent 69,971 71,302 636,625
Millions of yen Thousands of U.S. dollars
2016 2017 2017
Net income ¥71,549 ¥72,873 $650,652
Other comprehensive income:
Valuation difference on available-for-sale securities 598 3,213 28,688
Deferred gains or losses on hedges (786) 1,390 12,411
Revaluation reserve for land 124 — —
Foreign currency translation adjustments (855) (914) (8,161)
Remeasurements of defined benefit plans (6,336) 901 8,045
Share of other comprehensive income of associates accounted for using equity method
(451) 1,824 16,286
Total other comprehensive income [NOTE 7 ①] (7,706) 6,414 57,268
Comprehensive income 63,842 79,288 707,929
Comprehensive income attributable to:
Owners of the parent 62,494 77,737 694,080
Non-controlling interests 1,348 1,551 13,848
Hankyu Hanshin Holdings • Annual Report 201776

Consolidated Statements of Changes in Net AssetsYears ended 31st March 2016 and 2017
Millions of yenShareholders’ equity
Common stock Capital surplus
Retained earnings
Less treasury stock, at cost
Total shareholders’
equityBalance as of 31st March 2015 ¥99,474 ¥150,027 ¥389,511 ¥ (4,534) ¥634,479 Cumulative effect of changes in accounting policies (4,500) (527) (5,027)Balance at beginning of the current fiscal year reflecting changes in accounting policies 99,474 145,527 388,984 (4,534) 629,452
Changes of items during the period: Dividends from surplus (8,227) (8,227) Net income attributable to owners of the parent 69,971 69,971 Reversal of revaluation reserve for land 0 0 Purchase of treasury stock (3,779) (3,779) Disposal of treasury stock (0) (0) 24 23 Change in treasury stock of parent arising from
transactions with non-controlling interest shareholders 447 447
Change in scope of consolidation (1,192) (1,192) Changes in equity in affiliates accounted
for by equity-method treasury stock —
Net changes of items other than shareholders’ equity Total changes of items during the period — 447 60,550 (3,755) 57,242 Balance as of 31st March 2016 99,474 145,974 449,535 (8,289) 686,695 Cumulative effect of changes in accounting policies 15,281 15,281 Balance at beginning of the current fiscal year reflecting changes in accounting policies 99,474 145,974 464,817 (8,289) 701,976
Changes of items during the period: Dividends from surplus (8,803) (8,803) Net income attributable to owners of the parent 71,302 71,302 Reversal of revaluation reserve for land 0 0 Purchase of treasury stock (5,271) (5,271) Disposal of treasury stock (9) 53 44 Change in treasury stock of parent arising from
transactions with non-controlling interest shareholders 79 79
Change in scope of consolidation 577 577 Changes in equity in affiliates accounted
for by equity-method treasury stock (30) (30)
Net changes of items other than shareholders’ equity Total changes of items during the period — 79 63,067 (5,247) 57,898 Balance as of 31st March 2017 99,474 146,053 527,884 (13,537) 759,875
Millions of yenAccumulated other comprehensive income
Subscriptionrights to shares
Non-controllinginterests
Totalnet assets
Valuationdifference on
available-for-salesecurities
Deferred gainsor losses on
hedges
Revaluationreserve for land
Foreigncurrency
translationadjustments
Cumulative adjustments related
to retirement benefit plans
Totalaccumulated
othercomprehensive
incomeBalance as of 31st March 2015 ¥18,052 ¥ (143) ¥5,417 ¥1,756 ¥ 3,033 ¥28,116 ¥318 ¥16,566 ¥679,482 Cumulative effect of changes in accounting policies — (5,027)Balance at beginning of the current fiscal year reflecting changes in accounting policies 18,052 (143) 5,417 1,756 3,033 28,116 318 16,566 674,454
Changes of items during the period: Dividends from surplus (8,227) Net income attributable to owners of the parent 69,971 Reversal of revaluation reserve for land 0 Purchase of treasury stock (3,779) Disposal of treasury stock 23 Change in treasury stock of parent arising from
transactions with non-controlling interest shareholders 447
Change in scope of consolidation (1,192) Changes in equity in affiliates accounted
for by equity-method treasury stock —
Net changes of items other than shareholders’ equity (368) (752) 180 (684) (5,851) (7,476) 105 (88) (7,459)Total changes of items during the period (368) (752) 180 (684) (5,851) (7,476) 105 (88) 49,783 Balance as of 31st March 2016 17,684 (896) 5,598 1,072 (2,818) 20,639 424 16,478 724,237 Cumulative effect of changes in accounting policies — 15,281 Balance at beginning of the current fiscal year reflecting changes in accounting policies 17,684 (896) 5,598 1,072 (2,818) 20,639 424 16,478 739,519
Changes of items during the period: Dividends from surplus (8,803) Net income attributable to owners of the parent 71,302 Reversal of revaluation reserve for land 0 Purchase of treasury stock (5,271) Disposal of treasury stock 44 Change in treasury stock of parent arising from
transactions with non-controlling interest shareholders 79
Change in scope of consolidation 577 Changes in equity in affiliates accounted
for by equity-method treasury stock (30)
Net changes of items other than shareholders’ equity 4,861 1,369 (52) (971) 1,227 6,434 72 735 7,241 Total changes of items during the period 4,861 1,369 (52) (971) 1,227 6,434 72 735 65,140 Balance as of 31st March 2017 22,545 472 5,546 100 (1,591) 27,074 496 17,213 804,659
Hankyu Hanshin Holdings • Annual Report 2017 77

Consolidated Statements of Changes in Net Assets
Thousands of U.S. dollarsShareholders’ equity
Common stock Capital surplus
Retained earnings
Less treasury stock, at cost
Total shareholders’
equityBalance as of 31st March 2016 $888,161 $1,303,339 $4,013,705 $ (74,009) $6,131,205 Cumulative effect of changes in accounting policies 136,438 136,438 Balance at beginning of the current fiscal year reflecting changes in accounting policies 888,161 1,303,339 4,150,152 (74,009) 6,267,643
Changes of items during the period: Dividends from surplus (78,598) (78,598) Net income attributable to owners of the parent 636,625 636,625 Reversal of revaluation reserve for land 0 0 Purchase of treasury stock (47,063) (47,063) Disposal of treasury stock (80) 473 393 Change in treasury stock of parent arising from
transactions with non-controlling interest shareholders 705 705
Change in scope of consolidation 5,152 5,152 Changes in equity in affiliates accounted
for by equity-method treasury stock (268) (268)
Net changes of items other than shareholders’ equityTotal changes of items during the period — 705 563,098 (46,848) 516,946 Balance as of 31st March 2017 888,161 1,304,045 4,713,250 (120,866) 6,784,598
Thousands of U.S. dollarsAccumulated other comprehensive income
Subscriptionrights to shares
Non-controllinginterests
Totalnet assets
Valuationdifference on
available-for-salesecurities
Deferred gainsor losses on
hedges
Revaluationreserve for land
Foreigncurrency
translationadjustments
Cumulative adjustments related
to retirement benefit plans
Totalaccumulated
othercomprehensive
incomeBalance as of 31st March 2016 $157,893 $ (8,000) $49,982 $ 9,571 $(25,161) $184,277 $3,786 $147,125 $6,466,402 Cumulative effect of changes in accounting policies — 136,438Balance at beginning of the current fiscal year reflecting changes in accounting policies 157,893 (8,000) 49,982 9,571 (25,161) 184,277 3,786 147,125 6,602,848
Changes of items during the period: Dividends from surplus (78,598) Net income attributable to owners of the parent 636,625 Reversal of revaluation reserve for land 0 Purchase of treasury stock (47,063) Disposal of treasury stock 393 Change in treasury stock of parent arising from
transactions with non-controlling interest shareholders 705
Change in scope of consolidation 5,152 Changes in equity in affiliates accounted
for by equity-method treasury stock (268)
Net changes of items other than shareholders’ equity 43,402 12,223 (464) (8,670) 10,955 57,446 643 6,563 64,652 Total changes of items during the period 43,402 12,223 (464) (8,670) 10,955 57,446 643 6,563 581,607 Balance as of 31st March 2017 201,295 4,214 49,518 893 (14,205) 241,732 4,429 153,688 7,184,455
Hankyu Hanshin Holdings • Annual Report 201778

Consolidated Statements of Cash FlowsYears ended 31st March 2016 and 2017
Millions of yen Thousands of U.S. dollars
2016 2017 2017
Cash flows from operating activities:
Income before income taxes ¥ 96,087 ¥100,805 $ 900,045
Depreciation and amortisation 53,701 52,800 471,429
Loss on impairment of fixed assets 2,692 901 8,045
Amortisation of goodwill 2,471 2,426 21,661
Equity in (income) losses of affiliates (5,748) (8,630) (77,054)
Increase (decrease) in net defined benefit liability (2,077) (179) (1,598)
Increase (decrease) in allowance for doubtful receivables (42) 20 179
Interest and dividend income (1,124) (1,092) (9,750)
Interest expenses 12,506 11,166 99,696
Loss on reduction of noncurrent assets 37,818 2,180 19,464
Loss on retirement of noncurrent assets 951 546 4,875
Loss (gain) on sales of noncurrent assets 183 (426) (3,804)
Gain on contributions for construction (37,820) (2,114) (18,875)
Loss (gain) on valuation of investment securities (33) (869) (7,759)
Decrease (increase) in trade receivables 6,129 (10,595) (94,598)
Decrease (increase) in inventories (1,174) (2,506) (22,375)
Increase (decrease) in trade payables (5,028) 3,083 27,527
Other 4,436 (1,096) (9,786)
Subtotal 163,930 146,420 1,307,321
Interest and dividends received 3,156 3,208 28,643
Interest paid (12,591) (11,282) (100,732)
Income taxes (paid) refunded (29,656) (22,714) (202,804)
Net cash provided by operating activities 124,838 115,633 1,032,438
Cash flows from investing activities:
Purchases of noncurrent assets (92,686) (92,767) (828,277)
Proceeds from sales of noncurrent assets 5,064 2,186 19,518
Purchases of investment securities (14,228) (11,527) (102,920)
Proceeds from sales of investment securities 618 1,611 14,384
Receipt of contributions for construction 20,623 13,973 124,759
Other 1,765 1,677 14,973
Net cash used in investing activities (78,843) (84,845) (757,545)
Cash flows from financing activities:
Net increase (decrease) in short-term borrowings (21,628) (546) (4,875)
Proceeds from long-term debt 65,830 65,190 582,054
Repayment of long-term debt (76,570) (68,576) (612,286)
Proceeds from new bonds issued — 19,858 177,304
Redemption of bonds — (30,000) (267,857)
Purchases of treasury stock (3,779) (5,271) (47,063)
Dividends paid (8,227) (8,803) (78,598)
Dividends paid to non-controlling shareholders of consolidated subsidiaries (331) (406) (3,625)
Other (2,571) (2,038) (18,196)
Net cash used in financing activities (47,278) (30,595) (273,170)
Effect of exchange rate changes on cash and cash equivalents (694) (673) (6,009)
Increase (decrease) in cash and cash equivalents (1,978) (480) (4,286)
Cash and cash equivalents at beginning of year 23,497 22,363 199,670
Increase in cash and cash equivalents from newly consolidated subsidiary 844 648 5,786
Cash and cash equivalents at end of year 22,363 22,530 201,161
Hankyu Hanshin Holdings • Annual Report 2017 79

2 Basis of Preparation of Consolidated Financial Statements 1 Scope of consolidation(a) Number and names of consolidated subsidiaries
Number of consolidated subsidiaries—93.
Names of primary consolidated subsidiaries are listed on page 107.
Further, as of the fiscal year ended 31st March 2017, Hanshin Sharyo
Maintenance and one other company have been included in the scope of
consolidation due to their increased significance.
Also, Iina Dining Co., Ltd. has been excluded from the scope of consoli-
dation because a portion of its shares were sold in the fiscal year ended
31st March 2017, and Nippon Rent-A-Car Hankyu Inc. has been excluded
from the scope of consolidation because all of its shares were sold in the
fiscal year ended 31st March 2017.
(b) Names of major nonconsolidated subsidiaries
Hankyu Mediax Co., Ltd.
Nonconsolidated subsidiaries have been excluded from the scope of
consolidation because the total amounts of their entire assets, sales, net
income or loss (amount equivalent to equity interests), retained earnings
(amount equivalent to equity interests) and other figures are limited, and
the effect on the consolidated financial statements as a whole is negligible.
2 Items related to application of equity-method accounting(a) Number and names of affiliates for which equity method is applied
Number of affiliates for which equity method is applied—11.
Names of the major affiliates for which equity method is applied are
listed on page 107.
Further, as of the fiscal year ended 31st March 2017, the equity method
has been applied to Iina Dining Co., Ltd., previously a subsidiary, because
a portion of its shares were sold.
(b) Names of nonconsolidated subsidiaries and affiliates for which equity
method is not applied
The nonconsolidated subsidiaries (Hankyu Mediax Co., Ltd., etc.) and affili-
ates (OS Co., Ltd., etc.) to which the equity method does not apply use the
cost method rather than the equity method because the total amounts of
their net income or loss (amount equivalent to equity interests), retained
earnings (amount equivalent to equity interests) and other figures are
limited, and the effect on the consolidated financial statements as a
whole is negligible.
3 Items related to fiscal year-ends, etc., for consolidated subsidiariesThe account closing date for Hankyu Hanshin Express (USA) Inc., Hankyu
Hanshin Express (Deutschland) GmbH and 20 other consolidated subsidiaries
is 31st December. The consolidated financial statements have been prepared
using the financial statements based on the closing date of each company,
and major transactions conducted between the individual closing dates
and the consolidated closing date have been adjusted for as necessary for
the consolidation.
4 Accounting policies(a) Valuation standards and method for major assets
I. Securities
Available-for-sale securities:
Available-for-sale securities with fair market values:
The market value method is applied based on the market price, etc., at the
fiscal year-end. (Related valuation differences are directly included under
net assets and the cost of securities sold is determined by the moving
average method.)
Available-for-sale securities without fair market values:
The moving average cost method is applied.
For investments in limited liability investment partnerships and similar
investments, however, the Company’s share of assets held by such part-
nerships is recorded.
II. Derivatives
The market value method is applied.
III. Inventories
Land and buildings for sale:
The identified cost method is applied. (Balance sheet values are calculated
by writing down book values based on decreased profitability.)
Other inventories:
The moving average cost method is applied. (Balance sheet values are
calculated by writing down book values based on decreased profitability.)
Notes to the Consolidated Financial Statements
1 Framework for Preparing Consolidated Financial Statements 1 Method of preparation for consolidated financial statementsThe Company’s consolidated financial statements were prepared in accor-
dance with the “Regulations Concerning the Terminology, Forms and
Preparation Method of Consolidated Financial Statements” (Finance Ministry
Ordinance No. 28 of 1976, hereinafter, “Regulations for Consolidated Financial
Statements”).
2 Audit verificationThe Company’s consolidated financial statements for the fiscal year ended
31st March 2017 (1st April 2016 to 31st March 2017) were audited by KPMG
AZSA LLC, as per Article 193-2 (1) of Japan’s Financial Instruments and
Exchange Act.
3 Special measures to ensure the appropriateness of consolidated financial statements and other reports
The Company makes special efforts to ensure the appropriateness of its con-
solidated financial statements and other reports. In addition to subscribing to
related publications, it has joined the Financial Accounting Standards
Foundation and participates in seminars and other events held by the
Foundation, audit firms and other relevant organisations to establish a system
for understanding the accounting standards in detail and responding suitably
to changes made to them. The Company also compiles and provides common
manuals for preparing the consolidated financial information on a Groupwide
basis, and arranges training courses for accounting staff at affiliates.
4 Translation into U.S. dollarsThe U.S. dollar amounts have been translated, for convenience only, at ¥112 =
US$1, the prevailing exchange rate on the Tokyo Foreign Exchange Market as
of 31st March 2017.
Hankyu Hanshin Holdings • Annual Report 201780

Notes to the Consolidated Financial Statements
(b) Depreciation methods for major depreciable assets
I. Property and equipment (excluding leased assets)
Replacement assets of railway operations:
Replacement method (mainly the declining-balance method) is applied.
Other property and equipment:
While property and equipment (excluding leased assets) are depreciated
for the most part using the declining balance method, there is also some
use of the straight-line method.
However, regarding the abovementioned “Replacement assets of
railway operations” and “Other property and equipment,” depreciation of
buildings acquired on or after 1st April 1998 (excluding facilities attached
to buildings) and depreciation of facilities and structures that are attached
to buildings and which were acquired on or after 1st April 2016 are calcu-
lated using the straight-line method.
II. Intangible assets (excluding leased assets)
Intangible assets (excluding leased assets) are amortised using the
straight-line method.
Internal-use software is amortised by the straight-line method over its
useful life (mainly 5 years).
III. Lease assets
Lease assets are depreciated using the straight-line method with the lease
term as the useful life and the residual value as zero.
(c) Accounting standards for significant transactions
I. Allowance for doubtful receivables
Allowance for doubtful receivables is provided based on the ratio of past
loan loss experience for general accounts and individually estimated
uncollectible amounts for certain individual accounts.
II. Provision for bonuses
The Company recognises as provision for bonuses the amount expected
to be paid to employees as bonuses for the fiscal year.
(d) Accounting methods for retirement benefits
When calculating retirement benefit obligations, the benefit formula
method is used to distribute the estimated amount of retirement benefits
into the period up to 31st March 2017.
Prior service cost is recorded in expenses using the straight-line
method over a certain number of years (mainly 10 years), which is within
the average remaining years of service of the employees at the time when
these costs are incurred.
Actuarial differences are recorded in expenses using the straight-line
method over a certain number of years (mainly 10 years), which is within
the average remaining years of service of the employees at the time when
these costs are incurred.
(e) Basis for converting significant assets and liabilities in foreign currencies
into Japanese yen
The assets and liabilities of overseas subsidiaries are converted into
yen based on the spot exchange rate on the balance sheet date, and
income and expenses of overseas subsidiaries are converted into yen
based on the average exchange rate during the relevant period.
Differences in conversion are included in foreign currency translation
adjustments and non-controlling interests in the net assets section.
(f ) Significant hedge accounting methods
I. Method of hedge accounting
Deferred hedge accounting is applied.
Exceptional accounting applies to interest rate swaps that satisfy the
requirements for exceptional accounting for interest rate swaps.
Designation accounting applies to foreign currency-denominated
receivables and payables that have forward exchange contracts and
which satisfy the requirements for designation accounting.
II. Hedging instruments and hedged items
Hedging instruments Hedged itemsForward exchange contracts Currency swap contracts Currency option contracts
Interest rate swap contracts Interest rate option contracts
Foreign currency receivables and payables and future foreign currency
transactions
Interest on bonds and loans payable
III. Hedging policy
The Group is exposed to the risk of foreign exchange and interest rate
fluctuations and uses derivatives as a means of hedging these risks.
IV. Method for evaluating the effectiveness of hedges
Other than when the effectiveness of hedges is obvious, hedge effective-
ness is evaluated semiannually using the comparison and analysis method.
V. Other risk management methods concerning hedge accounting
Internal rules regarding the segregation of duties, maximum transaction
amounts, etc., have been established for the use of derivative transactions
based on which derivative transactions are used. The implementation and
management of derivative transactions are carried out by the accounting
department with the approval of the decision makers in each Group
company. An internal control system has been developed to ensure that
the contract signing and termination comply with the internal rules.
(g) Method and period of amortisation of goodwill
Goodwill is amortised, in general, in equal amounts over five years. The
goodwill resulting from the management integration with Hanshin
Electric Railway Co., Ltd. in the fiscal year ended 31st March 2007 is being
amortised in equal amounts over 20 years.
(h) Scope of cash included in consolidated statements of cash flows
In preparing the consolidated statements of cash flows, cash on hand,
readily available deposits and short-term highly liquid investments
without material risk of changing their value and with maturities not
exceeding three months at the time of purchase are considered to be
cash and cash equivalents.
Hankyu Hanshin Holdings • Annual Report 2017 81
Notes to the Consolidated Financial Statements
3 Changes in Accounting Policies 1 Application of “Practical Solution on a Change in
Depreciation Method Due to Tax Reform 2016”Due to amendments to the Japanese Corporation Tax Act, the Company and
its domestic subsidiaries adopted “Practical Solution on a Change in
Depreciation Method Due to Tax Reform 2016” (Practical Issue Task Force No.
32, 17th June 2016 (hereinafter, “PITF No. 32”)) from the current fiscal year and
changed the depreciation method for buildings, facilities attached to build-
ings and structures that were acquired since 1st April 2016 from the declining-
balance method to the straight-line method.
The effect of these changes on the consolidated financial statements has
been immaterial.
2 Application of “Revised Implementation Guidance on Recoverability of Deferred Tax Assets”
The Company and its domestic subsidiaries adopted “Revised Implementation
Guidance on Recoverability of Deferred Tax Assets” (ASBJ Guidance No. 26,
28th March 2016 (hereinafter, “Guidance No. 26”)) from the current fiscal year
and revised certain accounting for recoverability of deferred tax assets
accordingly.
The Company and its domestic subsidiaries followed the provisional treat-
ments in article 49 (4) of Guidance No. 26. The differences between deferred
tax assets and liabilities as of 1st April 2016 that were computed in accordance
with article 49 (3) and those as of 31st March 2016 were adjusted to retained
earnings as of 1st April 2016.
As a result, deferred tax liabilities (long-term liabilities) decreased by
¥15,281 million ($136,438 thousand) and retained earnings increased by
¥15,281 million ($136,438 thousand).
Due to reflection of such effects to net assets as of 1st April 2016, retained
earnings as of 1st April 2016 in the consolidated statement of changes in net
assets increased by ¥15,281 million ($136,438 thousand).
3 Change in recognition of revenues from operationsIn the International Transportation Business, for transactions related to items
such as the export of mixed cargo by consolidated subsidiaries, the Company
previously presented sales to customers net of cost of sales such as shipping
costs (net basis). As of the fiscal year ended 31st March 2017, however, the
Company is presenting sales and cost of sales separately and the totals in
revenues from operations and cost of sales (gross basis) respectively.
This change resulted from a reconsideration of the recognition of reve-
nues from operations, which concluded that the net amount presentation
reflects the business activities of the business more appropriately. This conclu-
sion was reached in light of the importance in business as a transportation
provider of transactions related to the export of mixed cargo, the main type of
transactions, an upgrading of the core operational systems of the major con-
solidated subsidiaries in the business that enables the identification of cost of
sales such as shipping costs and the need to prepare for the future advance-
ment of the Hankyu Hanshin Holdings Group’s global development.
The Company has applied the said change in accounting policy retroac-
tively. Consequently, the Company has applied the said change in accounting
policy retroactively to the consolidated financial statements of the fiscal year
ended 31st March 2016.
The Company has applied the change in accounting policy retroactively
to the consolidated financial statements of the fiscal year ended 31st March
2016. As a result, revenues from operations, operating expenses and cost of
sales of transportation for the fiscal year ended 31st March 2016 increased by
¥39,433 million ($352,080 thousand) compared to the amounts for these line
items before the retroactive application. However, retroactive application has
not affected operating income, ordinary income and income before income
taxes for the fiscal year ended 31st March 2016. Further, because there is no
cumulative effect that should be reflected in net assets as of 1st April 2015,
retroactive application has not affected retained earnings as of 1st April 2015.
Also, the effect on segment information is stated in the segment informa-
tion section.
4 Change in the translation of income and expenses of overseas subsidiaries
Previously, the Company used the spot exchange rate on the balance sheet
date to translate the income and expenses of overseas subsidiaries of the
International Transportation Business into yen. As of the fiscal year ended 31st
March 2017, however, the Company will use the average exchange rate
during the relevant period for translations into yen.
As stated above in “3 Change in recognition of revenues from opera-
tions,” the significance of the income and expenses of overseas subsidiaries
has increased due to the change in recognition of revenues from operations
to gross presentation as of the fiscal year ended 31st March 2017. Therefore,
the Company implemented this change to mitigate the effect of temporary
exchange rate fluctuations and to reflect the business results of overseas sub-
sidiaries in consolidated financial statements more appropriately.
Further, the Company has not undertaken retrospective application
because the effect of the said change in accounting policy on the income
and expenses of the fiscal year ended 31st March 2016 as well as the cumu-
lative effect that should be reflected in net assets on 1st April 2015
were immaterial.
(i) Other significant matters for preparing consolidated financial statements
I. Accounting for contributions for construction in railway operations
The Company accepts contributions for construction from local govern-
ments and other organisations that cover a portion of construction
expenses arising from the construction of continuous grade separations
in railway operations. When construction is completed, noncurrent assets
acquired as a result of accepting these contributions for construction are
recognised at acquisition cost after deducting the amounts equivalent to
the said contributions for construction.
In the consolidated statements of income, gain on contributions for
construction is recognised in extraordinary income, and the acquisition
cost of noncurrent assets, after deducting the amounts equivalent to the
contributions for construction, is recognised in extraordinary loss as loss
on reduction of noncurrent assets.
II. Accounting for consumption tax
Accounting for consumption tax is based on the tax exclusion method.
III. Adoption of consolidated tax payment system
A consolidated tax payment system has been adopted.
Hankyu Hanshin Holdings • Annual Report 201782

Notes to the Consolidated Financial Statements
4 Changes in Presentation 1 Consolidated statements of incomeTo present line items in the consolidated statements of income more clearly,
as of the fiscal year ended 31st March 2017, the Company will present “Loss on
retirement of noncurrent assets” and “Loss on impairment of fixed assets”
separately. In the fiscal year ended 31st March 2016, the Company included
these line items in “Other” of extraordinary loss. In the fiscal year ended 31st
March 2016, the Company presented “Loss (gain) on valuation of investment
securities” separately in extraordinary loss. As of the fiscal year ended 31st
March 2017, the Company will include this line item in “Other” of extraordinary
loss because the line item has become insignificant.
As a result, in the consolidated statement of income for the fiscal year
ended 31st March 2016, “Loss (gain) on valuation of investment securities” of
¥4,979 million ($44,455 thousand) and “Other” of ¥4,397 million ($39,259 thou-
sand) in extraordinary loss comprise “Loss on retirement of noncurrent assets” of
¥951 million ($8,491 thousand), “Loss on impairment of fixed assets” of ¥2,692
million ($24,036 thousand) and “Other” of ¥5,732 million ($51,179 thousand).
5 Consolidated Balance Sheets 1 Accumulated depreciation of property and equipment
Millions of yen Thousands of U.S. dollars
2016 2017 2017
¥1,097,585 ¥1,123,035 $10,027,098
2 Accumulated contributions for construction directly deducted from the acquisition cost of noncurrent assets
Millions of yen Thousands of U.S. dollars
2016 2017 2017
¥413,614 ¥413,812 $3,694,750
3 Pledged assets and secured liabilitiesThe following table shows the assets pledged as collateral.
Millions of yen Thousands of U.S. dollars
2016 2017 2017
Property and equipment:
Buildings and structures ¥211,110 [¥211,110] ¥208,550 [¥208,550] $1,862,054 [$1,862,054]
Machinery, equipment and vehicles 42,841 [42,841] 44,980 [44,980] 401,607 [401,607]
Land 255,924 [255,924] 255,965 [255,965] 2,285,402 [2,285,402]
Other 2,297 [2,297] 2,780 2,780 24,821 [24,821]
Intangible assets:
Other 128 [128] 128 [128] 1,143 [1,143]
Investments and other assets:
Investment securities 3,033 [—] 1,007 [—] 8,991 [—]
Other 24 [—] 76 [—] 679 [—]
Total 515,360 [512,302] 513,489 [512,406] 4,584,723 [4,575,054]
In addition to the above, the Company pledged investment securities (fiscal year ended 31st March 2016: ¥800 million, fiscal year ended 31st March 2017: ¥800
million ($7,143 thousand)) as collateral for loans of third parties.
The following table shows the secured liabilities.Millions of yen Thousands of U.S. dollars
2016 2017 2017
Current liabilities:
Short-term borrowings ¥ 11,118 [¥ 9,108] ¥ 9,748 [¥ 9,309] $ 87,036 [$ 83,116]
Other 75 [—] 76 [—] 679 [—]
Long-term liabilities:
Long-term debt 110,598 [110,065] 110,691 [110,596] 988,313 [987,464]
Total 121,793 [119,173] 120,516 [119,905] 1,076,036 [1,0705,80]
The amounts in brackets are the amounts for the Railway Foundation within the total of each category.
4 The following table shows the securities of nonconsolidated subsidiaries and affiliates.
Millions of yenThousands of
U.S. dollars
2016 2017 2017
Investment securities ¥197,131 ¥213,951 $1,910,277
Hankyu Hanshin Holdings • Annual Report 2017 83

Notes to the Consolidated Financial Statements
6 Consolidated Statements of Income 1 The breakdown of selling, general and administrative expenses is
shown below.
Millions of yenThousands of
U.S. dollars
2016 2017 2017
Personnel expenses ¥15,683 ¥14,651 $130,813
Expenses 10,969 10,425 93,080
Taxes 908 1,025 9,152
Depreciation and amortisation
954 914 8,161
Amortisation of goodwill 2,471 2,426 21,661
Total 30,987 29,443 262,884
2 The retirement benefit expenses and the main expense items and monetary amounts within the amounts of allowance and provision included in the costs of revenues from operations are shown below.
Millions of yenThousands of
U.S. dollars
2016 2017 2017
Retirement benefit expenses
¥6,369 ¥8,457 $75,509
Provision for bonuses 4,694 4,716 42,107
3 The breakdown of the gain on sales of noncurrent assets is shown below.
Millions of yenThousands of
U.S. dollars
2016 2017 2017
Land, etc. ¥126 ¥453 $4,045
5 Two consolidated subsidiaries and an equity-method affiliate revaluated land for business use based on the Law Concerning Revaluations of Land (Law No. 34, promulgated on 31st March 1998) and the Law to Partially Modify the Law Concerning Revaluations of Land (Law No. 19, promulgated on 31st March 2001). Of the valuation differences identified as a result of this, the consolidated subsidiaries recorded the amount correspond-ing to the taxes on the valuation difference in the liability section as “Deferred tax liabilities related to land revaluation” and the amount attributable to minority shareholders as “non-controlling interests.” The amount remaining after subtracting these was recorded in the net assets section as “Revaluation reserve for land.” The equity-method affiliate recorded the amount corresponding to its equity in the valuation difference (after subtracting taxes) in the net assets section as “Revaluation reserve for land.”
• Revaluation method
The revaluation amounts were determined based on the revaluated value of
noncurrent assets provided for in Article 2, Paragraph 3 of the Enforcement
Ordinance for the Law Concerning Land Revaluation (Ordinance No. 119,
promulgated on 31st March 1998).
• Date of revaluation: 31st March 2002
• The difference between the market value of the land and the book value
after revaluation on 31st March 2016 and 31st March 2017:Millions of yen Thousands of U.S. dollars
2016 2017 2017
¥(6,069) ¥(6,084) $(54,321)
6 Contingent liabilitiesThe Company and its subsidiaries provide a liability guarantee for loans of the
companies, etc., listed below.
Fiscal year ended 31st March 2016
Millions of yen
Nishi-Osaka Railway Co., Ltd. ¥20,376
Borrowers on loans for purchase of land and buildings
14,039
Other (two companies) 67
Total 34,483
Fiscal year ended 31st March 2017
Millions of yenThousands of
U.S. dollars
Nishi-Osaka Railway Co., Ltd. ¥19,781 $176,616
Borrowers on loans for purchase of land and buildings
10,089 90,080
Other (two companies) 65 580
Total 29,936 267,286
Further, in addition to the above, in the fiscal year ended 31st March 2017,
the Company provided a letter of awareness and other documents in relation
to an affiliate’s fund procurement of ¥1,587 million ($14,170 thousand).
Hankyu Hanshin Holdings • Annual Report 201784

Notes to the Consolidated Financial Statements
4 Loss on impairment of fixed assetsFiscal year ended 31st March 2016 (from 1st April 2015 to 31st March 2016)
The Group recorded loss on impairment of fixed assets for the following
asset groups.Use Type of asset Region Millions of yen
Assets of Hotels Business: 4 assets
Land, etc. Hyogo Prefecture, etc.
¥2,033
Assets of Real Estate Leasing Business:
37 assets
Buildings, structures, etc.
Hyogo Prefecture, etc.
658
(a) Method of grouping assets
Assets are grouped by business based on management accounting or
by property.
(b) Procedure before recognition of loss on impairment of fixed assets
The book values of fixed assets groups for which discontinuation of opera-
tions or dismantlement had been decided were reduced to their recoverable
amounts. The said reductions were recorded in extraordinary loss as loss on
impairment of fixed assets of ¥2,692 million.
(c) Breakdown of loss on impairment of fixed assetsType of assets Millions of yen
Land, etc. ¥1,639Buildings, structures, etc. 1,053
Total 2,692
(d) Method of determining recoverable value
The recoverable value is calculated based on the net sale value.
The net sale value of assets for which discontinuation of operations or
dismantlement has been decided is assessed by using the memorandum
value. The net sale value of other assets is calculated by rationally adjusting
appraised value based on Japanese Real Estate Appraisal Standards and other
assessments.
Fiscal year ended 31st March 2017 (from 1st April 2016 to 31st March 2017)
The Group recorded loss on impairment of fixed assets for the following
asset groups.
Use Type of asset RegionMillions of yen
Thousands of U.S. dollars
Assets of businesses of the Other
segment: 3 assetsLand, etc.
Osaka Prefecture, etc.
¥521 $4,652
Assets, etc. of Hotels Business: 20 assets
Buildings, structures, etc.
Osaka Prefecture, etc.
379 3,384
(a) Method of grouping assets
Assets are grouped by business based on management accounting or
by property.
(b) Procedure up to the recognition of a loss on impairment of fixed assets
The book values of fixed assets groups for which a decision for dismantlement
has been taken, those whose market values have been declining sharply from
their book values due to a continuous decrease in land value, and those that
have continuously resulted in operating losses and whose profitability is
unlikely to recover in the future were reduced to the recoverable amount. The
reduction has been recorded as “Loss on impairment of fixed assets” in the
amount of ¥901 million ($8,045 thousand) under extraordinary loss.
(c) Breakdown of loss on impairment of fixed assets
Type of assets Millions of yenThousands of
U.S. dollars
Land, etc. ¥520 $4,643
Buildings, structures, etc. 380 3,393
Total 901 8,045
(d) Method of determining recoverable value
The recoverable value is calculated based on the value in use or the net
sale value.
The value in use is calculated based on the discounted future cash flow,
using 4.0% as a discount rate. Further, the net sale value of assets is calculated
by rationally adjusting appraised value based on Japanese Real Estate
Appraisal Standards and other assessments. In addition, the net sale value of
assets for which discontinuation of operations or dismantlement has been
decided is assessed by using the memorandum value.
Hankyu Hanshin Holdings • Annual Report 2017 85

Notes to the Consolidated Financial Statements
7 Consolidated Statements of Comprehensive Income 1 Reclassification adjustments and tax effects related to other comprehensive income
Millions of yen Thousands of U.S. dollars
2016 2017 2017
Valuation difference on available-for-sale securities:
Increase (decrease) during the year ¥(4,997) ¥ 5,295 $ 47,277
Reclassification adjustments 5,069 (672) (6,000)
Subtotal, before tax 72 4,623 41,277
Tax (expense) or benefit 526 (1,410) (12,589)
Valuation difference on available-for-sale securities 598 3,213 28,688
Deferred gains or losses on hedges:
Increase (decrease) during the year (1,272) 2,124 18,964
Reclassification adjustments 72 — —
Subtotal, before tax (1,199) 2,124 18,964
Tax (expense) or benefit 413 (734) (6,554)
Deferred gains or losses on hedges (786) 1,390 12,411
Revaluation reserve for land:
Increase (decrease) during the year — — —
Reclassification adjustments — — —
Subtotal, before tax — — —
Tax (expense) or benefit 124 — —
Revaluation reserve for land 124 — —
Foreign currency translation adjustments:
Increase (decrease) during the year (855) (914) (8,161)
Reclassification adjustments — — —
Subtotal, before tax (855) (914) (8,161)
Tax (expense) or benefit — — —
Foreign currency translation adjustments (855) (914) (8,161)
Remeasurements of defined benefit plans:
Increase (decrease) during the year (8,528) 101 902
Reclassification adjustments (1,104) 1,242 11,089
Subtotal, before tax (9,633) 1,344 12,000
Tax (expense) or benefit 3,296 (442) (3,946)
Remeasurements of defined benefit plans (6,336) 901 8,045
Share of other comprehensive income of associates accounted for using equity method:
Increase (decrease) during the year (1,576) 1,762 15,732
Reclassification adjustments 1,125 61 545
Share of other comprehensive income of associates accounted for using equity method (451) 1,824 16,286
Total other comprehensive income (7,706) 6,414 57,268
8 Consolidated Statements of Changes in Net Assets 1 Items related to type and total number of shares issued and type and number of shares of treasury stockFiscal year ended 31st March 2016
(Thousands of shares)
No. of shares as of 1st April 2015 Increase in number of shares Decrease in number of shares No. of shares as of 31st March 2016
No. of shares issued:
Common stock 1,271,406 — — 1,271,406
Total 1,271,406 — — 1,271,406
Treasury stock, at cost:
Common stock (Notes 1 and 2) 10,663 4,846 42 15,466
Total 10,663 4,846 42 15,466
(Overview of reasons for fluctuations)Notes:1. The increase of 4,846 thousand shares of treasury stock was due to the purchase of 4,608 thousand shares of treasury stock based on a resolution of the Board of Directors and the purchase
of 238 thousand odd-lot shares.2. The decrease of 42 thousand shares of treasury stock was due to a decrease of 38 thousand shares due to the exercise of stock option rights and a decrease of 4 thousand shares due to
the sale of odd-lot shares.
Hankyu Hanshin Holdings • Annual Report 201786

Notes to the Consolidated Financial Statements
Fiscal year ended 31st March 2017
(Thousands of shares)
No. of shares as of 1st April 2016 Increase in number of shares Decrease in number of shares No. of shares as of 31st March 2017
No. of shares issued:
Common stock 1,271,406 — 1,017,125 254,281
Total 1,271,406 — 1,017,125 254,281
Treasury stock, at cost:
Common stock (Notes 1 and 2) 15,466 6,930 17,887 4,508
Total 15,466 6,930 17,887 4,508
(Overview of reasons for fluctuations)Notes:1. Hankyu Hanshin Holdings, Inc. consolidated shares at the ratio of 5 shares to 1 share with an effective date of 1st August 2016.2. The decrease of 1,017,125 thousand shares of common stock was due to a result of consolidation of shares.3. The increase of 6,930 thousand shares of treasury stock was due to the increase of 6,837 thousand shares of treasury stock by resolution of the Board of Directors (before consolidation of
shares: 6,826 thousand shares, after consolidation of shares: 11 thousand shares); the purchase of 73 thousand odd-lot shares (before consolidation of shares: 46 thousand shares, after consolidation of shares: 26 thousand shares); and an increase of 19 thousand shares (after consolidation of shares) due to the change of interest for equity-method affiliates.
4. The decrease of 17,887 thousand shares of treasury stock was due to a decrease of 17,807 thousand shares due to a result of consolidation of shares; a decrease of 78 thousand shares (after consolidation of shares) due to the exercise of stock option rights; and a decrease of 1 thousand shares (before consolidation of shares: 1 thousand shares, after consolidation of shares: 0 thousand shares) due to the sale of odd-lot shares.
2 Items related to subscription rights to sharesFiscal year ended 31st March 2016
Classification Breakdown of new share
subscription rights
Type of shares subject to share
subscription rights
Number of shares subject to share subscription rightsBalance as of 31st March 2016
(Millions of yen)As of 1st April 2015
Increase DecreaseAs of 31st
March 2016
The Company (Parent company)
Subscription rights as stock options
— — — — — ¥424
Total — — — — — 424
Fiscal year ended 31st March 2017
Classification Breakdown of new share
subscription rights
Type of shares subject to share
subscription rights
Number of shares subject to share subscription rights Balance as of 31st March 2017
As of 1st April 2016
Increase DecreaseAs of 31st
March 2017 (Millions of yen)
(Thousands of U.S. dollars)
The Company (Parent company)
Subscription rights as stock options
— — — — — ¥496 $4,429
Total — — — — — 496 4,429
3 Items related to dividendsFiscal year ended 31st March 2016
(a) Dividends paid
(Resolution) Type of sharesDividends paid (Millions of yen)
Dividend per share (Yen) Record date Effective date
16th June 2015General meeting of
shareholdersCommon stock ¥3,797 ¥ 3 31st March 2015 17th June 2015
30th October 2015 Board of Directors’
meetingCommon stock 4,430 3.5 30th September 2015 1st December 2015
(b) Dividends whose effective date falls in the fiscal year following the fiscal year of the record date
(Resolution) Type of sharesDividends paid (Millions of yen)
Source of dividendsDividend per share
(Yen)Record date Effective date
14th June 2016 General meeting of
shareholdersCommon stock ¥4,413 Retained earnings ¥3.5 31st March 2016 15th June 2016
Hankyu Hanshin Holdings • Annual Report 2017 87

Notes to the Consolidated Financial Statements
Fiscal year ended 31st March 2017
(a) Dividends paid
(Resolution) Type of sharesDividends paid Dividend per share
Record date Effective date(Millions of yen)
(Thousands of U.S. dollars)
(Yen) (U.S. dollars)
14th June 2016General meeting of
shareholders
Common stock
¥ 4,413 $39,402 ¥ 3.5 $0.03 31st March 2016 15th June 2016
27th October 2016 Board of Directors’
meeting
Common stock
4,389 39,188 17.5 0.16 30th September 2016 1st December 2016
Note: The Company consolidated shares at the ratio of 5 shares to 1 share. The lower figure (the portion approved by a resolution of the Board of Directors on 27th October 2016) is dividend per share after the consolidated shares. The upper figure (the portion approved by a resolution of the General Meeting of Shareholders on 14th June 2016) is the actual dividend amount before the consolidated shares.
(b) Dividends whose effective date falls in the fiscal year following the fiscal year of the record date
(Resolution) Type of sharesDividends paid
Source of dividendsDividend per share
Record date Effective date(Millions of yen)
(Thousands of U.S. dollars)
(Yen) (U.S. dollars)
13th June 2017 General meeting of
shareholders
Common stock
¥4,389 $39,188 Retained earnings ¥17.5 $0.16 31st March 2017 14th June 2017
9 Consolidated Statements of Cash Flows Relationship between cash and cash equivalents at fiscal year-end and amounts shown on consolidated balance sheets
Millions of yenThousands of
U.S. dollars
2016 2017 2017
Cash and deposits in the consolidated balance sheets ¥24,225 ¥24,255 $216,563
Deposits with maturities over 3 months (1,862) (1,725) (15,402)
C ash and cash equivalents in the cash flow statements 22,363 22,530 201,161
10 Lease Transactions <As lessee>
Future lease payments for non-cancellable leases in connection with operating lease transactions
Millions of yenThousands of
U.S. dollars
2016 2017 2017
Due within one year ¥ 4,211 ¥ 4,775 $ 42,634
Due after one year 10,341 22,048 196,857
Total 14,552 26,823 239,491
<As lessor>
Future lease receivables for non-cancellable leases in connection with operating lease transactions
Millions of yenThousands of
U.S. dollars
2016 2017 2017
Due within one year ¥ 606 ¥ 965 $ 8,616
Due after one year 5,853 10,096 90,143
Total 6,459 11,062 98,768
11 Financial Instruments 1 Matters regarding financial instruments(a) Policy on financial instruments
It is the Group’s policy to limit the investment of its funds to short-term
deposits which are highly secure, and the Group raises funds mainly
through loans from financial institutions, bonds and commercial paper.
Derivative transactions are used to avoid risk, as discussed later, and it is
our policy to refrain from speculative transactions.
(b) Details of the financial instruments used, the risk involved and the risk
management system
Trade receivables, namely note receivables and trade account receivables,
are exposed to the credit risk of customers. The Group limits its exposure
to this credit risk by controlling due dates and balances by customer and
by making periodical checks of the credit conditions of major customers
pursuant to the internal regulations of each company.
Investment securities consist mainly of stocks and bonds and are
exposed to market price fluctuation risk. However, fair values and the
financial condition of the issuers are checked periodically, and the risk
management system is confirmed.
Almost all trade payables, namely note payables and trade account
payables, have a payment date that falls within one year. Some assets and
liabilities denominated in foreign currencies are exposed to exchange rate
fluctuation risk (market risk), which is limited through forward exchange
contracts.
Short-term borrowings and commercial paper are used mainly to raise
short-term funds for working capital, and long-term debt and bonds are
used mainly to raise the long-term funds necessary for capital investment
plans. Some floating-rate debt is exposed to interest rate fluctuation risk
(market risk), which is limited by fixing interest rates through interest rate
swap transactions. In addition, liquidity risk—the risk that payment will
Hankyu Hanshin Holdings • Annual Report 201788

Notes to the Consolidated Financial Statements
not be made by the due date—is limited by the timely preparation
of financing plans and proper fund management. Also, surplus funds of
the Group companies are concentrated and used effectively through
centralisation of Group funds by using a cash management system. The
immediate raising of funds from financial institutions became possible
through the establishment of backup financing such as commitment
lines. In addition, the Company maintained a proper balance between
direct financing and indirect financing and diversifies the raising of funds
by using multiple financial institutions, thus securing liquidity.
Regarding the use of derivative transactions, internal regulations pre-
scribe the division of duties and transaction limits. Forward exchange
contracts are used to hedge exchange rate fluctuation risk involved in a
portion of foreign currency-denominated assets and liabilities. The
purpose of interest rate swap transactions is to hedge the interest rate
fluctuation risk of certain loans. These derivative transactions involve
credit risk because if the other party to a transaction defaults under the
terms of contract or becomes bankrupt then the benefit that would have
been obtained in the future if the transaction had continued will not be
received. However, credit risk is limited by carrying out transactions only
with financial institutions with high credit ratings.
More information regarding the means and objectives of hedging,
hedging policy and the method of evaluating the effectiveness of hedges
related to hedge accounting for derivative transactions is described in
“4 Accounting policies” “(f ) Significant hedge accounting methods” out-
lined in “ 2 Basis of Preparation of Consolidated Financial Statements.”
2 Matters regarding fair values of financial instrumentsBook value, fair value and the differences between them as of 31st March 2016 and 31st March 2017 are as shown below.
Millions of yen Thousands of U.S. dollars
2016 2017 2017
Book value Fair value Difference Book value Fair value Difference Book value Fair value Difference
Assets
(a) Cash and deposits ¥ 24,225 ¥ 24,225 ¥ — ¥ 24,255 ¥ 24,255 ¥ — $ 216,563 $ 216,563 $ —
(b) Trade receivables 73,141 73,141 — 83,492 83,492 — 745,464 745,464 —
(c) Investment securities 38,916 38,916 0 43,947 43,947 0 392,384 392,384 0
Liabilities
(d) Trade payables 37,480 37,480 — 40,086 40,086 — 357,911 357,911 —
(e) Short-term borrowings (*1) 135,322 135,322 — 134,676 134,676 — 1,202,464 1,202,464 —
(f ) Bonds (*2) 112,000 116,753 4,753 102,000 105,387 3,387 910,714 940,955 30,241
(g) Long-term debt (*1) 659,687 685,991 26,304 654,255 677,774 23,519 5,841,563 6,051,554 209,991
(h) Derivative transactions — (16,240) — — (10,950) — — (97,768) —
(*1) Current portion of long-term debt is included in (g) Long-term debt.(*2) Current portion of bonds is included.
Notes: 1. Method for calculating the fair values of financial instruments and matters regarding securities and derivative transactions (a) Cash and deposits, (b) Trade receivables The fair values of these are almost equal to their book values because they will be settled within a short period of time. As a result, their fair values are based on their book values.
(c) Investment securities The fair values of investment securities are based on prices quoted by stock exchanges, and the fair values of bonds are based on prices quoted by stock exchanges or prices presented
by trading financial institutions. Securities categorised by the purpose for which they are held are described in “ 12 Securities.”
(d) Trade payables, (e) Short-term borrowings The fair values of these are almost equal to their book values because they will be settled within a short period of time. As a result, their fair values are based on their book values.
(f ) Bonds The fair values of bonds are based on market prices.
(g) Long-term debt The fair value of fixed-rate long-term debt is based on a method of calculation whereby the total principal and interest is discounted at an interest rate that is assumed for the introduc-
tion of similar new debt. The fair value of floating-rate long-term debt is based on the book value because the fair value of floating-rate long-term debt reflects market interest rates within a short period of time and closely approximates the book values.
(h) Derivative transactions Please see “ 13 Derivatives.”
2. The book value of financial instruments whose fair value is extremely difficult to ascertain
Millions of yenThousands of
U.S. dollars
Classification 2016 2017 2017
Non-listed equity securities and bonds ¥5,823 ¥5,810 $51,875
Investments in limited liability investment partnerships and
similar investments3,682 3,735 33,348
Negotiable certificates of deposit 2,543 534 4,768
It is extremely difficult to ascertain the fair value of these financial instruments because market prices are not available and future cash flows cannot be estimated. As a result, they are not included in (c) Investment securities.
Hankyu Hanshin Holdings • Annual Report 2017 89

Notes to the Consolidated Financial Statements
3. The securities of nonconsolidated subsidiaries and affiliated companies are not included in (c) Investment securities.
4. Supplementary explanation regarding fair value of financial instruments The fair value of financial instruments is based on market price. If market prices are not available, the fair value of financial instruments is reasonably calculated. Certain assumptions are used to calculate the value. As a result, if different assumptions are used, the values may differ. For derivative contracts, the amount of the contract which is indicated in “ 13 Derivatives” does not indicate the market risk involved in derivative transactions themselves.
5. Redemption and repayment schedule of monetary claims and investment securities with maturities
Fiscal year ended 31st March 2016
Millions of yen
Due within one year
Due after one year through five years
Due after five years through ten years
Due after ten years
Cash and deposits ¥ 24,225 ¥ — ¥ — ¥ —
Trade receivables 73,141 — — —
Investment securities:
Held-to-maturity debt securities (government bonds, etc.)
— 9 — —
Available-for-sale securities with maturities (government bonds, etc.)
10 237 242 300
Total 97,376 247 242 300
Fiscal year ended 31st March 2017
Millions of yen Thousands of U.S. dollars
Due within one year
Due after one year through five years
Due after five years through ten years
Due after ten years
Due within one year
Due after one year through five years
Due after five years through ten years
Due after ten years
Cash and deposits ¥ 24,255 ¥ — ¥ — ¥ — $216,563 $ — $ — $ —
Trade receivables 83,492 — — — 745,464 — — —
Investment securities:
Held-to-maturity debt securities (government bonds, etc.)
— 9 — — — 80 — —
Available-for-sale securities with maturities (government bonds, etc.)
26 281 165 300 232 2,509 1,473 2,679
Total 107,755 291 165 300 962,098 2,598 1,473 2,679
6. Amount of planned redemption and repayment of bonds and long-term debt after the consolidated closing date
Fiscal year ended 31st March 2016
Millions of yen
Due within one year
Due after one year through five years
Due after five years through ten years
Due after ten years
Bonds ¥ 30,000 ¥ 55,000 ¥ 17,000 ¥ 10,000
Long-term debt 70,586 151,945 255,164 181,990
Total 100,586 206,945 272,164 191,990
Fiscal year ended 31st March 2017
Millions of yen Thousands of U.S. dollars
Due within one year
Due after one year through five years
Due after five years through ten years
Due after ten years
Due within one year
Due after one year through five years
Due after five years through ten years
Due after ten years
Bonds ¥10,000 ¥ 55,000 ¥ 17,000 ¥ 20,000 $ 89,286 $ 491,071 $ 151,786 $ 178,571
Long-term debt 43,732 153,047 292,859 164,616 390,464 1,366,491 2,614,813 1,469,786
Total 53,732 208,047 309,859 184,616 479,750 1,857,563 2,766,598 1,648,357
Hankyu Hanshin Holdings • Annual Report 201790

Notes to the Consolidated Financial Statements
12 Securities 1 Held-to-maturity debt securities
Millions of yen Thousands of U.S. dollars
2016 2017 2017
Classification Book value Fair value Difference Book value Fair value Difference Book value Fair value Difference
Securities with fair value exceeding book value
¥9 ¥10 ¥0 ¥9 ¥10 ¥0 $80 $89 $0
2 Available-for-sale securitiesMillions of yen Thousands of U.S. dollars
2016 2017 2017
ClassificationBook value
Acquisition cost
Difference Book valueAcquisition
cost Difference Book value
Acquisition cost
Difference
Securities with book value exceeding
acquisition cost
(a) Equity securities ¥31,140 ¥19,089 ¥12,051 ¥39,641 ¥23,291 ¥16,350 $353,938 $207,955 $145,982
(b) Bonds 490 464 25 473 454 18 4,223 4,054 161
Subtotal 31,630 19,554 12,076 40,114 23,746 16,368 358,161 212,018 146,143
Securities with book value not exceed-
ing acquisition cost
(a) Equity securities 7,275 8,420 (1,144) 3,822 4,634 (811) 34,125 41,375 (7,241)
(b) Bonds — — — — — — — — —
Subtotal 7,275 8,420 (1,144) 3,822 4,634 (811) 34,125 41,375 (7,241)
Total 38,906 27,974 10,931 43,937 28,380 15,556 392,295 253,393 138,893
Note: Unlisted equity securities and others (fiscal year ended 31st March 2016: ¥12,049 million, fiscal year ended 31st March 2017: ¥10,080 million ($90,000 thousand)) are not included in the above table due to the fact that establishing their fair values is extremely difficult because they do not have market values, and estimating future cash flows is not possible.
3 Available-for-sale securities sold during fiscal years ended 31st March 2016 and 31st March 2017Fiscal year ended 31st March 2016
Omitted as the significance was negligible.
Fiscal year ended 31st March 2017
Millions of yen Thousands of U.S. dollars
ClassificationAmount sold
Total gains on sale
Total losses on sale
Amount soldTotal gains
on saleTotal losses
on sale
Equity securities ¥1,452 ¥828 ¥2 $12,964 $7,393 $18
4 Impairment of securitiesFiscal year ended 31st March 2016
Impairment loss on investment securities (other securities) of ¥4,979 million was recognised.
Fiscal year ended 31st March 2017
Omitted as the significance was negligible.
Hankyu Hanshin Holdings • Annual Report 2017 91

Notes to the Consolidated Financial Statements
13 Derivatives 1 Derivative transactions for which hedge accounting has not been applied(a) Currency
Fiscal year ended 31st March 2016
Millions of yen
Classification Type
Contract amount
Portion of contract amount exceeding
one year
Fair value (Note)
Transactions other than market
transactions
Forward exchange contracts:
Buy contract
U.S. dollar ¥1,846 ¥ — ¥ 2
Currency swap contracts:
Receive yen, pay U.S. dollars 598 598 (47)
Total 2,444 598 (45)
Fiscal year ended 31st March 2017
Millions of yen Thousands of U.S. dollars
Classification Type
Contract amount
Portion of contract amount exceeding
one year
Fair value (Note)
Contract amount
Portion of contract amount exceeding
one year
Fair value (Note)
Transactions other than market
transactions
Forward exchange contracts:
Buy contract
Euro ¥ 76 ¥ — ¥ (3) $ 679 $ — $ (27)
Australian dollar 26 — 1 232 — 9
Canadian dollar 8 — (0) 71 — (0)
New Zealand dollar 7 — 0 63 — 0
Currency swap contracts:
Receive yen, pay U.S. dollars 598 598 (50) 5,339 5,339 (446)
Receive yen, pay Thai baht 495 — (5) 4,420 — (45)
Total 1,211 598 (58) 10,813 5,339 (518)
Notes:1. Fair value calculation Fair value is based mainly on prices quoted from counterparty financial institutions.2. Regarding the above currency swap contracts, in nonconsolidated financial statements hedge accounting is applied for monetary payables and receivables related to transactions
between consolidated subsidiaries. In consolidated financial statements, however, hedge accounting is not applied because the said hedged items are eliminated.
Hankyu Hanshin Holdings • Annual Report 201792

Notes to the Consolidated Financial Statements
2 Derivative transactions for which hedge accounting has been applied(a) Currency
Fiscal year ended 31st March 2016
Millions of yen
Classification TypeMain hedged
items
Contract amount
Portion of contract amount exceeding
one year
Fair value (Note)
Designation of forward
exchange contracts, etc.
Forward exchange contracts:
Sell contractTrade receivables
U.S. dollar ¥ 194 ¥ — ¥ 1 Japanese yen 8 — 0
Buy contractTrade payables
Euro 13,525 — (564) U.S. dollar 8,476 — (543) Pound sterling 17 — 0 Swiss franc 1,726 — (87) Canadian dollar 1,201 — (65) New Zealand dollar 220 — (12) Australian dollar 291 — (1) Hong Kong dollar 77 — (0) Singapore dollar 3,330 — (170) Thai baht 79 — (0) Japanese yen 1,227 — 5
Total 30,378 — (1,438)
Fiscal year ended 31st March 2017
Millions of yen Thousands of U.S. dollars
Classification TypeMain hedged
items
Contract amount
Portion of contract amount exceeding
one year
Fair value (Note)
Contract amount
Portion of contract amount exceeding
one year
Fair value (Note)
Primary method
Forward exchange contracts:
Sell contractTrade receivables
U.S. dollar ¥ 15 ¥ — ¥ 0 $ 134 $ — $ 0 Japanese yen 10 — 0 89 — 0
Buy contractTrade payables
Euro 0 — (0) 0 — (0) U.S. dollar 8 — (0) 71 — (0) Singapore dollar 0 — (0) 0 — (0) Thai baht 0 — (0) 0 — (0) Japanese yen 553 — (18) 4,938 — (161)
Designation of forward
exchange contracts, etc.
Forward exchange contracts:
Sell contractTrade receivables
U.S. dollar 47 — 0 420 — 0
Buy contractTrade payables
Euro 8,446 — 231 75,411 — 2,063 U.S. dollar 6,550 294 327 58,482 2,625 2,920 Pound sterling 302 — 25 2,696 — 223 Swiss franc 846 — 43 7,554 — 384 Canadian dollar 854 — 66 7,625 — 589 New Zealand dollar 250 — 14 2,232 — 125 Australian dollar 463 — 37 4,134 — 330 Hong Kong dollar 94 — (0) 839 — (0) Singapore dollar 351 — 20 3,134 — 179 Thai baht 68 — 0 607 — 0 Total 18,865 294 748 168,438 2,625 6,679
Note: Fair value calculation Fair value is based mainly on prices quoted from counterparty financial institutions.
Hankyu Hanshin Holdings • Annual Report 2017 93

Notes to the Consolidated Financial Statements
14 Retirement Benefits 1 Overview of retirement benefit plansSome consolidated subsidiaries of the Company provide a defined benefit
plan (defined benefit pension plan and lump-sum payment plan) or a defined
contribution plan. Hankyu Corporation has also established a retirement
benefits trust.
In addition, some consolidated subsidiaries subscribe to the employees’
pension funds plan in the multi-employer plan. Among them, the Company
has used the same accounting treatment as it used for defined contribution
plans when the amount of plan assets corresponding to contributions by the
Company cannot be rationally calculated.
2 Defined benefit plan(a) Movement in retirement benefit obligations
Millions of yenThousands of
U.S. dollars
2016 2017 2017
Balance at beginning of the year
¥125,490 ¥133,174 $1,189,054
Service cost 7,231 7,869 70,259
Interest cost 1,046 293 2,616
Actuarial loss (gain) 7,607 (110) (982)
Retirement benefits paid (8,300) (8,602) (76,804)
Loss (gain) in prior service cost
3 — —
Other 95 (152) (1,357)
Balance at end of the year 133,174 132,471 1,182,777
Note: Amounts in the table above include the retirement benefit obligations of consoli-dated subsidiaries using simplified methods.
(b) Movements in plan assets
Millions of yenThousands of
U.S. dollars
2016 2017 2017
Balance at beginning of the year
¥77,249 ¥77,281 $690,009
Expected return on plan assets
929 1,072 9,571
Actuarial loss (gain) (917) (8) (71)
Contribution paid by the employer
4,802 4,751 42,420
Retirement benefits paid (4,783) (4,841) (43,223)
Other (0) (48) (429)
Balance at end of the year 77,281 78,206 698,268
Note: Amounts in the table above include the plan assets of consolidated subsidiaries using simplified methods.
(c) On 31st March 2016 and 31st March 2017, reconciliation from retirement
benefit obligations and plan assets to net defined benefit liability (asset)
recorded in the consolidated balance sheets
Millions of yenThousands of
U.S. dollars
2016 2017 2017
Funded retirement benefit obligations
¥ 71,030 ¥ 73,063 $ 652,348
Plan assets (77,281) (78,206) (698,268)
(6,251) (5,142) (45,911)
Unfunded retirement benefit obligations
62,143 59,407 530,420
Total net defined benefit liability and asset
55,892 54,264 484,500
Net defined benefit liability
61,839 61,459 548,741
Net defined benefit asset (5,947) (7,194) (64,232)
Total net defined benefit liability and asset
55,892 54,264 484,500
Note: Amounts in the table above include the retirement benefit obligations and plan assets of consolidated subsidiaries using simplified methods.
(b) Interest rate
Fiscal year ended 31st March 2016
Millions of yen
Classification TypeMain hedged
items
Contract amount
Portion of contract amount exceeding
one year
Fair value (Note)
Exceptional accounting of
interest rate swaps
Interest rate swap contracts: Pay fixed rate/
Receive floating rate
Long-term debt
¥222,592 ¥201,188 ¥(14,757)
Total 222,592 201,188 (14,757)
Fiscal year ended 31st March 2017
Millions of yen Thousands of U.S. dollars
Classification TypeMain hedged
items
Contract amount
Portion of contract amount exceeding
one year
Fair value (Note)
Contract amount
Portion of contract amount exceeding
one year
Fair value (Note)
Exceptional accounting of
interest rate swaps
Interest rate swap contracts: Pay fixed rate/
Receive floating rate
Long-term debt
¥188,909 ¥183,909 ¥(11,641) $1,686,688 $1,642,045 $(103,938)
Total 188,909 183,909 (11,641) 1,686,688 1,642,045 (103,938)
Note: Fair value calculation Fair value is based mainly on prices quoted from counterparty financial institutions.
Hankyu Hanshin Holdings • Annual Report 201794

Notes to the Consolidated Financial Statements
(d) The breakdown of retirement benefit expenses
Millions of yenThousands of
U.S. dollars
2016 2017 2017
Service cost ¥7,231 ¥ 7,869 $70,259
Interest cost 1,046 293 2,616
Expected return on plan assets
(929) (1,072) (9,571)
Amortisation of actuarial differences
(192) 1,500 13,393
Amortisation of prior service cost
(912) (258) (2,304)
Other 76 65 580
Retirement benefit expenses
6,319 8,398 74,982
Notes:1. Amounts in the table above include the retirement benefit expenses of consolidated
subsidiaries using simplified methods.2. In addition to the retirement benefit expenses shown above, the Company made extra
retirement payments of ¥9 million in the fiscal year ended 31st March 2016, which it recorded in costs of revenues from operations, and ¥75 million ($670 thousand) in the fiscal year ended 31st March 2017, which it recorded in costs of revenues from opera-tions and extraordinary loss.
(e) Remeasurements of defined benefit plans
The breakdown of items related to remeasurements of defined benefit
plans (prior to the deduction of the tax effect) is as follows:
Millions of yenThousands of
U.S. dollars
2016 2017 2017
Prior service cost ¥ (916) ¥ (258) $ (2,304)
Actuarial differences (8,717) 1,602 14,304
Total (9,633) 1,344 12,000
(f ) Cumulative adjustments of retirement benefit plans
The breakdown of items related to cumulative adjustments of retirement
benefit plans (prior to the deduction of the tax effect) is as follows:
Millions of yenThousands of
U.S. dollars
2016 2017 2017
Unrecognised prior service cost
¥ (618) ¥ (360) $ (3,214)
Unrecognised actuarial differences
4,311 2,708 24,179
Total 3,692 2,348 20,964
Note: The above relates to consolidated subsidiaries. In addition to the above items, the remeasurements of defined benefit plans include unrecognised items (the amount corresponding to equity) of equity-method affiliates.
(g) Items related to plan assets
I. Breakdown of major plan assets
The ratios of the major types of assets to total plan assets were as follows:2016 2017
Bonds 35% 35%
Equity securities 33 32
Cash and deposits 3 2
General accounts of life insurance
28 29
Other 1 2
Total 100 100
Note: The retirement benefits trust established for the Company’s pension plan con-stituted 10% of total plan assets in the previous fiscal year and 9% of total plan assets in the current fiscal year.
II. Method of determining the long-term expected rate of return on plan
assets
Current and target asset allocations and historical and expected returns
on various categories of plan assets have been considered in determining
the long-term expected rate of return on plan assets.
(h) Items related to actuarial assumptions
The major actuarial assumptions on 31st March 2016 and 31st March 20172016 2017
Discount rate Mainly 0.0% Mainly 0.0%
Long-term expected rate of return on plan assets
Mainly 2.0% Mainly 2.0%
Expected rate of salary increase Mainly 2.5% Mainly 2.5%
3 Defined contribution planThe required contribution for the consolidated subsidiaries’ defined contribu-
tion plan (including employees’ pension funds plan in the multi-employer
plan to which the same accounting method is applied as for the defined
contribution plan) was ¥49 million for the fiscal year ended 31st March 2016
and ¥60 million ($536 thousand) for the fiscal year ended 31st March 2017.
Hankyu Hanshin Holdings • Annual Report 2017 95

Notes to the Consolidated Financial Statements
15 Stock Options, etc. 1 Cost amount and account associated with stock options
Millions of yenThousands of
U.S. dollars
2016 2017 2017
Operating expenses and cost of sales of
transportation and cost of sales
¥124 ¥113 $1,009
2 Details and size of stock options and changes therein(a) Details of stock options
Resolution date 16th June 2011Classification and number of eligible persons
10 directors of subsidiaries
Class and number of shares (Note 1)20,800 shares of common stock (Note 2)
Grant date 25th July 2011Vesting conditions Not definedService period Not defined
Exercise periodFrom 26th July 2011 to 25th July 2041
Resolution date 29th March 2012Classification and number of eligible persons
11 directors of subsidiaries
Class and number of shares (Note 1)22,400 shares of common stock (Note 2)
Grant date 25th April 2012Vesting conditions Not definedService period Not defined
Exercise periodFrom 26th April 2012 to 25th April 2042
Resolution date 14th June 2012Classification and number of eligible persons
8 directors of subsidiaries
Class and number of shares (Note 1)20,400 shares of common stock (Note 2)
Grant date 25th July 2012Vesting conditions Not definedService period Not defined
Exercise periodFrom 26th July 2012 to 25th July 2042
Resolution date 29th March 2013Classification and number of eligible persons
18 directors of subsidiaries
Class and number of shares (Note 1)38,400 shares of common stock (Note 2)
Grant date 25th April 2013Vesting conditions Not defined
Service period Not defined
Exercise periodFrom 26th April 2013 to 25th April 2043
Resolution date 27th March 2014Classification and number of eligible persons
20 directors of subsidiaries
Class and number of shares (Note 1)40,600 shares of common stock (Note 2)
Grant date 25th April 2014Vesting conditions Not defined
Service period Not defined
Exercise periodFrom 26th April 2014 to 25th April 2044
Resolution date 27th March 2015Classification and number of eligible persons
22 directors of subsidiaries
Class and number of shares (Note 1)34,800 shares of common stock (Note 2)
Grant date 24th April 2015Vesting conditions Not defined
Service period Not defined
Exercise periodFrom 25th April 2015 to 24th April 2045
Resolution date 25th March 2016Classification and number of eligible persons
21 directors of subsidiaries
Class and number of shares (Note 1)30,600 shares of common stock (Note 2)
Grant date 25th April 2016Vesting conditions Not defined
Service period Not defined
Exercise periodFrom 26th April 2016 to 25th April 2046
Resolution date 14th June 2016Classification and number of eligible persons
1 director of subsidiary
Class and number of shares (Note 1)1,600 shares of common stock (Note 2)
Grant date 25th July 2016Vesting conditions Not defined
Service period Not defined
Exercise periodFrom 26th July 2016 to 25th July 2046
Notes: 1. Indicated in the equivalent number of shares.2. Adjustments have been made to consolidate shares at the ratio of 5 shares to 1 share
with an effective date of 1st August 2016.
Hankyu Hanshin Holdings • Annual Report 201796

Notes to the Consolidated Financial Statements
b) Size of stock options and changes therein
The covered stock options are those which existed during the fiscal year
ended 31st March 2017, the number of which is indicated in the equivalent
number of shares.
Further, the figures below have been adjusted to consolidate shares at the
ratio of 5 shares to 1 share with an effective date of 1st August 2016.
I. Number of stock options
Resolution date 16th June 2011
29th March 2012
14th June 2012
29th March 2013
Before vested (shares)
At the end of the previous fiscal year — — — —
Granted — — — —
Expired — — — —
Vested — — — —
Unvested — — — —
After vested (shares)
At the end of the previous fiscal year 14,400 16,000 17,600 35,800
Vested — — — —
Exercised — 1,600 4,000 4,800
Expired — — — —
Unexercised 14,400 14,400 13,600 31,000
Resolution date 27th March 2014
27th March 2015
25th March 2016
14th June 2016
Before vested (shares)
At the end of the previous fiscal year — — — —
Granted — — 30,600 1,600
Expired — — — —
Vested — — 30,600 1,600
Unvested — — — —
After vested (shares)
At the end of the previous fiscal year 38,400 34,800 — —
Vested — — 30,600 1,600
Exercised 2,800 2,400 — —
Expired — — — —
Unexercised 35,600 32,400 30,600 1,600
II. Unit price information
Resolution date 16th June 2011
29th March 2012
14th June 2012
29th March 2013
Exercise price ¥1 ¥1 ¥1 ¥1
Average stock price at exercise ¥— ¥3,500 ¥3,500 ¥3,500
Fair value unit price at the grant date ¥1,555 ¥1,805 ¥1,935 ¥3,075
Resolution date 27th March 2014
27th March 2015
25th March 2016
14th June 2016
Exercise price ¥1 ¥1¥1
[US$0.01]¥1
[US$0.01]
Average stock price at exercise
¥3,500 ¥3,500¥—
[US$—]¥—
[US$—]
Fair value unit price at the grant date
¥2,075 ¥3,590¥3,525
[US$31.47]¥3,685
[US$32.90]
3 Estimation method for fair value unit price of stock optionsThe following method was applied to fairly valuate the unit price of stock
options granted during the fiscal year ended 31st March 2017.
(a) Valuation method used: Black–Scholes model
(b) Major basic data and estimation method
Resolution date 25th March 2016Volatility of stock price (Note 1) 23.64%Expected life (Note 2) 2.838 yearsExpected dividends (Note 3) ¥35 [US$0.31] / ShareRisk-free interest rate (Note 4) (0.284)%
Notes:1. Volatility of stock price is based on the closing prices in regular transactions for the
Company’s common stock on individual transaction dates during the period of 2.838 years (from 23rd June 2013 to 25th April 2016).
2. Expected life is based on the actual length of service of eligible directors of subsidiaries who had resigned in the past, and on the actual length of service of eligible persons as of the grant date.
3. Expected dividends are based on expected dividends in the fiscal year ended 31st March 2016 that have been adjusted to consolidate shares at the ratio of 5 shares to 1 share with an effective date of 1st August 2016.
4. Risk-free interest rate is the yield of government bonds for the period corresponding to the expected life.
Resolution date 14th June 2016Volatility of stock price (Note 1) 22.83%Expected life (Note 2) 5.320 yearsExpected dividends (Note 3) ¥35 [US$0.31] / ShareRisk-free interest rate (Note 4) (0.341)%
Notes:1. Volatility of stock price is based on the closing prices in regular transactions for the
Company’s common stock on individual transaction dates during the period of 5.320 years (from 31st March 2011 to 25th July 2016).
2. Expected life is based on the actual length of service of eligible directors of subsidiaries who resigned in the past, and on the actual length of service of eligible persons as of the grant date.
3. Expected dividends are based on actual dividends paid in the fiscal year ended 31st March 2016 that have been adjusted to consolidate shares at the ratio of 5 shares to 1 share with an effective date of 1st August 2016.
4. Risk-free interest rate is the yield of government bonds for the period corresponding to the expected life.
4 Estimation method for the number of vested stock optionsSince the stock options were vested on the grant date, vested and granted
stock options are the same in number.
Hankyu Hanshin Holdings • Annual Report 2017 97

Notes to the Consolidated Financial Statements
17 Asset Retirement Obligations Omitted as the significance was negligible.
16 Deferred Tax 1 Significant components of the Company’s deferred tax assets
and liabilities
Millions of yenThousands of
U.S. dollars
2016 2017 2017
Deferred tax assets:
Loss on revaluation of real estate for sale
¥ 24,497 ¥ 24,844 $ 221,821
Net defined benefit liability 18,335 17,762 158,589
Tax loss carryforwards 16,482 14,661 130,902
Loss on impairment of fixed assets
10,695 9,268 82,750
Unrealised profit from assets 4,658 4,376 39,071
Loss on adjustment of transferred profit and loss
5,451 2,669 23,830
Provision for bonuses 1,979 1,872 16,714
Enterprise taxes and business office taxes
937 1,279 11,420
Losses on revaluation of investment securities
1,475 1,147 10,241
Other 11,751 10,747 95,955
Subtotal of deferred tax assets 96,264 88,630 791,339
Valuation allowance (42,500) (23,631) (210,991)
Less amounts offset against deferred tax liabilities
(43,012) (53,807) (480,420)
Total deferred tax assets 10,750 11,191 99,920
Deferred tax liabilities:
Gain on reversal of difference from land revaluation
(131,091) (130,694) (1,166,911)
Revaluation of assets on consolidation
(79,928) (79,481) (709,652)
Net unrealised holding gains on securities
(13,776) (15,170) (135,446)
Gain on valuation of properties of business reorganisation
(1,858) (1,826) (16,304)
Other (6,181) (6,166) (55,054)
Subtotal of deferred tax liabilities (232,836) (233,340) (2,083,393)
Less amounts offset against deferred tax assets
43,012 53,807 480,420
Total deferred tax liabilities (189,823) (179,532) (1,602,964)
Net deferred tax liabilities (179,073) (168,341) (1,503,045)
Note: The Company reversed “Surplus from land revaluation” when, as a result of a (physi-cal) absorption-type corporate split on 1st April 2005, it handed over all of its land to Hankyu Corporation (which changed its name from Hankyu Corporation Spin-Off Preparation Inc. to Hankyu Corporation on the same day). As a result, “Deferred tax liabilities related to land revaluation” has been recorded as “Deferred tax liabilities” starting from the fiscal year ended 31st March 2006.
2 A reconciliation of the significant differences between the statutory tax rate and the effective tax rate reflected in the accompanying consolidated statements of income
2016 2017
Statutory tax rate 33.0% 30.8%
(Adjustment)
Elimination of dividends from consolidated subsidiaries
11.2 16.5
Amortisation of goodwill 0.9 0.7
Per capita amount of inhabitants’ tax 0.4 0.4
Nondeductible expenses 0.4 0.4
Nontaxable income (11.1) (16.4)
Equity in (income) losses of affiliates (2.0) (2.6)
Valuation allowance (0.4) (3.9)
Other (6.9) 1.8
Effective tax rate 25.5 27.7
3 Amendments to the amount of deferred tax assets and liabilities due to changes to the effective tax rate
The “Act to Partially Revise the Act on Partial Revision to the Consumption Tax
Act for the Drastic Reform of the Taxation System for Ensuring Stable Financial
Resources for Social Security” (Act No. 85 of 2016) and the “Act to Partially
Revise the Act on Partial Revision to the Local Tax Act and Local Allocation Tax
Act for the Drastic Reform of the Taxation System for Ensuring Stable Financial
Resources for Social Security” (Act No. 86 of 2016) were enacted on 18th
November 2016, and a rise in the consumption tax rate to 10% was postponed
from 1st April 2017 to 1st October 2019.
As a result, the abolition of special local corporation tax and the
accompanying restoration of enterprise tax on corporations, the revision of
the local corporation tax rate, and the revision of the corporate residential tax
rate were also postponed from fiscal years beginning on or after 1st April 2017
to fiscal years beginning on or after 1st October 2019.
The statutory tax rate used to calculate deferred tax assets and liabilities
has not changed. However, tax rate classification between national and local
taxes has changed.
The effect of this tax rate change on the consolidated financial statements
is immaterial.
Hankyu Hanshin Holdings • Annual Report 201798
Notes to the Consolidated Financial Statements
18 Rental Property Some consolidated subsidiaries own rental property, such as office buildings
for lease and commercial facilities for lease in the Kita Ward of Osaka and other
areas. Rental income related to such rental property in the fiscal year ended
31st March 2016 was ¥30,194 million (significant rental revenues are recorded
in revenues from operations and significant rental expenses are recorded
in costs of revenues from operations). Rental income related to such rental
properties in the fiscal year ended 31st March 2017 was ¥30,911 million
($275,991 thousand) (significant rental revenues are recorded in revenues
from operations and significant rental expenses are recorded in costs of reve-
nues from operations).
Book value, increase/decrease and fair value were as follows:
Millions of yenThousands of
U.S. dollars
2016 2017 2017
Book value (Note 1):
Balance at beginning of the year
¥625,822 ¥623,357 $5,565,688
Increase/decrease (Note 2) (2,465) (6,875) (61,384)
Balance at end of the year 623,357 616,481 5,504,295
Fair value at end of the year (Note 3)
805,355 811,096 7,241,929
Notes:1. Book value is acquisition cost less accumulated depreciation.2. For changes in amounts in the fiscal year ended 31st March 2016, the main increase
was acquisitions of real estate of ¥17,796 million. The main decreases were depreciation of ¥13,159 million, sales of real estate of ¥3,564 million and changes in reason for own-ership from rental property, etc., to property for the Company’s use of ¥3,127 million. For changes in amounts in the fiscal year ended 31st March 2017, the main increase was acquisitions of real estate of ¥12,017 million ($107,295 thousand). The main decreases were depreciation of ¥12,634 million ($112,804 thousand) and exclusion of properties for which development began of ¥6,281 million ($56,080 thousand).
3. Fair value as of the end of the fiscal year is the appraisal value according to an outside real estate appraiser based on Japanese Real Estate Appraisal Standards in the case of key properties and the fair value based on indicators such as the assessed value of noncurrent assets and road tax rating in the case of other properties.
4. Property under development has not been included in the above table because of the difficulty of ascertaining the market value of property that is in the process of develop-ment. Furthermore, property under development recognised in the consolidated balance sheets for the fiscal year ended 31st March 2016 and for the fiscal year ended 31st March 2017 were ¥90,367 million and ¥121,942 million ($1,088,768 thousand), respectively.
19 Segment Information 1 Segment information(a) Summary of reportable segments
The Company’s reportable segments are regularly reviewed using the segment-specific financial information available to enable the Board of Directors to
determine the allocation of management resources and evaluate business results.
The Group comprises six core businesses: “Urban Transportation,” “Real Estate,” “Entertainment and Communications,” “Travel,” “International Transportation”
and “Hotels.” The businesses are operated by five core companies: Hankyu Corporation, Hanshin Electric Railway Co., Ltd., Hankyu Travel International Co., Ltd.,
Hankyu Hanshin Express Co., Ltd. and Hankyu Hanshin Hotels Co., Ltd., under the leadership of the Company, which manages the Group.
The nature of business in each reportable segment is as follows:
Urban Transportation: Railway operations, automobile, retailing and advertising businesses
Real Estate: Rental real estate, real estate sales and other businesses
Entertainment and Communications: Sports-related businesses, stage events, communications and media, and other businesses
Travel: Travel services
International Transportation: International cargo services
Hotels: Hotel ownership and management business
(b) Method used to calculate revenues from operations, income (loss), assets and other items for each reportable segment
The accounting treatment for each reportable business segment is based on the methods described in “ 2 Basis of Preparation of Consolidated Financial
Statements,” and internal transactions (land and structure leases and rental transactions, etc.) that are calculated through management accounting at compa-
nies with businesses spanning multiple segments are included and recorded.
Income (loss) for each reportable segment refers to operating income (loss).
Intersegment revenues from operations and transfers are based mainly on similar data as those of general transaction conditions.
(c) Change in recognition of revenues from operations
As stated in “ 3 Changes in Accounting Policies,” in the International Transportation Business the recognition of revenues from operations has been changed. As
a result of applying the said change in accounting policy retroactively, for the fiscal year ended 31st March 2016 revenues from operations of the International
Transportation segment increased ¥39,433 million compared to the amount for this line item before retroactive application. However, segment income of the
International Transportation was unaffected.
Hankyu Hanshin Holdings • Annual Report 2017 99

Notes to the Consolidated Financial Statements
(d) Information regarding totals for revenues from operations, income (loss), assets and other items by reportable segment
Fiscal year ended 31st March 2016
Millions of yen
Reportable segment
Other (Note 1) Total Adjustment
(Note 2)
Amounts appearing in
the consolidated financial
statements (Note 3)
Urban Transportation Real Estate
Entertainment and
Communications Travel International
Transportation Hotels Subtotal
Revenues from operations:
I. Customers ¥234,410 ¥ 203,413 ¥105,351 ¥30,492 ¥76,083 ¥67,304 ¥ 717,056 ¥29,209 ¥ 746,265 ¥ 527 ¥ 746,792
II. Intersegment 5,133 17,509 7,138 9 8 737 30,538 9,649 40,188 (40,188) —
Total 239,544 220,923 112,490 30,502 76,092 68,042 747,594 38,859 786,453 (39,660) 746,792
Segment income (loss) 41,270 49,851 15,301 680 1,788 3,298 112,191 967 113,159 (2,866) 110,293
Segment assets 794,261 1,022,570 142,705 65,239 39,899 82,754 2,147,431 35,849 2,183,280 98,899 2,282,180
Other items:
Depreciation and amortisation 25,691 17,916 6,656 773 730 1,838 53,607 537 54,144 (443) 53,701
Increase in property and equipment and
intangible assets27,977 28,287 5,919 507 1,049 2,233 65,974 717 66,691 (52) 66,639
Fiscal year ended 31st March 2017
Millions of yen
Reportable segment
Other (Note 1) Total Adjustment
(Note 2)
Amounts appearing in
the consolidated financial
statements (Note 3)
Urban Transportation Real Estate
Entertainment and
Communications Travel International
Transportation Hotels Subtotal
Revenues from operations:
I. Customers ¥232,306 ¥ 198,663 ¥107,162 ¥29,926 ¥71,631 ¥64,358 ¥ 704,048 ¥32,284 ¥ 736,332 ¥ 430 ¥ 736,763II. Intersegment 4,830 17,046 8,031 12 38 1,281 31,240 10,362 41,603 (41,603) —
Total 237,136 215,709 115,193 29,938 71,670 65,640 735,288 42,646 777,935 (41,172) 736,763Segment income (loss) 42,237 41,970 15,655 637 1,587 2,795 104,885 1,340 106,225 (2,167) 104,058Segment assets 802,238 1,056,719 147,307 73,938 38,658 82,562 2,201,424 34,144 2,235,569 114,261 2,349,831Other items:
Depreciation and amortisation 25,919 16,800 6,729 726 680 1,877 52,734 546 53,280 (480) 52,800
Increase in property and equipment and
intangible assets31,158 43,144 7,388 528 384 3,182 85,787 618 86,406 (193) 86,212
Thousands of U.S. dollars
Reportable segment
Other (Note 1) Total Adjustment
(Note 2)
Amounts appearing in
the consolidated financial
statements (Note 3)
Urban Transportation Real Estate
Entertainment and
Communications Travel International
Transportation Hotels Subtotal
Revenues from operations:
I. Customers $2,074,161 $1,773,777 $ 956,804 $267,196 $639,563 $574,625 $ 6,286,143 $288,250 $ 6,574,393 $ 3,839 $ 6,578,241II. Intersegment 43,125 152,196 71,705 107 339 11,438 278,929 92,518 371,455 (371,455) — Total 2,117,286 1,925,973 1,028,509 267,304 639,911 586,071 6,565,071 380,768 6,945,848 (367,607) 6,578,241Segment income (loss) 377,116 374,732 139,777 5,688 14,170 24,955 936,473 11,964 948,438 (19,348) 929,089Segment assets 7,162,839 9,434,991 1,315,241 660,161 345,161 737,161 19,655,571 304,857 19,960,438 1,020,188 20,980,634Other items:
Depreciation and amortisation 231,420 150,000 60,080 6,482 6,071 16,759 470,839 4,875 475,714 (4,286) 471,429
Increase in property and equipment and
intangible assets278,196 385,214 65,964 4,714 3,429 28,411 765,955 5,518 771,482 (1,723) 769,750
Notes:1. The “Other” segment is a business segment not included in the reportable segments and includes construction, etc.2. The main item in the adjusted amount of segment profit and loss for the fiscal year was amortisation of goodwill (¥(2,238) million in the fiscal year ended 31st March 2016 and ¥(2,238)
million ($(19,982) thousand) in the fiscal year ended 31st March 2017) (refers mainly to the amortisation of goodwill arising from the management integration with Hanshin Electric Railway Co., Ltd. in the fiscal year ended 31st March 2007).
In addition to the balance of unamortised goodwill (refers mainly to the goodwill arising from the management integration with Hanshin Electric Railway Co., Ltd. in the fiscal year ended 31st March 2007) of ¥20,496 million ($183,000 thousand), the segment assets’ adjusted amount consists mainly of surplus working capital (cash and deposits); unallocated assets such as long-term investment funds (investment securities) and land, etc.; and intersegment eliminations at the Company, Hankyu Corporation and Hanshin Electric Railway Co., Ltd.
3. Segment profit and loss is adjusted with operating income in the consolidated statements of income.
Hankyu Hanshin Holdings • Annual Report 2017100

Notes to the Consolidated Financial Statements
2 Related information(a) Information about product and service categories
Information about product and service categories is the same as that described in “① Segment information (d) Information regarding totals for revenues from
operations, income (loss), assets and other items by reportable segment.”
(b) Information by region
I. Revenues from operations
Since over 90% of revenues from operations in the consolidated statements of income are revenues from external customers in Japan, a breakdown by region
is omitted.
II. Property and equipment
Since over 90% of the total value of property and equipment in the consolidated balance sheets relates to property and equipment in Japan, a breakdown by
region is omitted.
(c) Information about important customers
No single external customer accounts for more than 10% of the revenues from operations reported in the consolidated statements of income.
3 Information regarding loss on impairment of fixed assets by reportable segmentFiscal year ended 31st March 2016
Millions of yen
Reportable segment
Other Total Adjustment (Note)
Amounts appearing in
the consolidated financial
statements
Urban Transportation Real Estate
Entertainment and
CommunicationsTravel International
Transportation Hotels Subtotal
Loss on impairment of fixed assets ¥391 ¥240 ¥22 ¥— ¥— ¥2,033 ¥2,688 ¥— ¥2,688 ¥3 ¥2,692
Fiscal year ended 31st March 2017
Millions of yen
Reportable segment
Other Total Adjustment (Note)
Amounts appearing in
the consolidated financial
statements
Urban Transportation Real Estate
Entertainment and
CommunicationsTravel International
Transportation Hotels Subtotal
Loss on impairment of fixed assets ¥72 ¥16 ¥— ¥— ¥— ¥290 ¥379 ¥520 ¥899 ¥1 ¥901
Thousands of U.S. dollars
Reportable segment
Other Total Adjustment (Note)
Amounts appearing in
the consolidated financial
statements
Urban Transportation Real Estate
Entertainment and
CommunicationsTravel International
Transportation Hotels Subtotal
Loss on impairment of fixed assets $643 $143 $— $— $— $2,589 $3,384 $4,643 $8,027 $9 $8,045
Note: The amounts under “Adjustment” are the amounts for land, etc., not allocated to business segments.
4 Information regarding amortisation of goodwill and the balance of unamortised goodwill by reportable segment Omitted as the significance was negligible.
5 Information regarding gains from negative goodwill by reportable segmentOmitted as the significance was negligible.
Hankyu Hanshin Holdings • Annual Report 2017 101

Notes to the Consolidated Financial Statements
20 Related-Party Transactions 1 Related-party transactions(a) Transactions between the company submitting the consolidated financial statements and related parties
No items
(b) Transactions between consolidated subsidiaries of the company submitting the consolidated financial statements and related parties
Directors and principal shareholders (only individual shareholders) of the company submitting the consolidated financial statements
Fiscal year ended 31st March 2016
TypeName of
related partyAddress
Amount of capital
(Millions of yen)Business Voting interest
Relationship with related
party
Details of transaction
Transaction amounts
(Millions of yen)Item
Balance as of 31st March 2016 (Millions of yen)
Audit & Supervisory Board Member
Haruo Sakaguchi — ¥ —Auditor of the
CompanyDirectly
0.0%Lease of real
estateLease of real
estate¥ 47 Deposit ¥ 33
Company in which director or close
family thereof holds majority of voting rights
Tateishi Sangyo Co., Ltd.
Ikeda City, Osaka
100Real estate business
Directly 0.1%
Operation, man-agement, sale, purchase and brokerage of
real estate
Concurrent post (director)
Operation and management of real estate
34Accounts receivable
0
Sale of real estate
—Advance 698
Deposit 10
Purchase of real estate
5,222 — —
Brokerage of real estate
156 — —
Notes:1. The transaction amount does not include consumption tax, etc., and the balance, excluding deposit, at the end of the fiscal year does not include consumption tax, etc.2. Transaction terms and conditions, and method of determining transaction terms and conditions, etc. The terms and conditions of the property lease, operation, management and sale are determined with reference to similar transactions in the neighbouring area. The terms and conditions of the purchase of real estate are determined with reference to the appraised values of real estate appraisers. The terms and conditions of real estate brokerage are determined in the same manner as used for general transaction conditions.3. Koichi Kobayashi, a managing director of a consolidated subsidiary of the Company, Hankyu Corporation, and his close family own 77% of the voting rights in Tateishi Sangyo Co., Ltd.
Fiscal year ended 31st March 2017
TypeName of
related partyAddress
Amount of capital
Business Voting interestRelationship with related
party
Details of transaction
Transaction amounts
Item
Balance as of 31st March 2017
(Millions of yen)
(Thousands of U.S.
dollars)
(Millions of yen)
(Thousands of U.S.
dollars)
(Millions of yen)
(Thousands of U.S.
dollars)
Audit & Supervisory Board Member
Haruo Sakaguchi — ¥ — $ —Auditor of the
Company
Directly 0.0%
Lease of real estate
Lease of real estate
¥ 47 $ 420 Deposit ¥ 40 $ 357
Company in which director or close
family thereof holds majority of voting rights
Tateishi Sangyo Co., Ltd.
Ikeda City, Osaka
100 893Real estate business
Directly 0.1%
Sale of real estate
Concurrent post (director)
Sale of real estate
1,146 10,232 Advance 205 1,830
Notes:1. The transaction amount does not include consumption tax, etc., and the balance, excluding deposit, at the end of the fiscal year does not include consumption tax, etc.2. Transaction terms and conditions, and method of determining transaction terms and conditions, etc. The terms and conditions of the property lease and sale are determined with reference to similar transactions in the neighbouring area. The terms and conditions of the purchase of real estate are determined with reference to the appraised values of real estate appraisers. The terms and conditions of real estate brokerage are determined in the same manner as used for general transaction conditions.3. Koichi Kobayashi, an Audit & Supervisory Board member of the Company, and his close family own 77% of the voting rights in Tateishi Sangyo Co., Ltd.
2 Notes about parent company and major affiliated companiesNo items
Hankyu Hanshin Holdings • Annual Report 2017102

Notes to the Consolidated Financial Statements
21 Per Share Information The following tables show net assets per share, net income attributable to owners of the parent per share, diluted net income attributable to owners of the parent
per share and the basis for their respective calculations.2016 2017 2017
① Net assets per share (Yen / U S. dollars) ¥2,815.96 ¥3,150.67 $28.13(Basis for the calculation)
Total net assets (Millions of yen / Thousands of U.S. dollars) ¥724,237 ¥804,659 $7,184,455Amount to be deducted from total net assets (Millions of yen / Thousands of U.S. dollars)
¥16,902 ¥17,710 $158,125
(Of the amount, subscription rights to shares) ¥[424] ¥[496] $[4,429](Of the amount, non-controlling interests) ¥[16,478] ¥[17,213] $[153,688]Net assets at the end of the fiscal year related to common shares (Millions of yen / Thousands of U.S. dollars)
¥707,334 ¥786,949 $7,026,330
Common shares issued (Thousands of shares) 254,281 254,281Treasury stock shares (Thousands of shares) 2,075 3,471Common shares held by consolidated subsidiaries and equity-method affiliates (Thousands of shares)
1,017 1,036
Common shares used to calculate net assets per share (Thousands of shares) 251,188 249,772② Net income per share (Yen / U.S. dollars) ¥277.88 ¥285.11 $2.55
(Basis for the calculation)
Net income attributable to owners of the parent (Millions of yen / Thousands of U.S. dollars)
¥69,971 ¥71,302 $636,625
Amount not belonging to common stockholders (Millions of yen / Thousands of U.S. dollars)
¥— ¥— $—
Net income attributable to owners of the parent related to common shares (Millions of yen / Thousands of U.S. dollars)
¥69,971 ¥71,302 $636,625
Average number of common shares during term (Thousands of shares) 251,801 250,089③ Net income per share—diluted (Yen / U.S. dollars) ¥277.67 ¥284.86 $2.54
(Basis for the calculation)
Adjustment to net income attributable to owners of the parent (Millions of yen / Thousands of U.S. dollars)
¥(11) ¥(14) $(125)
(Equity in income of affiliates) ¥[(11)] ¥[(14)] $[(125)]
Increase in number of common shares (Thousands of shares) 154 171
(Of the amount, subscription rights to shares) [154] [171]
Summary of potential shares that were not included in the calculation of diluted income per share because their effect was not dilutive
— —
Note: Hankyu Hanshin Holdings, Inc. consolidated shares at the ratio of 5 shares to 1 share with an effective date of 1st August 2016. Net assets per share, net income attributable to owners of the parent per share and diluted net income attributable to owners of the parent per share have been calculated based on the assumption that the said reverse stock split was executed on 1st April 2015.
22 Subsequent Events 1 Acquisition of treasury stockBased on Article 156 of the Companies Act of Japan, as applied mutatis
mutandis pursuant to Paragraph 3, Article 165 of the Companies Act of Japan,
a meeting of the Board of Directors convened on 12th May 2017 decided the
following items in relation to the acquisition of treasury stock.
(a) Reason for acquisition of treasury stock
To enhance shareholder returns and enhance capital efficiency
(b) Details of items related to acquisition1 Type of shares acquired: Shares of common stock of the Company2 Total number of shares available for acquisition: 3,000,000 shares
(upper limit)
(1.20% of issued shares (excluding treasury stock))3 Total amount of acquisition: ¥9,100,000,000 (upper limit)4 Period of acquisition: From 22nd May 2017 to 31st July 2017
Hankyu Hanshin Holdings • Annual Report 2017 103

Notes to the Consolidated Financial Statements
23 Consolidated Supplementary Statements 1 Corporate bond statements
Millions of yenThousands of
U.S. dollars
Company Name Issue dateBalance as of
1st April 2016
Balance as of 31st March
2017
Balance as of 31st March
2017Interest rate Security
Redemption date
Hankyu Hanshin Holdings, Inc.Series 38 unsecured
corporate bonds23rd Oct.
2009¥ 10,000 ¥ 10,000 $ 89,286 1.87% None
23rd Oct. 2019
Hankyu Hanshin Holdings, Inc.Series 39 unsecured
corporate bonds28th Jan.
201020,000 — — 1.25 None
27th Jan. 2017
Hankyu Hanshin Holdings, Inc.Series 40 unsecured
corporate bonds22nd Sept.
201015,000 15,000 133,929 1.43 None
18th Sept. 2020
Hankyu Hanshin Holdings, Inc.Series 41 unsecured
corporate bonds22nd Sept.
20107,000 7,000 62,500 1.72 None
22nd Sept. 2022
Hankyu Hanshin Holdings, Inc.Series 42 unsecured
corporate bonds17th Mar.
201110,000 10,000 89,286 1.54 None
17th Mar. 2021
Hankyu Hanshin Holdings, Inc.Series 43 unsecured
corporate bonds9th Sept.
201110,000 — — 0.55 None
9th Sept. 2016
Hankyu Hanshin Holdings, Inc.Series 44 unsecured
corporate bonds25th Oct.
201210,000
10,000(10,000)
89,286(89,286) 0.406 None
25th Oct. 2017
Hankyu Hanshin Holdings, Inc.Series 45 unsecured
corporate bonds14th Mar.
201310,000 10,000 89,286 0.589 None
13th Mar. 2020
Hankyu Hanshin Holdings, Inc.Series 46 unsecured
corporate bonds25th Oct.
201310,000 10,000 89,286 0.819 None
25th Oct. 2023
Hankyu Hanshin Holdings, Inc.Series 47 unsecured
corporate bonds18th Jul.
201410,000 10,000 89,286 1.202 None
18th Jul. 2029
Hankyu Hanshin Holdings, Inc.Series 48 unsecured
corporate bonds15th Dec.
2016— 10,000 89,286 0.120 None
15th Dec. 2021
Hankyu Hanshin Holdings, Inc.Series 49 unsecured
corporate bonds15th Dec.
2016— 10,000 89,286 0.817 None
15th Dec. 2036
Total — — 112,000102,000(10,000)
910,714(89,286) — — —
Notes:1. The amount in parenthesis in the “Balance as of 31st March 2017” column is the current portion of the total amount and is recorded in current liabilities in the consolidated balance sheets.2. Redemption schedule of bonds for five years subsequent to 31st March 2017
Millions of yenThousands of
U.S. dollars
Due within one year ¥10,000 $ 89,286
Due after one year through two years — —
Due after two years through three years 20,000 178,571
Due after three years through four years 25,000 223,214
Due after four years through five years 10,000 89,286
Hankyu Hanshin Holdings • Annual Report 2017104
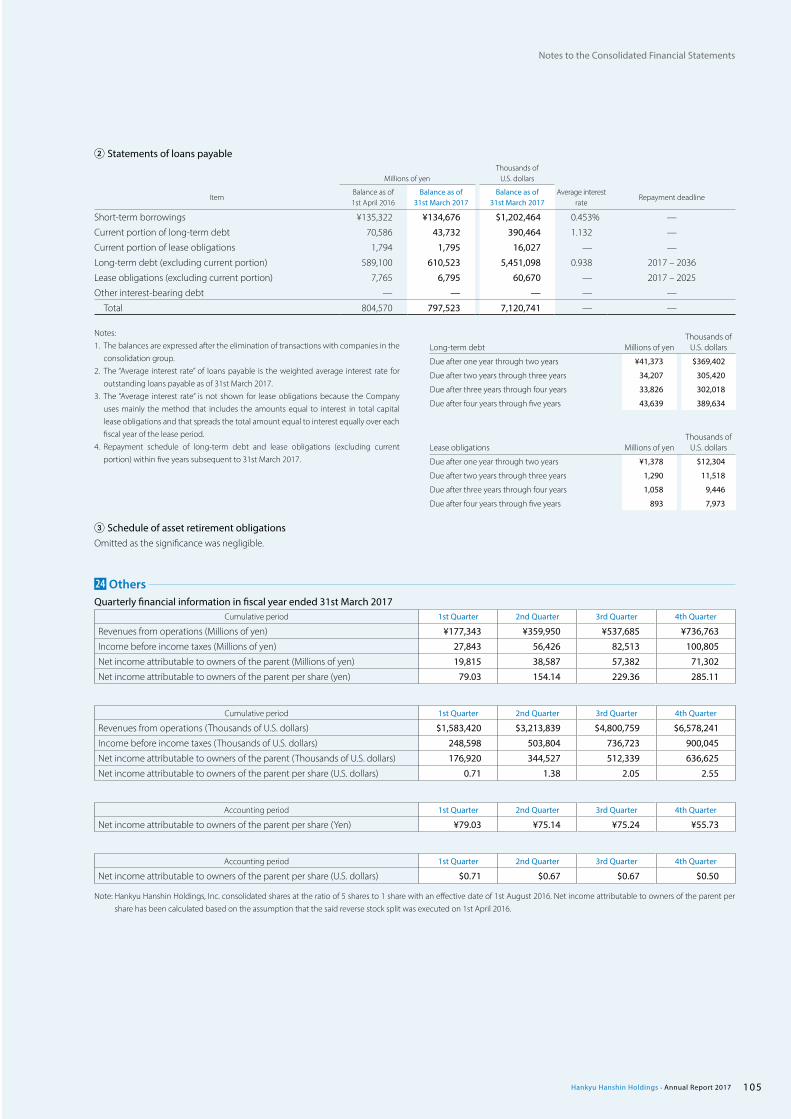
Notes to the Consolidated Financial Statements
2 Statements of loans payable
Millions of yenThousands of
U.S. dollars
ItemBalance as of 1st April 2016
Balance as of 31st March 2017
Balance as of 31st March 2017
Average interest rate
Repayment deadline
Short-term borrowings ¥135,322 ¥134,676 $1,202,464 0.453% —
Current portion of long-term debt 70,586 43,732 390,464 1.132 —
Current portion of lease obligations 1,794 1,795 16,027 — —
Long-term debt (excluding current portion) 589,100 610,523 5,451,098 0.938 2017 – 2036
Lease obligations (excluding current portion) 7,765 6,795 60,670 — 2017 – 2025
Other interest-bearing debt — — — — —
Total 804,570 797,523 7,120,741 — —
24 Others Quarterly financial information in fiscal year ended 31st March 2017
Cumulative period 1st Quarter 2nd Quarter 3rd Quarter 4th Quarter
Revenues from operations (Millions of yen) ¥177,343 ¥359,950 ¥537,685 ¥736,763
Income before income taxes (Millions of yen) 27,843 56,426 82,513 100,805
Net income attributable to owners of the parent (Millions of yen) 19,815 38,587 57,382 71,302
Net income attributable to owners of the parent per share (yen) 79.03 154.14 229.36 285.11
Cumulative period 1st Quarter 2nd Quarter 3rd Quarter 4th Quarter
Revenues from operations (Thousands of U.S. dollars) $1,583,420 $3,213,839 $4,800,759 $6,578,241
Income before income taxes (Thousands of U.S. dollars) 248,598 503,804 736,723 900,045
Net income attributable to owners of the parent (Thousands of U.S. dollars) 176,920 344,527 512,339 636,625
Net income attributable to owners of the parent per share (U.S. dollars) 0.71 1.38 2.05 2.55
Accounting period 1st Quarter 2nd Quarter 3rd Quarter 4th Quarter
Net income attributable to owners of the parent per share (Yen) ¥79.03 ¥75.14 ¥75.24 ¥55.73
Accounting period 1st Quarter 2nd Quarter 3rd Quarter 4th Quarter
Net income attributable to owners of the parent per share (U.S. dollars) $0.71 $0.67 $0.67 $0.50
Note: Hankyu Hanshin Holdings, Inc. consolidated shares at the ratio of 5 shares to 1 share with an effective date of 1st August 2016. Net income attributable to owners of the parent per share has been calculated based on the assumption that the said reverse stock split was executed on 1st April 2016.
Notes:1. The balances are expressed after the elimination of transactions with companies in the
consolidation group.2. The “Average interest rate” of loans payable is the weighted average interest rate for
outstanding loans payable as of 31st March 2017.3. The “Average interest rate” is not shown for lease obligations because the Company
uses mainly the method that includes the amounts equal to interest in total capital lease obligations and that spreads the total amount equal to interest equally over each fiscal year of the lease period.
4. Repayment schedule of long-term debt and lease obligations (excluding current portion) within five years subsequent to 31st March 2017.
Long-term debt Millions of yenThousands of
U.S. dollars
Due after one year through two years ¥41,373 $369,402
Due after two years through three years 34,207 305,420
Due after three years through four years 33,826 302,018
Due after four years through five years 43,639 389,634
Lease obligations Millions of yenThousands of
U.S. dollars
Due after one year through two years ¥1,378 $12,304
Due after two years through three years 1,290 11,518
Due after three years through four years 1,058 9,446
Due after four years through five years 893 7,973
3 Schedule of asset retirement obligationsOmitted as the significance was negligible.
Hankyu Hanshin Holdings • Annual Report 2017 105

Major Rental Properties / Major Sales Properties
Major rental properties
Property name Location CompletedLeasable area1
(1,000 m2) Use
Umeda Hankyu Bldg. Kita-ku, Osaka 2012 213 Department stores (Hankyu Department Store), Offices
Umeda Hanshin Daiichi Bldg. (HERBIS OSAKA) Kita-ku, Osaka 1997 82Hotels (The Ritz-Carlton, Osaka), Offices, Commercial facilities, Multifunctional convention hall
Umeda Hanshin Daini Bldg. (HERBIS ENT) Kita-ku, Osaka 2004 55 Offices, Commercial facilities, Theatre (Osaka Shiki Theatre)
Hankyu Chayamachi Bldg. (Applause Tower) Kita-ku, Osaka 1992 52 Hotel (Hotel Hankyu International), Offices, Commercial facilities
Hankyu Sanban Gai Shopping Centre Kita-ku, Osaka 1969 40 Commercial facilities
Hankyu Grand Bldg. Kita-ku, Osaka 1977 36 Offices, Commercial facilities
GRAND FRONT OSAKA Kita-ku, Osaka 2013 28Offices, Commercial facilities, Knowledge Capital, Hotel (InterContinental Hotel Osaka)
Hankyu Terminal Bldg. Kita-ku, Osaka 1972 27 Offices, Commercial facilities
Hankyu Five Bldg. (HEP FIVE) Kita-ku, Osaka 1998 20 Commercial facilities
Navio Hankyu (HEP NAVIO) Kita-ku, Osaka 1980 16 Commercial facilities
Kita Hankyu Bldg. Kita-ku, Osaka 1971 13 Offices, Commercial facilities
NU_–chayamachi Kita-ku, Osaka 2005 12 Commercial facilities
Noda Hanshin Bldg. (WISTE) Fukushima-ku, Osaka 1992 32 Commercial facilities, Offices
Shin-Osaka Hankyu Bldg. Yodogawa-ku, Osaka 2012 24 Offices, Hotel (REMM Shin-Osaka), Commercial facilities
Hankyu Nishinomiya Gardens Nishinomiya, Hyogo 2008 108Commercial facilities, Department stores (Hankyu Department Store)
Hankyu Kawaramachi Bldg. Shimogyo-ku, Kyoto 1974 38 Department stores (Takashimaya)
1. Leasable area does not include areas for public use.
Major properties sold in fiscal 20172
Property name LocationTotal number
of units
Condominium
Geo Takatsuki Muse Resis Takatsuki, Osaka 244
G-Clef Geo Kobe Motoyama3 Higashinada-ku, Kobe 256
Geo Senri Chuo The Residence Toyonaka, Osaka 218
Brod Takatsuki Takatsuki, Osaka 51
Geo Kyoto Saga Arashiyama Ukyo-ku, Kyoto 32
Geo Kyoto Arashiyama Nisikyo-ku, Kyoto 25
Geo Sumiyoshi Honmachi Higashinada-ku, Kobe 224
Geo Grande Okamoto 1-chome Higashinada-ku, Kobe 174
Geo Tama Center Tama, Tokyo 300
Geo Chigasaki3 Chigasaki, Kanagawa 136
Geo Tsudanuma Narashino, Chiba 84
Geo Kyodo Setagaya-ku, Tokyo 78
Geo Gyoen Naitomachi Shinjuku-ku, Tokyo 63
Detached house
Osaka Nakajima Koen Toshi Hapia Garden Shiki no Machi
Nishi-Yodogawa-ku, Osaka 254
Hankyu Saito Garden Front Saito Mino-o Residence Minoh, Osaka 48
Hapia Garden Mino-o Onohara Minoh, Osaka 20
Grand Forum Soshigaya-Okura Hapia3 Setagaya-ku, Tokyo 27
Hapia Garden Yokohama Yamate Yokohama, Kanagawa 14
Hapia Garden Oizumi Gakuen-cho Nerima-ku, Tokyo 8
2. Ordered by highest total number of condominium units first, with Kansai area and Tokyo metropolitan area categorised separately
3. Joint-venture properties4. Including unsold condominium units
Major properties planned to be sold in fiscal 20182
Property name LocationTotal number
of units
Condominium
Geo Tenroku Twin Towers Kita-ku, Osaka 358
Cielia Saito (First phase)3 Ibaraki, Osaka 208
Geo Ibaraki Togu-cho Ibaraki, Osaka 45
Geo Nishinomiya Kitaguchi The Grace Nishinomiya, Hyogo 40
Geo Nishinomiya Kitaguchi Kawarabayashi-cho Nishinomiya, Hyogo 35
Geo Nishinomiya Kitaguchi Yakushi-cho Nishinomiya, Hyogo 29
Geo Fukagawa Sumiyoshi Koto-ku, Tokyo 190
Geo Yotsuya Araki-cho Shinjuku-ku, Tokyo 1314
Primce Style Higashi Nihombashi3 Chuo-ku, Tokyo 734
Geo Yotsuya Sanei-cho Shinjuku-ku, Tokyo 61
Geo Utsukushigaoka 2-chome Hills Yokohama, Kanagawa 52
Geo Minamiaoyama Minato-ku, Tokyo 25
Geo Grande Motoazabu Minato-ku, Tokyo 194
Detached house
Hapia Garden Tarumi Seiryodai Tarumi-ku, Kobe 17
Hapia Garden Kuzuhanamiki 1-chome Hirakata, Osaka 7
Hapia Garden Takarazuka Gotenyama Takarazuka, Hyogo 6
Hapia Garden Shimo Shakujii Nerima-ku, Tokyo 13
Hapia Garden Komae Izumi Tamagawa Komae, Tokyo 9
Hapia Garden Yokohama Yamate Nibangai Yokohama, Kanagawa 7
Hankyu Hanshin Holdings • Annual Report 2017106

Major Group Companies(As of 31st March 2017)
Urban TransportationMain business Name of company
Railway operations Hankyu CorporationHanshin Electric Railway Co., Ltd.Nose Electric Railway Co., Ltd.Kita-Osaka Kyuko Railway Co., Ltd.Hokushin Kyuko Railway Co., Ltd.Kobe Rapid Transit Railway Co., Ltd.
Automobile Hankyu Bus Co., Ltd.Hanshin Bus Co., Ltd.Hankyu Taxi Inc.Hanshin Taxi Co., Ltd.
Advertising Hankyu CorporationEki Retail Service Hankyu Hanshin Co., Ltd.Hankyu Style Labels Co., Ltd.
Retailing Hankyu CorporationHankyu Advertising Agency Inc.
Other Alna Sharyo Co., Ltd.Hankyu Sekkei ConsultantHanshin Station Net Co., Ltd.
Real EstateMain business Name of company
Real estate leasing Hankyu CorporationHanshin Electric Railway Co., Ltd.Hankyu Realty Co., Ltd.Hanshin Real Estate Co., Ltd.
Real estate sales and other business
Hankyu CorporationHanshin Electric Railway Co., Ltd.Hankyu Realty Co., Ltd.Hankyu Hanshin Building Management Co., Ltd.Hankyu Hanshin High Security Service Co., Ltd.Hankyu Hanshin Clean Service Co., Ltd.Hankyu REIT Asset Management, Inc.Hankyu Housing Support Ltd.
Entertainment and CommunicationsMain business Name of company
Sports Hanshin Electric Railway Co., Ltd.Hanshin Tigers Baseball Club, Ltd.Hanshin Contents Link Corporation
Stage Hankyu CorporationTakarazuka Creative Arts Co., Ltd.Umeda Arts Theater Co., Ltd.
Communication and media
Itec Hankyu Hanshin Co., Ltd.Bay Communications Inc.
Leisure, etc. Mt. Rokko Cable Car & Tourism Co.
TravelMain business Name of company
Travel agency Hankyu Travel International Co., Ltd.Hankyu Travel Support Co., Ltd.
International TransportationMain business Name of company
International transportation
Hankyu Hanshin Express Co., Ltd.Hankyu Hanshin Logipartners Co., Ltd.HHE (USA) Inc.HHE (Deutschland) GMBHHHE (HK) LimitedHHE Southeast Asia Pte. Ltd.
HHE: Hankyu Hanshin Express
HotelsMain business Name of company
Hotel management Hankyu Hanshin Hotels Co., Ltd.Hanshin Hotel Systems Co., Ltd.Hankyu Hanshin Restaurants Co., Ltd.Arima View Hotel Co., Ltd.
OtherMain business Name of company
Construction Hanshin Kensetsu Co., Ltd.Chuo Densetsu Co., Ltd.
Outsourcing services for personnel and accounting services
Hankyu Hanshin Business Associate Co., Ltd.
Credit and point card Hankyu Hanshin Card Co., Ltd.Group finance Hankyu Hanshin Financial Support Co., Ltd.
Main business Name of company
Department store H2O Retailing Corporation [Securities code: 8242]
Railway operations Nishi-Osaka Railway Co., Ltd.Kobe Electric Railway Co., Ltd. [Securities code: 9046]
Motion picture business Toho Co., Ltd. [Securities code: 9602]Real estate leasing Tokyo Rakutenchi Co., Ltd.
[Securities code: 8842]Commercial broadcasting
Kansai Telecasting Corporation
Consolidated Subsidiaries
Equity-Method Affiliates
Hankyu Hanshin Holdings • Annual Report 2017 107

Group History
Hanshin Electric Railway Co., Ltd.1899 Founding of Settsu Electric Railway
(renamed Hanshin Electric Railway Co., Ltd., in same year)
1905 Beginning of operations linking Kobe (Sannomiya) and outer Osaka (Deiribashi)
1924 Opening of Koshien Stadium (currently Hanshin Koshien Stadium)
1933 Opening of Hanshin Mart at Hanshin Umeda Station (currently Hanshin Department Store)
1935 Establishment of Osaka Baseball Club (Osaka Tigers, currently Hanshin Tigers)
1948 Launch of airline agency business
1985 Hanshin Tigers win Japan Series for first time
Hankyu Holdings, Inc.
1907 Founding of Mino–Arima Electric Railway Company (predecessor of Hankyu Corporation) by Ichizo Kobayashi
1910 Opening of Takarazuka Line (Umeda–Takarazuka) and Mino-o Line (Ishihashi–Mino-o)
1913 Formation of Takarazuka Girls’ Revue (currently Takarazuka Revue Company)
1924 Completion of Takarazuka Grand Theatre
1929 Opening of Hankyu Department Store, Asia’s first railway terminal department store
1948 Launch of services as Pan American Airways agent
1964 Opening of Hotel new Hankyu Osaka
1973 Opening of New Hankyu Umeda Station as one of the largest private railway terminals in Japan
Changing of company name from Keihanshin Kyuko Railway Company to Hankyu Corporation
1995
2005 Establishment of Hankyu Holdings, Inc.
Considerable damage to transportation and business infrastructure of Hankyu and Hanshin due to the Great Hanshin Earthquake
2006 Establishment of Hankyu Hanshin Holdings, Inc.Establishment of Hankyu-Hanshin-Daiichi Hotel Group
2007 Announcement of Hankyu Hanshin Holdings Group 2007 Medium-Term Management Plan
Management integration of Hankyu and Hanshin department store businesses
2008 Opening of Hankyu Nishinomiya Gardens
2010 Completion of renovation of Hanshin Koshien Stadium, opening of Museum of Hanshin Koshien Stadium
Completion of Umeda Hankyu Building Office Tower
2012 Completion of Umeda Hankyu Building, full opening of Umeda Flagship Store of Umeda Department Store
2015 Announcement of the Hankyu Hanshin Holdings Group’s Medium-Term Management Plan (Fiscal 2016–Fiscal 2019)
2016 Opening of the Group’s first logistics centre in the ASEAN region, in Indonesia
2017 Announcement of the Hankyu Hanshin Holdings Group’s Long-Term Management Vision for 2025 (Fiscal 2017–Fiscal 2026)
Hankyu Hanshin Holdings • Annual Report 2017108

Notes: 1. The stock prices are as of 31st March of each year. The trading volumes are for years ended 31st March.2. The data takes into account the reverse stock split and the change of trading unit conducted with an effective date of 1st August 2016.
Investor Information(As of 31st March 2017)
Principal Shareholders:
Name Number of shares (Thousands)*
Percentage (%)
Japan Trustee Services Bank, Ltd. (Trust account) 12,906 5.08The Master Trust Bank of Japan, Ltd. (Trust account) 9,163 3.60Nippon Life Insurance Company (Standing Proxy: The Master Trust Bank of Japan, Ltd.)
5,804 2.28
Japan Trustee Services Bank, Ltd. (Trust account 5) 4,641 1.83Sumitomo Mitsui Banking Corporation 4,381 1.72H2O Retailing Corporation 4,207 1.65State Street Bank West Client–Treaty 505234 (Standing Proxy: Mizuho Bank, Ltd. Settlement & Clearing Services Division)
3,584 1.41
Japan Trustee Services Bank, Ltd. (Trust account 7) 3,460 1.36Japan Trustee Services Bank, Ltd. (Trust account 1) 3,447 1.36Japan Trustee Services Bank, Ltd. (Trust account 2) 3,409 1.34
* The Company conducted a 1-for-5 reverse common stock split and the change of trading unit from 1,000 shares to 100 shares with an effective date of 1st August 2016. The figures take into account the reverse stock split and the change of trading unit.
Paid-in Capital: ¥99,474 million
Fiscal Year-End: 31st March
Number of Employees: 21,860 (consolidated)
Authorised Shares: 640,000,000*
Issued Shares: 254,281,385*
Number of Shareholders: 79,271*
Unit of Trading: 100 shares*
Stock Exchange Listing: Tokyo
Transfer Agent: Mitsubishi UFJ Trust and Banking Corporation
Head Office:
1-16-1, Shibata, Kita-ku, Osaka 530-0012, Japan
Phone: +81-6-6373-5001
(Group Planning Div., IR Office)
Fax: +81-6-6373-5042
Tokyo Office (Personnel and General Affairs Div.):
Toho Twin Tower Bldg.,
1-5-2, Yurakucho, Chiyoda-ku, Tokyo 100-0006, Japan
Phone: +81-3-3503-1568
Fax: +81-3-3508-0249
Hankyu Hanshin Holdings, Inc.
Stock Price and Annual Trading Volume (Tokyo Stock Exchange):Stock price (¥) Nikkei average (¥)
2008 2009 2010 2011 2012 2013 2014 2015 2016 2017
0
90,000
180,000
0
1,000
2,000
3,000
4,000
5,000
0
5,000
10,000
15,000
20,000
25,000
Trading volume (Thousand shares)
Stock Price (left axis)
Nikkei Average (right axis)
Ownership Breakdown:
Individuals and others42.17%
Financial institutions28.03%
Securities companies
0.86%
Other corporations8.76%
National government and local public organisations
0.00%
Foreign corporations and individuals20.17%
Hankyu Hanshin Holdings • Annual Report 2017 109

Hankyu Hanshin Holdings, Inc.
Hankyu Hanshin Toho Group
Hankyu H
anshin Holdings, Inc. A
NN
UA
L REPORT 2017
Printed in Japan
1-16-1, Shibata, Kita-ku, Osaka 530-0012, JapanPhone: +81-6-6373-5001 Fax: +81-6-6373-5042
http://www.hankyu-hanshin.co.jp/en/