chang shu* stefanie wuhrer pengcheng xipeople.scs.carleton.ca › ~c_shu › publications ›...
TRANSCRIPT

Int. J. Human Factors Modelling and Simulation, Vol. 3, No. 2, 2012 133
Copyright © 2012 Inderscience Enterprises Ltd.
3D anthropometric data processing
Chang Shu* National Research Council of Canada, 1200 Montreal Road, Ottawa, Ontario, Canada E-mail: [email protected] *Corresponding author
Stefanie Wuhrer Cluster of Excellence on Multimodal Computing and Interaction, Saarland University, and Max Plank Institute Informatik, Campus E 1 7, 66123 Saarbrücken, Germany E-mail: [email protected]
Pengcheng Xi National Research Council of Canada, 1200 Montreal Road, Ottawa, Ontario, Canada E-mail: [email protected]
Abstract: 3D anthropometric data obtained from 3D imaging technology provide unprecedented information about the human shape. At the same time, 3D data present tremendous challenges. New software tools and analytical methods have to be designed to realise the full potential of the 3D data. One prominent character of the 3D data is that they are a collection of coordinates in 3-space and do not have a natural order. This poses problems for performing statistical analysis. In order to make sense about this type of data, 3D points have to be registered such that meaningful correspondences across all the models can be established. Other issues include data completion, compression, and visualisation. In this paper, we describe a framework and the techniques involved in processing the 3D anthropometric data for the purpose of making them usable for designing products that fit the human shapes.
Keywords: statistical shape analysis; 3D anthropometry; geometry processing; human shape modelling.
Reference to this paper should be made as follows: Shu, C. Wuhrer, S. and Xi, P. (2012) ‘3D anthropometric data processing’, Int. J. Human Factors Modelling and Simulation, Vol. 3, No. 2, pp.133–146.
Biographical notes: Chang Shu is a Senior Research Scientist at the National Research Council of Canada. He is also an Adjunct Research Professor at the School of Computer Science, Carleton University. He received his PhD in Computer Science from Queen Mary College, University of London, UK, in 1992, and his BSc from Harbin Institute of Technology, China, in 1985. His research has been focused on developing geometric techniques for

134 C. Shu et al.
solving problems in computer vision, computer graphics, scientific computing, robotics, and ergonomics. He currently leads the digital human modelling project at the NRC where he works on geometric and statistical methods for understanding human and other biological forms.
Stefanie Wuhrer is an Independent Research Group Leader at the Cluster of Excellence on Multimodal Computing and Interaction at Saarland University, Germany. She received her PhD in Computer Science in 2009 and MSc in 2006 from Carleton University, Canada. From 2009 to 2011, she was a Research Associate at the National Research Council of Canada. Her research interests include geometry processing and shape analysis.
Pengcheng Xi received his MSc in Computer Science from the University of Ottawa, Canada, in 2007. He is currently a Research Officer with Visual Information Technology group at National Research Council Canada (NRC). His research interests include 3D mesh processing, modelling, and statistical shape analysis.
This paper is a revised and expanded version of a paper entitled ‘Geometric and statistical methods for processing 3D anthropometric data’ presented at the First International Symposium on Digital Human Modelling (DHM 2011), Lyon, France, 14–16 June 2011.
1 Introduction
Anthropometry, the study of human body measurement, provides information about the human shape variation to industrial design. Traditionally, simple tools like tape measures and callipers were used to measure linear distances between landmarks or circumferences at specific locations. Although these tools are inexpensive and easy to use, they only provide limited shape information. Meanwhile, during the past twenty years, 3D imaging technology has matured to the point that we can digitise the full surface of the human body with reasonable accuracy and efficiency. Around the world, there have been many 3D anthropometry surveys. For example, the CAESAR project is the earliest and one of the largest (Robinette et al., 1999).
3D anthropometry opens up new opportunities to understand the human shape variability. Initially, the most obvious uses of the 3D data include visualising the 3D shape and performing repeated measurements on the 3D shapes. However, as the 3D data accumulate, it becomes clear that we need to build statistical models in order to realise the full potential of these data. In this paper, we describe a framework of processing the 3D anthropometric data to understand the human shape variability.
One prominent character of the 3D data is that they are a collection of coordinates in 3-space. In contrast to the traditional anthropometric measurement, the geometry of the human body is represented directly in the three-dimensional Euclidean space. A geometric approach toward representing and analysing shapes, called geometric morphometrics, was first developed in biological sciences, where variation of biological forms and their relations to functionality are studied. Bookstein applied multivariate statistics to manually placed landmark coordinates (Bookstein, 1991; Zelditch et al., 2004). Meanwhile, Kendall and other statisticians developed a theoretical foundation

3D anthropometric data processing 135
(Kendall, 1984, 1989; Dryden and Mardia, 1998) for statistical shape analysis. This new type of statistics retains the surface geometry and reveals shape variations that are impossible to capture with the traditional measurements. The results can also be visualised in an intuitive way using modern computer graphics techniques.
In principle, we can apply the geometric morphometric approach to 3D scans. However, the difficulty is that each scan has a different number of points and these points do not have a natural order. In order to perform statistical shape analysis, we need to register the 3D points such that meaningful correspondences across all of the models can be established. In other words, we need to parameterise the data models such that they all have the same number of vertices and the same topological structure.
Techniques from computer graphics, computer vision, and machine learning can be used to solve the correspondence problem. One way of establishing a correspondence across the models is to fit a generic surface model to each scan such that the key anatomical points are in correspondence. The fitting can be guided by the anthropometric landmarks. However, placing the landmarks on the subjects prior to scanning is a tedious and time-consuming task. We show that it is possible to locate the landmarks automatically. The method is based on statistical learning. Local surface properties and distances between landmarks are used to learn the parameters of a probabilistic graphical model. The prediction of the landmark locations is formulated as finding the maximum likelihood configuration of the landmark labelling.
Once we have parameterised the data models, we are ready to perform statistical shape analysis. Multivariate statistics can be applied to the coordinates of the vertices. Since a typical 3D scan consists of 100,000 to 500,000 points, the shape space is high dimensional. Well-known statistical techniques such as principal component analysis (PCA) can be used to reduce the dimensionality. It turns out that there is usually a low-dimensional subspace for human shape data. Thus we can obtain a compact representation of the space of human shapes.
Figure 1 illustrates the framework of processing and analysing the 3D anthropometric data. The goal is to prepare the data such that we can build a statistical model of the human shape. From this model, we can develop a variety of applications such as data exploration tools for understanding the shape variability, or design and simulation tools for solving specific engineering problems.
Figure 1 3D anthropometric data processing framework (see online version for colours)
136 C. Shu et al.
2 Geometry processing
2.1 Data parameterisation
The goal of data parameterisation is to establish a correspondence among the models. An early attempt to solve this problem adopts a volumetric approach (Ben Azouz et al., 2004, 2006a, 2006b). Each model is embedded in an m × n × k regular grid. By carefully orienting and normalising the models, a correspondence in the ambient space and thus a correspondence among the models is established. The advantage of this method is that it is landmark-free. It is also easy to implement. The drawback, however, is that the correspondence it produces is not accurate. Holes have to be filled before a model can be embedded into a grid. This proved to be a difficult task because certain parts of the model, for example, the area under the arms, have large holes. In some parts, like the hands and ears, up to 50% of the information is missing. A more effective approach is to fit a generic mesh model to each data scan, while possibly allowing for large-scale transformations (Allen et al., 2003, 2006; Mochimaru et al., 2000; Mochimaru and Kouchi, 2000; Pauly et al., 2005; Amberg et al., 2007; Hasler et al., 2009; Yeh et al., 2011). This model is complete and has well-shaped and well-distributed triangles. The fitting deforms the generic model to each scan such that the two models are made geometrically equivalent. When deforming the generic model, the correspondence between the anatomical parts has to be maintained. This is achieved by using landmarks, which serves as the initial conditions for the solution of the problem. When deforming the generic model, we have to carefully maintain the smoothness of the surface. Otherwise, the triangles can go into each other, causing invalid meshes and consequently leading to the failure of the deformation algorithm.
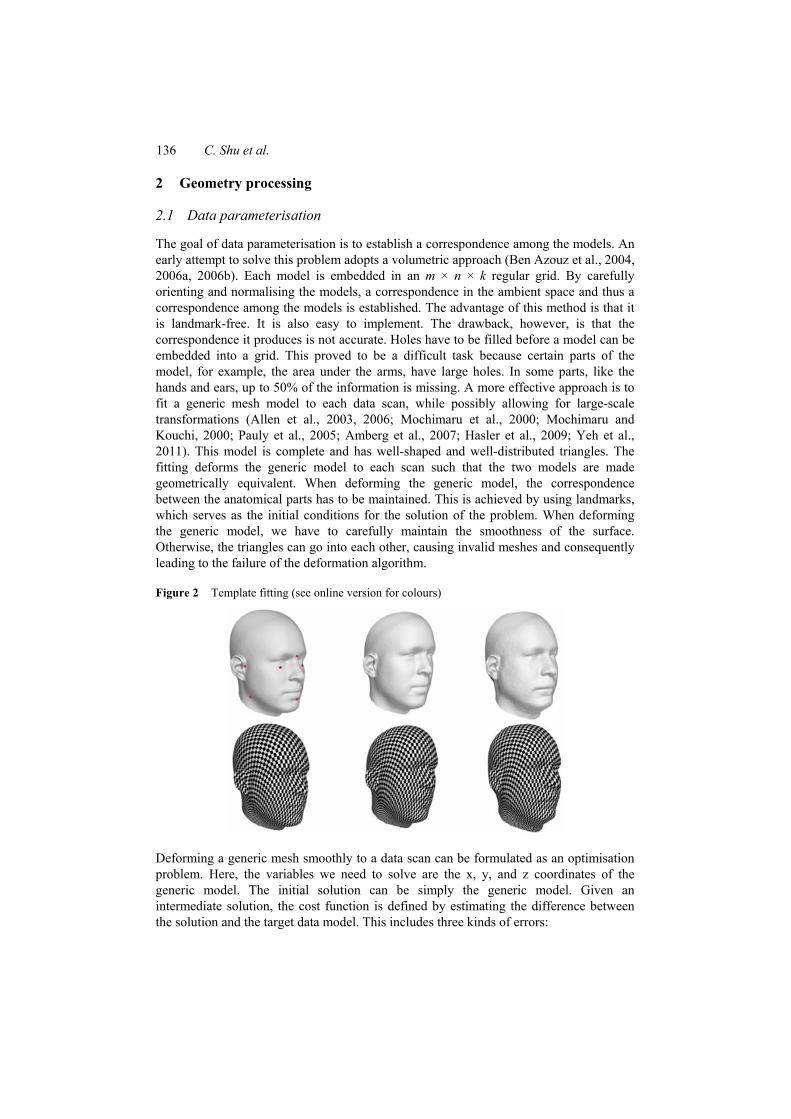
Figure 2 Template fitting (see online version for colours)
Deforming a generic mesh smoothly to a data scan can be formulated as an optimisation problem. Here, the variables we need to solve are the x, y, and z coordinates of the generic model. The initial solution can be simply the generic model. Given an intermediate solution, the cost function is defined by estimating the difference between the solution and the target data model. This includes three kinds of errors:

3D anthropometric data processing 137
1 the landmark error, which accounts for the sum of the distances between the known corresponding landmarks
2 the smoothness error, which quantifies the local smoothness at every mesh point
3 the data error, which measures the sum of the distances between every pair of corresponding points.
Figure 2 shows examples of fitting a generic model (left column) to two different data scans (middle and right columns). The texture mapped figures show that while the parameterised models have different shapes, they have the same structure.
2.2 Landmark locating
In the CAESAR dataset, each scan contains 73 anthropometric landmarks. Placing these landmarks on the subjects involves palpating the subjects and requires special skills. The accuracy of the position varies between different operators. Furthermore, not all of the datasets have landmarks, and in the future, it is unlikely that a lot of 3-D anthropometry surveys will have landmarks data.
For human body shapes, Creusot et al. (2011) developed an approach to locate a set of keypoints on human face models automatically. These keypoints can then be used to extract a set of landmarks in a fully automatic way. The approach is based on machine learning, and it learns the distributions of a set of local shape descriptors at the landmark positions.
Dekker et al. (2001) attempted to locate the landmarks automatically. They define a set of rules for each landmark based on its local surface properties, such as curvature or distances to certain feature points. Then locating the landmarks becomes a classification problem. The problem of this approach is that the rules are based on intuitive observations. Because of the variations among humans, there are always exceptions and therefore the number of the rules quickly becomes too large to handle. More principled ways of specifying the landmarks are necessary.
Ben Azouz et al. (2006a, 2006b) introduced an approach that is based on statistical learning. They used a subset of the CAESAR dataset as a training set. A graphical probabilistic model is used to model the positions of the landmarks. A node of the graph represents a landmark and an edge of the graph represents the relationship between a pair of neighbouring landmarks. Figure 3 shows the graph of the landmarks. The probability of a surface point to be a particular landmark depends on the local surface properties as well as its relationships with other landmarks. These constraints are naturally modelled by Markov random field (MRF) or Markov network.
The landmark graph G(V, E) is an undirected graph, where V is the set of nodes that represent the locations of the landmarks and E is the set of edges that represents the dependency between the landmarks. Let L = {l0,…,lN–1} be the set of random variables representing the locations of the landmarks. We associate a potential φi(li) with each node li in V corresponding to the likelihood that landmark li is located at a given vertex on the surface of the model. Furthermore, we associate a potential ψi,j(li, lj) with each edge e = (li, lj) in E corresponding to the joint likelihood that landmark li is located at one given vertex and that landmark lj is located at another vertex. The joint probability of the MRF is

138 C. Shu et al.
( ) ( )( )
,,
1( ) , ,i ji
i i i j i jl l El V
p L l l lZ ∈∈
= ∑∏φ ψ (1)
where Z is a normalising factor.
Figure 3 Landmarks and landmark graph (see online version for colours)
Figure 4 Results of automatic landmark locating (see online version for colours)
Note: The green dots indicate the predicted locations and the red dots are the landmarks placed by the operators.

3D anthropometric data processing 139
In the training stage, the distributions of surface geometric properties such as the SPIN image (Johnson, 1997), and the relative positions of landmarks are computed. In the subsequent matching stage, landmarks are located by identifying the surface points that maximises the joint probability defined by the Markov network. The probability of placing a landmark at a particular position depends on two types of information. One is the local surface property of that landmark. Another is the relationship to its neighbouring landmarks. We use Euclidean distance to measure this relationship. Both kinds of the probability distributions can be learned from the training data. We may also use geodesic distance. But since the landmarks are usually placed on the joints, the geodesic distance is usually proportional to the Euclidean distance.
The probability optimisation problem has a prohibitively large search space; exact computation is infeasible. An approximate method, called belief propagation (Pearl, 1988), is used to solve this problem. Belief propagation is an efficient technique for solving large probabilistic optimisation problem. When the graph has no loops, that is, when it is a tree, the solution is exact. When the graph has loops, we can only have an approximate solution. Our landmark graph contains loops. But in practice it works well. Figure 4 shows the results of the predicted landmarks. On average, the algorithm predicts the landmark locations within 2.0 cm of the experts’ locations. Note that these landmarks are used for guiding the template fitting; they are not accurate enough for dimensional measurements.
3 Statistical shape analysis
Having established the correspondence among all of the models, we can perform statistical shape analysis. At this point, we have a set of parameterised models, each has the same number of points and the same mesh topology. The vertices of a parameterised model provide a geometric representation of the shape. The variables on which we perform statistics are the coordinates of the vertices on the meshes. Unlike traditional anthropometry where only a sparse number of measurement is taken, the geometric approach uses dense point sets to represent the shape. A typical 3D model consists of 100,000 to 300,000 points; they provide much richer and more complete shape information.
In general, the models may live in different coordinate frames. For models in similar posture, Procrustes alignment can be used to transform them into a single coordinate frame (Dryden and Mardia, 1998). Procrustes alignment is an iterative process. Starting with an arbitrary model in the parameterised dataset, rigidly align every other models to this reference model using the corresponding points. Next, compute the mean shape and set it as the new reference shape. Then align every model to the new reference shape. The process is repeated until the total rigid movement converges. In practice, the final reference model is sometimes oriented according to the coordinate system that is convenient for the product design.
The downside of the geometric approach is the large amount of data. To understand the shape variability from the geometric data, we need to create statistical models. PCA is the most often used statistical technique for understanding high-dimensional data. To perform PCA, a shape vector Ψ is formed for each model by concatenating all of the coordinates of the model. The average over N models is given by

140 C. Shu et al.
1(1/ ) .
Nii
N=
= ∑Ψ Ψ
The deviation vectors i i= −Φ Ψ Ψ are arranged in a matrix A = [Φ1 Φ2 ··· ΦN] PCA is based on an eigen analysis of the covariance matrix Σ = (1 / (N – 1))AAT. The eigenvectors of Σ form a basis of the shape space. Each shape can be represented as the sum of the mean shape and the linear combination of basis vectors:
1
N
i ij jj
c=
= +∑ uΨ Ψ (2)
where uj is the eigenvector and cij = Φi · uj. Note that PCA can only be applied successfully to the vertex coordinates of models in
similar posture. If the posture of the models has large variations, the models need to be represented in a posture-invariant way before PCA can be applied. Hasler et al. (2009) developed one such representation.
The eigen analysis transforms the data into a new coordinate system in which the modes of variations are ordered from large to small. The absolute values of the eigenvalues determine the significance of the corresponding variations [principal components (PCs)]. In practice, many of them are negligibly small. In other words, every model can be reconstructed by the linear combination of a subset of the eigenvectors.
1
,M
i ij jj
c=
≈ +∑ uΨ Ψ (3)
where M ≤ N.
Figure 5 The compression rate of PCA (see online version for colours)

3D anthropometric data processing 141
Figure 6 Reconstruction using (a) 5 and (b) 50 PCA components (see online version for colours)
(a)
(b)
Notes: The left figure is the original shape; the middle figure is the reconstruction using PCA components; the right figure shows the colour-coded differences. The errors are shown in metres.
142 C. Shu et al.
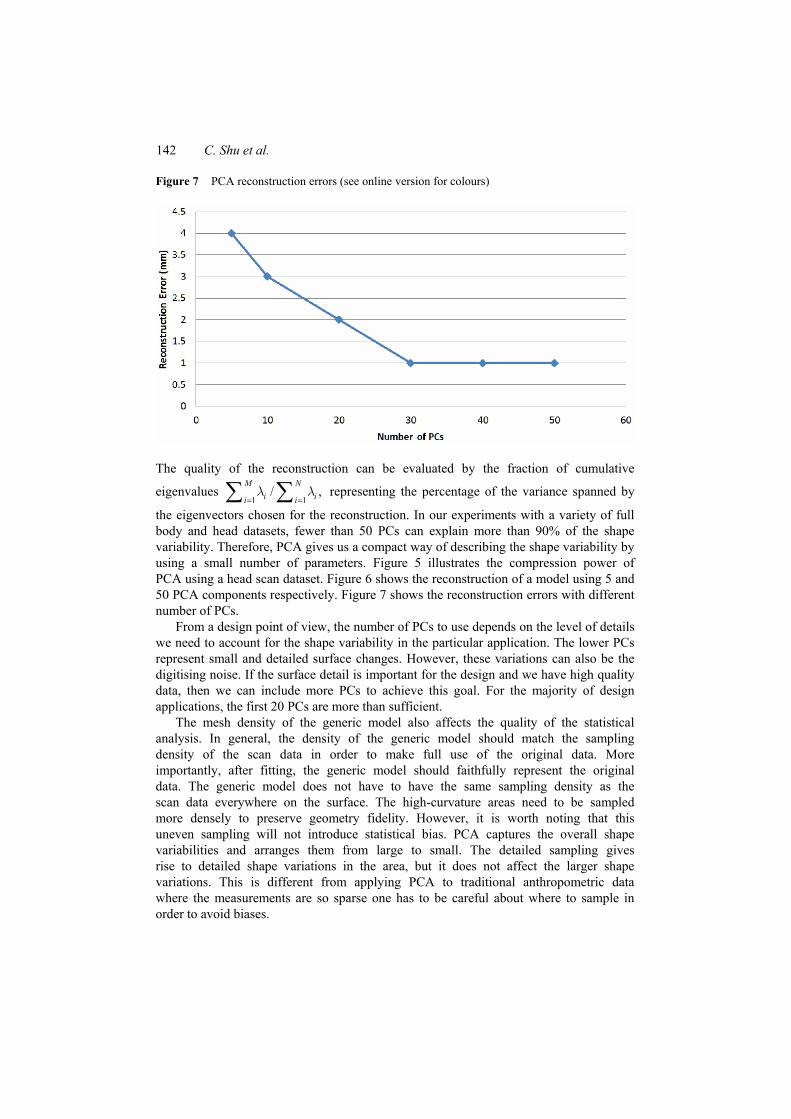
Figure 7 PCA reconstruction errors (see online version for colours)
The quality of the reconstruction can be evaluated by the fraction of cumulative
eigenvalues 1 1
/ ,M N
i ii i= =∑ ∑λ λ representing the percentage of the variance spanned by
the eigenvectors chosen for the reconstruction. In our experiments with a variety of full body and head datasets, fewer than 50 PCs can explain more than 90% of the shape variability. Therefore, PCA gives us a compact way of describing the shape variability by using a small number of parameters. Figure 5 illustrates the compression power of PCA using a head scan dataset. Figure 6 shows the reconstruction of a model using 5 and 50 PCA components respectively. Figure 7 shows the reconstruction errors with different number of PCs.
From a design point of view, the number of PCs to use depends on the level of details we need to account for the shape variability in the particular application. The lower PCs represent small and detailed surface changes. However, these variations can also be the digitising noise. If the surface detail is important for the design and we have high quality data, then we can include more PCs to achieve this goal. For the majority of design applications, the first 20 PCs are more than sufficient.
The mesh density of the generic model also affects the quality of the statistical analysis. In general, the density of the generic model should match the sampling density of the scan data in order to make full use of the original data. More importantly, after fitting, the generic model should faithfully represent the original data. The generic model does not have to have the same sampling density as the scan data everywhere on the surface. The high-curvature areas need to be sampled more densely to preserve geometry fidelity. However, it is worth noting that this uneven sampling will not introduce statistical bias. PCA captures the overall shape variabilities and arranges them from large to small. The detailed sampling gives rise to detailed shape variations in the area, but it does not affect the larger shape variations. This is different from applying PCA to traditional anthropometric data where the measurements are so sparse one has to be careful about where to sample in order to avoid biases.

3D anthropometric data processing 143
4 Data exploration
Designers are often intrinsically visual people. When designing products that fit the human shape, they need intuitive tools to explore the anthropometric data in order to understand the shape variability of the population. The traditional anthropometric data are linear measurements of the body dimensions. They are usually presented in the forms of tables and summary statistics. The only way to visualise this data is perhaps through histograms which give information about the distribution of the data. However, histogram cannot handle dimension higher than three. Furthermore, the variability of the data does not easily translate to the variability of the shape.
Statistical shape analysis works directly on the 3D shape data. As we have seen in Section 3, PCA reduces the complex 3D data to a small number of parameters. By varying the coefficients along the PCA axes we are able to reconstruct any shape in the shape space represented by the dataset [equation (3)]. This provides a new way of exploring and understanding the shape data. Figure 8 shows the first two PCA components, in which the first one corresponds to the height and second one corresponds to the weight. Another PCA component (PCA-14) is shown in Figure 9, which captures the shape changes of the legs. This kind of variation is not easy to find through traditional anthropometric data. Note that not every PCA component has ordinary-life interpretations. In general, these components can be considered as a way of quantifying shapes.
Figure 8 The first two PCs

144 C. Shu et al.
Figure 9 PCA-14: captures the change in the shape of the legs (see online version for colours)
Since the reconstruction of the shape from the linear combination of the eigenvectors can be done efficiently, it is possible to visualise the shape variability in real-time. Modern graphics hardware allows to render the shape change as an animation. Since the human eyes are sensitive to motion, subtle, nonetheless important changes, can be captured in animation.
A demonstration version of a software for exploring shape data variability, called Procrustica, can be downloaded from http://www.humanshape.net. Figure 10 shows the user interface of this programme. The sliding bars on the right panel allows users to change the coefficients of the PCA components and see the shape changes continuously in the display area on the left.
Figure 10 Procrustica, a programme for visualising shape variability (see online version for colours)
As the 3D data are parameterised by a generic model, analysis can be performed on segments of the body such as the head, torso, arms and legs (Xi et al., 2007).

3D anthropometric data processing 145
5 Conclusions
Processing 3D anthropometry data requires special techniques in geometry processing. We have drawn tools from computer vision, computer graphics, and machine learning to solve the problem of correspondence. Statistical shape analysis reveals patterns of changes in the human shape. The detailed and intuitive visualisation gives designers a powerful tool for making decisions. At the same time, these new tools also pose challenges. The PCA components do not always correspond to everyday measurements of shape changes. Effective use of them remains a research problem.
A more challenging problem is analysing human shapes in different postures. This allows the study of the human shape in dynamic environments. Again, the essential problem is establishing a correspondence among the models. This general problem is studied by a large research community (van Kaick et al., 2010). For the case of computing correspondences between human shapes in different postures, several authors have made some initial progresses in this area (Allen et al., 2006; Hasler et al., 2009; Wuhrer et al., 2010, 2011). However, much research remains to be done to find more robust and efficient algorithms.
Acknowledgements
We would like to thank the anonymous reviewers for their useful comments and criticism. Stefanie Wuhrer’s work has partially been funded by the Cluster of Excellence on Multimodal Computing and Interaction.
A preliminary version of this paper was presented at The First Symposium on Digital Human Modeling under the title ‘Geometric and statistical methods for processing 3D anthropometric data’.
References Allen, B., Curless, B. and Popovic, Z. (2003) ‘The space of human body shapes: reconstruction
and parameterization from range scans’, ACM Transactions on Computer Graphics (SIGGRAPH’03), Vol. 22, No. 3, pp.587–594.
Allen, B., Curless, B., Popovic, Z. and Hertzmann, A. (2006) ‘Learning a correlated model of identity and pose-dependent body shape variation for real-time synthesis’, ACM SIGGRAPH/Eurographics Symposium on Computer Animation, pp.147–156.
Amberg, B., Romdhani, S. and Vetter, T. (2007) ‘Optimal step nonrigid ICP algorithms for surface registration’, IEEE Conference on Computer Vision and Pattern Recognition (CVPR 2007).
Ben Azouz, Z., Rioux, M., Shu, C. and Lepage, R. (2004) ‘Analysis of human shape variation using volumetric techniques’, Computer Animation and Social Agents (CASA), pp.197–206.
Ben Azouz, Z., Rioux, M., Shu, C. and Lepage, R. (2006a) ‘Characterizing human shape variation using 3-D anthropometric data’, Visual Computer, Vol. 22, No. 5, pp.302–314.
Ben Azouz, Z., Shu, C. and Mantel, A. (2006b) ‘Automatic locating of anthropometric landmarks on 3D human models’, Third International Symposium on 3D Data Processing, Visualization and Transmission (3DPVT 2006), 13–16 June, Chapel Hill, North Carolina, USA.
Bookstein, F. (1991) Morphometric Tools for Landmark Data: Geometry and Biology, Cambridge University Press, Cambridge, UK.

146 C. Shu et al.
Creusot, C., Pears, N. and Austin, J. (2011) ‘Automatic keypoint detection on 3D faces using a dictionary of local shapes’, Conference on 3D Imaging, Modeling, Processing, Visualization and Transmission.
Dekker, L., Douros, I., Buxton, B. and Treleaven, P. (2001) ‘Building symbolic information for 3D human body modeling from range data’, Proceedings of the third International Conference on 3-D Digital Imaging and Modeling (3DIM’99), pp.292–298.
Dryden, I. and Mardia, K. (1998) Statistical Shape Analysis, Wiley, New York, USA. Hasler, N., Stoll, C., Sunkel, M., Rosenhahn, B. and Seidel, H-P. (2009) ‘A statistical model of
human pose and body shape’, Computer Graphics Forum (Special Issue of Eurographics 2008), Vol. 2, No. 28, pp.337–346.
Johnson, A. (1997) ‘SPIN-images: a representation for 3-D surface matching’, PhD thesis, Robotics Institute, Carnegie Mellon University, Pittsburgh, PA.
Kendall, D. (1984) ‘Shape-manifolds, procrustean metrics and complex projective space’, Bulletin of the London Mathematical Society, Vol. 16, No. 2, pp.81–121.
Kendall, D. (1989) ‘A survey of the statistical theory of shape’, Statistical Science, Vol. 4, No. 2, pp.87–120.
Mochimaru, M. and Kouchi, M. (2000) ‘Statistics for 3D human body forms’, SAE Digital Human Modeling for Design and Engineering, Dearborn, MI.
Mochimaru, M., Kouchi, M. and Dohi, M. (2000) ‘Analysis of 3D human foot forms using the FFD method and its application in grading shoe last’, Ergonomics, Vol. 43, No. 9, pp.1301–1313.
Pauly, M., Mitra, N., Giesen, J., Gross, M. and Guibas, L. (2005) ‘Example-based 3D scan completion’, Symposium on Geometry Processing.
Pearl, J. (1988) Probabilistic Reasoning in Intelligent Systems, Morgan Kaufmann. Robinette, K., Daanen, H. and Paquet, E. (1999) ‘The CAESAR project: a 3-D surface
anthropometry survey’, International Conference on 3-D Digital Imaging and Modeling (3DIM 1999), pp.262–265.
van Kaick, O., Zhang, H., Hamarneh, G. and Cohen-Or, D. (2010) ‘A survey on shape correspondence’, Eurographics State-of-the-art Report.
Wuhrer, S., Ben Azouz, Z. and Shu, C. (2010) ‘Posture invariant description and feature extraction’, IEEE Conference on Computer Vision and Pattern Recognition (CVPR 2010).
Wuhrer, S., Shu, C. and Xi, P. (2011) ‘Landmark-free posture invariant human shape correspondence’, The Visual Computer, Vol. 27, No. 9, pp.843–852.
Xi, P., Lee, W. and Shu, C. (2007) ‘Analysis of segmented human body scans’, Proceedings of the Graphic Interface 2007 Conference, Montréal, Québec, Canada.
Yeh, I., Lin, C., Sorkine, O. and Lee, T. (2011) ‘Template-based 3D model fitting using dual-domain relaxation’, IEEE Transactions on Visualization and Computer Graphics, Vol. 17, No. 8, pp.1178–1190.
Zelditch, M., Swiderski, D., Sheets, D. and Fink, W. (2004) Geometric Morphometrics for Biologists: A Primer, Elsevier, USA.