challenges of african growth - stjórnarráðið | forsíða
TRANSCRIPT

OPPORTUNITIES, CONSTRAINTS, AND STRATEGIC DIRECTIONS
Challenges of African Growth
BENNO J. NDULUWITH LOPAMUDRA CHAKRABORTI,
LEBOHANG LIJANE, VIJAYA RAMACHANDRAN, AND JEROME WOLGIN


CHALLENGES OF
AFRICAN GROWTH

Washington, D.C.
Benno J. Nduluwith
Lopamudra Chakraborti,
Lebohang Lijane,
Vijaya Ramachandran,
and Jerome Wolgin
CHALLENGES OF
AFRICAN GROWTH
Opportunities, Constraints, andStrategic Directions

©2007 The International Bank for Reconstruction and Development / The World Bank1818 H Street NWWashington DC 20433Telephone: 202-473-1000Internet: www.worldbank.orgE-mail: [email protected]
All rights reserved
1 2 3 4 10 09 08 07
This volume is a product of the staff of the International Bank for Reconstruction and Devel-opment / The World Bank. The findings, interpretations, and conclusions expressed in thisvolume do not necessarily reflect the views of the Executive Directors of The World Bank orthe governments they represent.
The World Bank does not guarantee the accuracy of the data included in this work. Theboundaries, colors, denominations, and other information shown on any map in this work donot imply any judgement on the part of The World Bank concerning the legal status of any ter-ritory or the endorsement or acceptance of such boundaries.
Rights and PermissionsThe material in this publication is copyrighted. Copying and/or transmitting portions or all ofthis work without permission may be a violation of applicable law. The International Bank forReconstruction and Development / The World Bank encourages dissemination of its workand will normally grant permission to reproduce portions of the work promptly.
For permission to photocopy or reprint any part of this work, please send a request withcomplete information to the Copyright Clearance Center Inc., 222 Rosewood Drive, Danvers,MA 01923, USA; telephone: 978-750-8400; fax: 978-750-4470; Internet: www.copyright.com.
All other queries on rights and licenses, including subsidiary rights, should be addressed tothe Office of the Publisher, The World Bank, 1818 H Street, NW, Washington, DC 20433, USA;fax: 202-522-2422; e-mail: [email protected].
ISBN-10: 0-8213-6882-6ISBN-13: 978-0-8213-6882-4eISBN-10: 0-8213-6883-4eISBN-13: 978-0-8213-6883-1DOI: 10.1596/978-0-8213-6882-40.1596/978-0-8213-6835-0
Cover design by: Naylor Design. Harry G. Broadman
Library of Congress Cataloging-in-Publication Data Ndulu, B. J.Challenges of African growth : opportunities, constraints, and strategic
directions / Benno Ndulu; with Lopamudra Chakraborti ... [et al.].p. cm.
ISBN 0-8213-6882-61. Africa—Economic conditions—1960– 2. Africa—Politics andgovernment—1960– I. Chakraborti, Lopamudra. II. Title.HC800.N427 2007338.96—dc22
2007002731

v
Foreword xi
Acknowledgments xiii
Executive Summary xv
Abbreviations xxi
1 Facing the Challenges of African Growth: Opportunities, Constraints, and Strategic Directions 1
Poverty in Africa: Largely a Growth Challenge 4Breaking Out of the Low-Growth Syndrome—
A Daunting Task but a Real Possibility 9The Report: An Overview 11Notes 31
2 Africa’s Long-Term Growth Experience in a Global Perspective 33
Evolution 35Benchmarking against Asian Economies 37Diversity across Africa 39Sectoral Composition 53Conclusions 55Notes 56
3 Explaining the African Growth Record: What Appears to Matter Most 57
Sources of Economic Growth: Lessons from Growth Accounting 58
Contents
vi CHALLENGES OF AFRICAN GROWTH
Doing Business in Africa: The Investment Climate—Transaction Costs, Risk, Capacity 66
Indigenous Entrepreneurs and Minority-Owned Firms 75Benchmarking of Growth Conditions in African Countries 78Conclusions 97Notes 97
4 Constraints to Growth 99
Africa’s Unfavorable Endowments: A Constraint to Growth but Not a Predicament 100
Natural Resources—Curse and Potential 116Risks and Uncertainty 118Weak Institutional Capacity 130The Financial Sector as a Constraint to Growth 130Low Savings 136Conclusions 141Notes 142
5 Tackling the Challenges of African Growth 143
Lessons from a Half-Century of Africa’s Growth Experience 145
Changing Contexts and Emerging Opportunities 148The Changing International Economic Environment—
New Opportunities and New Challenges 151Opportunities and Options for Growth Strategies 154Key Strategic Challenges 156Mobilizing Resources for Growth 188Conclusions 199Notes 200
Appendix: Empirical Analysis of Influential Factors of Growth in Africa 203
Estimating the Growth Model 203Influential Factors of Growth and Data 205Results 214Notes 217
Bibliography 219

CONTENTS vii
Index 237
Boxes
2.1 Different Development Strategies—Very Different Results: Mauritius versus Côte d’Ivoire 47
2.2 Contrasting Growth Paths of Two Landlocked, Resource-Rich Countries: Botswana and Zambia 50
4.1 The Demographic Transition and Family Planning in Ethiopia 113
4.2 Country Studies 1285.1 Technology, Adaptation, and Exports:
How Some Developing Countries Got It Right 1675.2 ICT Helping to Improve Financial Services in Africa 1705.3 Banking Sector and Savings Mobilization in Zambia 1925.4 Some Initiatives to Expand Access and Encourage
Enhanced Savings 195
Figures
1.1 Comparative Per Capita Income Growth Paths: Sub-Saharan Africa versus Other Regions 5
1.2 Per Capita Incomes in 2004 Relative to 1960 61.3 Similar Opportunities, Different Strategies,
Different Results 71.4 Analytical Framework of the Growth Model 302.1 Smoothed Average Growth in Real GDP Per Capita:
Sub-Saharan Africa and Other Regions 342.2 Average Growth Rates in Sub-Saharan Africa,
by Income Categories 362.3 Average Per Capita Growth Rates:
Global Distribution 372.4 Smoothed Average Growth in Real GDP Per Capita:
Sub-Saharan Africa, South Asia, and East Asia and Pacific 38
2.5 GDP Per Capita Index—Sub-Saharan Africa and Other Regions, 1960–2004 39
2.6 Smoothed Average Growth in Real GDP Per Capita: Nigeria, Democratic Republic of Congo, Botswana, and Mauritius 40

viii CHALLENGES OF AFRICAN GROWTH
2.7 Growth Rates and Demographic Indicators, by Size 42
2.8 Sub-Saharan Africa’s Smoothed Average Growth in Real GDP Per Capita by Opportunity Groups 46
2.9 Growth Experience of Countries in Sub-Saharan Africa 46
3.1 Energy Costs and Power Outages 683.2 Shares of Firms Owning Generators 693.3 Days to Clear Imports and Exports 703.4 Inspections and Management Time Spent
Dealing with Regulations 703.5 Crime, Unofficial Payments, and Securing
of Contracts 713.6 Cost Structures, Firm-Level Average by Country 733.7 Net and Gross Total Factor Productivity,
Adjusted Prices 743.8 Average Current Size of African Firms by
University Education 763.9 Percentage of Firms Receiving Credit 773.10 Regression-Based Decomposition of
Periodical Growth Rates, SSA, 1960–74 813.11 Regression-Based Decomposition of
Periodical Growth Rates, SSA, 1975–94 823.12 Regression-Based Decomposition of
Periodical Growth Rates, SSA, 1995–2004 823.13 Evolution of Contribution of Policy 963.14 Evolution of Contribution of Shocks 964.1 Sub-Saharan Africa Geographical Distribution 1034.2 Demographic Transition Information: Rate of
Natural Increase 1084.3 HIV Prevalence in Adults in Africa, 2005 1154.4 Age Distribution of Deaths in Southern Africa 1154.5 SSA’s Smoothed Average Growth in Real GDP
Per Capita, by Opportunity Group 1174.6 Inflation Trends: Regional Comparisons, 1971–2004 1194.7 Regional Inflation, 1971–2004 1194.8 Countries in Civil War 1254.9 Financial Development in SSA 133

CONTENTS ix
4.10 Median Spread: A Regional Comparison 1344.11 Access to Finance: Africa Relative to Other Regions 1354.12 Access to Financial Capital 1364.13 Portfolio Allocation Trends 1374.14 Saving Trends: Regional Comparison by Decade 1384.15 Saving Trends in SSA, 1980–2004 1394.16 Savings Decomposition 1405.1 Share of Countries with Competitively Elected
Chief Executives 1515.2 World Trade Trends: Composition of Exports,
1981–2001 1525.3 Developing Countries’ Share of Exports,
1981–2001 1535.4 The Global Competitiveness Index:
Impact of Investment in ICT 1725.5 Education Investment Impact on Competitiveness 174A.1 Smoothed Average Life Expectancy at Birth 206A.2 Demographic Indicators 207A.3 Policy Variables over Time 211A.4 Telephone Lines 212
Tables
1.1 Regional Growth Comparisons 282.1 Growth and Selected Indicators in African
Countries, Categorized by Opportunity Groups 442.2 Predicted Shares of Economic Structure at
Selected Levels of Income Per Capita 543.1 Sources of Growth, by Regions, 1960–2003 603.2 Sources of Growth, Africa, 1960–2003 613.3 Productivity of Investment—Returns 653.4 Contributions of Individual Components of Drivers
of Growth toward Explaining Deviation of SSA’s Predicted Growth Relative to the Sample Mean, EAP, and SAR, 1960–2004 80
3.5 Evolution of Individual Contributions of Drivers of Growth toward Explaining Deviation of SSA’s Predicted Growth Relative to the Sample Mean, EAP, and SAR, by Periods 84
x CHALLENGES OF AFRICAN GROWTH
3.6 Contributions of Various Factors Influencing Growth at the Country Level 86
3.7 Evolution of Contribution to Deviation from Sample Mean at the Country Level 88
4.1 Interregional Comparison of Geographical and Sovereign Fragmentation Indicators 101
4.2 Age Dependency Ratios 1084.3 Socioeconomic Indicators, 2004 1094.4 Fiscal Policy Indicators for Selected Regions 1204.5 Battle Deaths versus Total War Deaths in
Selected African Conflicts 1264.6 Indicators of Financial Development: A Regional
Comparison 132A.1 Regression Results 213

Recent years have seen renewed international attention on Africa, which,
despite recent successes in terms of increases in economic growth, reduced
conflict, expanded political liberalization, and substantial improvements in
governance, remains the continent where poverty is the deepest. It is now
widely accepted that reduction in poverty and achievement of the Millen-
nium Development Goals require further acceleration of economic
growth, especially in those countries with large populations where growth
had been elusive. The experiences of East and South Asia have demon-
strated that sustained, poverty-reducing growth is possible, and these
experiences have been echoed across a number of African countries as
well over the past decade.
This study reviews the past half-century of economic growth in Africa and
elsewhere in the world and distills that experience into a set of policy recom-
mendations for economic practitioners in Africa. Of course, the geographic,
institutional, and historical situations of each of Africa’s 48 countries are very
diverse, so the general principles provided here can only serve as a guideline
for deeper, country-specific analysis of the opportunities for, and challenges
to, accelerated shared growth. Nevertheless, I believe the analysis presented
in this study can help establish the questions and areas of inquiry for practi-
tioners examining this profound and critically important issue in their specific
country setting. The African people deserve a future of increased prosperity
that they have been denied by poor policy choices in the past.
Gobind Nankani
Vice President
Africa Region
Foreword
xi


xiii
This study is the second in a series of regional “Flagship” reports that the
Africa Region is producing on a variety of economic issues to help clarify
opportunities, constraints, and strategic directions for African develop-
ment. It is the product of a team led by Benno J. Ndulu and assisted by
Lopamudra Chakraborti, Lebohang Lijane, Vijaya Ramachandran, and
Jerome Wolgin. Vijaya Ramachandran also prepared the background paper
that became the basis for a major portion of the section on assessing con-
straints to growth at the firm level, and Abdoulaye Tall prepared a short
paper for the sections on conflict and its costs to growth.
The team wishes to thank Gobind Nankani, vice president, Africa
Region, who personally reviewed this book and provided some early guid-
ance for the penultimate chapter on strategic options for growth. The team
also wishes to thank John Page, chief economist, Africa Region, for sub-
stantive guidance and encouragement throughout the preparation of this
work.
This study has benefited from numerous comments, suggestions, and
recommendations at different stages of its preparation. The team would
like to thank in particular the African Economic Research Consortium, the
silent partner in this work, for allowing the team to draw from its very
impressive and in-depth African growth research. Steve O’Connell has
provided unwavering support for the study from its inception and is sub-
stantively present through the joint work on African growth he has done
with the team leader, Benno Ndulu.
Acknowledgments

xiv CHALLENGES OF AFRICAN GROWTH
Very useful inputs were also received from Bank country economists
involved in growth diagnostic work in Africa, who earlier on reviewed the
concept note for this work and were of tremendous help in underpinning
areas of critical importance to the challenge of African growth. In this
regard, the team specifically thanks Victoria Kwakwa, Robert Johann Utz,
Dino Leonardo Merotto, Robert Keyfitz, Mathurin Gbetibouo, Praveen
Kumar, Wilfried Engelke, Douglas Addison, Preeti Arora, Lolette
Kritzinger-van Niekerk, Jos Verbeek, Benu Bidani, Jeni Klugman, Karim
El Aynaoui, Christina Wood, Peter Moll, Emmanuel Pinto Moreira,
Jacques Morisset, Keiko Kubota, and Carlos Cavalcanti.
The team is particularly grateful to the peer reviewers, namely Sudhir
Shetty (director, AFTPM), who also chaired the Bank-wide review meet-
ing for the study; Alan Gelb (director, Development Policy, DECVP),
Roberto Zhaga (chief economic adviser, PREM), Vivien Foster (lead econ-
omist, AFTPI), and Vikram Nehru (director, PRMED), who provided
detailed comments and guidance for revising earlier drafts. Their inputs
have helped hone the focus of the study. The advice and suggestions of
those who attended the review meeting, particularly Demba Ba, Kathie
Krumm, Yvonne Tsikata, and Mark Blackden, plus written comments from
AFR staff, especially Louise Fox and Jorge Arbache, are also acknowledged
with gratitude.
Earlier findings of the study were presented at various forums, in partic-
ular, at a DfID workshop on growth and at Chattam House, both in Lon-
don, and at an AERC Special Senior Policy seminar in Kigali to discuss the
results from the AERC Growth Research project. The constructive recom-
mendations from these meetings have been invaluable.
On the production side, Richard Crabbe and his team have provided
tremendous help for ensuring the efficient production of this book. He advised
on practical issues such as editing, typesetting, printing, and publishing.
Finally, Yanick Brierre and Patricia Bunzigiye deserve special mention
for the time and effort they have devoted in providing administrative sup-
port for the preparation and production of this book. Their efforts ensured
that this work came to a successful conclusion.

This report is one of a series of “Flagship Studies” intended to help clarify
the opportunities, constraints, and strategic directions facing Africa and its
partners as they attempt to accelerate economic growth to reduce poverty
and put Africa on a path toward meeting the Millennium Development
Goals. It is part of the analytic work promised in a plan titled “Meeting the
Challenges of Africa’s Development,” also known as the African Action
Plan (AAP), discussed at the World Bank Board in 2005. The AAP has a
strong focus on increasing shared growth and recommends several actions
by the World Bank that will support accelerating growth. Offering both a
long-term approach and country-specific analysis, the report recommends
learning from history and from diverse experiences to guide country-
growth diagnostic work and strategies for scaling-up growth. The World
Bank’s Africa Region intends to provide further studies in this series that
will examine in much greater depth several of the areas critical to growth.
A study on financial markets has just been published. Another on infra-
structure is being drafted.
Substantively, this report draws lessons from a half-century of growth
experience in Africa and around the world, providing an important reposi-
tory of lessons learned to shape growth strategies in Africa. It is influenced by,
and builds upon, three major studies—The Political Economy of Economic Growth
in Africa, 1960–2000, conducted under the African Economic Research Con-
sortium; Can Africa Claim the 21st Century?, produced collaboratively by the
Executive Summary
xv

xvi CHALLENGES OF AFRICAN GROWTH
World Bank and African partner institutions; and the World Bank’s study,
Economic Growth in the 1990s: Learning from a Decade of Reform, which draws
from in-depth reflection on growth experiences by respected practitioners.
The current report will seek to explain three key issues: (1) the oppor-
tunities and, hence, options for growth available to the diverse range of
African countries; (2) the major constraints to exploiting these opportuni-
ties; and (3) the strategic choices to be made by African governments as
well as by development partners, including the World Bank, in supporting
actions taken by African countries.
The distinguishing characteristic of this study is its long-term perspec-
tive, together with its analysis and description of the African growth expe-
rience from 1960 (the time when most African countries became
independent) to the present. Although there are some commonalities
among countries, the growth experiences are also quite diverse, with a few
countries experiencing consistent long-term growth, a few experiencing
long-term stagnation and decline, and the majority experiencing growth
between 1960 and 1973, decline between 1974 and 1994, and renewed
growth since 1995. This long-term perspective explains the current situa-
tion in which African countries, for the most part, find themselves—low
levels of per capita income and high levels of poverty.
Six countries have more than tripled their per capita incomes between
1960 and 2005; nine countries have per capita incomes equal to or less
than where they started in 1960; and the rest have seen some net improve-
ment, but not enough to make a real dent in poverty levels. Many coun-
tries seen as fast growers in 1970, such as Côte d’Ivoire, flamed out and
have found themselves stagnating or declining during the past 30 years.
The critical point is that frequently, over the long term, the tortoise beats
the hare. Steady progress and consistent performance, in good times as in
bad, are the watchwords. Many African countries made policy choices in
1974 that continue to haunt them today, whereas a few are experiencing
the blessings of different choices made at the same time.
The report draws six key lessons to inform the growth strategies in Sub-
Saharan Africa:
• African countries’ growth experience is extremely varied and episodic. From a
regional strategic perspective, addressing two challenges peculiar to the
region is the key to success—the slow growth of large countries and the
extreme instability of growth across a large number of African coun-
tries. Countries with large populations, such as the Democratic Repub-

EXECUTIVE SUMMARY xvii
lic of Congo, Ethiopia, Nigeria, and Sudan, will have to grow more rap-
idly and on a more sustained basis to improve the livelihood of a “typi-
cal” African and to generate regional traction through positive spillover
effects, similar to the experiences in Southern Africa and East Asia.
Another cross-cutting challenge for the region is how to best manage
responses to shocks, particularly in the resource-rich countries, in
which their fortunes are currently closely tied to the fortunes of key
minerals in the world market.
• Although lower levels of investment are important for explaining Africa’s slower
growth, it is the slower productivity growth that more sharply distinguishes
African growth performance from that of the rest of the world. Investment in
Africa yields less than half the return measured in growth terms than in
other developing regions. This situation clearly calls for looking beyond
the creation of conditions that would attract new investors to more
explicitly pursuing measures that help to raise productivity of existing
and new investment. These include reducing transaction costs for pri-
vate enterprise, particularly indirect costs; supporting innovation to
take advantage of new technological opportunities; and improving skills
and institutional capacity to support productivity growth and competi-
tiveness. African countries and populations are still highly dependent
on agriculture for food, exports, and earning of income in general. Pro-
ductivity in this sector lags far behind the phenomenal progress made in
Asia and Latin America, and it should be a key target for raising overall
productivity of African economies.
• Consistent with much of the cross-country growth analysis, evidence from the
research reviewed earlier suggests that policy and governance matter a great deal
for growth. Taking a half-century of African growth experience as a
whole and controlling for differences in the composition of opportuni-
ties, the impacts of poor policy have been shown to typically account for
between one-quarter and one-half of the difference in predicted growth
between African and non-African developing countries. However, the
evidence also suggests that the importance of policy in explaining the
growth differential between African countries and others may have
waned since the 1990s as a result of major reforms implemented in the
region, which have moved policy performance in African countries
much closer to the global average. Thus, whereas it is imperative for
countries to identify and address other binding constraints, sustaining

xviii CHALLENGES OF AFRICAN GROWTH
these gains in the improvement of the policy environment will have to
be a permanent feature of any growth strategy adopted by a country. In
particular, it means maintaining durable macroeconomic stability and
continued propping up of efficient market functioning.
• Overcoming disadvantages arising from geographic isolation and fragmentation,
as well as natural resource dependence, will be necessary if Africa is to close the
growth gap with other regions. Estimates show that taking actions to com-
pensate for these disadvantages may facilitate closing up to one-third of
the growth gap with other developing countries. With much higher
proportions of countries and populations in Africa being landlocked and
resource rich, it is necessary to compensate for these disadvantages, pri-
marily by closing the infrastructure gap and better managing and using
resource rents.
• Growth of trading partners’ economies has a very powerful influence. The key
transmission mechanisms are trade and capital flows: these require
greater openness, strengthening capabilities for taking advantage of the
rapid growth in the global markets, and improving the investment cli-
mate to make African countries better destinations for global capital than
in the past. On the side of trade, evidence shows that integration with
global markets is associated with higher growth, underpinning the need
for growth strategies to emphasize scaling up and diversifying exports.
Enhanced competitiveness and reduced barriers to trade are the two crit-
ical areas of action. It is important to note that although concerns with
border trade policies and facilities (for example, port capacity and effi-
ciency) are still crucial, increasingly, constraints such as infrastructure,
standards, and access to information have become much more binding.
A core part of any growth strategy, therefore, will need to target reduc-
ing the costs of transacting trade—particularly reducing supply chain
costs—as well as the cost of trade processes.
• The analysis points to a very large role played by the delayed demographic tran-
sition in Africa in explaining its relatively slower growth performance. In all the
empirical studies of the sources of growth differences, the demographic
variables consistently predict two-thirds of the observed difference
between average growth in Sub-Saharan Africa and other developing
regions. Two types of consequences from this delayed transition are par-
ticularly important. The first, and probably the biggest, challenge is the

EXECUTIVE SUMMARY xix
uncharacteristically high level of age dependency, with its implications
on fiscal and household/parental pressure for taking care of the over-
whelming number of the young. The second relates to the rapid growth
of the labor force, potentially a positive driver of growth but also possi-
bly a negative force if employment opportunities do not keep pace. The
latter concern relates to the growing potential instability from rapidly
rising youth unemployment. Whereas the strategy needs to address the
fundamentals of the slow demographic transition, such as how to speed
up a reduction in fertility, appropriate actions are also needed to
increase employability of youth and expand opportunities to engage in
a growing private sector at home.
This analysis then leads to a set of four specific pillars—areas in which
action is needed to accelerate growth. These four pillars are critical but not
comprehensive. They are as follows.
The first pillar, the investment climate, mainly focuses on reducing
indirect costs to firms (which are generally infrastructure related), with
energy and transportation topping the list of major impediments, and
reducing and mitigating risk, particularly those risks relating to security of
property, such as poor adjudication of disputes, crime, political instability,
and macroeconomic instability. Although effort in individual countries is
the focal point of action, we also suggest pooling efforts to develop cohe-
sive investment areas by coordinating investment promotion, coordinating
policy, improving security, and increasing connectivity.
The second pillar is infrastructure, mainly targeting transactions costs
in the production of goods and services. Transportation and energy make
up the largest proportion of indirect costs for businesses, weighing heavily
on the competitiveness of firms in most African countries in which invest-
ment climate surveys were conducted. Particular focus would be on how
to reduce the high costs associated with the remoteness of landlocked
countries to facilitate trade with neighbors, as well as with the rest of the
world. It is clear that countries will need to look beyond individual coun-
try borders and adopt a regional approach to coordinate cross-border infra-
structure investment, maintenance, operational management, and use
(for example, power pooling) to lower costs.
The third pillar is innovation, primarily emphasizing investment in
information technology and skill formation (higher education) for
enhanced productivity and competitiveness. The potential comparative

xx CHALLENGES OF AFRICAN GROWTH
advantage of low wages in Africa can be nullified by low productivity. Sur-
veys of investors show that labor is not cheap where productivity is low.
Information and communications technology (ICT) is now the main driver
for productivity growth. Strong empirical evidence shows that investment
in ICT and in higher education boosts competitiveness, making both key
parts of the growth agenda. As late starters, African countries can make a
huge leap forward and beyond antiquated technology by exploiting the
ICT technological advantages.
The fourth pillar is institutional capacity. The results from the invest-
ment climate assessment surveys and analysis for the 2005 World Develop-
ment Report identify costs associated with contract enforcement difficulties,
crime, corruption, and regulation as being among those weighing most
heavily on the profitability of enterprises. The main focus of action here
would be partly to strengthen the capacity of relevant public institutions
for protecting property rights and partly to strengthen scrutiny of, and
accountability for, public actions. Building institutional capacity entails
strengthening individual competencies, organizational effectiveness, and
rules of the game. Under this pillar, particular attention would be paid to
capacity and space for scrutiny of public action, mainly within a frame-
work of a strong domestic accountability system, and capacity to clarify
and protect property rights to spur private enterprise. The key strategic
areas of action, therefore, include enforcement of contracts (for example,
commercial courts); exercise of voice as an agency of restraint, with
enhanced involvement of civil society, media, and parliament; enhanced
revenue transparency in resource-rich countries; and prevention of cor-
ruption as a country-driven agenda, including checks and balances.
Applying these strategies in a specific country context is beyond the
scope of this study. Each country faces its own challenges and opportuni-
ties. Each country has to work within its own historical and geographical
resources and constraints. Dealing with these specific situations is a subject
of specific analysis and beyond the scope of a generalized study such as this
one. Nevertheless, we hope that the ideas and approaches raised here will
enable analysts and policy makers at the country level to approach their
particular challenges with a more informed sense of what may be impor-
tant and of what has worked in the past in other situations.

xxi
AERC African Economic Research Consortium
DRC Democratic Republic of Congo
ECOSOC United Nations Economic and Social Council
EITI Extractive Industries Transparency Initiative
FDI foreign direct investment
FOB free on board
ICT Information and communications technologies
IFC International Finance Corporation (of the World Bank
Group)
LDCs less developed countries
MDGs Millennium Development Goals
MFI microfinance institutions
NEPAD New Partnership for Africa’s Development
ODA official development assistance
OECD Organisation for Economic Co-operation and
Development
PPP purchasing power parity
RTS remote transactions system (smart cards)
SADC Southern African Development Community
TFR total fertility rate
WAPP West Africa Power Market Development Project
Abbreviations

This report is one of a series of “Flagship Studies” intended to help clarify
the opportunities, constraints, and strategic directions facing Africa and its
partners as they attempt to accelerate economic growth in order to reduce
poverty and put Africa on a path toward meeting the Millennium Devel-
opment Goals (MDGs). The report is part of the analytic work promised in
the plan titled “Meeting the Challenges of Africa’s Development” (World
Bank 2005e), also known as the African Action Plan (AAP). The AAP has
a strong focus on increasing shared growth. By undertaking a long-term
approach and country-specific analysis, this report combines learning from
history and from diverse experiences to guide country growth diagnostic
work and strategies for scaling up growth. It is the intention of the World
Bank’s Africa Region to provide further studies in this series that will
examine in much greater depth several of the areas critical for growth. A
study on financial markets was recently published. Another on infrastruc-
ture is currently being drafted.
Substantively, this report draws lessons from a half-century of growth
experience in Africa and around the world, providing an important reposi-
tory of lessons learned to shape growth strategies in Africa. It is influenced
by, and builds upon, three major studies—The Political Economy of Economic
Growth in Africa, 1960–2000 (Ndulu et al., eds. forthcoming), conducted under
the African Economic Research Consortium (AERC); Can Africa Claim the 21st
Century? (World Bank 2000a), produced collaboratively by the World Bank
CHAPTER 1
Facing the Challenges of African Growth:
Opportunities, Constraints, andStrategic Directions
1
2 CHALLENGES OF AFRICAN GROWTH
and African partner institutions; and Economic Growth in the 1990s: Learning
from a Decade of Reform (World Bank 2005d), which draws from an in-depth
reflection on growth experiences by respected practitioners.
The AERC anchored a major African growth project, which is just con-
cluding with a two-volume series to be published by Cambridge University
Press. With 26 country studies covering more than 75 percent of the region’s
population, this project is by far the most comprehensive country-based
assessment of Africa’s growth experience to date. A number of country teams
had access to excellent recent country studies from the USAID-supported
project Equity and Growth through Economic Research (EAGER) or the
Emerging Africa project or both (Berthelemy and Soderling 2001, 2002).
Both sets of studies contain sustained treatments of growth experiences at
the country level and make in-depth use of cross-country literature.
Country case studies focused on two questions. First, how did policies
and shocks combine to produce the observed growth outcomes?
Researchers developed microeconomic evidence linking policies and
shocks to the resource allocation decisions of households and firms, and
particularly to the scale and ex ante efficiency of investment in human and
physical capital. Second, why were these policies chosen? Researchers
gathered information on the beliefs of the political elite, the interests to
which they responded, and the institutions through which political com-
petition was mediated (Ndulu and O’Connell 2006a).
The two major World Bank studies of growth, Can Africa Claim the 21st
Century? (World Bank 2000a) and Economic Growth in the 1990s (World
Bank 2005d), present a good mix of analytical and policy experience
insights about what matters most for growth. Can Africa Claim the 21st Cen-
tury? focused on four pillars: (1) improving governance and resolving
conflict, (2) investing in people, (3) increasing competitiveness and diver-
sifying economies, and (4) reducing aid dependency and strengthening
partnerships. In addition to building upon the many points emphasized in
the study, the current report emphasizes strategies that are largely part of
the second and third pillars, such as investing in tertiary education, har-
nessing skills for innovation, and reducing behind-the-border barriers to
scaling up and diversifying exports.
The messages emerging from Economic Growth in the 1990s emphasize the
importance of country-specific growth diagnostics in identifying binding
constraints and what is needed to relieve them. This approach can best be
summarized by the following quote from the foreword of the report:

FACING THE CHALLENGES OF AFRICAN GROWTH 3
The central message is that there is no unique universal set of rules.
Sustained growth depends on key functions that need to be fulfilled
over time: Accumulation of physical and human capital, efficiency in
the allocation of resources, adoption of technology, and the sharing
of the benefits of growth. Which of these functions is the most criti-
cal at any given point in time, and hence which policies will need to
be introduced, which institutions will need to be created for these
functions to be fulfilled, and in which sequence, varies depending on
initial conditions and the legacy of history. (World Bank 2005d, xiii)
That spirit infuses this current report, particularly in its discussion of the
options and a country’s process of making strategic choices.
The current report will seek to answer three key questions: (1) What
are the opportunities and, hence, options for growth available to the
diverse range of African countries? (2) What are the major constraints to
exploiting these opportunities? (3) What are the strategic choices to be
made by African governments, as well as by development partners, includ-
ing the Bank, in supporting actions taken by African countries?
It is important to emphasize up front the diverse history, opportunities,
and current growth conditions in different African countries, and how
these make any growth strategy, first and foremost, a country-specific task.
This has become much more pertinent as Africa’s income and policy land-
scape has become significantly more diverse in the past decade and a half.
There are now 13 middle-income countries in Sub-Saharan Africa, which
although they host only 13 percent of total Sub-Saharan Africa popula-
tion, account for 66 percent of all incomes earned in the region. Seven of
these middle-income countries are in the lower-middle-income country
group1 (per capita incomes between $826 and $3,255), and the other six
are in the upper-middle-income country group.2 With the exception of
South Africa and Mauritius, none of the others were in this category in
1960. Out of the 13 middle-income countries, 7 have acquired their cur-
rent status largely on account of their mineral wealth, including oil. Not all
oil or other mineral producers, however, have progressed to this group.
For example, Nigeria, Sudan, and Zambia remain low-income countries.
The rest of the countries (35), which host 87 percent of all Sub-Saharan
Africans, are in the low-income country category and account for one-
third of all income generated in the region. The diversity of growth per-
formance among these is also striking, as we will elaborate later.

4 CHALLENGES OF AFRICAN GROWTH
Poverty in Africa: Largely a Growth Challenge
Poverty is increasingly assuming an African face, and eradicating it has
become a predominantly African challenge. Although the region currently
accounts for only 10 percent of the world’s population, it now accommo-
dates 30 percent of the world’s poor. The world as a whole has made remark-
able progress in reducing extreme poverty over the past three decades,
cutting it by nearly two-thirds between 1970 and 2000. In contrast, the
trend in Sub-Saharan Africa has been in the opposite direction, increasing
from 36 percent of the population in 1970 to 50 percent in 2000. As a result,
one in two Africans (or 300 million people) is poor, spending less than $1 a
day on basic necessities of life. This proportion is twice as high as the world
average, and the number of poor is twice as high as it was in 1970.
Africa’s slow and erratic growth performance, particularly when com-
pared with the other developing regions, has been identified as the single
most important reason it is lagging in eradicating poverty. Already by the
1950s, African incomes, which had gained considerable ground in rela-
tive terms since 1913, had begun to diverge markedly from incomes else-
where in the developing world (Maddison 2001). This divergence increased
sharply when African populations completely missed out on the economic
transformation that took place in the developing world—particularly in
Asia—in the second half of the 20th century (Ndulu and O’Connell 2006a).
For the 45 years since 1960, Africa’s per capita income grew at about
one-fifth of the average rate for other developing countries (0.5 percent
versus 2.5 percent). Although in 1960, per capita incomes for Africa and
East Asia were virtually the same, as a result of this growth difference, by
2004 the gross domestic product (GDP) per capita in East Asia was five
times higher than that in Africa (figure 1.1). This is similar to Ndulu and
O’Connell’s (2006a) observation: when measured in purchasing power
parity (PPP)–adjusted terms, in 1960 African incomes per capita were more
than two-thirds of those of the East Asia and Pacific; by the end of the 20th
century, African incomes were less than one-fourth. Data also suggest a
sharper divergence of incomes between African and non-African popula-
tions than between African and non-African countries. The larger diver-
gence is mainly because of the relatively rapid growth of very populous
countries such as China, India, and Indonesia in Asia. In contrast, the large
countries in Africa, including the Democratic Republic of Congo, Ethiopia,
Sudan, and Nigeria, have on average grown more slowly than smaller ones.

FACING THE CHALLENGES OF AFRICAN GROWTH 5
The growth experience is also quite diverse within Africa. A look at
long-term trends shows how countries have distinguished themselves in
terms of how much their income per capita has grown over the 45-year
period. Figure 1.2 depicts the wide variation in the progress made by 40
African countries for which we have complete data. Each country’s
progress in per capita income since 1960 is measured by the ratio of per
capita income in 2004 to that in 1960 (in 1996 international dollars). One
group’s (nine countries) income per capita has actually regressed relative
to the levels in 1960.3 Surprisingly, only three among these are countries
that have suffered from prolonged conflict (Angola, Sierra Leone, and the
Democratic Republic of Congo). The rest appear to have had long periods
of very slow growth or to have suffered prolonged crises as they struggled
to climb out of the shocks suffered during the late 1970s.
Several of the middle income countries experienced rapid growth
through a large part of the 45-year period, ending up with per capita
incomes several times the initial 1960 levels. The rest of the countries are
FIGURE 1.1Comparative Per Capita Income Growth Paths: Sub-Saharan Africa versus Other Regions
Sub-Saharan Africa East Asialow-income countries
181
990
209
0
200
400
600
800
1,000
1960 1970 1980 1990 2000
year
GD
P pe
r cap
ita in
dex
Sources: World Development Indicators (WDI) 2006, Penn World Tables (PWT) 6.1 (Heston, Summers, and Aten 2002), and GlobalDevelopment Network (GDN) 1998.
Note: PPP = purchasing power parity. Index for 1960 = 100 (1996 PPP $).

6 CHALLENGES OF AFRICAN GROWTH
bunched in a narrow range between stagnation (ratio of 1) and a doubling
of income per capita over a 45-year period—a relatively low achievement
by global standards. Most of these experienced economic stagnation for
two decades between the mid-1970s and mid-1990s, usually after
respectable growth performance in the previous decade and a half. For
countries like Uganda and Ghana, rapid growth during the past 15 years
have enabled them to more than recoup the severe losses in income suf-
fered during the previous two decades. As expected, differences in average
growth rates match the differences in the progress made in terms of per
capita incomes.
What is also striking is that countries with very similar opportunities also
have very different growth experience and outcomes, depending on the
strategies pursued and the policy disposition adopted. Figure 1.3 presents
AGO
BDIBEN
BFA
BWA
CAF
CIV
CMR
COG
COM
CPV
ETH
GAB
GHAGIN
GMB
GNB
KEN
LSO
MDG
MLI
MOZ
MRT
MUS
MWI
NAM
NER
NGARWA
SDN
SEN
SLE
SYC
TCDTGO
TZA
UGA
ZAF
ZAR
ZMB
�2.00
0.00
2.00
4.00
6.00
aver
age
grow
thra
te, 1
960–
2004
0.00 2.00 4.00 6.00 8.00 10.00
ratio of per capita income in 2004 to per capita income in 1960
Sources: World Bank WDI 2006; PWT 6.1 (Heston, Summers, and Aten 2002); and GDN 1998.
Note: AGO = Angola; BEN = Benin; BDI = Burundi; BFA = Burkina Faso; BWA = Botswana; CAF = Central African Republic; CIV = Côted’Ivoire; CMR = Cameroon; COG = Congo, Rep. of; COM = Comoros; CPV = Cape Verde; ERI = Eritrea; ETH = Ethiopia; GAB = Gabon;GHA = Ghana; GIN = Guinea; GMB = Gambia, The; GNB = Guinea-Bissau; GNQ = Equatorial Guinea; KEN = Kenya; LSO = Lesotho;MDG = Madagascar; MLI = Mali; MOZ = Mozambique; MRT = Mauritania; MUS = Mauritius; MWI = Malawi; NAM = Namibia; NER= Niger; NGA = Nigeria; RWA = Rwanda; SDN = Sudan; SEN = Senegal; SLE = Sierra Leone; STP = São Tomé and Principe; SWZ =Swaziland; SYC = Seychelles; TCD = Chad; TGO = Togo; TZA = Tanzania; UGA = Uganda; ZAF= South Africa; ZAR = Congo, Dem. Rep.of; ZMB = Zambia; ZWE = Zimbabwe.
FIGURE 1.2Per Capita Incomes in 2004 Relative to 19601996 international $

FACING THE CHALLENGES OF AFRICAN GROWTH 7
FIGURE 1.3Similar Opportunities, Different Strategies, Different Results
15,441
3,084
1,606
Côte d’Ivoire
1,6240
5,000
10,000
15,000
1960 1970 1980 1990 2000
year
a. Côte d’Ivoire and Mauritius
b. Botswana and Zambia
inco
me
per c
apita
Mauritius
0
2,000
4,000
6,000
8,000
10,000
Botswana
1,167
984
902
8,936
1960 1970 1980 1990 2000
year
inco
me
per c
apita
Zambia
Source: WDI 2006, PWT 6.1 (Heston, Summers, and Aten 2002); and GDN 1998.
Note: Income per capita is in 1996 international dollars, PPP adjusted.

8 CHALLENGES OF AFRICAN GROWTH
two examples of very striking contrasts of growth paths between Botswana
and Zambia, both landlocked, resource-rich countries, and between Mauri-
tius and Côte d’Ivoire, both coastal, resource-poor countries and initially
both primarily commodity dependent. The two stories are elaborated in
chapter 2, but we mention it at this stage to show how differences in the
long-term strategies resulted in the countries exploiting similar opportuni-
ties in different ways; thus, Botswana and Mauritius ended up being upper-
middle-income countries, whereas Zambia’s and Côte d’Ivoire’s per capita
incomes have hardly progressed relative to their 1960 levels.
The past decade and a half has seen a particularly sharp increase in the
diversity of growth performance and indeed in the way countries have
positioned themselves for the future. Thirteen African countries, though
still in the low-income group, have sustained annual growth rates exceed-
ing 5 percent for more than a decade now, and they have set the ground-
work for faster and more diversified growth in the future. The challenge for
this group of countries is to harness opportunities for increasing growth
rates to the 7 percent or higher needed for achieving the Millennium Devel-
opment Goals (MDGs). Other countries, such as Somalia and Liberia, are in
conflicts or are just emerging from them, and typically have lost significant
ground in terms of income levels relative to the early 1960s. For the coun-
tries that have experienced limited success, the challenge is to learn from
the experiences of higher-growth countries about what works and what
does not, and to implement the changes needed to get growth started.
These growth differentials are also reflected in the differences in the sta-
tus of human development. For example, Ndulu and O’Connell (2006a)
show that within Sub-Saharan Africa, a 1 percent increase in the long-
term growth rate of real GDP per capita was associated with an increase in
an index of cumulative human development of nearly one-half percent.
Table 1.1, at the end of this chapter, provides a snapshot comparison of
human development, first at the outset of the 1960–2004 period and then
at the end. With the exception of the primary enrollment rate, which was
already high outside of Africa in the early 1960s, Africa has fallen further
behind the rest of the developing world.
However, the shortfall was not as severe for nonincome measures as it
was for income poverty, partly reflecting the relatively greater focus of
national strategies and development assistance on human development in
the 1970s and again in the 1990s. The latter phase followed the steep ero-
sion of the gains in social development during the 1980s, due primarily to
FACING THE CHALLENGES OF AFRICAN GROWTH 9
the failure to raise and maintain the growth of per capita incomes neces-
sary for sustaining the earlier achievements. By 2004, Africa exceeded the
level of primary enrollment rate that had prevailed in other developing
regions in 1960. However, the other human development indicator, life
expectancy at birth, was less than the level prevailing in other developing
regions in 1962 (the beginning year), primarily due to the massive AIDS
problem crippling African countries in recent times.
There is also a close link between income and another dimension of
poverty preponderant in Africa—undernutrition. A recent International
Food Policy Research Institute study on the causal relationship between
income and undernutrition concludes that sustained income growth can
produce a sizable reduction in undernutrition (Haddad et al. 2002). The
study estimates, for example, that a sustained 2.5 percent growth in per
capita income maintained over the next decade would reduce undernutri-
tion by a range of 27 percent to 34 percent by 2015, depending on what
happens to community and household infrastructure.
A growing body of evidence confirms that it is not simply higher growth,
but higher shared growth, that is more effective in accelerating poverty
reduction. While there is wide variation across countries in this relation-
ship, there is undeniable evidence that inequality has a major influence on
the efficacy of growth in reducing poverty. For example, a typical (median)
country that experienced both growth in the average living standards and
falling inequality was able to reduce poverty seven times faster than one
that experienced growth with rising inequality (Ravallion 2001). This rela-
tionship also holds for countries suffering declines in living standards.
Although this report will not focus on the distributional consequences
of growth, there is a need to pay greater attention to this dimension of
poverty reduction to complement the impact of accelerating growth, par-
ticularly by enhancing the income-earning opportunities for the poor more
than for other income-earning segments, or by enabling their greater par-
ticipation in the growth process.4
Breaking Out of the Low-Growth Syndrome—A Daunting Task but a Real Possibility
There is no doubt that the growth challenges faced by African countries
are daunting. However, they are not insurmountable. The experience of

10 CHALLENGES OF AFRICAN GROWTH
Asian countries over the past three and a half decades, in particular, shows
that countries can break out of the poverty trap, embark on sustained
growth, and experience rapid gains in living standards. More recently,
Asian countries have also been able to overcome a financial crisis and
resume robust growth.
Africa’s own record provides similar examples. Mauritius, Botswana,
and the Seychelles have maintained per capita income growth rates above
3 percent for nearly four decades, allowing them to make major strides in
improving living standards and placing them in the group of middle-
income countries. Sub-Saharan Africa as a whole experienced quite robust
growth between 1960 and 1973, when its per capita income grew at an
annual average rate of nearly 3 percent, and it is capable of regaining that
pace of economic progress, as the recent resumption of rapid growth in the
region has shown. In 2005, 17 countries in Sub-Saharan Africa were grow-
ing at average rates exceeding 5 percent annually. Several others have
shown themselves to be capable of short spurts of high growth. The chal-
lenge for them is to sustain such a pace for longer periods.
As late starters, African countries have a possibility of accelerating the
pace of economic progress, provided they can create the right conditions to
exploit the advantages information-based technology offers to enhance
productivity and competitiveness and learn lessons from successful growth
experiences. The Global Competitiveness Report, 2005–2006 (WEF 2006) pres-
ents striking evidence to conclude that investment in higher education and
in information and communications technology (ICT) boosts competitive-
ness. Countries across the world seem to have sharply distinguished them-
selves in these terms.
Starting late also has its disadvantages. In particular, Asia’s recent success
presents a huge challenge to the competitiveness of Africa. Countries in the
region will have to learn in the face of intense competition. As we will see in
greater detail later in this report, several African firms already have shop-
floor costs that are comparable to or competitive with those in China, but
they quickly lose that advantage to huge differences in indirect costs, largely
infrastructure related. With appropriate investments and improvement in
infrastructure services, such a gap can be closed. Indeed, a reduction in indi-
rect costs and improvement in skills, combined with lower-cost labor, would
enable African countries to compete more effectively in the global market.
The difficulty most countries will face in getting started on a high-
growth path partly relates to the wide range of constraints they face, given
FACING THE CHALLENGES OF AFRICAN GROWTH 11
their limited fiscal space and institutional capacity. The challenge is made
more daunting by the need for a big push to offset or mitigate the disad-
vantages of Africa’s unfavorable endowments or to break out of apparent
poverty traps. As more countries attain prosperity, however, the power of
example and emulation will naturally spread, underscoring the impor-
tance of positive regional spillover effects and the need to exploit cross-
country strategic complementarities in the development agenda.
Leadership, too, is crucial for success. Recent research demonstrates the
importance of leadership in achieving and sustaining growth. Glaeser et al.
(2004) find that in an initially poor economy, economic growth since the
1960s has, to a significant extent, been a consequence of having the right
leader. The authors establish that in the post-1960 growth record, the
impact of leaders has been huge and widely dispersed, implying that some
leaders have been associated with rapid growth, while others have not.
They show that good leaders accumulate capital, avoid wars, and are
rewarded with longer tenure, particularly in countries with higher educa-
tional achievements. Using the Indian post-1980 growth experience,
Rodrik and Subramanian (2004) demonstrate the importance of the lead-
ership’s attitudinal disposition toward markets and business in influencing
growth in a country context. Jones and Olken (2004), citing Easterly et al.
(1993), find robust empirical evidence that national leaders, particularly in
autocratic settings, matter in explaining shifts in growth. They do so either
directly, by influencing the policy environment, or indirectly, by shaping
institutions (Ndulu 2006a). Though the occurrence of good leadership is
still widely shown to be a matter of chance, increasingly, analytic work is
pointing toward the importance of political competition, transparency, and
strong domestic accountability, not only in raising the chances of having
good leadership emerge, but also in sustaining it.
The Report: An Overview
Africa’s slow growth over the second half of the 20th century is accounted
for by two primary factors: a relatively low rate of capital accumulation,
and a low productivity growth rate for the investments that are made.
Slightly less than half of Africa’s growth difference with the other develop-
ing regions is due to slower accumulation of physical capital; slightly more
than half is accounted for by the slower growth in productivity. Invest-

12 CHALLENGES OF AFRICAN GROWTH
ment levels since the 1960s have remained relatively low in Africa, with
their share of GDP averaging only half that in the rest of the developing
world. Furthermore, for similar levels of investment, African economies
have on average achieved only one-third to one-half of the growth
achieved in other developing regions.
The analysis of the sources of growth, discussed in greater detail in chap-
ter 3, points to the central role of poor investment incentives, including
low returns. A substantial part of the report will therefore explore three
sets of constraints that are behind poor incentives for accumulation and
relatively slow productivity growth in the region: geography, demography,
and policy and institutions.
The first set are constraints that are part of Africa’s endowments—long
distances from markets, tropical climates and soils, small markets, few nav-
igable rivers, and so forth. More than 90 percent of Sub-Saharan Africa lies
within the tropics, where the burden of disease is high and negatively affects
life expectancy, human capital formation, and labor force participation
(Artadi and Sala-i-Martin 2003). This compares to 3 percent of Organisa-
tion for Economic Co-operation and Development (OECD) countries and
60 percent of East Asia. Sub-Saharan Africa is highly fragmented—48 small
economies with a median GDP of $3 billion (Wormser 2004). On average,
each country shares borders with four countries, often with different trade
and macroeconomic policy regimes (table 1.1). Forty percent of the popu-
lation lives in landlocked countries with high transportation costs and poor
trade facilitation. These constraints cannot be changed, but they can be
compensated for through public and private actions, such as improving
infrastructure to effectively reduce distances or integrate markets, and
introducing antimalaria programs to contain the tropical disease that
wreaks havoc on life expectancy and saps strength from the labor force.
The second set of constraints relates to Africa’s slow demographic transi-
tion, which has put considerable pressure on public and private investable
resources. Demographic transition began late in Africa and is proceeding at
a slower pace than that experienced in other regions of the world. Fertility
rates began declining in Africa around the mid-1980s, compared to the
1950s for Latin America and 1960s for Asia, and rates appear to be proceed-
ing more slowly than in the other regions (Lucas 2003). Uncharacteristi-
cally high levels of age dependency have created fiscal and household
pressure to care for the overwhelming number of the young (as well as
achievement of the MDGs). The rapid increase in the labor force, although

FACING THE CHALLENGES OF AFRICAN GROWTH 13
potentially a positive contributor to growth, can turn negative if employ-
ment opportunities do not keep pace, leading to instability from agitation
by the rapidly rising numbers of unemployed youth. Although measures
can be taken to help accelerate the demographic transition, the changes in
basic demographics are likely to remain slow relative to the medium-term
frame of growth outcomes considered here. Therefore, efforts to accelerate
reductions in fertility will work only with complementary, carefully consid-
ered measures to compensate for some of the consequences of the delayed
demographic transition, such as paying particular attention to enhancing
employability of youth through vocational training and job creation. This is
an area where much more analytical and policy attention is needed.
The third set of constraints is largely historical, institutional, or policy
related and can be acted upon in the context of public policy. These con-
straints affect investment incentives by reducing risk-adjusted returns to
investment and hence raising the hurdle rates for those seeking to invest
in the region; by raising transaction costs affecting profitability of enter-
prises and competitiveness of products; and by limiting absorption and
constraining productivity growth due to capacity shortfalls.
The scope of action is largely in the policy sphere. We emphasize in this
report two dimensions of policy action: avoiding policy distortions (“sins of
commission”) and addressing the issue of underprovision of public goods
to support the growth process (“sins of omission”). The first dimension
includes actions needed for sustained macroeconomic stability, mainte-
nance of a prudent exchange rate policy to support export-led growth, and
improved market efficiency to spur private sector initiatives and enter-
prise. The second dimension includes ensuring good governance and
bureaucratic efficiency and the effective provision of those goods and serv-
ices that the private sector alone would not adequately provide, such as
infrastructure or protection of the commons.
The ideas proposed in this report for country growth strategies relate
largely, though not entirely, to the third set of constraints. The following
includes a proposed set of actions that are likely to help reduce risk and
transaction costs while increasing institutional capacity:
• Improving the investment climate by reducing and underwriting risk, as
well as by increasing the security of property
• Embarking on a “big push” in infrastructure investment, with a particular
emphasis on transportation and energy to partly compensate for disad-

14 CHALLENGES OF AFRICAN GROWTH
vantages arising from Africa’s unfavorable geography, to reduce trans-
action costs, and to improve firm-level profitability
• Promoting innovation by investing in ICT and higher education to increase
competitiveness in the global knowledge-based economy
• Increasing institutional capacity by targeting a few priority areas: enforce-
ment of contracts, greater exercise of voice, enhanced revenue trans-
parency in resource-rich countries, and reduction of corruption through
a country-driven agenda
The rest of this report elaborates on how these areas of strategic action
have been identified and offers ideas that individual countries can use in
developing growth strategies. The diversity of conditions and history pre-
cludes a strategy that fits all African countries, because the above-
mentioned constraints do not apply equally to all. Rather, the lessons
drawn from the growth experiences analyzed in this report would be help-
ful in narrowing down the scope and process of searching for the most
binding constraints and deciding what to do about them.
As stated earlier, the 48 countries of Sub-Saharan Africa range from
sophisticated, middle-income countries such as South Africa, to failed
states such as Somalia; from large, oil-rich countries such as Nigeria, to
small, resource-poor countries such as Niger; from countries that have
come out of conflict and have experienced tremendous recent success,
such as Mozambique and Rwanda, to countries that seem trapped in con-
flict, poverty, and poor governance, such as Somalia. Each country situa-
tion is unique and requires specific analysis of constraints and
opportunities. However, the experiences that we distill in this study can
provide some information on strategic directions that have proved prof-
itable to other developing countries, and that should be examined by ana-
lysts and practitioners seeking to accelerate growth in specific situations.
It is also true that a report of this type can neither be comprehensive nor
contain detailed policy prescriptions for each setting. We have chosen to
emphasize those strategic choices that are most closely associated with
energizing private investment in the short to medium term, and with fos-
tering efficiency and competitiveness as preconditions for export-led
growth. Despite their importance, we will touch only lightly on a number
of sectoral issues such as human resource development, agriculture, and
gender, and encourage more in-depth work in the context of the “flotilla”
of regional flagships mentioned at the outset.

FACING THE CHALLENGES OF AFRICAN GROWTH 15
For many African countries and for the foreseeable future, agriculture
will be the centerpiece of the development trilogy of rapid economic
growth, poverty reduction, and food security (Timmer 2003). It looms
large in typical African economies, in terms of both overall economic
growth and the livelihoods of the majority of the poor. Agriculture is a
major domestic supplier of food and a source of income earning. A key
strategic challenge is to make efforts in agriculture worthwhile by raising
the sector’s profitability. A three-pronged approach is recommended:
(1) ensure better prices and policy environment; (2) reduce transaction
costs—in investment, production, and marketing; and (3) raise labor and
land productivity through technological innovation.
The latter challenge is particularly critical if the region is to embark on a
successful “green revolution” to raise the productivity of agriculture. This
will require a combination of actions to increase the area under irrigation,
increase the use of high-yielding varieties, improve crop husbandry
through extension services (increase knowledge), integrate markets, and
rejuvenate Africa’s farmlands. Roy (2006) presents some striking facts
about how far Africa has been left behind in agricultural productivity and
how denuded African farmlands are of key nutrients. Some 75 to 80 per-
cent of Africa’s farmland is degraded at the annual rate of 30 to 60 kilo-
grams of nutrients per hectare. Yet fertilizer use in Africa is the lowest of
any region in the world. In 2002/03, Sub-Saharan Africa used 8 kilograms
(kg) of fertilizer per hectare, compared to 80 kg for Latin America, 98 kg
for North America, 175 kg for Western Europe, and 202 kg for East Asia.
Sub-Saharan Africa’s consumption of fertilizer, at 2 million tons, is less
than what Bangladesh alone consumes, at 3.4 million tons a year (Roy
2006; Versi 2006). This gap in fertilizer use exists notwithstanding the fact
that Africa (including North Africa) has the highest endowment of princi-
pal ingredients for making fertilizer, including phosphate deposits, nitrates,
and crude oil. Import costs of fertilizer are also very high: $600 per ton in
some landlocked African countries in contrast to $150 per ton in the
United States. Transport cost is a dominant proportion of the cost differ-
ence. With respect to these factors, a major institutional challenge is creat-
ing space for greater private sector (particularly smallholder sector) and
community participation.
Chapter 2 benchmarks African long-term growth performance in a
global perspective and elaborates on the key features and patterns of this
growth experience. Our particular interest is to highlight cross-country

16 CHALLENGES OF AFRICAN GROWTH
and temporal diversity, emphasizing demographic and other features that
differentiate African growth patterns from those of other developing
regions. Two broad features of the African growth record stand out.
Growth in most African countries has been more episodic than in other
developing regions. A distinct characteristic of the African long-term
growth experience is its historical U-shape path, featuring a deep and pro-
longed contraction of growth during 1974 to 1994, a period sandwiched
between moderately high growth rates of the 1960s and late 1990s. Most
of the African countries experienced this pattern, with many of them
beginning their postindependence years with about a decade of fairly
robust growth before experiencing its collapse, largely beginning in the
second half of the 1970s and lasting until 1995, followed by a subsequent
recovery (Pritchett 1998). The clear exceptions are Botswana and Mauri-
tius, which maintained fairly high rates of growth even by global standards
throughout the 45-year history reviewed here. It is noteworthy that dur-
ing the past decade and a half, there has been much greater diversity of
growth performance across African countries.
Another distinct feature of Africa’s growth record highlighted in this
chapter is its juxtaposition with a population explosion. In contrast to
other developing regions, Africa embarked on a slow demographic transi-
tion only in the mid-1980s. Total fertility rates fell sharply outside of Africa,
while rates remained virtually unchanged within Africa for two and a half
decades after independence. Population growth rates therefore diverged
sharply, and from the early 1970s through the remainder of the century,
African populations grew more rapidly than the non-African developing
world had grown at its peak, and age dependency across most African coun-
tries continued to rise sharply. It is therefore not surprising that differences
in per capita incomes diverged more sharply with other regions than the
gaps in economic growth. Indeed, the more intense demographic pressure
from higher levels of age dependency ratios may partly explain the lower
savings rates in the region, as well as fiscal pressures in catering to a larger
dependent-age population, a point we will return to later. Furthermore,
unlike other regions, large countries in Africa have experienced much
slower economic growth, bringing the population-weighted average per
capita income growth rates even lower.
Chapter 3 examines the influential factors behind this growth record
and assesses the relative importance of these factors in the context of the
growth experience in African countries. This is done using three

FACING THE CHALLENGES OF AFRICAN GROWTH 17
approaches. First, at an aggregate level, using the conventional decompo-
sition of sources of growth, we assess the relative importance of capital
accumulation, labor, and productivity to growth. This is done for the region
as a whole and for 19 African countries for which complete and consistent
data are available. We rely in particular on the work of Collins and
Bosworth (1998, 2003) and Ndulu and O’Connell (2003), with the latter
covering a larger set of African countries. The results confirm the impor-
tance of low levels of capital accumulation and also highlight the impor-
tance of the productivity residual in African growth performance. Globally,
Bosworth and Collins (2003) estimate that total factor productivity growth
accounts for 41 percent of growth in the 84 countries they study. This is
certainly true for the 19 African countries included in the sample, notwith-
standing the significant diversity among them. This feature holds true
through all three phases of the region’s growth path. It dominates the
period of growth contraction between the mid-1970s and mid-1990s, and
leads the growth recovery phase of the past decade.
The central role of investment incentives in dealing with both slow cap-
ital accumulation and productivity growth suggests a focus on improving
the investment climate, which, in addition to identifying actionable policy
areas, would also target reducing transactions costs and relieving capacity
limitations. The importance of productivity growth also points us to the
role of innovation (technical progress) in raising productivity and compet-
itiveness. Productivity, in turn, is influenced not only by the quantity and
quality of capital stock, but also the quality and quantity of knowledge
(Lindbaek 1997).
Second, and partly to confirm the above conclusions, we use firm-level
data from investment climate surveys to assess the relative importance of
different factors on the attractiveness of African countries to investors, as
influenced by the cost of doing business. The assessment uses the bench-
marks of other developing countries to compare the state of institutional,
policy, and regulatory frameworks; business regulations and their
enforcement; adequacy and quality of infrastructure; stability of the
macro economy; protection of property rights; and functioning of the
financial system.
Costs of contract enforcement difficulties, inadequate infrastructure,
crime, corruption, and regulation can amount to over 25 percent of sales—
or more than three times what firms typically pay in taxes (World Bank
2005f). Akin to these findings, the investment climate assessment work

18 CHALLENGES OF AFRICAN GROWTH
reviewed for this report and previous papers focusing on Africa conclude
that while shop-floor-level unit costs in Africa tend to be comparable to
those in other developing regions, indirect costs—primarily the cost of
infrastructure services (transportation and energy), weak contractual
enforcement, corruption, and skill deficiency—are significantly higher in
the African countries surveyed. The impact from these constraints varies
across countries and sectors, demanding that countries make their own
assessments. But these appear to be strong candidates based on the evi-
dence reviewed.
Finally, we use results from cross-country empirical research to com-
pare the extent of the deviation of the growth conditions in African coun-
tries from those in other regions and to establish where the gaps are widest.
It is a benchmarking exercise for African growth conditions. We make
these assessments relative to three comparators: global average, South
Asia, and East Asia and Pacific. Noting that the region has seriously lagged
behind in growth, we include East Asia and Pacific among the comparators
to provide African countries with a target for their efforts to close the gap.
We also track the changes in the individual components of these growth
conditions (the drivers for growth) over the three phases of the U-shaped
path of the African growth experience, to identify those areas in which
Africa is closing the gap with other developing regions and those areas that
require much more effort. This analysis is done at the regional level and for
36 individual countries that have adequate data over the entire 45-year
period.
We judiciously use findings from cross-country growth studies, and
from empirical work done for this report, to help identify factors that tend
to have the highest likelihood of influencing growth performance in
Africa5 and globally, without drawing causality conclusions. We appreciate
the fundamental questions of exogeneity and identification (Temple 1999)
plaguing cross-country growth regression.6 Hence, we limit the use of this
empirical work mainly to description and comparison of growth condi-
tions in Africa and comparator regions. More detailed econometric discus-
sion and results from empirical work done specifically for this report are
presented in the appendix.
Three broad conclusions stand out from this analysis. First, consistent
with much of the cross-country growth analysis, evidence reviewed here
suggests that policy and governance matter a great deal for growth. Taking
45 years of African growth experience as a whole and controlling for dif-

FACING THE CHALLENGES OF AFRICAN GROWTH 19
ferences in the composition of opportunities, we find that the impact of
poor policy typically accounted for between one-quarter and one-half of
the difference in predicted growth between African and non-African
developing countries (Collier and O’Connell 2006; Ndulu and O’Connell
2006a; and empirical work for this report). The benchmarking analysis
also shows that the relative importance of macroeconomic policy in
explaining the growth differential between African countries and others
may have waned since the 1990s, as a result of major reforms implemented
in the region, which have moved policy performance in African countries
much closer to the global average. Second, overcoming disadvantages from
differences in the opportunity structures (locational and natural resource
dependence) between Africa and other regions may facilitate closing up an
additional one-third of the growth gap with other developing countries
(Collier and O’Connell 2006). Finally, our analysis points to a very large
role played by the delayed demographic transition in Africa. In all estima-
tions undertaken for this study, differences in the demographic variables
consistently predict two-thirds of the observed difference between average
growth in Sub-Saharan Africa and in other developing regions (see tables
3.4 and 3.5 in chapter 3, the appendix, and Ndulu and O’Connell 2006a).
Chapter 4 undertakes a more in-depth analysis of a selective list of con-
straints emerging from the analysis in chapter 3 and lays the groundwork
for a more prioritized discussion of strategic ideas and options. Chapter 4
draws extensively from African and global experience. It also tries to high-
light the extent to which the levels and impacts of these constraints are dif-
ferent in African countries than in other regions. The chapter includes an
assessment of their past and potential impacts on the region’s and individ-
ual African countries’ growth performance, using empirical analysis done
for this report and from other sources. The chapter begins with the identi-
fication of a set of unfavorable endowments that have constrained African
growth. It then looks at three other groups of constraints: risks, transaction
costs, and capacity.
Although they are not predicaments, challenges from unfavorable geog-
raphy, the curse of misgoverning rents from substantial mineral resources,
demographic pressures, and ethnic and regional polarization have typi-
cally made development activities much more costly to carry out in Africa
than in other regions. The challenges are manifested in the form of loca-
tion in the disease-prone tropics, geographic isolation and fragmentation,
a history that is fraught with conflict-motivating ethnic polarization, as

20 CHALLENGES OF AFRICAN GROWTH
well as a delayed demographic transition. The tropical location affects the
prevalence of disease, work stamina, and pests, and the landlocked feature
negatively affects the cost of production and trade, primarily because of
higher transportation and transit costs. Together with the consequences of
sovereign fragmentation and ethnolinguistic fractionalization (Easterly
and Levine 1997), development under these conditions is relatively more
expensive and slower. Easterly and Levine (2003) and Acemoglu and
Robinson (2001) also find that many of these effects are mediated through
the quality of institutions. Although we recognize that slow growth may
be influenced by these constraints, they can be mitigated through appro-
priate investments and policy actions.
In addition to the risks associated with an unfavorable policy environ-
ment, the investment climate in Africa is adversely affected by frequency of
conflict, corruption, and insufficient local scrutiny. Investors are discour-
aged by not being reasonably sure of the safety of their assets due to the
perceived high risk of conflict, not being able to make a reasonable projec-
tion of profitability because of high price instability, and facing the risk of
being unable to repatriate profits because of exchange controls when a
country is unable to earn enough foreign exchange. These risks are valid for
both foreign and domestic investors. Flight of financial wealth from Africa
is symptomatic of the absence of both attractive opportunities and condi-
tions to invest at home. It is estimated that in 1990, Africans held up to
$360 billion, or 40 percent, of their wealth outside the region, in search of
safer havens and higher returns (Collier, Hoeffler, and Pattillo 1999). This
compares with just 6 percent of East Asian wealth and 10 percent of Latin
American wealth being held outside of their respective regions. More
broadly, action at the individual country level to improve the investment
climate may require complementary regional efforts to improve the collec-
tive reputation of the region as an attractive destination for investment.
Relatively high transaction costs in the region make capital accumula-
tion, production, and trade relatively expensive in Africa. For example,
dollar-for-dollar investment in African countries yields significantly less
expansion of productive capacity because prices of capital goods are
70 percent higher than in OECD and Southeast Asian countries (Sala-i-
Martin, Doppelhofer, and Miller 2004). Using this information, Artadi and
Sala-i-Martin (2003) estimate that the average growth rate in African
countries would have been 0.44 percentage points higher each year if the
relative price of investment goods was the same as in OECD countries or

FACING THE CHALLENGES OF AFRICAN GROWTH 21
East Asia.7 Amjadi and Yeats (1995) demonstrate that relatively high trans-
portation costs, especially for processed products, often place African
exporters at a serious competitive disadvantage. In 1970, for example, net
freight payments to foreign nationals absorbed 11 percent of Africa’s
export earnings. That ratio had increased to 15 percent by 1990. And for
landlocked African countries, the freight cost ratio exceeds 30 percent, as
exports must transit neighboring territories. In a similar vein, a more
recent study by the African Development Bank (AfDB 1999) on exports to
the United States found that freight charges as a proportion of cost, insur-
ance, and freight value are on average approximately 20 percent higher for
African exports than for comparative goods from other low-income
countries.
These transaction costs arise mainly because of the higher costs of infra-
structure services (particularly transportation and energy), which make up
a disproportionately large part of production and trade costs; barriers to
trade, which raise the cross-border transaction costs; and bureaucratic red
tape and inefficiencies, which exacerbate these costs. The remoteness of
population concentrations, accentuated by high internal transportation
costs, resulted in estimated median transportation costs for intra-Africa
trade (including transshipments) that are 65 percent higher than in Latin
America and twice that of East and South Asia (Limao and Venables 2001).
Capacity encompasses human competencies, organizational effective-
ness, and institutional effectiveness in enforcing the rules of the game.
Improvement of workers’ skills is a fundamental source of economic
progress and increasing human welfare (Adam Smith, cited in Eatwell
1996). These improvements are achieved not only through education and
formal training, but also through learning by doing. Although basic educa-
tion is widely considered to be critical for poverty reduction, there is
emerging evidence from a large number of studies that secondary and
higher education are more significant in raising long-term growth rates
and income levels (Barro 1999; Barro and Lee 1993; Hanushek and Kim
1995). This impact is evidenced primarily through improved capabilities to
absorb technological advances. Furthermore, studies have also found that
foreign direct investment (FDI) has had a larger impact on growth than
domestic investment, due to its higher productivity. This impact, however,
is reached only when there is sufficient capability in the host country to
absorb the complex technologies that come with FDI (Borensztein, De
Gregorio, and Lee 1998; Lumbila 2005).

22 CHALLENGES OF AFRICAN GROWTH
Progress in overcoming shortages of skilled and trained manpower in
African countries seems to be disappointingly slow despite substantial
resources devoted by both governments and donors to this effort during the
past three decades. Moreover, African countries have struggled to retain the
few skilled professionals they produce. The region has lost more highly
skilled professionals. It has been estimated that for a number of African
countries, more than 30 percent of their highly skilled professionals have
been lost to the OECD countries (Carrington and Detragiache 1999; Haque
and Aziz 1998). Nearly 88 percent of adults who emigrate from Africa to
the United States have a high school education or higher (Speer, cited by
Zeleza, 1998). Apraku (1991), in a survey of African immigrants in the
United States, found that 58 percent of the respondents had either PhDs or
MDs, and an additional 19 percent had master’s degrees. The HIV/AIDS
pandemic has exacerbated the loss of skilled manpower in the region.
Likewise, a lack of state capacity to carry out basic public management
functions constrains delivery of basic services to its citizens and raises the
cost of doing business, discouraging the private investment that is essential
for growth. The problems here are linked to bureaucratic inefficiency, low
levels of incentives, and meritocracy, leading to underutilization of the
human capacity in the public sector.
Chapter 5 identifies a set of cross-cutting growth strategies. Six lessons
are drawn from the preceding analysis of 45 years of Africa’s growth expe-
rience to inform growth strategies:
• African countries’ growth experiences are extremely varied and episodic. How-
ever, two challenges are peculiar to the region—the slow growth of
large countries and the extreme instability of growth across a large
number of African countries, making growth in large countries and
prudent management of the impact of shocks key themes of growth
strategies in the regional.
• While lower levels of investment are important for explaining Africa’s slower
growth, it is the slower productivity growth that more sharply distinguishes
African performance from the rest of the world. This situation clearly calls for
looking beyond the creation of conditions for attracting new investors
to more explicitly pursuing measures that help raise productivity of
existing and new investments.
• Consistent with much of the cross-country growth analysis, evidence from the
research reviewed in this report suggests that policy and governance matter a

FACING THE CHALLENGES OF AFRICAN GROWTH 23
great deal for growth. Thus, while it is imperative that countries identify
and address other binding constraints, sustaining recent gains in the
improvement of the policy environment would be a desirable perma-
nent feature of any growth strategy a country adopts.
• The evidence also suggests that overcoming disadvantages arising from geo-
graphic isolation and fragmentation, as well as natural resource dependence,
will be necessary if Africa is to close the growth gap with other regions.
• The results from the empirical analysis suggest a very powerful influence from
the growth of trading partners’ economies, underscoring the importance of
enhanced competitiveness and reduced barriers to trade in order to take
advantage of opportunities offered by the global market.
• Analysis points to the very large role played by the delayed demographic transi-
tion in Africa in explaining its relatively slower growth performance. This is an
area that will need much more work to determine what would be help-
ful for accelerating demographic transition in Africa.
The experiences of countries that have sustained rapid growth in Asia,
Latin America, and even Africa have tended to be almost all export led.
However, a wide range of options is available from the strategies that these
countries have followed to scale up and diversify exports. Some African
economies can realistically hope to follow the main Asian model or the route
Mauritius has taken, in which a central component of growth is manufac-
tured exports. For African countries that have sufficiently abundant valuable
natural resources, like Botswana, their most likely route to prosperity may
be through the equitable exploitation of their resource base—mineral
exports. Some countries may be able to follow the emerging Latin American
model of modern agriculture, such as agribusiness in Chile, Costa Rica, or
Colombia, or natural resource–based, export-oriented industrialization, as in
Indonesia or Malaysia. Other countries may be so disadvantaged that pros-
perity for their populations will depend on employment opportunities in
more fortunate neighboring economies (for example, Swaziland and
Lesotho vis-à-vis South Africa, or Burkina Faso vis-à-vis Côte d’Ivoire) or,
like India, on the pursuit of the high-value service sector—the office econ-
omy. In any case, the paths to prosperity are many and varied.
The stage for scaling up growth in the region is set by documenting the
revival of growth that got under way in the mid-1990s, partly due to a
response to the economic and political reforms of the late 1980s and early

24 CHALLENGES OF AFRICAN GROWTH
1990s. We argue that Africa now faces a window of opportunity, with a
growing number of politically stable countries facing the prospect of mutu-
ally reinforcing declines in fertility rates and increases in capital formation
and productivity growth.
The strategic agenda rests on four pillars, which primarily target resolu-
tion of the constraints that are identified in chapter 4 and discussed in
greater detail in chapter 5. The first pillar involves improving the investment
climate by reducing indirect costs to firms and reducing and mitigating
risks. Indirect costs are generally infrastructure related, with energy and
transportation topping the list of major impediments; risks to be mitigated
are particularly those relating to security of property, such as poor adjudi-
cation of disputes, crime, political instability, and macroeconomic instabil-
ity. While effort in individual countries is the focal point of action, we also
suggest pooling efforts to develop cohesive investment areas by, for exam-
ple, coordinating investment promotion, coordinating policy, improving
security, and increasing connectivity
In focusing on improving the business environment it is important to
make the distinction that Rodrik and Subramanian (2004) make based on
their analysis of India’s growth revival since the 1980 pro-market and pro-
business reforms. The role of leadership in spearheading the needed
reforms and public action is critical for success. The former is concerned
with removing impediments to the market, favoring entrants and con-
sumers, and the latter is focused on raising the profitability of established
enterprises—favoring incumbents and producers. Both orientations are
important, but the sequence adopted by countries has varied, with differ-
ential impacts. India began with pro-business reforms in the 1980s before
embarking on market liberalization in the 1990s.
The second pillar is infrastructure, which mainly targets transaction costs
in production of goods and services. As the foregoing summary suggests,
transportation and energy make up the largest proportion of indirect costs,
weighing heavily on the competitiveness of firms in most African countries
where investment climate surveys were conducted. Particular focus would
be on how to reduce the high costs associated with the remoteness of land-
locked countries in order to facilitate trade with neighbors as well as with
the rest of the world. It is clear that there will be a need to look beyond indi-
vidual country borders and adopt a regional approach to coordinate cross-
border infrastructure investment, maintenance, operational management,
and use (for example, power pooling) in order to lower costs.

FACING THE CHALLENGES OF AFRICAN GROWTH 25
Mindful of the need for more effective use of infrastructure assets, the
chapter also emphasizes the importance of enhancing capacity for nonfor-
bearing regulation of use and maintenance of these assets. Private-public
partnerships would help ensure that these essentially public services not
be underfunded and consequently require greater involvement of the pub-
lic sector than in the previous two decades. At the same time, delivery of
services would benefit from the operational efficiency of private
management.
The third pillar is innovation, primarily emphasizing investment in infor-
mation technology and skill formation (higher education) for enhanced
productivity and competitiveness. The potential comparative advantage of
low wages in Africa can be nullified by low productivity. Surveys of
investors show that labor is not cheap where productivity is low (Lindbaek
1997). ICT is now the main driver for productivity growth. There is strong
empirical evidence that shows that investment in ICT and in higher edu-
cation boosts competitiveness, making both key parts of the growth
agenda. As late starters, African countries can make a huge leap forward
and beyond antiquated technology by exploiting the technological advan-
tages of ICT.
The fourth pillar is institutional capacity. Again, the results from the
investment climate assessment surveys and analysis for the World Develop-
ment Report (World Bank 2005f) identify costs associated with contract
enforcement difficulties, crime, corruption, and forbearing regulation as
being among those weighing most heavily on the profitability of enter-
prises. The main focus of action here would be partly to strengthen the
capacity of relevant public institutions for protecting property rights and
partly to strengthen scrutiny of, and accountability for, public actions.
Building institutional capacity entails strengthening individual competen-
cies, organizational effectiveness, and rules of the game. Under this pillar,
particular attention would be paid to capacity and space for scrutiny of
public action—mainly within a framework of a strong domestic accounta-
bility system and capacity to clarify and protect property rights to spur pri-
vate enterprise. The key strategic areas of action, therefore, would include
enforcement of contracts (for example, commercial courts); exercise of
voice as an agency of restraint, with enhanced involvement of civil society,
media, and parliament; enhanced revenue transparency in resource-rich
countries; and prevention of corruption as a country-driven agenda,
including checks and balances.

26 CHALLENGES OF AFRICAN GROWTH
Chapter 5 concludes with emphasis on the need to address the huge
financing gap for scaling up growth. Several attempts to estimate the
financing needs of African nations have been made, mainly on the basis of
achieving the MDGs. To achieve annual growth rate of 7 percent, United
Nations Conference on Trade and Development (UNCTAD 2000) estimated
that Africa requires investment ratios averaging 25 percent of GDP over
the next decade. Against Africa’s saving rate of around 9 percent of GDP,
this represents a major financing gap. For the short- to medium-term
financing, it is clear that African countries are not in a position to generate
any meaningful part of this requirement, making foreign savings (FDI and
official development assistance, or ODA) and reversal of capital flight crit-
ical for achieving these targets. Over the longer term, however, African
countries have to focus on measures to raise domestic resources as well as
to retain its wealth on the continent. The gap appears to be particularly
acute in the financing of public sector programs (shares of ODA financing
of government budgets exceed 40 percent in a number of strong growth
performers, such as Mozambique, Uganda, and Tanzania). Raising revenue
efforts is therefore also important for domestic resource mobilization and
ultimate reduction of dependence on aid.
Figure 1.4 is a schematic of the growth process discussed in this report.
It describes the interactions among opportunities, the political environ-
ment significant to growth, and the critical constraints to exploiting the
opportunities for growth. In a sense, the figure presents a snapshot of the
key elements of the growth strategies outlined in the discussions of the
earlier chapters and subsequently elaborated. We owe the schematic to
Professor Ishikawa (2006), who developed it in the context of offering
comments on the report to illustrate the complex interactions among eco-
nomic variables in the process of determining growth outcomes.
The underlying growth model of the figure identifies the key channels
through which output can be increased, either through accumulation of
physical or human capital, or through rises in productivity growth spurred
by improved efficiency and innovation. Three sets of factors are high-
lighted (in boxes 1, 2, and 3 in the schematic) that would influence the
outcomes of sustained growth and, eventually, poverty reduction. First is
the set of the initial conditions (box 1) that define the scope of opportuni-
ties prevailing in the region and constrain the policy and strategic choices
(box 2) for accelerating growth. In addition, this set of factors directly
influences the incentives and pace of capital accumulation and productiv-

FACING THE CHALLENGES OF AFRICAN GROWTH 27
ity growth. A set of political economy variables (box 3) are influential in
shaping both strategic and policy choices. Leadership and how it is selected,
the quality of public scrutiny, and accountability are among the most cru-
cial aspects of political processes that have a bearing on the country’s eco-
nomic governance and, hence, on the quality of decisions. The outcome of
the growth process is not confined simply to raising the nation’s income,
because the ultimate goal is poverty reduction and improved livelihoods.
For the latter outcome, broad sharing of benefits from economic growth is
imperative.
Though not a blueprint, the pillars of the growth strategies discussed
earlier form the centerpiece of any attempt to increase competitiveness,
diversify production, and accelerate growth in the medium term. The
broad strategic approaches presented here need to be tailored to the spe-
cific situation of each country, which, in turn, means specific analysis of
each country setting to reflect the political, social, and economic environ-
ments. Lessons can be learned from the experiences of East and South
Asia, as well as from successful countries on the continent. What does
Botswana have to teach African countries about managing mineral wealth
and prudent public investment scrutiny? What lessons can be derived from
Mauritius on export diversification? What lessons can Liberia and
Burundi, for example, learn from Mozambique’s and Rwanda’s transfor-
mation from conflict to being among the fastest growing countries in the
world? It is the hope of the authors that this report will strengthen the
desire for such learning.
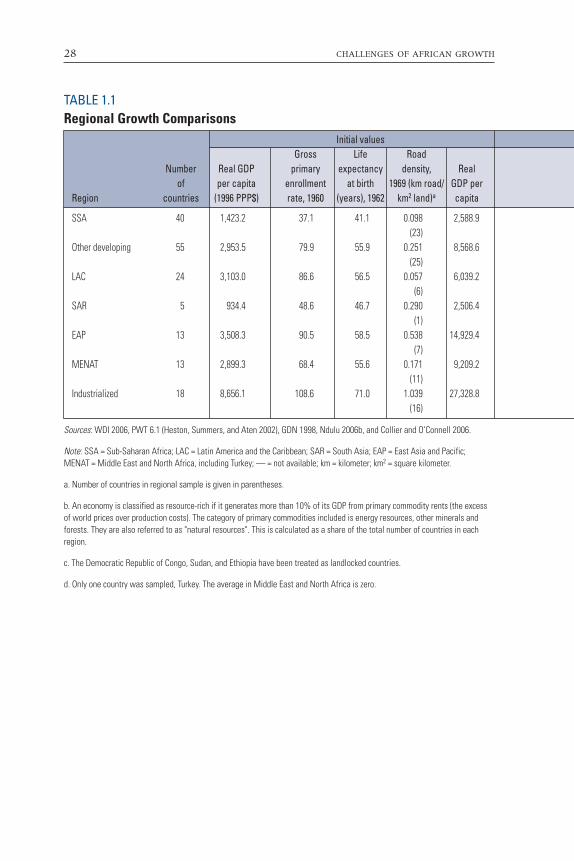
28 CHALLENGES OF AFRICAN GROWTH
TABLE 1.1Regional Growth Comparisons
Initial valuesGross Life Road
Number Real GDP primary expectancy density, Real of per capita enrollment at birth 1969 (km road/ GDP per
Region countries (1996 PPP$) rate, 1960 (years), 1962 km2 land)a capita
SSA 40 1,423.2 37.1 41.1 0.098 2,588.9(23)
Other developing 55 2,953.5 79.9 55.9 0.251 8,568.6(25)
LAC 24 3,103.0 86.6 56.5 0.057 6,039.2(6)
SAR 5 934.4 48.6 46.7 0.290 2,506.4(1)
EAP 13 3,508.3 90.5 58.5 0.538 14,929.4(7)
MENAT 13 2,899.3 68.4 55.6 0.171 9,209.2(11)
Industrialized 18 8,656.1 108.6 71.0 1.039 27,328.8(16)
Sources: WDI 2006, PWT 6.1 (Heston, Summers, and Aten 2002), GDN 1998, Ndulu 2006b, and Collier and O’Connell 2006.
Note: SSA = Sub-Saharan Africa; LAC = Latin America and the Caribbean; SAR = South Asia; EAP = East Asia and Pacific; MENAT = Middle East and North Africa, including Turkey; — = not available; km = kilometer; km2 = square kilometer.
a. Number of countries in regional sample is given in parentheses.
b. An economy is classified as resource-rich if it generates more than 10% of its GDP from primary commodity rents (the excess of world prices over production costs). The category of primary commodities included is energy resources, other minerals and forests. They are also referred to as "natural resources". This is calculated as a share of the total number of countries in eachregion.
c. The Democratic Republic of Congo, Sudan, and Ethiopia have been treated as landlocked countries.
d. Only one country was sampled, Turkey. The average in Middle East and North Africa is zero.

FACING THE CHALLENGES OF AFRICAN GROWTH 29
Ending values EndowmentsGross Life Road density Fragmentation, Share of Share of
primary expectancy (km road/ (average population in natural enrollment at birth km2 land), number landlocked resource rate, 2004 (years), 2004 1999 of borders countries (%) economyb
95.8 47.9 0.130 4.00 40.2c 30
107.5 71.3 0.411 2.91 7.51 29
111.5 70.5 0.122 2.34 2.77 20
103.8 65.1 0.850 2.75 3.78 0
107.0 73.3 0.719 2.09 0.42 19
103.3 73.0 0.334 4.44 23.06d 60
102.5 78.9 1.447 — — —

30
CH
ALLE
NG
ES
OF
AFR
ICA
NG
RO
WTH
FIGURE 1.4Analytical Framework of the Growth Model
Opportunities and constraints • Geographical factors • Tropical climate and diseases • Natural resources: cure or potential • Demographic factorsRisks and uncertainties • Macroeconomic instability • Political uncertainty and conflictsWeak institutions • Patronage and clientelism • Huge scope of government • Underdeveloped financial sectors
Key functions to be fulfilled over time • Accumulation of capital: both physical and human • Efficiency in allocating resources • Technological progress • Sharing of the benefits of growth
Sustained growth
Poverty reduction
Improving governance and resolving conflictsIncreasing competitiveness and diversifying economiesInvesting in peopleReducing aid dependency and strengthening partnerships
Political economy • Political elites’ belief • Interest to which they respond • Institutions by which political competition was initiated
Initial conditions (data)1
2 3Strategies (policies) Political economy variables
Mechanisms for growth(economic variables) Development
performance
Source: Ishikawa 2006.

FACING THE CHALLENGES OF AFRICAN GROWTH 31
Notes
1. Angola, Cameroon, Cape Verde, Democratic Republic of Congo, Lesotho,Namibia, and Swaziland.
2. Botswana, Equatorial Guinea, Gabon, Mauritius, Seychelles, and South Africa.3. These include Angola, Central African Republic, Comoros, Democratic Repub-
lic of Congo, Madagascar, Niger, Senegal, Sierra Leone, and Zambia. 4. For a comprehensive analysis of this issue see World Bank (2006d).5. A short list of noteworthy contributions that draw on global data to make
Africa-relevant contributions include Sachs and Warner (1995) on outwardorientation; the same authors (1997, 2001) on the natural resource curse;Bloom and Sachs (1998) on geographic and demographic constraints; Mastersand McMillan (2001) on tropical location and the disease environment; East-erly and Levine (1997) on ethnic fractionalization and policy; the sameauthors (1998) on neighborhood (spillover) effects; Collier (1999) and Collierand Hoeffler (2004) on civil wars; Mauro (1995) on corruption; Knack andKeefer (1995) on the rule of law; Acemoglu, Johnson, and Robinson (2001)on institutional legacies of the colonial period; Guillaumont, GuillaumontJeanneney, and Brun (1999), Dehn (2000), and Blattman, Hwang, andWilliamson (2004) on vulnerability to external shocks; Burnside and Dollar(2000) on aid; and Glaeser et al. (2004) on political leaders.
6. Researchers have attempted to reduce the dimensionality problem by isolatingdeterminants that are robust to the inclusion or noninclusion of other vari-ables (for example, Levine and Renelt 1993, Artadi and Sala-i-Martin 2003)and by constructing portmanteau variables that aggregate a variety of relatedproxies (for example, the celebrated Sachs and Warner “openness” variable, orthe “diversion” variable constructed by Hall and Jones (1999).
7. This cost differential is also reflected in the wide divergence between the aver-age share of investment in GDP for Sub-Saharan Africa measured in domesticand international prices. In domestic prices, this ratio for the period 1960 to1994 (weighted by average GDP at 1985 international prices) was 19 percent,compared to only 9.5 percent at 1985 international prices.


A central concern of this chapter is to highlight and characterize the relative
stagnation of African economic growth in the past 45 years. For the entire
four and a half decades (1960–2004), per capita income grew at a yearly
average of 0.5 percent in the 41 Sub-Saharan Africa countries, compared to
3 percent in the 57 countries in the rest of the world’s developing regions
for which data for the full period are available. Sub-Saharan Africa missed
out on the economic transformation that took place in the developing
world—particularly in Asia—in the second half of the 20th century.
Two broad features differentiate the African growth record from the
records of other developing regions. First, growth in most African coun-
tries has been more episodic than in other developing regions. For the
region as a whole, a distinct long-term growth feature is its historical U-
shaped path, featuring a deep and prolonged contraction of growth during
1974 to 1994, a period sandwiched between the moderately high growth
rates of the 1960s and late 1990s. Most African countries experienced this
pattern, with many of them beginning their postindependence years with
a decade or so of fairly robust growth before that growth collapsed, begin-
ning in the mid-1970s and lasting until 1995. This was followed by a sub-
sequent recovery (Pritchett 1998), with much greater diversity emerging
across countries in the region.
Second is the juxtaposition of this poor record with a population explo-
sion that has served to further depress individual African incomes in com-
CHAPTER 2
Africa’s Long-Term Growth Experience in a
Global Perspective
33

34 CHALLENGES OF AFRICAN GROWTH
parison with those of citizens of other regions. In contrast to other devel-
oping regions, Africa embarked on a slow demographic transition only in
the mid-1980s. Total fertility rates fell sharply outside Africa, while
remaining virtually unchanged within Africa for two and a half decades
after independence. Population growth rates therefore diverged sharply,
and from the early 1970s through the remainder of the century, African
populations grew more rapidly than the non-African developing world
had grown at its peak. It is therefore not surprising that compared with
other regions, differences in per capita incomes diverged more sharply
than the gaps in economic growth. The difference in the population-
weighted average growth rates, compared with other regions, is more pro-
nounced, as figure 2.1 shows.
At the regional level, the four largest countries (Democratic Republic of
Congo, Ethiopia, Nigeria, and South Africa), which account for 43 percent
of total African population, posted a weighted-average per capita income
growth rate of 0.26 percent—well below the regional average for the four
and a half decades. As we will discuss further, resumption of sustained
growth in these four African giants (particularly in Democratic Republic of
FIGURE 2.1 Smoothed Average Growth in Real GDP Per Capita: Sub-Saharan Africa andOther Regions
�2
0
2
4
6
8
41 SSASSA, population weighted
57 otherother, population weighted
1960 1970 1980 1990 2000
year
Sources: World Development Indicators (WDI) 2006, Penn World Tables (PWT) 6.1 (Heston, Summers, and Aten 2002), and GlobalDevelopment Network (GDN) 1998.
Note: GDP = gross domestic product; SSA = Sub-Saharan Africa.

AFRICA’S LONG-TERM GROWTH EXPERIENCE IN A GLOBAL PERSPECTIVE 35
Congo, Ethiopia, and Nigeria) will go a long way toward bridging the indi-
vidual income gaps between Sub-Saharan Africa and other developing
regions. In the rest of this chapter we will focus on four main dimensions
of the African growth experience: its evolution over the past four and a
half decades, comparison with developing countries in Asia, diversity of
experience and impact on individual incomes within Africa, and its sec-
toral composition.
Evolution
A distinct characteristic of Africa’s long-term growth experience is its his-
torical U-shaped path. Average, per capita growth rates of around 2 per-
cent in the early 1960s rose to nearly 5 percent by the end of that decade,
fell steadily through the early 1970s, turned negative during the mid-
1980s, and then climbed back to around 2 percent since the mid-1990s.
As seen in figure 2.1, of the 41 African countries for which consistent
growth data are available, African economies grew fairly rapidly during
the first decade and a half after gaining independence. The average growth
rate of the population-weighted per capita income for these 41 SSA coun-
tries in the early 1960s exceeded those of the other 57 developing coun-
tries. Between 1960 and 1994, nearly half of African countries for which
comparable data existed, suffered per capita income losses exceeding 20
percent in constant 1985 US dollars (O’Connell and Ndulu 2000). The
great bulk of these losses occurred between 1974 and 1994 (Rodrik 1998).
The global deceleration of the 1970s took substantial portions of the conti-
nent into outright contraction. This period began with a set of shocks to
energy and tropical commodity markets (1974–79), and ended with a con-
centrated wave of African democratic reforms (1989–94). By 2005, African
growth had rebounded to the levels of the 1960s, comprised of much larger
and more diversified economies than the 1960s decade.
Growth stagnation set in much earlier and lasted longest for the group
of 34 African countries currently classified as low-income countries, com-
pared to the 13 lower and upper, middle-income countries in the region
(figure 2.2). The group of 34 low-income countries hosts 87 percent of
Africa’s population.
As noted earlier, for the entire four and a half decades (1960–2004), per
capita income grew at a yearly average of 0.5 percent in the 41 SSA coun-

36 CHALLENGES OF AFRICAN GROWTH
tries compared to 3 percent in the 57 countries in the rest of the develop-
ing regions, for which data for the full period are available. Specifically, for
the first decade and a half (1960–73), 13 African countries exceeded the
global average growth rate (figure 2.3). These were Botswana, Côte
d’Ivoire, Gabon, Kenya, Lesotho, Malawi, Mauritania, Namibia, Nigeria,
Seychelles, South Africa, Tanzania, and Togo. Indeed, many development
observers then were more optimistic about progress in Africa compared to
Asian countries, particularly because countries such as Côte d’Ivoire,
Ghana, and Zambia already had per capita incomes that exceeded those of
East Asian countries, including the Republic of Korea.
A prolonged period of economic contraction occurred in Africa between
1974 and 1994, while other regions sustained or increased their growth.
As a result, only seven African countries exceeded the global average
growth rate during this period. These were Botswana, Burkina Faso, Cape
Verde, Democratic Republic of Congo, Lesotho, Mauritius, and Seychelles.
The trough for the growth contraction was reached in the 1980s, when
there was the greatest divergence of the levels of incomes per head in
Africa compared to other developing countries.
6
4
2
0
�2
1960 1970 1980 1990 2000
year
6 upper MIC 34 LIC7 lower MIC
Source: WDI 2006.
Note: MIC indicates middle-income countries and LIC indicates lower-income countries. Growth rates refer to smoothed averagegrowth rates in real GDP per capita.
FIGURE 2.2Average Growth Rates in Sub-Saharan Africa, by Income Categories

AFRICA’S LONG-TERM GROWTH EXPERIENCE IN A GLOBAL PERSPECTIVE 37
During the last decade (1995–2004), there was a rapid revival of growth
in Africa, resulting in 20 countries’ per capita income growing at a pace
exceeding the global average. The new entrants into this growth club were
predominantly either countries with new discoveries or revived exploita-
tion of natural resources (Angola, Chad, Equatorial Guinea, and Sudan) or
strong reformers (Benin, Ethiopia, Ghana, Malawi, Mali, Mozambique,
Senegal, and Tanzania). The revival of African growth since the mid-1990s
lends the distinctive U shape to the region’s overall growth record for
1960–2004.
Benchmarking against Asian Economies
African growth performance diverged significantly from that of other
regions. Figure 2.4 compares average growth rates in Africa with those of
East Asia and Pacific (EAP) and South Asia (SAR) from 1960 to 2004. The
first point of difference is the significantly higher levels of growth observed
in the Asian economies, on average, over the entire period in comparison
FIGURE 2.3Average Per Capita Growth Rates: Global Distribution
countries countries countries
1960–73 1974–94 1995–2004
20
10
0
�10
41 SSA
1.731.22.75
57 other
aver
age
grow
th (%
)
Sources: WDI 2006, PWT 6.1 (Heston, Summers, and Aten 2002), and GDN 1998.
Note: The horizontal line in each panel indicates the global average for the relevant time period. SSA = Sub-Saharan Africa.

38 CHALLENGES OF AFRICAN GROWTH
to Africa, except in the early 1960s. The East Asian growth path lies com-
pletely above Africa’s regional average growth rate throughout the four
decades, whereas the South Asian countries start out with growth rates
similar to Africa’s, only to diverge from it for the rest of the time period.
The divergence of growth performance is particularly sharp between the
mid-1970s and mid-1980s, during which a combination of Asia’s acceler-
ating growth and the collapse of growth in Africa quickly widened the gap.
More than half of this growth gap was accounted for by the sharp contrac-
tion of growth in Africa, rather than by the acceleration of Asian growth
rates. The more recent convergence of the two sets of growth rates, like-
wise, is more a result of the brisk recovery of growth in African countries
since the mid-1990s, while Asian countries have maintained fairly high
average growth rates.
Second, unlike Africa’s U-shaped evolution of growth rates, Asian coun-
tries have followed a sustained growth path. In the initial phase from 1960
to 1973, East Asia and Pacific’s growth rates rose very steeply, attaining a
peak average around the early 1970s, and beginning a slow decline along
with the rest of the world about the same time as African economies began
FIGURE 2.4Smoothed Average Growth in Real GDP Per Capita: Sub-Saharan Africa, South Asia, and East Asia and Pacific
1960 1970 1980 1990 2000 2010
5
4
3
2
1
0
year
aver
age
grow
th (%
)
41 SSA 5 SAR 14 EAP
Sources: WDI 2006, PWT 6.1 (Heston, Summers, and Aten 2002), and GDN 1998.
Note: SSA = Sub-Saharan Africa; SAR = South Asia; EAP = East Asia and Pacific.

AFRICA’S LONG-TERM GROWTH EXPERIENCE IN A GLOBAL PERSPECTIVE 39
a sharp decline. South Asia began its steep rise in growth late in the 1970s
and sustained the pace to reach the EAP average rates in the late 1990s.
Since 1995, African-country average growth rates appear to be converging
with those of East Asia and Pacific and South Asia.
As observed earlier, the gap in terms of population-weighted average
growth rates was much wider during the entire period. The resultant diver-
gence of African incomes relative to those of Asian incomes, measured in
terms of real gross domestic product (GDP) per capita, is phenomenal and
mirrors the comparative time trends of the growth performance as dis-
cussed (see figure 2.5).
Diversity across Africa
Although the evolution of the average growth performance described
above fits most African countries’ experiences, it masks a wide variation of
growth performance across individual African countries within each of the
three phases. For example, roughly half of the 21 economies studied by
Pritchett (1998)—a group accounting for nearly 80 percent of Sub-
FIGURE 2.5GDP Per Capita Index—Sub-Saharan Africa and Other Regions, 1960–2004
GD
P pe
r cap
ita in
dex,
196
0 =
100
(199
6 PP
P $)
East Asia and Pacific South Asia East AsiaSub-Saharan Africa
181
582
271
990
0
200
400
600
800
1,000
1960 1970 1980 1990 2000year
Source: WDI 2006, PWT 6.1 (Heston, Summeres, and Aten), and GDN 1998.
Note: GDP per capita index 1960 = 100.

40 CHALLENGES OF AFRICAN GROWTH
Saharan Africa’s GDP and population—exhibited reasonably robust
growth before the long period of stagnation; the other half tended to show
persistent stagnation at growth rates below 1.5 percent throughout.
As a further illustration of the differences, figure 2.6 shows the diamet-
rically opposite patterns of growth rates observed in four African countries.
Nigeria and Democratic Republic of Congo, for instance, exhibit the typi-
cal U-shaped pattern of growth discussed earlier. In contrast, Botswana
and Mauritius follow an inverted U-shaped growth path, reaching their
peaks of 8 percent to 10 percent in the 1970s and 1980s, respectively,
before leveling off to around 4 percent to 5 percent in the more recent
years, more or less similar to the experience of Asian countries.
What is more striking is how rapidly country growth performance has
diversified since the mid-1990s. Between 1995 and 2004, 12 African coun-
tries have seen GDP growth rates in excess of 5 percent, alongside others
that are experiencing negative growth rates. This differentiation is becom-
ing wider over time, as exemplified by the comparative performance dur-
FIGURE 2.6Smoothed Average Growth in Real GDP Per Capita: Nigeria, DemocraticRepublic of Congo, Botswana, and Mauritius
�2
�1
0
1
2
3
perc
ent
a. Nigeria
1960 1970 1980 1990 2000
year
�6
�4
�2
0
2
perc
ent
b. Democratic Republic of Congo
1960 1970 1980 1990 2000
year
0
2
4
6
8
10
perc
ent
c. Botswana
1960 1970 1980 1990 2000
year
2.0
2.5
3.0
3.5
4.0
4.5
perc
ent
d. Mauritius
1960 1970 1980 1990 2000
year
Sources: WDI 2006, PWT 6.1 (Heston, Summers, and Aten 2002), and GDN 1998.

AFRICA’S LONG-TERM GROWTH EXPERIENCE IN A GLOBAL PERSPECTIVE 41
ing the most recent five-year period (1999–2004). Excluding the oil coun-
tries, median per capita growth rates in the fastest-growing, middle, and
slowest-growing thirds of the African countries we have studied—each
comprising 13 countries—were 3.3 percent, 1.2 percent, and –1.0 percent,
respectively.1 Outside of the mineral-exporting group, rapid growth during
this period has also been associated with substantial diversification of pro-
duction and exports.
The other major contrast is between large and small countries’ growth
rates (figure 2.7a). African countries with large populations exceeding 35
million (Nigeria, Democratic Republic of Congo, Ethiopia, and South
Africa) have grown much more slowly than small and medium-size coun-
tries, pulling down population-weighted average growth rates of the
region. An extreme example is the case of the Democratic Republic of
Congo, which hosts nearly 8 percent of Sub-Saharan Africa’s population,
with a negative average growth rate of per capita income for the 45-year
period of –2.7 percent. The average growth rate for the group fell behind
the others particularly sharply during the growth contraction phase. The
gap closed rapidly after the late 1990s, partly reflecting revival of growth in
Nigeria, helped along by the oil price boom, reduction of hostilities in the
Democratic Republic of Congo, and strong growth performance in Ethiopia
after the fall of the Derg regime.
As can be seen in figure 2.7b, population growth rates from 1960 to
2004 within Africa were higher for countries with large- and medium-size
populations than for those with small ones. At the same time, GDP per
capita growth rates of all three categories, as seen in figure 2.7a, started
improving around 1995, following the downward trends in population
growth rates of all three categories of countries from 1985 to 1990. The fig-
ure shows that these large countries have grown on average about 1.5 per-
cent to 3 percent slower than the small countries over the period from
1960 to 1990. It is only from the 1990s until 2004 that there seems to be a
convergence pattern among all three types of countries based on their total
population sizes. The evidence also points to the age dependency ratios of
the small countries being about 7 percent to 10 percent lower than both
the medium-size and the large countries. However, the potential labor
force growth rates for these three categories do not seem to be significantly
different from one another, as can be seen in figure 2.7d.
We also distinguish growth performance across countries in four oppor-
tunity groups, determined by location and resource endowment. Table 2.1

42 CHALLENGES OF AFRICAN GROWTH
includes the list of countries classified by opportunity sets, along with their
GDP and population shares in Sub-Saharan Africa, as well as other key
indicators of economic and social progress at the beginning and end of the
period of analysis (1961–2004). About one-third of African economies are
landlocked, compared to the global average of 11 percent. About 30 per-
cent of the countries in Sub-Saharan Africa are resource rich, compared to
19 percent in EAP and 0 percent in SAR. These criteria are important in
terms of distinguishing growth performance (Collier and O’Connell 2006).
Globally, while coastal economies have invariably done better than their
landlocked counterparts, resource-rich coastal countries have underper-
formed compared with the coastal resource-poor economies over the
entire period from 1970 to 2004.
Figure 2.8 confirms broadly that SSA coastal economies outperform
landlocked economies, but being resource rich under both categories con-
fers a growth performance advantage over their poorer cousins, particularly
during times of resource price booms. What is even more striking is that the
landlocked, resource-rich economies trump all other categories, most likely
FIGURE 2.7Growth Rates and Demographic Indicators, by Size
�101234
1960 1970 1980 1990 2000
0.030
0.025
0.020
1960 1970 1980 1990 2000
80
85
90
95
1960 1970 1980 1990 2000 1960 1970 1980 1990 2000
0.005
0
�0.005
large small medium
year year
year year
a. Growth rates in SSA by size
c. Age dependency ratios by size d. Potential labor forcegrowth rates by size
b. SSA’s population growthrates in SSA by size
Sources: WDI 2006, PWT 6.1 (Heston, Summers, and Aten 2002), and GDN 1998.

AFRICA’S LONG-TERM GROWTH EXPERIENCE IN A GLOBAL PERSPECTIVE 43
driven by Botswana’s stellar sustained growth performance. The other
resource-rich, landlocked country included in the sample is Zambia, which,
as we saw earlier, posted reasonably rapid growth until the mid-1970s.
The impact of the diverse growth experience is also reflected in the
impact it has had on individual incomes and welfare. Taking a long-term
trend look, countries have distinguished themselves in terms of how much
their incomes per capita have grown over the 45-year period. Figure 2.9
depicts the wide variation in the progress made by the 40 African countries
for which we have complete data. Table 2.1 also presents the population
and income weights of each of these countries. Each country’s progress in
per capita income since 1960 is measured by the ratio of per capita income
in 2004 to that in 1960 (in 1996 international dollars). In nine countries
income per capita has actually regressed relative to the levels in 1960.2
Surprisingly, only three among these are countries that have suffered from
prolonged conflict (Angola, Sierra Leone, and Democratic Republic of
Congo). The rest appear to have had long periods of very slow growth or
to have suffered prolonged crises as they struggled to climb out of the
shocks suffered during the late 1970s.
As expected, African middle-income countries generally grew more
rapidly than their counterpart low-income ones. Of the 13 middle-income
countries, 7 have acquired their current status largely on account of their
mineral wealth, including oil. Not all African middle-income countries,
however, experienced rapid growth or grew throughout the 45-year
period. South Africa’s 2004 GDP per capita at 1996 international prices, for
example, was only 20 percent above that of 1960. Equatorial Guinea’s
newfound oil wealth suddenly catapulted it into the club of upper-middle-
income countries. Given that more than half of the African middle-income
countries are resource rich, volatility of growth has also been a character-
istic of their growth experience.
The rest of the Sub-Saharan Africa countries are bunched in a narrow
range between stagnation (ratio of 1) and a doubling of income per capita
over a 45-year period—a relatively low achievement by global standards.
Most of these experienced economic stagnation for two decades between
the mid-1970s and mid-1990s, usually after respectable growth perform-
ance in the previous decade and a half. For countries such as Uganda,
Mozambique, and Ghana, rapid growth during the past 15 years has
enabled them to more than recoup the severe losses in income suffered
during the previous two decades. As expected, differences in average

44 CHALLENGES OF AFRICAN GROWTH
TABLE 2.1Growth and Selected Indicators in African Countries, Categorized by Opportunity Groups
Average growth Ratio of Proportion Proportion Gross in real GDP income in of GDP of population primary per capita, 2004 to 1960 in SSA, in SSA, enrollment
Country 1961–2004 (%) (per capita) 1960 (%) 1960 (%) rate, 1960 (%)
Coastal, Resource Rich Gabon 2.44 2.73 4.86 0.22 —Mauritania 1.59 1.75 1.80 0.44 8Congo, Rep. of 1.47 4.17 0.73 0.44 78Cameroon 1.01 1.28 2.76 2.37 65Nigeria 0.86 1.18 1.69 18.26 36Namibia 0.83 1.34 5.33 0.28 —Guinea 0.23 1.05 4.48 1.40 30Angola –0.16 0.69 4.01 2.15 21Sierra Leone –0.83 0.88 1.75 1.00 23Coastal, Resource Poor Mauritius 3.61 5.01 5.03 0.30 98Cape Verde 3.45 4.16 1.62 0.09 —Tanzania 1.43 1.52 0.62 4.56 25Kenya 1.23 1.49 1.27 3.73 47Gambia 1.09 1.41 1.55 0.16 12South Africa 1.00 1.60 8.01 7.78 89Togo 0.89 1.21 1.46 0.68 44Benin 0.70 1.20 1.75 0.92 27Mozambique 0.60 1.05 2.55 3.34 48Côte d’Ivoire 0.55 1.01 2.62 1.69 46Ghana 0.22 1.85 1.36 3.03 38Senegal 0.10 0.95 2.99 1.43 27Comoros –0.24 0.91 3.15 14Guinea–Bissau –0.85 1.11 0.69 0.24 25Madagascar –0.99 0.64 2.01 2.40 52Landlocked, Resource RichBotswana 6.37 9.08 1.60 0.21 42Zambia –0.59 0.77 1.90 1.41 42Landlocked, Resource PoorLesotho 3.31 4.38 1.17 0.39 83Seychelles 2.48 3.4 5.01 0.02 —Uganda 1.93 1.98 0.91 2.94 49Malawi 1.32 1.64 0.69 1.58 —Sudan 1.31 1.61 1.65 4.99 25Burkina Faso 1.22 1.42 1.25 2.07 8Ethiopia* 0.82 1.27 0.86 10.19 7Chad 0.69 1.93 1.91 1.37 17Rwanda 0.56 1.13 1.53 1.23 49Burundi 0.44 1.16 0.84 1.32 18Mali 0.23 1.11 1.62 1.95 10Central African Rep. –0.76 0.54 3.52 0.69 32Niger –1.31 0.49 2.63 1.35 5Congo, Dem. Rep. of –2.66 0.24 1.57 6.86 60
Sources: Author calculations based on WDI 2006, PWT 6.1 (Heston, Summers, and Aten 2002), and GDN 1998.
Note: Ethiopia became landlocked in 1994, with the independence of Eritrea. Seven out of the 47 countries are not included because they did not have complete data for 1960. — = not available; km = kilometer; km2 = square kilometer.

AFRICA’S LONG-TERM GROWTH EXPERIENCE IN A GLOBAL PERSPECTIVE 45
Life Road Proportion Proportion Gross Life Roadexpectancy density, of GDP of population primary expectancy density
at birth, 1969 (km road/ in SSA, in SSA, enrollment at birth, 1999 (km road/1962 (years) km2 land) 2004 (%) 2004 (%) rate, 2004 (%) 2004 (years) km2 land)
41.48 0.020 7.29 0.18 130 54.08 0.03239.46 0.007 1.73 0.39 94 53.26 0.00742.64 — 1.68 0.53 89 52.48 0.03740.46 0.095 1.93 2.25 117 45.98 0.07440.46 0.096 1.10 19.71 99 43.65 0.21343.72 — 3.92 0.28 — 47.46 0.08034.29 — 2.58 1.11 79 53.90 0.12433.96 0.060 1.51 1.97 — 41.18 0.04132.01 — 0.85 0.75 145 41.11 0.158
60.26 0.970 13.82 0.17 103 72.67 0.94152.96 — 3.70 0.07 111 70.42 0.27341.66 0.018 0.52 5.07 101 46.19 0.10045.95 0.070 1.04 4.50 111 48.35 0.11232.96 — 1.20 0.20 81 56.34 0.27049.95 — 7.03 6.48 — 44.64 0.29840.51 — 0.97 0.69 101 54.80 0.13840.03 0.060 1.16 0.94 99 54.57 0.06138.51 0.047 1.47 2.67 95 41.83 0.03940.46 0.109 1.45 2.39 — 46.12 0.15846.05 — 1.38 2.96 81 57.20 0.17338.21 0.078 1.55 1.41 76 56.14 0.07643.49 — 1.58 0.08 85 62.87 0.39534.93 — 0.42 0.21 — 44.95 0.15641.67 — 0.71 2.39 134 55.65 0.086
47.51 — 8.00 0.24 105 35.49 0.01842.76 0.046 0.81 1.41 99 38.08 0.090
44.44 — 2.83 0.25 131 35.60 0.196— — 9.36 0.01 110 — —
45.46 0.130 0.99 3.52 125 48.89 —38.43 0.113 0.62 1.55 125 40.22 0.30239.67 — 1.45 4.79 60 56.55 0.00536.97 0.060 0.97 1.69 53 48.10 0.04636.91 0.006 0.60 9.71 77 42.48 0.02935.46 0.020 2.03 1.21 71 43.88 0.02742.96 0.250 0.95 1.18 119 43.92 0.48641.96 — 0.54 1.01 80 44.23 0.56436.78 0.009 0.99 1.69 64 48.31 0.01239.49 0.034 1.05 0.55 64 39.41 0.03835.96 0.005 0.72 1.69 45 44.70 0.00841.96 0.060 0.21 7.46 — 43.71 0.069

46 CHALLENGES OF AFRICAN GROWTH
FIGURE 2.8Sub-Saharan Africa’s Smoothed Average Growth in Real GDP Per Capita byOpportunity GroupsCountries with full set of growth observations
�4
�2
0
2
4
6
1960 1970 1980 1990 2000 2010
landlocked, resource poor landlocked, resource rich
year
perc
ent
coastal, resource richcoastal, resource poor
Sources: WDI 2006, PWT 6.1 (Heston, Summers, and Aten 2002), and GDN 1998.
FIGURE 2.9Growth Experience of Countries in Sub-Saharan Africa
AGO
BDIBEN
BFA
BWA
CAF
CIV
CMR
COG
COM
CPV
ETH
GAB
GHAGIN
GMB
GNB
KEN
LSO
MDG
MLI
MOZ
MRT
MUS
MWI
NAM
NER
NGARWA
SDN
SEN
SLE
SYC
TCDTGO
TZA
UGA
ZAF
ZAR
ZMB
�2.0
0.0
2.0
4.0
6.0
aver
age
grow
thra
te, 1
960–
2004
(%)
0.0 2.0 4.0 6.0 8.0 10.0
ratio of per capita income in 2004 to per capita income in 1960
Sources: WDI 2006, PWT 6.1 (Heston, Summers, and Aten 2002), and GDN 1998.

AFRICA’S LONG-TERM GROWTH EXPERIENCE IN A GLOBAL PERSPECTIVE 47
growth rates match the differences in the progress made in terms of per
capita incomes.
What is also striking is that countries with very similar opportunities
also have very different growth experience and outcomes, depending on
the strategies pursued and the policy disposition adopted. To illustrate this,
boxes 2.1 and 2.2 present contrasting outcomes from different strategic
approaches adopted by pairs of countries with similar resource bases or
geographic situations. These pairs can have widely differing experiences
because of different strategic approaches. The two boxes compare the
experiences of Botswana and Zambia, both landlocked and resource rich,
and Mauritius and Côte d’Ivoire, both coastal and (initially) agriculturally
based. Differences in the long-term strategies adopted in exploiting similar
opportunities ended up with Botswana and Mauritius being in the upper-
middle-income countries; however, Zambia’s and Côte d’Ivoire’s per capita
incomes have hardly progressed relative to their levels in 1960.
BOX 2.1
Different Development Strategies—Very Different Results:
Mauritius versus Côte d’Ivoire
Sources: WDI 2006, PWT 6.1 (Heston, Summers, and Aten 2002), and GDN 1998.
15,441
3,084
1,606
Côte d’Ivoire
1,6240
5,000
10,000
15,000
1960 1970 1980 1990 2000
year
inco
me
per c
apita
(PPP
adj
uste
d,19
96 in
tern
atio
nal $
)
Mauritius
(Box continues on the following page.)

48 CHALLENGES OF AFRICAN GROWTH
BOX 2.1 continued
Côte d’Ivoire and Mauritius are both coastal, resource-poor countries thatchose to pursue very different development paths with very different out-comes. Côte d’Ivoire chose the import substitution approach to structuraltransformation after initial and successful agricultural export–led growth.Mauritius opted for export diversification and export-led structural transfor-mation after initial attempts to follow an import substitution strategy. By2004, Côte d’Ivoire’s GDP per capita of $1,624 (in 1996 international dollars)was more or less the same as it was in 1960 ($1,606). In contrast, with aGDP per capita of $15,441 (in 1996 international dollars) in 2004, Mauritius’income per capita is five times its 1960 level of $3,084.
Mauritius did have a head start in human development—much higher lifeexpectancies and educational attainment. Mauritius consolidated this posi-tion and is now among the world’s upper-middle-income countries. From alargely monoculture economy—sugar, with initial intent to take the path ofimport substitution—Mauritius changed strategies in the early 1970s to-ward a private sector–led, diversified export economy and has stayed thecourse at a phenomenal average growth rate of 5.4 percent for nearly fourdecades now.
This pivotal strategy involved a combination of export-promotion policies,channeling of rents from preferential sugar export agreements with Europe(guaranteed volume of exports at a price on average about 90 percentabove market price) to finance domestic private sector investment for ex-port diversification, and export-oriented foreign direct investment fromeconomies like Hong Kong (China). In successfully exploiting the global op-portunities for growth, the role of government was emphasized in creatingpolitical, social, and economic institutions for the better functioning ofmarkets.
Policies aimed at securing manufactured export–led growth proved crucialfor the sustained growth performance of this isolated island economy.Since the mid-1980s, the volume of goods imported and exported by Mau-ritius has grown rapidly, at annual rates of 8.7 percent and 5.4 percent, re-spectively. The openness ratio has correspondingly increased from about

AFRICA’S LONG-TERM GROWTH EXPERIENCE IN A GLOBAL PERSPECTIVE 49
70 percent to 100 percent, while Africa’s average stagnated at around 45 percent (Subramanian 2001). Preferential access provided by Mauritius’trading partners for sugar and for textile and clothing, which together ac-counted for about 90 percent of Mauritius’ total exports, implicitly subsi-dized the export sector growth.
Côte d’Ivoire, however, locked in primary commodity export dependence,presents a contrasting growth experience. For the 45 years since 1960 theaverage growth rate of Côte d’Ivoire’s per capita income has been approxi-mately zero. The significant growth in the first 15 years since 1960, underHouphet Boigny was virtually offset by the decline in income per capitasince the late 1970s. Agriculture provided about 75 percent of export earn-ings in 1965, with coffee and cocoa as the country’s major exports. By2004, this situation had hardly changed—agriculture provided 60 percent ofexport earnings, with the coffee and cocoa sector, bringing in about 40 per-cent of export revenue (AfDB/OECD 2005).
In contrast to the Mauritian strategy of export diversification and export-ledgrowth (and like many other African countries), Côte d’Ivoire implementeda vigorous but unsuccessful import substitution strategy for manufacturingand agricultural processing. The strategy was financed by a combination oftaxing the agricultural sector and attracting foreign direct investment intocapital-intensive industrial activities. Foreign direct investment was attract-ed through incentives that offered attractive returns to investors and re-duced infrastructural transaction costs. Between 1960 and 1980, light man-ufacturing grew at the rate of 13 percent per year, and its contribution toGDP increased from 4 percent in 1960 to 17 percent in 1984. In 2002–03,this contribution remained more or less unchanged at 18 to 19 percent. It isargued, however, that the bulk of earnings from the capital invested in in-dustry flowed out of the country in the forms of tax-free profits, salary re-mittances, and repatriated capital.
A key contrast with Mauritius on the policy front is the overvaluation of theCFA franc, which became most severe during 1980 to 1994, ushering in thegrowth collapse and the Côte d’Ivoire debt crisis, which Mauritius did nothave. By the time these problems were resolved in the mid-1990s, nearlytwo decades after Mauritius embarked on its reforms, instability had set in,exacerbating stagnation.

50 CHALLENGES OF AFRICAN GROWTH
BOX. 2.2
Contrasting Growth Paths of Two Landlocked,
Resource-Rich Countries: Botswana and Zambia
Sources: World Development Indicators (WDI) 2006, Penn World Tables (PWT) 6.1 (Heston, Summers, and Aten2002), and Global Development Network (GDN) 1998.
Botswana and Zambia are two landlocked, resource-rich African countriesthat have followed two very different approaches in managing and using therents from their resource wealth to achieve very different outcomes.Botswana’s remarkable per capita income growth performance, averaging6.4 percent over the period from 1960 to 2004, enabled it to move from alow-income poor country in 1960 to an upper-middle-income country ($8,936in 1996 international dollars) since 1998. Zambia’s per capita income, how-ever, on average retrogressed at (0.6 percent per annum over the past 45 years, and as a result, its 2004 level of $902 in 1996 international prices is23 percent below the 1960 level of $1,167. It is striking that Botswana’s 1960per capita income was 20 percent below that of Zambia. The two countries’income paths crossed each other around 1970, moving in opposite directions.
Botswana, the fastest-growing economy in Africa (and among the fastestglobally) is landlocked, natural resource dependent, and lacking a history as
0
2,000
4,000
6,000
8,000
10,000
Botswana
1,167
984
902
8,936
1960 1970 1980 1990 2000
year
inco
me
per c
apita
(PPP
-adj
uste
d,19
96 in
tern
atio
nal $
)
Zambia

AFRICA’S LONG-TERM GROWTH EXPERIENCE IN A GLOBAL PERSPECTIVE 51
(Box continues on the following page.)
a settler colony; hence, it is not a beneficiary of institutions evolving wherecolonists settled. Arguably, four major reasons are behind this success sto-ry: the strength of its state capacity; its being part of Southern Africa’s rel-atively effective infrastructure system, which helped offset the negative ef-fects of remoteness; its belonging to the Southern African customs unionand monetary area (for a long period), which served as a commitment in-strument against rent seeking; and, most important, its incessant followingof the self-disciplinary rule called the Sustainable Budget Index, for the useof mineral rents and managing of reserves, combined with stringent appli-cation of public scrutiny to the government’s expenditure and investmentprogram (Maipose and Matsheka 2006; Rodrik 2003).
About 40 percent of Botswana’s growth rate, on average, was accounted forby the growth in the mining sector, although recent economic diversificationhas reduced this contribution (Iimi 2006). Minerals accounted for 80 percentof its exports. The government share of mineral revenue averaged around 50 percent, and this source of revenue amounts to 35 percent of GDP.
Botswana managed and used rents from its mineral wealth prudently andequitably. Part of its strategy was to channel the returns from the abundantmineral endowment into improving human capital and the social well-beingof its citizens. The government avoided Dutch disease mainly because thegovernment had taken care not to spend more than the economy could ab-sorb. Reserve accumulation during boom periods and rapid responses toadverse terms-of-trade shocks are two crucial facets of Botswana’s super-prudent macroeconomic policy. For example, three funds were establishedto provide for stabilization reserves, public debt service, and local develop-ment opportunities (Faber 1997).
A secure political elite (with electoral support since independence) had pur-sued growth-promoting policies, which it developed or modified, and main-tained viable traditional and modern institutions of political, economic, andlegal restraint, thereby minimizing the adverse consequences of resourcewealth. Sustainable development was underlined by development planningand pragmatism—not ideological dogma. Under this approach, all mineralrevenues were supposed to finance investment expenditure, defined as de-velopment expenditure and recurrent spending on education and health.
Zambia chose a very different approach to managing and using its naturalresource wealth. Following the Fabian socialist principle—the state has

52 CHALLENGES OF AFRICAN GROWTH
BOX 2.2 continued
responsibility for collecting and redistributing rents from capital, natural re-sources, and labor to achieve egalitarian goals—Zambia’s first leader decidedto have strong state involvement in the copper industry. Overall, policy envi-ronment and weaknesses in governance in Zambia combined to create acapital-hostile environment, limiting accumulation and undermining produc-tivity growth by diverting investable resources to unproductive uses.
Mwanawina and Mukungushi (2006) present three sad stories of the cop-per industry in Zambia. First, around the time of independence, Zambia,along with other key producers, adopted a monopolistic strategy in theglobal mining market by cutting down production with the hopes of affect-ing the world supply of copper and exerting upward pressure on the worldprice of copper. Consequently, the country lost out on potential mineral rev-enues at the same time it was diverting financial resources toward mainte-nance of stocks, away from investment.
Second, government discouraged private investment in the industry, notwith-standing stagnation of production following nationalization. This exacerbatedthe pressure on local borrowing and deterioration of the balance-of-paymentsposition. The decline in production continued even after the privatization ofthe major mining assets, including the development of the Konkola DeepMining Project and the Mufurila and Nkana divisions in 2000; fiscal pressuresmounted largely because of huge tax concessions given to the new ownersof the mines. This denied the government much-needed tax revenue, not tomention the huge liabilities that the government assumed concurrently.
Third, notwithstanding sustained declines in copper prices in the worldmarket, the government stance was to treat this as a reversible shock thatneeded to be financed, rather than viewing this as a longer-term change re-quiring serious adjustment and diversification efforts away from copper.Combined with the effects of a failed import substitution strategy, the col-lapse in Zambia’s revenue base from copper led to a long-trend decline inper capita income and social development.
Whereas a much narrower difference in the average investment rates be-tween the two countries is much less (investment-GDP ratios of 20 per-cent for Zambia and 26 percent for Botswana), the wide differences in GDPgrowth are quite striking. This gap most likely illustrates how the differencein policy environment and in the quality of scrutiny of public investment canhave huge effects on the ex ante productivity of investment.

AFRICA’S LONG-TERM GROWTH EXPERIENCE IN A GLOBAL PERSPECTIVE 53
Sectoral Composition
Globally, structural transformation of economies has provided the bedrock
of accelerated and sustained growth. Rural and agriculture-dominated
economies in Asia, for example, have undergone significant diversification
away from agriculture even as they underwent phenomenal productivity
growth in that sector through the green revolution. The rapidly growing
Asian countries, for example, have either diversified toward manufactures
or agro-industries. Africa remains the region most dependent on agricul-
ture for livelihood, exports, and employment although, as in the case of
the growth experience, there is some diversity across countries within
Africa.
Slow growth has gone hand in hand with limited structural diversifica-
tion. Traditional agriculture continues to absorb the majority of the labor
force in many African countries, a feature no longer observed in any other
region of the world. At the close of the 20th century, nearly three-quarters
of African livelihoods were still being earned in the agricultural sector—
fully a standard deviation above the level characteristic of other develop-
ing countries in the late 1960s (Ndulu and O’Connell 2006a). As will be seen
later, the relative size of the agricultural sector is in line with the low level
of per capita income in most African countries. On average, agriculture by
the end of the 20th century still contributed roughly one-third of total
GDP in African countries, a share nearly two standard deviations above
the non-African developing-country mean3 (O’Connell and Ndulu 2000).
Irrigation is expensive and extremely limited, with the result that African
agriculture remains largely rain fed and subject to periodic drought.
However, Africa’s share of GDP in industry and within its manufactur-
ing subsector (accounting for about 60 percent of industry) has risen
slowly since the early 1970s, mirroring the trend of the overall developing-
country mean. The African share, however, diverges strongly from that of
the East Asia and Pacific, which increased substantially over the period,
and more recently, Sub-Saharan Africa is also slipping behind South Asian
countries. The services sector share of GDP has averaged 43 percent in
Sub-Saharan Africa. This average showed a pattern of increase until the
early 1980s, and then decreased thereafter.
Following the approach used by Syrquin and Chenery (1989; see table
2.2), O’Connell and Ndulu (2000) assess whether the patterns of sectoral
transformation in African countries depart systematically from what

54 CHALLENGES OF AFRICAN GROWTH
would be expected given the continent’s overall income levels and cross-
country norms.
The authors conclude that given the levels of income and population,
the size of the service sector is markedly smaller in Sub-Saharan Africa,
and that of industry and its manufacturing subsector is markedly larger
than would be predicted on the basis of cross-country norms. Agricultural
output shares are just slightly higher in Sub-Saharan Africa than predicted
on the basis of income and population. The share of the labor force in agri-
culture, in contrast, is notably larger. Consistent with these findings, the
labor productivity differential in favor of nonagricultural activities tends to
be much higher in Sub-Saharan Africa than in other regions.
TABLE 2.2Predicted Shares of Economic Structure at Selected Levels of Income Per CapitaPercent
Actual average Share predicted for per capita income level share for (at official exchange rates)
Component of y < 300 y = 300 y = 500 y = 1,000economic structure (1) (2) (3) (4)
Final demandPrivate consumption 79 73.3 70.2 66.4Government consumption 12 13.6 13.5 13.7Investment 14 18.4 20.8 23.3Exports 16 19.3 20.7 22.6Imports 21 24.6 25.2 26.0Food consumption 39 0.15 34.5 29.1TradeMerchandise exports 14 15.2 16.9 18.8Primary 13 13.9 14.9 15.2Manufacturing 1 1.3 2.0 3.7Production (value added)Agriculture 48 39.4 31.7 22.8Mining 1 5.0 6.6 7.7Manufacturing 10 12.1 14.8 18.1Construction 4 4.4 4.9 5.5Utilities 6 6.7 7.4 8.1Services 31 32.4 34.6 37.8Labor forceAgriculture 81 74.9 65.1 51.7Industry 7 9.2 13.2 19.2Services 12 15.9 21.7 29.1
Source: Syrquin and Chenery 1989, cited in O’Connell and Ndulu 2000.

AFRICA’S LONG-TERM GROWTH EXPERIENCE IN A GLOBAL PERSPECTIVE 55
In fact, despite the large relative size of agriculture in GDP, African coun-
tries have been diversifying into manufacturing more rapidly than would
be expected given their levels of per capita income (O’Connell and Ndulu
2000). The movement into services is somewhat slower than predicted.
Finally, the structure of exports has also remained fairly undiversified,
with continued concentration in a narrow band of primary commodities
(Berthelemy and Soderling 2001, 2002), including minerals. Collier and
O’Connell (2006), using global data on rents from primary commodity
exports, specifically from energy, mineral, and forest resources, classify a
country as a “natural resource economy” or “resource rich” if it generates
more than 10 percent of its GDP in primary commodities rents. Using this
criterion comparing Sub-Saharan Africa with other developing regions
excluding Middle East and North Africa, they find that a stark contrast
already existed in 1960, with 12.5 percent of the SSA sample classified as
resource rich, compared to only 7 percent of the non-Sub-Saharan Africa
sample. With new mineral deposit discoveries, over time this difference
expanded as 16.7 percent of the African sample acquired resource-rich sta-
tus, compared to only 10.5 percent of the non-African.
One consequence of Africa’s delayed structural transformation and
uncharacteristically high dependence on primary commodities has been
high growth volatility, with some stemming from erratic world commod-
ity prices. Furthermore, for nearly three decades since the late 1960s,
world commodity prices have tended to decline, resulting in declining
export revenues, sometimes even in the face of expanding quantities of
exports. More recently, however, with China’s phenomenal increase in
demand for base metals and oil, this trend appears to have reversed, lead-
ing to a rise in growth in oil exporting countries and other mineral
exporters, such as Zambia.
Conclusions
There are three important conclusions we can draw from the analysis of
the growth record in this chapter. First, unlike their Asian counterparts,
African countries, though capable of spurts of high growth, have been
unable to sustain these over longer periods. It is therefore imperative to
understand the reasons behind episodic growth that characterizes many of
these countries, and to place greater emphasis on prudent management of

56 CHALLENGES OF AFRICAN GROWTH
responses to shocks. Second, not only has the past decade and a half seen
more countries with higher growth, but there has been a significant
upward shift in the growth trajectory for the 15 fast growers, as well as a
sustaining of the faster pace. This may point to concurrent scaling up of
growth, diversification of its sources, and fundamental changes in the
growth process. In any case, this change challenges the report to explain
this shift and draw lessons for the future. Third, there is far greater diver-
sity in growth performance during the past decade and a half than during
the period of growth collapse in the previous two decades. It is therefore
important to better understand what characteristics distinguish these
countries and hence are critical drivers of growth. Furthermore, since
there are also significant differences in the growth performance across
opportunity groups, country context is important to the success of growth
strategies, and any strategic direction offered at the level of this report has
to provide options that accommodate the different contextual needs. It is
also for this reason that the report not only looks at regional trends, but
also presents assessments of the relative importance of the key drivers for
individual countries.
Notes
1. Oil-exporting countries grew at a median per capita rate of 3.5 percent. Theupper, middle, and lower thirds of the growth distribution comprise 17 per-cent, 29 percent, and 25 percent of Africa’s population, respectively.
2. These include Angola, Central African Republic, Comoros, Democratic Repub-lic of Congo, Madagascar, Niger, Senegal, Sierra Leone, and Zambia.
3. For these sectoral GDP shares, we use value added in constant 1995 dollars inorder to abstract from relative price movements.

In this chapter, we examine the influential factors behind the African
growth record and assess their relative importance in the growth experi-
ence in African countries. This is done using three approaches: First, at an
aggregate level we employ the conventional decomposition of sources of
growth to assess the relative importance of capital accumulation, labor,
and productivity to growth. This is done for the region as a whole and for
the 19 African countries for which complete and consistent data are avail-
able. We rely in particular on the work by Collins and Bosworth (1996,
2003) and Ndulu and O’Connell (2003), with the latter covering a larger
set of African countries. A key conclusion from this analysis is that we
have to look beyond differences in the rate of factor accumulation to
understand Africa’s lagging growth performance compared with that of
other regions. We have to unpack the large productivity residual by
employing meso- and microanalysis.
Second (and partly to confirm the aforementioned conclusions), we use
firm-level data from investment climate surveys to assess the relative
importance of different factors on the attractiveness of African countries to
investors and the cost of doing business. The assessment uses the bench-
marks of other developing countries to assess the state of institutional, pol-
icy, and regulatory frameworks; business regulations and their
enforcement; adequacy and quality of infrastructure; macroeconomic sta-
bility; protection of property rights; and functioning of the financial sys-
CHAPTER 3
Explaining the African Growth Record:
What Appears to Matter Most
57

58 CHALLENGES OF AFRICAN GROWTH
tem. A separate study assessing constraints to private sector growth, pre-
pared as a background paper for this report (Ramachandran, Tata, and
Shah 2006), provides more details of this assessment.
Third, we compare the extent of the deviation of the growth conditions
in African countries from those obtaining in other regions, to establish
where the gaps are widest. First, using the vast cross-country empirical
work on growth and employing global data assembled for this study, we
identify the globally important factors for explaining growth and assess
how these are important in the African countries’ growth experience.
Then we undertake a benchmarking exercise for African growth condi-
tions relative to three comparators—global average of developing coun-
tries, South Asia, and East Asia and Pacific. Noting that the region has
lagged seriously behind in growth, we include East Asia and Pacific among
the comparators to emphasize the magnitude of the effort needed to close
the gap. We also track the changes in the individual components of these
growth conditions (that is, the factors influencing growth) over the three
phases of the U-shaped path of the African growth experience, in order to
identify the areas in which Africa is closing the gap with other developing
regions and those areas requiring much more effort toward such closure.
This analysis is done at the regional level and for 36 individual countries
that have adequate data over the entire period of 45 years.
We judiciously use findings from cross-country studies, which have
helped to identify factors that tend to have the highest likelihood of influ-
encing growth performance, without drawing causality conclusions from
them. We appreciate the wide range of econometric and conceptual prob-
lems plaguing cross-country growth regression. The appendix has a more
detailed econometric discussion and empirical analysis behind this assess-
ment. We use the results from the empirical work presented in the appen-
dix to more explicitly assess the relative contribution of each factor of
growth to the gap between African growth and that of other regions.
Sources of Economic Growth: Lessons from Growth Accounting
Long-term growth is a product of both the rate of capital accumulation
(physical and human) and returns to investment. The results from growth
decompositions point to the importance of both factors in Africa’s growth

EXPLAINING THE AFRICAN GROWTH RECORD: WHAT APPEARS TO MATTER MOST 59
experience, as is the case in all other regions. In a global study, Bosworth
and Collins (2003) estimate that total factor productivity (TFP) growth
accounts for 41 percent of growth in 84 countries they study. For Sub-
Saharan Africa as a whole, slightly less than half of the growth difference
with the other developing regions is due to slower accumulation of physi-
cal capital per worker, and slightly more than half is accounted for by the
slower growth in the productivity residual. As noted earlier, not only are
investment levels lower in the region but the returns are also much lower.
At international prices, the level of investment in Sub-Saharan Africa
(SSA) averaged about half that in other developing regions and yielded
about half of the average investment returns.
The results of the decompositions are presented in tables 3.1 and 3.2
(Bosworth and Collins 2003), whereby gross domestic product (GDP)
growth per worker is broken down into the contribution of physical and
human capital and a productivity growth residual. The U-shaped path of
Africa’s average growth rate resurfaces. In the 1960–73 phase, the average
growth rate of output per worker was 2.7, of which 1.6 percentage points
represented the contribution by TFP and 0.9 percentage points was capital
accumulation. During this period, both capital accumulation and TFP were
on a rising trend, while the contribution of education per worker was min-
imal, at 0.16 percentage points.
The period spanning 1973 to 1990 marked a serious collapse in growth
as output per worker fell precipitously at an average rate of –0.48 percent
annually. The contribution of the productivity residual in this period
turned sharply negative, at –1.16 percentage points, more than offsetting
the marginally positive contributions of physical capital accumulation (at
0.41 percent) and education per worker (at 0.27 percent).
In the past decade and a half (1990–2003), some improvements in the
growth of output per worker for SSA were registered, moving the regional
average into the non-negative levels. Again, the contribution of TFP dom-
inated this growth recovery. This is consistent with the findings of other
studies (for example, Berthelemy and Soderling 2001), which found that
Africa’s recovery in the second half of the 1990s was entirely accounted for
by rapid increases in the productivity residual. The contribution of human
capital also increased sharply during this period to 0.40 percentage points.
The standard interpretation of a low residual is slow technological
progress (O’Connell and Ndulu 2000). The traditional approach has been
to break down technical change into three branches—invention, the cre-

60 CHALLENGES OF AFRICAN GROWTH
TABLE 3.1Sources of Growth, by Regions, 1960–2003
Contribution ofOutput per Physical Factor
Region/period Output worker capital Education productivity
World (84)1960–2003 3.82 2.26 1.00 0.33 0.911960–73 5.10 3.42 1.22 0.31 1.851973–90 3.41 1.68 0.89 0.40 0.381990–2003 3.09 1.88 0.93 0.27 0.67Industrial countries (22)1960–2003 3.36 2.23 0.95 0.31 0.951960–73 5.16 3.86 1.34 0.32 2.161973–90 2.79 1.53 0.75 0.38 0.391990–2003 2.31 1.55 0.84 0.22 0.49China (1)1960–2003 6.91 4.97 1.86 0.36 2.681960–73 3.40 1.21 0.30 0.37 0.531973–90 7.55 5.24 1.95 0.41 2.801990–2003 9.70 8.51 3.32 0.29 4.72East Asia less China (7)1960–2003 6.52 3.81 2.23 0.53 1.021960–73 6.92 3.94 1.86 0.48 1.551973–90 7.20 4.26 2.65 0.61 0.951990–2003 5.24 3.12 2.05 0.47 0.58Latin America (23)1960–2003 3.70 0.95 0.54 0.36 0.051960–73 5.97 3.09 0.90 0.29 1.881973–90 2.83 �0.18 0.56 0.44 �1.171990–2003 2.61 0.33 0.14 0.34 �0.16South Asia (4)1960–2003 4.63 2.44 1.02 0.35 1.051960–73 3.41 1.31 1.00 0.29 0.021973–90 5.02 2.82 0.84 0.37 1.581990–2003 5.34 3.10 1.29 0.40 1.38Africa (19)1960–2003 3.20 0.60 0.43 0.28 �0.111960–73 5.14 2.73 0.93 0.16 1.621973–90 2.28 �0.48 0.41 0.27 �1.161990–2003 2.48 �0.09 �0.05 0.40 �0.44Middle East (9)1960–2003 4.56 1.92 1.02 0.45 0.431960–73 6.37 4.28 1.51 0.33 2.391973–90 3.89 1.15 1.28 0.50 �0.631990–2003 3.64 0.61 0.20 0.51 �0.11
Source: Bosworth and Collins 2003.

EXPLAINING THE AFRICAN GROWTH RECORD: WHAT APPEARS TO MATTER MOST 61
TABLE 3.2Sources of Growth, Africa, 1960–2003
Contribution ofOutput per Physical Factor
Region/period Output worker capital Education productivity
Cameroon1960–2003 3.40 1.13 0.88 0.27 �0.031960–73 2.46 0.79 0.67 0.19 �0.071973–90 5.10 2.77 2.31 0.36 0.091990–2003 2.14 �0.64 �0.74 0.23 �0.13Côte d’Ivoire1960–2003 3.82 0.42 0.28 0.31 �0.171960–73 8.20 4.56 1.55 0.19 2.771973–90 2.36 �1.02 0.52 0.41 �1.941990–2003 1.46 �1.71 �1.28 0.30 �0.72Ethiopia1960–2003 3.05 0.64 1.02 0.20 �0.561960–73 4.47 2.17 2.20 0.06 �0.091973–90 2.09 �0.64 0.62 0.23 �1.481990–2003 2.90 0.82 0.36 0.28 0.17Ghana1960–2003 2.59 �0.13 0.10 0.33 �0.561960–73 2.71 0.39 0.75 0.67 �1.031973–90 1.15 �1.69 �0.81 0.19 �1.071990–2003 4.38 1.43 0.67 0.16 0.60Kenya1960–2003 4.31 1.04 �0.02 0.37 0.691960–73 6.78 3.78 0.66 0.32 2.781973–90 4.53 0.95 �0.18 0.44 0.681990–2003 1.61 �1.50 �0.47 0.32 �1.35Madagascar1960–2003 1.49 �1.04 �0.05 0.24 �1.231960–73 2.30 �0.09 0.09 0.09 �0.271973–90 0.90 �1.56 �0.24 0.32 �1.641990–2003 1.45 �1.30 0.05 0.30 �1.64Mali1960–2003 3.24 1.17 0.31 0.08 0.771960–73 2.94 1.10 0.61 0.06 0.431973–90 2.28 0.08 0.07 0.10 �0.091990–2003 4.82 2.67 0.33 0.09 2.24Malawi1960–2003 3.84 1.44 1.35 0.20 �0.111960–73 5.46 3.17 4.66 0.08 �1.511973–90 3.49 0.50 0.59 0.19 �0.281990–2003 2.71 0.94 �0.90 0.32 1.54
(Table continues on the following page.)
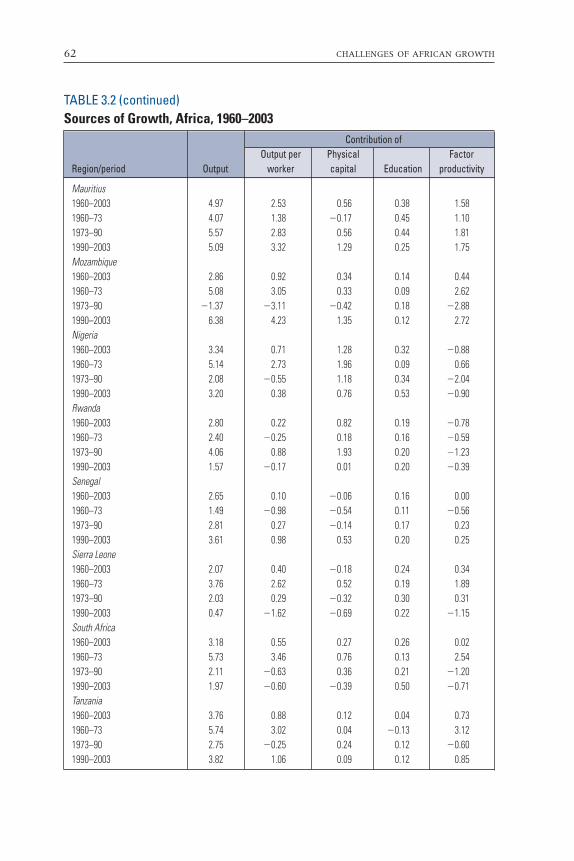
62 CHALLENGES OF AFRICAN GROWTH
TABLE 3.2 (continued)Sources of Growth, Africa, 1960–2003
Contribution ofOutput per Physical Factor
Region/period Output worker capital Education productivity
Mauritius1960–2003 4.97 2.53 0.56 0.38 1.581960–73 4.07 1.38 �0.17 0.45 1.101973–90 5.57 2.83 0.56 0.44 1.811990–2003 5.09 3.32 1.29 0.25 1.75Mozambique1960–2003 2.86 0.92 0.34 0.14 0.441960–73 5.08 3.05 0.33 0.09 2.621973–90 �1.37 �3.11 �0.42 0.18 �2.881990–2003 6.38 4.23 1.35 0.12 2.72Nigeria1960–2003 3.34 0.71 1.28 0.32 �0.881960–73 5.14 2.73 1.96 0.09 0.661973–90 2.08 �0.55 1.18 0.34 �2.041990–2003 3.20 0.38 0.76 0.53 �0.90Rwanda1960–2003 2.80 0.22 0.82 0.19 �0.781960–73 2.40 �0.25 0.18 0.16 �0.591973–90 4.06 0.88 1.93 0.20 �1.231990–2003 1.57 �0.17 0.01 0.20 �0.39Senegal1960–2003 2.65 0.10 �0.06 0.16 0.001960–73 1.49 �0.98 �0.54 0.11 �0.561973–90 2.81 0.27 �0.14 0.17 0.231990–2003 3.61 0.98 0.53 0.20 0.25Sierra Leone1960–2003 2.07 0.40 �0.18 0.24 0.341960–73 3.76 2.62 0.52 0.19 1.891973–90 2.03 0.29 �0.32 0.30 0.311990–2003 0.47 �1.62 �0.69 0.22 �1.15South Africa1960–2003 3.18 0.55 0.27 0.26 0.021960–73 5.73 3.46 0.76 0.13 2.541973–90 2.11 �0.63 0.36 0.21 �1.201990–2003 1.97 �0.60 �0.39 0.50 �0.71Tanzania1960–2003 3.76 0.88 0.12 0.04 0.731960–73 5.74 3.02 0.04 �0.13 3.121973–90 2.75 �0.25 0.24 0.12 �0.601990–2003 3.82 1.06 0.09 0.12 0.85

EXPLAINING THE AFRICAN GROWTH RECORD: WHAT APPEARS TO MATTER MOST 63
ation of new products and processes; innovation, the transfer of invention
to commercial application; and diffusion, the spread of innovation into the
economic environment (Freeman 1991). Notwithstanding the interde-
pendence and feedback among these branches, the first two branches typ-
ically entail production of new knowledge, which is costly and risky to
produce but cheap to imitate at the diffusion stage. The public-good nature
of knowledge and the difficulties of establishing and protecting property
rights are partly behind these features. Most African countries (except
South Africa) are technological followers and are more likely to engage in
the third branch of technical change, diffusion.
Singapore’s case presents an interesting contrast to slow technological
progress in Africa. It is an example of a successful technological follower
whose major source of long-term growth was technical change, initially
via diffusion and some innovation. Ho and Hoon (2006) develop an
approach to accounting for sources of Singapore’s economic growth by
explicitly identifying channels through which Singapore, as a technologi-
cal follower, benefited from international research and development
(R&D) spillovers. They show that 57.5 percent of Singapore’s real GDP-
per-worker growth rate (1970–2002) is due to multifactor productivity
TABLE 3.2 (continued)Sources of Growth, Africa, 1960–2003
Contribution ofOutput per Physical Factor
Region/period Output worker capital Education productivity
Uganda1960–2003 3.69 0.77 0.67 0.24 �0.141960–73 4.23 0.70 1.38 0.16 �0.821973–90 1.16 �1.50 �0.05 0.33 �1.781990–2003 6.54 3.90 0.92 0.22 2.73Zambia1960–2003 1.69 �0.93 �0.85 0.33 �0.411960–73 3.45 0.92 0.39 0.27 0.271973–90 0.95 �2.01 �1.44 0.30 �0.871990–2003 1.53 �0.55 �1.19 0.45 0.20Zimbabwe1960–2003 3.83 0.93 �0.22 0.45 0.691960–73 6.34 3.45 �0.47 0.24 3.691973–90 3.28 �0.19 �0.43 0.70 �0.461990–2003 �0.70 �2.52 0.12 0.33 �2.95
Source: Bosworth and Collins 2003.

64 CHALLENGES OF AFRICAN GROWTH
and, more specifically, 52 percent of the growth is explained by an increase
in capacity to absorb new technology by improving educational quality and
by forging effective links to the world’s technological leaders through trade
(particularly machinery imports) and foreign direct investment. They also
conclude that these two were the most influential factors behind Singa-
pore’s fast pace of multifactor productivity catch-up with technological
leaders. These findings are consistent with findings from other empirical
research. For example Coe, Helpman, and Hoffmaister (1997) and Hejazi
and Safarian (1999) show empirically that how much any single follower-
economy benefits from international R&D spillovers depends on its distance
from the frontier and its stock of human capital, as well as its integration
with technology leaders through trade and foreign direct investment.
Apart from slow technological progress, there are several other candi-
dates that could explain the slow multifactor productivity growth in African
countries. These include falling capacity utilization, particularly during
times when shortage of foreign exchange constrained raw materials
imports;1 high rates of depreciation of physical capital, associated, for exam-
ple, with poor maintenance of public infrastructure, climate shocks that
undermine total factor productivity in agriculture, and pervasiveness of
civil strife that destroys physical capital or suspends its use. At shorter fre-
quencies, the residual may also reflect fluctuations in aggregate demand,
which would affect output via capacity utilization and some degree of
underemployment.
The weak empirical link between physical capital accumulation and
growth is a distinct feature of the SSA growth experience, particularly during
the two decades of economic stagnation between 1970 and 1995. Table 3.3
shows the ex post returns to investment in the developing regions. Clearly
there is some variation in the average economywide returns to aggregate
investment across the regions. Africa does not compare well with the fast-
growing regions of the developing world, including East Asia and Pacific
(EAP), Europe and Central Asia (ECA), and South Asia (SAR).
Interestingly, growth collapse occurred without a corresponding collapse
of investment. In spite of the relatively high ex ante rates of returns to invest-
ment in the region during the 1980s, for example, three sets of reasons may
be behind this striking feature. Capital accumulation may not be taking place
at the same rate as recorded investment. As noted earlier, the average relative
price of investment goods for Sub-Saharan Africa was 70 percent higher than
for the Organisation for Economic Co-operation and Development (OECD)

EXPLAINING THE AFRICAN GROWTH RECORD: WHAT APPEARS TO MATTER MOST 65
countries, or East Asia (Sala-i-Martin, Doppelhofer, and Miller 2004). Using
this information, Artadi and Sala-i-Martin (2003) estimate that the average
growth rate in African countries would have been 0.44 percentage points
higher each year if the relative price of investment goods was the same as in
OECD countries or East Asia.2 In Africa, physical capital accumulation is
import intensive, but in most of these countries capital goods attract very low
tariff rates or are preferentially exempted. The relatively higher investment
prices most likely result from high transport costs caused by shipping cartels,
port inefficiencies (reflecting poor quality of infrastructure or management),
or simple lack of scale economies (Collier 2002; Yeats and Ng 1997).
In addition, failures in governance might have contributed through dis-
tortions that gradually undermine the quality of the capital stock and gen-
erate a negative residual. The governance failures could arise out of the
dominance of inefficient public sector investment during the period of
growth collapse, the prevalence of tax avoidance and self-insurance by
firms and households, and the diversion of resources into rent seeking and
corruption (Vishny and Shleifer 1993). These may all have contributed to
generating an inefficient composition of aggregate investment in Africa
that eroded the quality of the capital stock. A general bias against private
sector accumulation, emphasized by Mkandawire and Soludo (1999),
would produce the same effect unless justified by an unusually high mar-
ginal product of public capital (Ndulu and O’Connell 2006b).
A third possibility that is somewhat speculative is based on increasing
returns and threshold effects and argues that investment yields would
have been much higher if investment rates had been high enough (Sachs
et al. 2004). Structural features that impede the flow of information and
trade, even if unchanged over time, can lower the residual by limiting the
TABLE 3.3Productivity of Investment—ReturnsRatio of growth rate to investment rate
Years AFR EAP ECA LAC MNA SAR
1960–69 0.326 0.301 0.263 0.259 0.540 0.3141970–79 0.243 0.316 0.215 0.247 0.239 0.2251980–89 0.151 0.146 0.109 0.085 0.106 0.2351990–99 0.074 0.191 �0.229 0.143 0.214 0.2202000–02 0.109 0.237 0.258 0.048 –0.022 0.175
Source: Ndulu 2006b.
Note: AFR = Africa; LAC = Latin America and the Caribbean; MNA = Middle East and North Africa.

66 CHALLENGES OF AFRICAN GROWTH
scope for agglomeration economies and the diffusion of existing techno-
logical knowledge (Barro and Sala-i-Martin 1995).
Two important conclusions emerge from analysis of the sources of
growth. First, whereas the results confirm the importance of low levels of
capital accumulation in explaining the slow growth in a large number of
African countries, they also highlight the importance of the productivity
residual in African growth performance. Globally, Bosworth and Collins
(2003) estimate that total factor productivity growth accounts for 41 per-
cent of growth in the 84 countries they studied. This is certainly true for
African countries included in the sample, notwithstanding the significant
diversity across those countries. This feature holds true through all three
phases of the region’s growth path. It dominates the period of growth con-
traction and leads the growth recovery phase of the past decade.
Second, the central role of investment incentives in both capital accu-
mulation and productivity growth leads us to focus on improving the
investment climate, which in addition to identifying actionable policy
areas also targets reducing transaction costs and relieving capacity limita-
tions. The importance of productivity growth further points us to the role
of innovation (technical progress) in raising productivity and competitive-
ness. The potential comparative advantage of low wages in developing
countries, including Africa, can be nullified by low productivity, in part
because of the scarcity of complementary professional skills. Surveys of
investors show that labor is not cheap where productivity is low. Produc-
tivity in turn is influenced not only by the quantity and quality of capital
stock, but also by the quality and quantity of knowledge (Lindbaek 1997).
Doing Business in Africa: The Investment Climate—Transaction Costs, Risk, Capacity
It is generally accepted that the private sector is the cornerstone for growth.
Markets have proved effective in creating opportunities for increasing
incomes through productivity growth. Functioning markets are thus a crit-
ical mechanism for poverty alleviation. The challenge is, therefore, to har-
ness private initiative delivered through markets for sustained growth and
development. The key requirement in this regard is the overall quality of
the investment climate, and Africa has fallen short in this respect. The state
of the investment climate has presented major impediments to economic
growth. While the deficiencies in African economies are to some extent

EXPLAINING THE AFRICAN GROWTH RECORD: WHAT APPEARS TO MATTER MOST 67
influenced by geographic aspects, they are largely the outcomes of ill-
advised government policies. A weak investment climate inhibits the effec-
tiveness of the private sector and also results in prohibitive costs of doing
business.
The investment climate is an all-encompassing phrase that captures a broad
array of concerns, including institutional, policy, and regulatory frameworks;
business regulations and their enforcement to ensure that sound rules not
only exist but are observed and respected by both the markets and the states;
adequacy and quality of infrastructure; and general conditions in which mar-
kets operate. A sound investment climate will also include a stable macro-
economy that facilitates decision making, well-defined property rights, an
effective judicial and contracting system, and a functioning financial system.
This section therefore discusses the different elements of the investment
climate as they pertain to African countries. Of particular interest is the
state of individual components in Africa, highlighted with benchmarking
against other developing regions.
The Cost of Doing Business in Africa:
The Role of Transaction Costs
Investment in Africa is relatively expensive, with the highest cost of doing
business in the world. The costs of infrastructure services make up a dispro-
portionately large part of production and trade costs, barriers to trade raise
the cross-border transaction costs, and bureaucratic red tape and inefficien-
cies exacerbate these costs. The analysis described in this section is drawn
from Eifert, Gelb, and Ramachandran (2005). It is based on a selected group
of six African countries, which are benchmarked against India and China.
The latter two countries have been chosen for comparative analysis because
of their strong performance in the area of traditional manufactured exports.
Further, it has been observed that the severity of the impact of a weak
investment climate is not uniform across market participants. In particular,
firm size and ownership determine how much of a burden falls on the firm.
Thus, this analysis also includes an intraregional comparison based only on
size and ownership of firms.
Infrastructure
Sub-Saharan Africa has weaker infrastructure than other developing
regions. This is equivalent to saying that the costs of power, transport,

68 CHALLENGES OF AFRICAN GROWTH
telecommunications, and security are higher than other regions, as
described later.
Electricity
While infrastructure presents problems across the entire spectrum, access
to reliable and affordable energy has been without doubt the most prob-
lematic in Africa. The problems in this sector originate from government
failures and prevalence of state-owned monopolies, which have generated
a host of inefficiencies. For example, it takes an average of 174 days to get
connected to a power grid in Zambia, compared to 18 days in China. In the
2004 Investment Climate Assessment for Tanzania, 59 percent of surveyed
firms considered electricity to be the most serious impediment to enter-
prise activity, and this pattern is similar in most comparator countries.
The poor quality of infrastructure causes power outages of a frequency
not experienced in any other region. The performance deficiencies in this
sector impose different kinds of costs on firms. The first and most obvious
cost associated with power is output loss, which was about 9 percent in
Kenya compared to 2 percent in China. As figure 3.1 shows, this cost is
also high in the other African countries.
The second cost is due to the need for backup facilities. In Tanzania,
55 percent of firms had generators, compared to 27 percent for China
FIGURE 3.1Energy Costs and Power Outages
0
10
20
30
40
50
60
Kenya Uganda Tanzania Zambia Senegal Benin Morocco China
energy, percentage of firm costs (average) power outages, percentage of lost sales
perc
ent
Source: World Bank Enterprise Surveys (2001–05).

EXPLAINING THE AFRICAN GROWTH RECORD: WHAT APPEARS TO MATTER MOST 69
(Tanzania ICA). Not only are generators expensive to obtain but they are
also less efficient in providing power, especially for small and medium
enterprises. The burden of power outages is not distributed uniformly
across firms. The cost of generators can be prohibitively high for small
firms. This burden falls disproportionately on small firms as they are
unable to compensate for fluctuations in the power supply. Figure 3.2
shows that in all countries, large enterprises were considerably more likely
to own generators than their small counterparts.
Rules, Regulations, and Procedures
Complexity of regulations and procedures imposes yet another burden to
some classes of enterprises. In particular, customs and trade regulations
have been found to present a major constraint on firms in Africa (figure
3.3). For the selected countries, Tanzania has the highest lag time for clear-
ance of both exports and imports, at 14 days and 7 days, respectively. Delays
in clearing goods can have a substantial impact on competitiveness. In fact,
cumbersome customs and trade regulations, and poor customs administra-
tion, have been found to discourage firms from seeking export markets.
FIGURE 3.2Types of Firms Owning Generators
0
10
20
30
40
50
60
70
80
90
100
Kenya Uganda Tanzania Zambia
country
perc
ent
Senegal Benin Morocco China India
micro small and medium large and very large
Source: World Bank Enterprise Surveys (2001–05).
Note: A missing bar indicates that the data are not available.
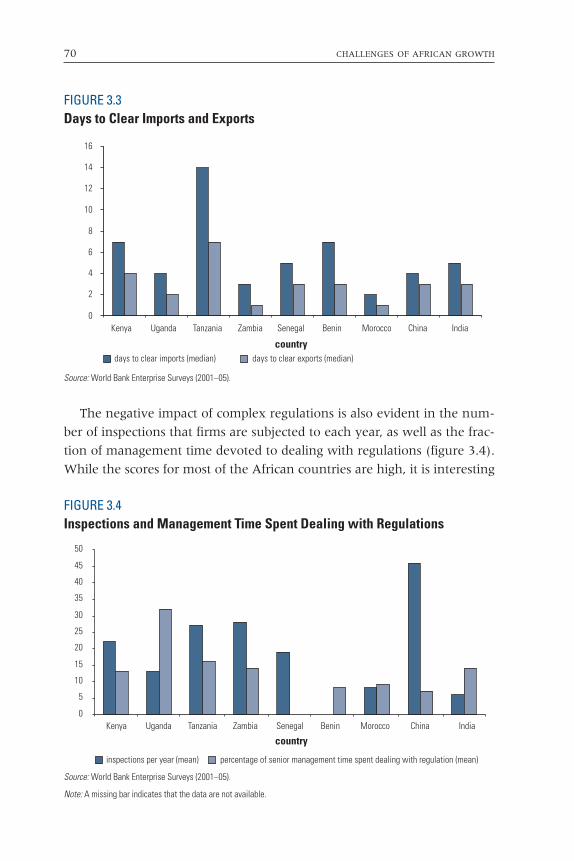
70 CHALLENGES OF AFRICAN GROWTH
The negative impact of complex regulations is also evident in the num-
ber of inspections that firms are subjected to each year, as well as the frac-
tion of management time devoted to dealing with regulations (figure 3.4).
While the scores for most of the African countries are high, it is interesting
FIGURE 3.3Days to Clear Imports and Exports
0
2
4
6
8
10
12
14
16
Kenya Uganda Tanzania Zambia Senegal Benin Morocco China India
days to clear imports (median) days to clear exports (median)country
Source: World Bank Enterprise Surveys (2001–05).
FIGURE 3.4Inspections and Management Time Spent Dealing with Regulations
0
5
10
15
20
25
30
35
40
45
50
Kenya Uganda Tanzania Zambia Senegal Benin Morocco China India
inspections per year (mean) percentage of senior management time spent dealing with regulation (mean)
country
Source: World Bank Enterprise Surveys (2001–05).
Note: A missing bar indicates that the data are not available.

EXPLAINING THE AFRICAN GROWTH RECORD: WHAT APPEARS TO MATTER MOST 71
FIGURE 3.5Crime, Unofficial Payments, and Securing of Contracts
0
1
2
3
4
5
6
7
8
9
Kenya Uganda Tanzania Zambia Senegal Benin Morocco China
cost of crime and security(average percentage of sales)
unofficial payments to “get thingsdone” (average percentage of sales)
percentage contract value in informal payments required to secure a contract (average)
country
perc
ent
Source: World Bank Enterprise Surveys (2001–05).
Note: A missing bar indicates that the data are not available.
that China has a considerably higher number of inspections, but the
amount of time China’s management spends dealing with regulations is the
lowest of all comparators. This high burden of inspections and regulations
also encourages firms to remain in the informal sector. Survey results also
show that regulations and inspections are arduous for exporting enterprises
and as such may be a disincentive to pursuing export-oriented activity.
Cost of Security
Figure 3.5 indicates the high level of insecurity in the operating environ-
ment. The cost of crime and cost of security as a percentage of sales is high in
Sub-Saharan Africa, relative to other parts of the world. Data also indicate
that unofficial payments to get things done can be significant and are as high
as 4 percent in Kenya. Informal payment required to secure a contract is also
high in many countries, indicating the weakness of the judicial system.

72 CHALLENGES OF AFRICAN GROWTH
Estimates of Gross and Net Total Factor Productivity:
Africa in Comparative Perspective
Comparing net and gross total factor productivity provides another view
of how debilitating these costs are to firm performance. In previous work
carried out using the same investment climate data set, a comparison has
been made of the performance of African firms with those in the other
countries. In particular, Eifert, Gelb, and Ramachandran (2005) consider
the cost of energy as well as a range of indirect costs such as transport,
telecommunication, security, land, bribes, marketing, and so on, which
are not often considered in the analysis of TFP. These costs are netted out
from value added to yield a net value added from which a corresponding
measure of net total factor productivity is derived. This broader view of
firm performance, which extends beyond the traditional emphasis on
factory-floor productivity and labor costs, is important in order to under-
stand economic outcomes in Africa. Together with the losses that depress
(gross) productivity, indirect costs associated with operating expenses—
energy, transport, telecom, security, land, bribes, marketing, and so
on—represent a heavy drag on net productivity and profitability in most
African countries in our sample and serve as a brake on competitiveness.
Without going into too much technical detail, we present the key results
of the analysis here.
The cost breakdown shows the relatively large burden of infrastructure
and public services—energy, transport, telecom, water, and security
costs—that together account for more than half of all indirect costs to
firms.
Figure 3.6 provides a cross-country comparison of firms’ cost structures,
including labor (wages, benefits); capital (interest, finance charges,
machine depreciation); raw materials; and other indirect costs. In strong
performers such as China, India, Nicaragua, Bangladesh, Morocco, and
Senegal, the combination of energy and indirect costs are 13 to 15 percent
of total costs, around half the level of labor costs. In contrast, this combi-
nation in most African countries accounts for 20 to 30 percent of total
costs, often dwarfing labor costs. It is worth noting that capital costs—also
tightly related to the business environment—appear to be a major compo-
nent of costs in Ethiopia, Nigeria, and Zambia.
The gap between African and other firms widens when gross and net
TFP are compared, as indirect costs interact with other firm characteristics

EXPLAINING THE AFRICAN GROWTH RECORD: WHAT APPEARS TO MATTER MOST 73
(figure 3.7).3 African countries in the mid-range of 40 to 60 percent of Chi-
nese gross TFP fall to 20 to 40 percent when net TFP is compared. Kenya,
which appears relatively strong on gross TFP, falls dramatically on net TFP
as a result of very high indirect costs. Zambia, the most extreme case, falls
from 30 percent to 10 percent. Only in Senegal—the strongest African per-
former on both gross and net TFP—is the effect of indirect costs relatively
low. African countries have shortfalls in factory-floor productivity, but
high indirect costs further weaken their relative performance.
Existing research also highlights the enormous importance of exporting
in the context of African firms (Bigsten and Söderbom 2006). While we
now increasingly acknowledge the wide diversity in performance across
African countries, enterprise survey data show a similar pattern across
firms within countries in Africa—pushing us to go beyond country charac-
teristics in order to understand better what matters for performance. It is
striking, for example, that the likelihood of an African firm with export
experience exporting at the time of the survey is more than three times as
high as an identical firm that has never exported, signaling significant fixed
entry costs into the exporting business beyond general country conditions.
FIGURE 3.6Cost Structures, Firm-Level Average by Country
0 0.1 0.2 0.3 0.4 0.5 0.6 0.7 0.8 0.9 1
BangladeshSenegal
India
MoroccoNicaragua
ChinaEthiopia
NigeriaBolivia
Uganda
ZambiaTanzania
KenyaEritrea
Mozambique
share of total costs
materials labor capital indirect costs
Source: Eifert, Gelb, and Ramachandran 2005.

74 CHALLENGES OF AFRICAN GROWTH
Many of these costs are described in the previous figures. What is
interesting in the African context is that they tend to vary at the firm
level as well as at the country level. New research on firm perceptions
also indicates that there is enormous variance at the firm level as opposed
to the sector or country level; these perceptions are well correlated with
actual firm experience with regard to the investment climate (Gelb
2007). What is also interesting is that variables such as the supply of
electricity—which one typically does not expect to vary at the firm
level—in fact vary quite a lot across different types of firms. There is also
very strong evidence that participating in the export market has a rela-
tively strong impact on raising productivity, and hence competitiveness,
of the firm through learning by exporting. The estimated productivity
gains from learning in Africa range from 20 to 25 percent in the short
run to 50 percent in the long run. This learning effect appears to be larger
in Africa than elsewhere, perhaps given past high trade restrictions and
the larger technological gap with developed countries, which translate
into a wider scope for learning. Mengistae and Pattillo (2004), among
several others, show a strong positive correlation between productivity
and exporting among African firms. This conclusion remains robust even
after careful accounting for the possibility of causality going in the oppo-
site direction—that is, efficient firms self-select to export (Bigsten et al.
2004; Van Biesebroeck 2005). Panel data, which will be forthcoming for
several countries in Sub-Saharan Africa over the next few years, will
FIGURE 3.7Net and Gross Total Factor Productivity, Adjusted Prices
0
0.2
0.4
0.6
0.8
1.0
1.2
Zambia
Eritre
a
Mozambiq
ue
Ethiop
ia
Nigeria
Bolivia
Ugand
aKen
ya
Tanzan
ia
Nicarag
ua
Bangla
desh
Seneg
al
Morocco Ind
iaChin
a
gross TFP net TFP
inde
x (r
elat
ive
to C
hina
)
country
Source: Eifert, Gelb, and Ramachandran 2005.

EXPLAINING THE AFRICAN GROWTH RECORD: WHAT APPEARS TO MATTER MOST 75
enable us to better understand exactly how this learning takes place in
practice and what learning infrastructure is needed to absorb and adapt
technology to local circumstances.
Indigenous Entrepreneurs and Minority-Owned Firms
A variety of interesting differences are revealed when we disaggregate the
investment climate survey data to look at domestic, entrepreneur-owned
firms. Data show the average firm size of an indigenously owned firm ver-
sus a firm owned by an entrepreneur from a minority ethnic group (that is,
of Asian, Middle Eastern, or Caucasian descent). We see that indigenously
owned firms are the smallest—most are well below 50 workers. European-,
Asian-, and Middle Eastern–owned firms are substantially larger in all the
countries reported. From here on, we group European, Asian, and Middle
Eastern entrepreneurs into one category, of non-indigenous.
Our data also show that indigenously owned firms enter the market at
a significantly smaller size than minority ethnic–owned firms. While the
average firm size at startup of minority-owned firms in Tanzania is about
100 employees, that number is just under 40 employees for an indige-
nously owned firm. For most countries where we have these data, the dif-
ference in startup size is close to 50 percent. We also find that the difference
in startup size persists over time, that the difference in size at time of sur-
vey is not much different than the difference in size at startup, and that, in
many cases, a large gap emerges over time between indigenous and minor-
ity entrepreneurs.
On the other hand, minority-owned firms start operations at a signifi-
cantly larger size than indigenous African–owned firms. But the data also
show that not all African entrepreneurs start small. Further disaggregation
of indigenously owned firms shows that for African entrepreneurs, educa-
tion is very important in determining the size at which they start opera-
tions. African entrepreneurs with a university education start much larger
enterprises compared to those that do not have a university degree in all
countries surveyed.4
Figure 3.8 shows that the difference in size persists over time in most
countries. Size at the time of the survey is also higher for indigenous entre-
preneurs with access to a university education than for those without such
an education. There are two possible interpretations of this result—the
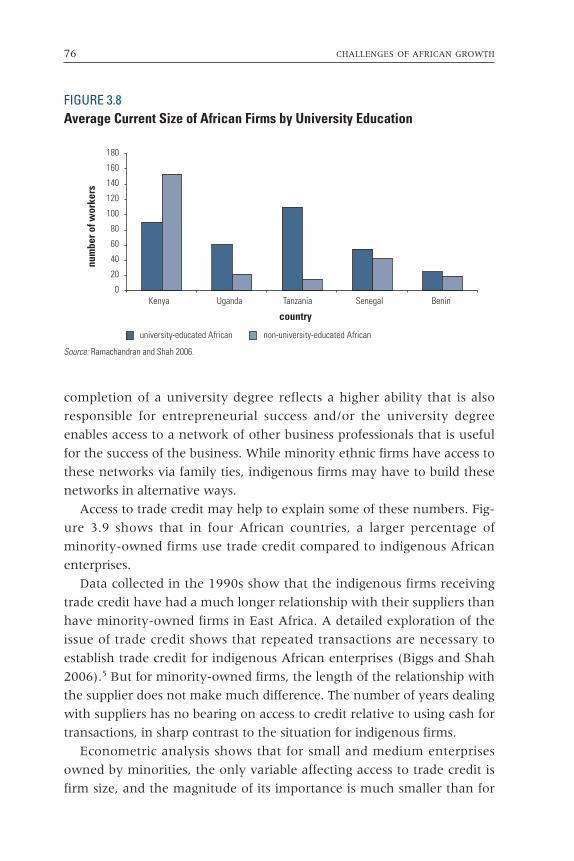
76 CHALLENGES OF AFRICAN GROWTH
completion of a university degree reflects a higher ability that is also
responsible for entrepreneurial success and/or the university degree
enables access to a network of other business professionals that is useful
for the success of the business. While minority ethnic firms have access to
these networks via family ties, indigenous firms may have to build these
networks in alternative ways.
Access to trade credit may help to explain some of these numbers. Fig-
ure 3.9 shows that in four African countries, a larger percentage of
minority-owned firms use trade credit compared to indigenous African
enterprises.
Data collected in the 1990s show that the indigenous firms receiving
trade credit have had a much longer relationship with their suppliers than
have minority-owned firms in East Africa. A detailed exploration of the
issue of trade credit shows that repeated transactions are necessary to
establish trade credit for indigenous African enterprises (Biggs and Shah
2006).5 But for minority-owned firms, the length of the relationship with
the supplier does not make much difference. The number of years dealing
with suppliers has no bearing on access to credit relative to using cash for
transactions, in sharp contrast to the situation for indigenous firms.
Econometric analysis shows that for small and medium enterprises
owned by minorities, the only variable affecting access to trade credit is
firm size, and the magnitude of its importance is much smaller than for
0
20
40
60
80
100
120
140
160
180
Kenya Uganda Tanzania Senegal Benin
num
ber o
f wor
kers
country
university-educated African non-university-educated African
Source: Ramachandran and Shah 2006.
FIGURE 3.8Average Current Size of African Firms by University Education

EXPLAINING THE AFRICAN GROWTH RECORD: WHAT APPEARS TO MATTER MOST 77
indigenous African firms (Biggs and Shah 2006). The authors argue that
members of ethnic networks do not have to rely on establishing long-term
relationships with suppliers to get credit, as their reputation in the net-
work provides enough information to lenders. The authors also indicate
that even smaller firms in the business network have access to credit.
For indigenous firms, firm size is very important in determining trade
credit access, as is the length of relationship with supplier. In the absence
of good information on indigenous African firms, suppliers use size as a
proxy for information. Thus, only larger firms get credit. Smaller indige-
nous African firms have to establish long-term relationships with each
supplier to get credit. There is coordination failure in the indigenous
African business community that prevents firms from developing an infor-
mal credit information system analogous to the ethnic minority business
community.
The aforementioned results are in large part due to the absence of net-
works in the indigenous community. This leads to a paucity of informa-
tion, thereby preventing small, indigenously owned firms from accessing
capital or knowledge that would enable them to grow and prosper. This
problem is compounded by the lack of enforceability of contracts and the
weakness of the judicial system. It is not necessarily a lack of capital per se,
but more the lack of availability of information that is slowing the growth of
indigenous firms in the African private sector.6
FIGURE 3.9Percentage of Firms Receiving Credit
1009080706050403020100
Kenya Uganda
country
perc
ent
Tanzania SenegalZambia Benin
Africans minorities total
Source: Ramachandran and Shah 2006.

78 CHALLENGES OF AFRICAN GROWTH
Benchmarking of Growth Conditions in African Countries
In this section, we use the results from Africa-related cross-country analy-
sis to more explicitly assess the relative importance of various constraints
to growth in explaining the gap between African growth and that of other
regions. It is essentially a benchmarking exercise for African growth con-
ditions. The main objective of the benchmarking assessments carried out
here is not to establish causality but to infer the significance of the different
constraints on growth by isolating predetermined variation in the determi-
nants of growth. Furthermore, we track the evolution of these growth
conditions over time and the changes in their relative importance, taking
into account the results of reform programs pursued in various African
countries. This tracking helps to identify the areas in which Africa is clos-
ing the gap with other developing regions and those requiring much more
effort toward such closure.
A large amount of work has been done to identify key factors influenc-
ing growth and channels through which these factors operated. A short list
of noteworthy contributions that draw on global data to make Africa-
relevant contributions includes Sachs and Warner (1995) on outward ori-
entation; the same authors (1997, 2001) on the natural resource curse;
Bloom and Sachs (1998) on geographical and demographic constraints;
Masters and McMillan (2001) on tropical location and the disease environ-
ment; Easterly and Levine (1997) on ethnic fractionalization and policy;
the same authors (1998) on neighborhood (spillover) effects; Collier
(1999) and Collier and Hoeffler (2004) on civil wars; Mauro (1995) on
corruption; Knack and Keefer (1995) on the rule of law; Acemoglu, John-
son, and Robinson (2001) on institutional legacies of the colonial period;
Guillaumont, Guillaumont Jeanneney, and Brun (1999), Dehn (2000),
and Blattman, Hwang, and Williamson (2004) on vulnerability to external
shocks; Burnside and Dollar (2000) on aid; and Glaeser et al. (2004) on
political leaders.
The appendix presents an update of the analysis done under the African
Economic Research Consortium growth research to identify systematic
features of the growth process and assess the importance of different driv-
ers of growth (see O’Connell and Ndulu 2000; Ndulu and O’Connell
2006a; and Hoeffler 1999/2000). Given the estimated influence of each
determinant on growth, this analysis assesses the extent to which the dif-
ferences in the growth environment (levels of the growth conditions and

EXPLAINING THE AFRICAN GROWTH RECORD: WHAT APPEARS TO MATTER MOST 79
factors) explain the deviation of the predicted growth rate of Africa from
the global sample mean, East Asia and Pacific mean, and South Asia mean
over the entire period from 1960 to 2004. This is akin to undertaking the
regression-based growth decomposition discussed in Ndulu and O’Connell
(2006a).7 These assessments are made relative to three comparators—
global average, East Asia, and East Asia and Pacific. Given that the region
has seriously lagged behind in growth, including East Asia among the com-
parators allows us to target ambition in an effort to close the gap. Applied
this way, results from cross-country growth analysis can also help to
inform and direct country-level analysis into its most productive areas
(Collier and Gunning 1999).
How Do African Countries Compare with the Other Regions?
Table 3.4 shows the actual growth deviations and the contributions of var-
ious factors of growth in explaining this deviation. Average growth rates
observed in Africa for the entire time period were 1.12 percentage points
lower than the global sample mean, and the deviations were even higher
relative to the growth paths for both EAP at 2.78 percentage points and
South Asia at 1.72 percentage points, respectively.
Based on this assessment, demographic factors explained the largest
part of the deviation of Africa’s predicted growth. The difference in the lev-
els of the cluster of demographic factors accounts for 0.86 percentage
points out of the total growth gap of 1.12 percentage points relative to the
global mean. The cluster has similar dominance in explaining the growth
gap with EAP and SAR. Differences in age dependency ratios and potential
labor force growth rates accounted for 1.49 percentage points of the 2.78-
percentage-point growth gap with EAP and by 0.96 percentage points of
the 1.72-percentage-point gap with South Asia. Africa’s delayed demo-
graphic transition compared to other developing regions is a key factor in
understanding its lagging position in growth.
Differences in the initial conditions also explain a significant part of the
deviation. These include differences in initial income and life expectancy
at birth. For the SSA region, the adverse impact of the much lower life
expectancy at birth significantly reduces the positive convergence impact
of lower initial income, leaving a net impact on growth of only 0.39 per-
centage points relative to the global sample mean growth, instead of 1.18
percentage points. With more or less similar levels of initial income, dif-

80 CHALLENGES OF AFRICAN GROWTH
ferences in life expectancy with South Asia more than offset the income
convergence effect. Against EAP, the net effect from the differences in ini-
tial conditions accounts for explaining 0.50 percentage points of the
growth gap.
Differences in the level of policy conditions between Africa and the
three comparators are smaller than with the previously discussed clusters
of growth drivers. Differences in policy disposition contributed to explain-
ing –0.17 and –0.45 percentage points, respectively, of the predicted
growth gaps relative to the sample mean and the East Asia and Pacific
region only. Africa’s policy performance was at par with that of South Asia
and therefore does not contribute to explaining the growth gap between
the two regions.
Evolution of the Relative Importance of Growth Conditions
The relative importance of different growth drivers has tended to change
over time as countries pursue reform programs, undertake investments to
compensate for unfavorable endowments, and undergo deep political
changes. As we saw earlier in the review of Africa’s 45 years of growth
experience, the region’s growth performance has followed a distinctive U-
shaped path, with nearly two decades of growth stagnation sandwiched
between an early and later phase of reasonable levels of growth. Figures
3.10, 3.11, and 3.12 depict changes in the relative contributions of the dif-
ferent growth constraints, over these three time phases, to explain the
growth gaps with other regions.
TABLE 3.4Contributions of Individual Components of Drivers of Growth toward Explaining Deviation of SSA’s Predicted Growth Relative to the Sample Mean, EAP, and SAR, 1960–2004
Initial conditions DemographyActual Potential growth Life Age labor force
Sub-Saharan Africa deviation Income expectancy dependency growth Landlocked
Sample mean �1.12 1.18 �0.79 �0.67 �0.19 �0.12East Asia and Pacific �2.78 1.56 �1.06 �1.13 �0.36 �0.21South Asia �1.72 0.04 �0.60 �0.68 �0.28 �0.15
Source: Author calculations based on data sources in the appendix.
Note: Calculations based on regression sample only. BMP = Black Market Premium.

EXPLAINING THE AFRICAN GROWTH RECORD: WHAT APPEARS TO MATTER MOST 81
Following from the pattern of evolution in the per capita GDP, the nine
half-decade observations for each country from 1960 to 2004 are divided
into three distinct time periods: the 1960–74 phase, which was character-
ized by moderate growth rates; the 1975–94 phase, which represented a
deep contraction within the region; and the 1995–2004 phase, which was
marked by recovery into moderate growth rates. The actual growth devi-
Geography Shocks PolicyTrading Government
Terms of partner Political consumption/trade growth instability Inflation BMP GDP Residual
0.02 �0.05 0.10 0.00 �0.06 �0.11 �0.380.07 �0.34 0.03 �0.05 �0.19 �0.21 �0.810.02 �0.08 0.30 �0.05 0.10 �0.05 �0.32
FIGURE 3.10Regression-Based Decomposition of Periodical Growth Rates, SSA, 1960–74
�2.0 �1.5 �1.0 �.5 0
deviation of SSA mean from sample mean
growthresidual
age dependencylandlocked
initial life expectancypotential labor force growth rate
inflationterms of trade shock
trading partner growth ratespolitical instability
black market premiumgovernment consumption initial income
.5 1.0 1.5
3
2
1
0
�1
Source: Author calculations based on data sources in the appendix.

82 CHALLENGES OF AFRICAN GROWTH
growthresidual
age dependency landlocked
initial life expectancy
potential labor force growth rate
inflation
terms of trade shocktrading partner growth rates
political instability
black market premiumgovernment consumption initial income
�2.0 �1.5 �1.0 �.5 0
deviation of SSA mean from sample mean
.5 1.0 1.5
3
2
1
0
�1
FIGURE 3.11Regression-Based Decomposition of Periodical Growth Rates, SSA, 1975–94
FIGURE 3.12Regression-Based Decomposition of Periodical Growth Rates, SSA, 1995–2004
growthresidual
age dependencylandlocked
initial life expectancypotential labor force growth rate
inflation
terms of trade shocktrading partner growth rates
political instabilitygovernment consumption
initial income
�2.0 �1.5 �1.0 �.5 0
deviation of SSA mean from sample mean
.5 1.0 1.5
3
2
1
0
�1black market premium
Source: Author calculations based on data sources in the appendix.
Source: Author calculations based on data sources in the appendix.

EXPLAINING THE AFRICAN GROWTH RECORD: WHAT APPEARS TO MATTER MOST 83
ations relative to all the benchmarks reveal the observed U-shaped
growth patterns in table 3.5. Not surprisingly, the deviations are much
larger relative to EAP than to SAR.
Apart from initial income, initial life expectancy was the most impor-
tant in explaining predicted growth deviations relative to all three bench-
marks. However, the progress that Africa achieved in raising life
expectancy has since been eroded by incidence of disease, especially
HIV/AIDS in southern Africa. This is apparent in the widening divergence
between the second and last phases relative to EAP and SAR.
Age dependency also explains a significant part of the deviation of the
predicted growth rate of Africa relative to the global mean. The evolution
of the contribution of this driver is consistent with the growth pattern over
the three phases, since it rises in the second phase and then declines in the
last phase. The initial population explosion that took place in Africa, with
the consequence of increasing dependency ratios, was followed by the
demographic transition that started in the mid-1980s. However, the per-
sistently large difference with EAP and SAR, even in the most recent phase,
clearly continues to account for the largest part of the explanation of the
growth gap between Africa and these regions: the population structure
continues to be a drag against closing the gap. Policy cluster, exogenous
shocks, and the growth of potential labor force seem to track the U-shaped
path of the growth performance and become much less important in
accounting for the differences in the growth performance in the last phase.
The difference between policy conditions in Africa and other develop-
ing regions has narrowed considerably, partly as a result of the reforms of
the 1990s. Relative to the global mean, differences in policy conditions
accounted for –0.11 percentage points of the growth gap during the early
phase and –0.29 percentage points during the period of growth contrac-
tion, and they nearly disappear as a factor (0.01 percentage points) in the
last phase. The region has also become much more open and better able to
make use of opportunities afforded by the global economy, and political
instability also appears to be on the wane.
Contribution of Drivers of Growth to Explaining Growth
Deviation at the Country Level
Tables 3.6 and 3.7 extend the type of analysis done in the previous two sec-
tions at the country level. Table 3.6 presents the contributions for the

84 CHALLENGES OF AFRICAN GROWTH
entire time period, and table 3.7 shows the evolution of the contributions
by periods. For each country, the relative importance of each driver of
growth is assessed on the basis of the extent to which it contributes to
explaining the country’s growth gap relative to the global mean. These
contributions are also assessed along the three phases of the region’s
growth path.
We also classify the countries in two groups: high-growth countries
and low-growth countries. Gelb (2006) designated 22 African countries,
which have taken off well during the period from 1994 to 2003 and have
sustained these rates for more than a decade, as high-growth economies.
These African countries have posted an average growth rate of 3.86 per-
cent of GDP per capita during this period. The remaining 23 countries for
which data are available are categorized as low-growth economies, with
an average growth rate of –0.55 percent of GDP per capita. One distinct
feature among the high-growth countries is the remarkable improve-
ment of the contribution of the policy variables to explaining growth
deviation relative to the sample mean, in the most recent decade of 1995
to 2004.
TABLE 3.5Evolution of Individual Contributions of Drivers of Growth toward Explaining Deviation of SSA’s Predicted Growth Relative to the Sample Mean, EAP, and SAR, by Periods
Initial conditions Demography GeographyActual Potential growth Life Age labor force
Sub-Saharan Africa deviation Income expectancy dependency growth Landlocked
Sample mean1960–74 0.40 1.19 �1.06 �0.61 �0.40 �0.101975–94 �2.04 1.16 �0.73 �0.77 �0.30 �0.151995–2004 �0.70 1.22 �0.67 �0.55 0.22 �0.09EAP1960–74 �2.46 0.96 �1.01 �0.53 �0.40 �0.191975–94 �3.73 1.57 �1.02 �1.27 �0.62 �0.241995–2004 �1.03 2.17 �1.27 �1.49 0.19 �0.18SAR1960–74 1.27 �0.19 �0.68 �0.32 �0.31 �0.191975–94 �2.97 �0.08 �0.47 �0.73 �0.27 �0.151995–2004 �1.74 0.48 �0.78 �0.90 �0.26 �0.12
Source: Author calculations based on data sources in the appendix.
Note: Calculations based on balanced regression sample only.

EXPLAINING THE AFRICAN GROWTH RECORD: WHAT APPEARS TO MATTER MOST 85
The situation for low-growth countries remains more or less unchanged,
as seen in figure 3.13. This implies that the high-growth countries have to
focus their efforts on other aspects of development, such as human devel-
opment and demographic characteristics, as shown in the regression-based
decompositions analysis. Clearly, the countries that have not broken out of
the cycle of poverty have a much bigger task of tackling macroeconomic
instability first, before embarking on other areas of development. In terms
of opportunity groups, policy challenges have been much more acute in
resource-rich countries (both landlocked and coastal) following discovery
of oil in a number of countries during the 1970s and 1980s. Subsequently,
these countries have shown some improvement in terms of reduction in
the negative contribution of the policy variables in the past decade.
Finally, in the resource-rich economies, the positive contribution of
external factors, such as income effects of terms-of-trade changes, rises
sharply in the most recent decade (figure 3.14), providing evidence for
favorable movements in terms of trade of these primary commodity
economies, maybe owing to changing global conditions that raise their rel-
ative prices and demand.
Shocks PolicyTrading Black- Government
Terms of partner Political Inflation market consumption/trade growth instability (<500%) premium GDP Residual
�0.05 0.54 0.12 0.08 0.04 �0.23 �0.34�0.03 �0.23 0.09 �0.04 �0.15 �0.10 �0.58
0.20 �0.21 0.08 0.01 0.03 �0.03 �0.03
�0.03 �0.31 0.01 0.08 �0.08 �0.36 �0.600.04 �0.38 0.03 �0.10 �0.28 �0.15 �1.300.23 �0.23 0.02 �0.08 �0.13 �0.19 0.00
0.01 0.13 0.20 0.04 0.55 �0.15 2.23�0.02 �0.21 0.35 �0.08 0.01 �0.06 �1.28
0.13 �0.06 0.25 �0.06 �0.10 0.06 �0.32

86 CHALLENGES OF AFRICAN GROWTH
TABLE 3.6Contributions of Various Factors Influencing Growth at the Country LevelContribution to deviation from sample mean
PotentialActual Initial labor force growth Initial life Age growth Land-
Country Period deviation income expectancy dependency rate locked
High-growth countriesAGO 1960–2004 — — — — — —BEN 1960–2004 –1.02 1.49 –0.64 –1.02 –0.32 0.09BFA 1960–2004 –0.63 1.76 –0.93 –1.34 –0.26 –0.48BWA 1960–2004 — — — — — —CMR 1960–2004 –0.49 0.70 –0.65 –0.63 –0.13 0.09CPV 1960–2004 0.58 –0.06 0.43 –0.53 –0.60 0.09ETH 1960–2004 –1.22 2.25 –0.99 –0.71 –0.29 0.09GHA 1960–2004 –1.52 1.43 –0.48 –0.76 –0.14 0.09GIN 1960–2004 –0.36 0.39 –0.86 –0.60 0.34 0.09GNQ 1960–2004 — — — — — —LSO 1960–2004 — — — — — —MLI 1960–2004 –0.76 1.72 –1.01 –0.98 –0.44 –0.48MOZ 1960–2004 3.53 1.74 –1.00 –0.55 0.36 0.09MRT 1960–2004 0.68 1.09 –0.86 –0.52 –0.21 0.09MUS 1960–2004 1.99 –0.99 0.45 1.01 0.40 0.09RWA 1960–2004 –0.14 1.67 –1.04 –1.10 –0.24 –0.48SDN 1960–2004 — — — — — —SEN 1960–2004 –1.96 1.02 –0.95 –0.68 –0.17 0.09TCD 1960–2004 –0.97 1.43 –1.12 –0.68 –0.51 –0.48TGO 1960–2004 –0.73 1.41 –0.83 –0.75 –0.37 0.09TZA 1960–2004 2.43 2.42 –0.96 –0.66 0.30 0.09UGA 1960–2004 2.43 2.01 –0.87 –1.22 –0.33 –0.48Low-growth countriesBDI 1960–2004 –2.09 1.96 –0.95 –0.82 –0.16 –0.48CAF 1960–2004 –2.34 0.92 –0.98 –0.33 –0.38 –0.48CIV 1960–2004 –1.36 0.68 –0.86 –0.70 –0.14 0.09COG 1960–2004 –0.45 1.51 –0.85 –0.66 –0.41 0.09COM 1960–2004 –3.58 1.00 –0.08 –0.48 0.74 0.09ERI 1960–2004 — — — — — —GAB 1960–2004 –0.04 –0.85 –0.70 0.15 –0.28 0.09GMB 1960–2004 –1.19 1.31 –0.85 –0.22 –0.12 0.09GNB 1960–2004 –4.25 2.01 –0.93 –0.67 –0.24 0.09KEN 1960–2004 –0.51 1.45 –0.50 –1.27 0.07 0.09MDG 1960–2004 –2.59 1.51 –0.68 –0.70 –0.06 0.09MWI 1960–2004 –0.43 2.16 –1.07 –0.93 –0.32 –0.48NAM 1960–2004 — — — — — —NER 1960–2004 –3.30 1.31 –1.19 –1.26 –0.59 –0.48NGA 1960–2004 –0.87 1.55 –0.89 –0.74 –0.28 0.09
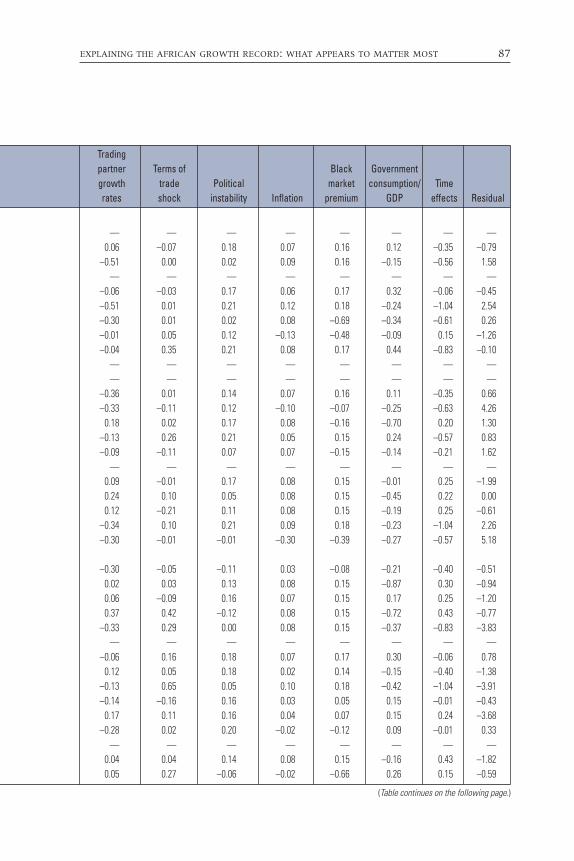
EXPLAINING THE AFRICAN GROWTH RECORD: WHAT APPEARS TO MATTER MOST 87
Trading partner Terms of Black Governmentgrowth trade Political market consumption/ Time rates shock instability Inflation premium GDP effects Residual
— — — — — — — —0.06 –0.07 0.18 0.07 0.16 0.12 –0.35 –0.79
–0.51 0.00 0.02 0.09 0.16 –0.15 –0.56 1.58— — — — — — — —
–0.06 –0.03 0.17 0.06 0.17 0.32 –0.06 –0.45–0.51 0.01 0.21 0.12 0.18 –0.24 –1.04 2.54–0.30 0.01 0.02 0.08 –0.69 –0.34 –0.61 0.26–0.01 0.05 0.12 –0.13 –0.48 –0.09 0.15 –1.26–0.04 0.35 0.21 0.08 0.17 0.44 –0.83 –0.10
— — — — — — — —— — — — — — — —
–0.36 0.01 0.14 0.07 0.16 0.11 –0.35 0.66–0.33 –0.11 0.12 –0.10 –0.07 –0.25 –0.63 4.26
0.18 0.02 0.17 0.08 –0.16 –0.70 0.20 1.30–0.13 0.26 0.21 0.05 0.15 0.24 –0.57 0.83–0.09 –0.11 0.07 0.07 –0.15 –0.14 –0.21 1.62
— — — — — — — —0.09 –0.01 0.17 0.08 0.15 –0.01 0.25 –1.990.24 0.10 0.05 0.08 0.15 –0.45 0.22 0.000.12 –0.21 0.11 0.08 0.15 –0.19 0.25 –0.61
–0.34 0.10 0.21 0.09 0.18 –0.23 –1.04 2.26–0.30 –0.01 –0.01 –0.30 –0.39 –0.27 –0.57 5.18
–0.30 –0.05 –0.11 0.03 –0.08 –0.21 –0.40 –0.510.02 0.03 0.13 0.08 0.15 –0.87 0.30 –0.940.06 –0.09 0.16 0.07 0.15 0.17 0.25 –1.200.37 0.42 –0.12 0.08 0.15 –0.72 0.43 –0.77
–0.33 0.29 0.00 0.08 0.15 –0.37 –0.83 –3.83— — — — — — — —
–0.06 0.16 0.18 0.07 0.17 0.30 –0.06 0.780.12 0.05 0.18 0.02 0.14 –0.15 –0.40 –1.38
–0.13 0.65 0.05 0.10 0.18 –0.42 –1.04 –3.91–0.14 –0.16 0.16 0.03 0.05 0.15 –0.01 –0.43
0.17 0.11 0.16 0.04 0.07 0.15 0.24 –3.68–0.28 0.02 0.20 –0.02 –0.12 0.09 –0.01 0.33
— — — — — — — —0.04 0.04 0.14 0.08 0.15 –0.16 0.43 –1.820.05 0.27 –0.06 –0.02 –0.66 0.26 0.15 –0.59
(Table continues on the following page.)

88 CHALLENGES OF AFRICAN GROWTH
TABLE 3.6 continuedContributions of Various Factors Influencing Growth at the Country LevelContribution to deviation from sample mean
PotentialActual Initial labor force growth Initial life Age growth Land-
Country Period deviation income expectancy dependency rate locked
SLE 1960–2004 –3.86 1.47 –1.44 –0.50 –0.23 0.09STP 1960–2004 — — — — — —SWZ 1960–2004 — — — — — —SYC 1960–2004 –3.23 –1.15 0.63 0.94 0.40 0.09ZAF 1960–2004 –0.75 –0.70 –0.33 0.02 0.06 0.09ZAR 1960–2004 –3.21 2.02 –0.82 –0.85 –0.41 –0.48ZMB 1960–2004 –2.48 1.43 –0.83 –0.89 –0.19 –0.48ZWE 1960–2004 –2.51 0.41 –0.51 –0.93 0.14 –0.48
Source: Author calculations based on data sources in the appendix.
Note: — = not available.
TABLE 3.7Evolution of Contribution to Deviation from Sample Mean at the Country Level
PotentialActual Initial labor force growth Initial life Age growth Land-
Country Period deviation income expectancy dependency rate locked
High-growth countriesAGO 1960–74 — — — — — —AGO 1975–94 — — — — — —AGO 1995–2004 — — — — — —BEN 1960–74 — — — — — —BEN 1975–94 –1.52 1.53 –0.69 –1.08 –0.49 0.09BEN 1995–2004 0.99 1.34 –0.47 –0.80 0.37 0.09BFA 1960–74 — — — — — —BFA 1975–94 –0.97 1.81 –0.92 –1.45 –0.19 –0.48BFA 1995–2004 0.39 1.62 –0.96 –1.04 –0.46 –0.48BWA 1960–74 — — — — — —BWA 1975–94 — — — — — —BWA 1995–2004 — — — — — —CMR 1960–74 0.75 1.02 –0.94 –0.44 –0.64 0.09CMR 1975–94 –1.09 0.62 –0.58 –0.76 –0.26 0.09CMR 1995–2004 0.69 0.73 –0.63 –0.29 0.88 0.09CPV 1960–74 — — — — — —CPV 1975–94 — — — — — —CPV 1995–2004 0.58 –0.06 0.43 –0.53 –0.60 0.09

EXPLAINING THE AFRICAN GROWTH RECORD: WHAT APPEARS TO MATTER MOST 89
Trading partner Terms of Black Governmentgrowth trade Political market consumption/ Time rates shock instability Inflation premium GDP effects Residual
–0.24 –0.02 0.01 –0.21 –0.24 0.24 –0.40 –2.39— — — — — — — —— — — — — — — —
–0.32 –0.69 0.21 0.09 –0.72 –0.49 –1.04 –1.170.06 0.01 –0.08 0.05 0.15 –0.11 0.15 –0.140.05 –0.21 0.06 –0.39 –0.56 –0.23 0.18 –1.57
–0.10 0.04 0.16 –0.18 –0.41 –0.51 –0.01 –0.51–0.30 0.08 0.04 –0.18 –0.40 0.01 –0.57 0.18
Trading partner Terms of Black Governmentgrowth trade Political market consumption/ Time rates shock instability Inflation premium GDP effects Residual
— — — — — — — —— — — — — — — —— — — — — — — —— — — — — — — —
0.03 –0.06 0.17 0.07 0.16 0.12 –0.18 –1.190.21 –0.13 0.21 0.10 0.18 0.13 –1.04 0.80
— — — — — — — —–0.53 0.02 –0.04 0.08 0.16 –0.20 –0.40 1.16–0.47 –0.07 0.21 0.11 0.18 –0.02 –1.04 2.83
— — — — — — — —— — — — — — — —— — — — — — — —
0.66 –0.03 0.21 0.05 0.18 0.33 1.42 –1.16–0.21 –0.22 0.16 0.05 0.16 0.33 –0.18 –0.29–0.16 0.71 0.21 0.12 0.18 0.27 –1.04 –0.36
— — — — — — — —— — — — — — — —
–0.51 0.01 0.21 0.12 0.18 –0.24 –1.04 2.54
(Table continues on the following page.)

90 CHALLENGES OF AFRICAN GROWTH
TABLE 3.7 continuedEvolution of Contribution to Deviation from Sample Mean at the Country Level
PotentialActual Initial labor force growth Initial life Age growth Land-
Country Period deviation income expectancy dependency rate locked
ETH 1960–74 — — — — — —ETH 1975–94 –2.61 2.29 –0.96 –0.62 –0.35 0.09ETH 1995–2004 0.17 2.20 –1.02 –0.80 –0.22 0.09GHA 1960–74 –1.18 1.63 –0.79 –0.77 –0.18 0.09GHA 1975–94 –2.79 1.38 –0.40 –0.81 –0.15 0.09GHA 1995–2004 0.53 1.25 –0.18 –0.66 –0.05 0.09GIN 1960–74 — — — — — —GIN 1975–94 — — — — — —GIN 1995–2004 –0.36 0.39 –0.86 –0.60 0.34 0.09GNQ 1960–74 — — — — — —GNQ 1975–94 — — — — — —GNQ 1995–2004 — — — — — —LSO 1960–74 — — — — — —LSO 1975–94 — — — — — —LSO 1995–2004 — — — — — —MLI 1960–74 — — — — — —MLI 1975–94 –1.49 1.75 –1.00 –0.96 –0.43 –0.48MLI 1995–2004 2.18 1.60 –1.09 –1.10 –0.46 –0.48MOZ 1960–74 — — — — — —MOZ 1975–94 2.82 1.86 –0.99 –0.62 –0.43 0.09MOZ 1995–2004 3.88 1.67 –1.00 –0.52 0.75 0.09MRT 1960–74 3.01 1.07 –1.17 –0.35 –0.16 0.09MRT 1975–94 –2.14 0.96 –0.77 –0.71 –0.75 0.09MRT 1995–2004 0.00 1.26 –0.51 –0.58 0.24 0.09MUS 1960–74 — — — — — —MUS 1975–94 1.90 –0.73 0.37 0.85 0.33 0.09MUS 1995–2004 2.13 –1.39 0.57 1.26 0.51 0.09RWA 1960–74 2.79 1.91 –1.00 –0.85 –0.70 –0.48RWA 1975–94 –3.22 1.54 –0.94 –1.16 –0.91 –0.48RWA 1995–2004 4.55 1.81 –1.26 –1.10 1.33 –0.48SDN 1960–74 — — — — — —SDN 1975–94 — — — — — —SDN 1995–2004 — — — — — —SEN 1960–74 –2.62 0.93 –1.25 –0.61 –0.37 0.09SEN 1975–94 –2.06 1.09 –0.84 –0.77 –0.27 0.09SEN 1995–2004 0.44 1.00 –0.51 –0.56 0.80 0.09TCD 1960–74 –3.06 1.38 –1.40 –0.26 –0.46 –0.48TCD 1975–94 –0.12 1.40 –0.96 –0.83 –1.15 –0.48TCD 1995–2004 2.77 1.68 –0.73 –1.49 1.26 –0.48

EXPLAINING THE AFRICAN GROWTH RECORD: WHAT APPEARS TO MATTER MOST 91
Trading partner Terms of Black Governmentgrowth trade Political market consumption/ Time rates shock instability Inflation premium GDP effects Residual
— — — — — — — —–0.25 –0.04 –0.07 0.05 –1.29 –0.24 –0.39 –0.83–0.36 0.06 0.11 0.10 –0.09 –0.43 –0.83 1.35
0.38 –0.14 0.06 0.05 –0.29 0.06 1.25 –2.52–0.27 0.05 0.11 –0.28 –0.96 –0.12 –0.18 –1.26–0.07 0.34 0.21 –0.12 0.18 –0.25 –0.83 0.63
— — — — — — — —— — — — — — — —
–0.04 0.35 0.21 0.08 0.17 0.44 –0.83 –0.10— — — — — — — —— — — — — — — —— — — — — — — —— — — — — — — —— — — — — — — —— — — — — — — —— — — — — — — —
–0.37 –0.01 0.13 0.06 0.15 0.19 –0.18 –0.34–0.32 0.10 0.21 0.11 0.18 –0.19 –1.04 4.66
— — — — — — — —0.19 0.01 0.02 –0.23 –0.51 –0.55 –0.24 4.21
–0.59 –0.17 0.17 –0.03 0.15 –0.10 –0.83 4.290.58 0.01 0.21 0.09 0.12 –0.98 1.25 2.26
–0.07 0.02 0.11 0.06 –0.91 –0.73 –0.33 0.88–0.16 0.03 0.17 0.09 0.17 –0.24 –0.83 0.28
— — — — — — — —–0.16 0.17 0.21 0.04 0.14 0.22 –0.40 0.77–0.09 0.40 0.21 0.08 0.16 0.26 –0.83 0.92
0.92 0.01 0.21 0.04 –0.33 0.16 0.90 2.01–0.20 –0.09 0.07 0.10 –0.19 –0.18 –0.18 –0.58–0.39 –0.21 0.01 0.05 0.02 –0.21 –0.83 5.83
— — — — — — — —— — — — — — — —— — — — — — — —
0.63 –0.02 0.14 0.09 0.14 0.02 1.25 –3.66–0.27 0.01 0.21 0.06 0.16 –0.03 –0.18 –1.32–0.07 –0.07 0.13 0.12 0.18 0.00 –1.04 0.37
0.63 0.03 0.14 0.09 0.14 –0.73 1.25 –3.380.01 0.08 –0.10 0.08 0.16 –0.29 –0.40 2.36
–0.25 0.40 0.21 0.09 0.18 –0.12 –1.04 3.07
(Table continues on the following page.)

92 CHALLENGES OF AFRICAN GROWTH
TABLE 3.7 continuedEvolution of Contribution to Deviation from Sample Mean at the Country Level
PotentialActual Initial labor force growth Initial life Age growth Land-
Country Period deviation income expectancy dependency rate locked
TGO 1960–74 2.79 1.44 –1.09 –0.70 –0.33 0.09TGO 1975–94 –2.86 1.30 –0.67 –0.84 –0.69 0.09TGO 1995–2004 –2.83 1.73 –0.68 –0.56 0.79 0.09TZA 1960–74 — — — — — —TZA 1975–94 — — — — — —TZA 1995–2004 2.43 2.42 –0.96 –0.66 0.30 0.09UGA 1960–74 — — — — — —UGA 1975–94 2.68 2.20 –0.76 –1.19 0.08 –0.48UGA 1995–2004 2.06 1.73 –1.03 –1.26 –0.94 –0.48Low-growth countriesBDI 1960–74 — — — — — —BDI 1975–94 –1.06 1.87 –0.89 –0.78 –0.24 –0.48BDI 1995–2004 –4.13 2.16 –1.09 –0.89 –0.01 –0.48CAF 1960–74 –1.66 0.66 –1.17 –0.10 –0.44 –0.48CAF 1975–94 –3.34 0.99 –0.86 –0.46 –0.41 –0.48CAF 1995–2004 –0.36 1.47 –0.87 –0.53 –0.05 –0.48CIV 1960–74 2.51 0.81 –1.09 –0.69 –0.47 0.09CIV 1975–94 –3.20 0.54 –0.68 –0.82 –0.11 0.09CIV 1995–2004 –5.66 0.83 –0.87 –0.20 0.70 0.09COG 1960–74 0.89 2.00 –0.99 –0.46 –0.31 0.09COG 1975–94 –4.63 0.70 –0.67 –0.87 0.03 0.09COG 1995–2004 –0.27 0.87 –0.62 –1.04 –1.14 0.09COM 1960–74 — — — — — —COM 1975–94 — — — — — —COM 1995–2004 –3.58 1.00 –0.08 –0.48 0.74 0.09ERI 1960–74 — — — — — —ERI 1975–94 — — — — — —ERI 1995–2004 — — — — — —GAB 1960–74 10.98 –0.69 –0.97 0.55 –0.33 0.09GAB 1975–94 –2.27 –0.88 –0.69 0.19 –0.58 0.09GAB 1995–2004 –2.14 –0.92 –0.48 –0.42 0.99 0.09GMB 1960–74 — — — — — —GMB 1975–94 –1.24 1.26 –1.03 –0.30 –0.14 0.09GMB 1995–2004 –1.08 1.41 –0.48 –0.07 –0.06 0.09GNB 1960–74 — — — — — —GNB 1975–94 — — — — — —GNB 1995–2004 –4.25 2.01 –0.93 –0.67 –0.24 0.09KEN 1960–74 2.81 1.79 –0.71 –1.49 –0.51 0.09KEN 1975–94 –1.35 1.34 –0.34 –1.53 –0.02 0.09KEN 1995–2004 –2.15 1.31 –0.61 –0.54 0.82 0.09

EXPLAINING THE AFRICAN GROWTH RECORD: WHAT APPEARS TO MATTER MOST 93
Trading partner Terms of Black Governmentgrowth trade Political market consumtion/ Time rates shock instability Inflation premium GDP effects Residual
0.55 –0.29 0.12 0.10 0.14 –0.05 1.25 1.56–0.16 –0.20 0.08 0.06 0.16 –0.32 –0.18 –1.50–0.01 0.00 0.21 0.11 0.18 –0.11 –1.04 –3.54
— — — — — — — —— — — — — — — —
–0.34 0.10 0.21 0.09 0.18 –0.23 –1.04 2.26— — — — — — — —
–0.26 –0.13 –0.02 –0.57 –0.75 –0.30 –0.40 5.25–0.37 0.18 0.01 0.09 0.14 –0.24 –0.83 5.07
— — — — — — — —–0.34 –0.04 0.05 0.04 –0.05 –0.26 –0.18 0.25–0.23 –0.07 –0.43 0.00 –0.13 –0.09 –0.83 –2.03
0.57 –0.07 0.16 0.09 0.14 –1.31 1.25 –0.96–0.37 0.10 0.14 0.06 0.16 –0.75 –0.18 –1.28–0.08 0.06 0.02 0.09 0.18 –0.01 –0.63 0.48
0.55 –0.21 0.21 0.09 0.14 0.23 1.25 1.61–0.26 –0.06 0.21 0.05 0.16 0.11 –0.18 –2.25–0.17 0.11 –0.18 0.10 0.18 0.20 –1.04 –5.40
0.65 –0.05 –0.13 0.08 0.14 –1.06 1.25 –0.33–0.48 0.22 –0.10 0.05 0.15 –0.41 –0.53 –2.81
0.39 2.05 –0.10 0.12 0.18 0.00 –1.04 –0.05— — — — — — — —— — — — — — — —
–0.33 0.29 0.00 0.08 0.15 –0.37 –0.83 –3.83— — — — — — — —— — — — — — — —— — — — — — — —
0.31 0.52 0.21 0.08 0.18 0.37 1.42 9.24–0.15 –0.06 0.17 0.05 0.16 0.27 –0.18 –0.67–0.06 0.70 0.21 0.14 0.18 0.33 –1.04 –1.85
— — — — — — — —0.10 –0.02 0.17 0.00 0.13 –0.24 –0.18 –1.090.17 0.19 0.21 0.07 0.15 0.02 –0.83 –1.95
— — — — — — — —— — — — — — — —
–0.13 0.65 0.05 0.10 0.18 –0.42 –1.04 –3.910.34 –0.02 0.15 0.09 –0.04 0.26 1.16 1.68
–0.34 –0.09 0.16 –0.02 0.04 0.18 –0.18 –0.65–0.20 –0.44 0.17 0.07 0.16 –0.02 –0.83 –2.13
(Table continues on the following page.)

94 CHALLENGES OF AFRICAN GROWTH
TABLE 3.7 continuedEvolution of Contribution to Deviation from Sample Mean at the Country Level
PotentialActual Initial labor force growth Initial life Age growth Land-
Country Period deviation income expectancy dependency rate locked
MDG 1960–74 –1.94 1.34 –1.03 –0.69 –0.45 0.09MDG 1975–94 –3.55 1.48 –0.61 –0.71 0.12 0.09MDG 1995–2004 –2.13 1.79 –0.27 –0.70 0.25 0.09MWI 1960–74 2.52 2.47 –1.22 –0.88 –0.42 –0.48MWI 1975–94 –2.14 2.12 –0.98 –1.02 –0.44 –0.48MWI 1995–2004 0.03 1.94 –1.12 –0.82 0.04 –0.48NAM 1960–74 — — — — — —NAM 1975–94 — — — — — —NAM 1995–2004 — — — — — —NER 1960–74 –2.97 1.01 –1.38 –1.09 –0.74 –0.48NER 1975–94 –3.55 1.54 –1.05 –1.39 –0.47 –0.48NER 1995–2004 — — — — — —NGA 1960–74 1.46 1.49 –1.13 –0.68 –0.60 0.09NGA 1975–94 –2.75 1.46 –0.82 –0.85 –0.15 0.09NGA 1995–2004 –0.59 1.81 –0.67 –0.61 –0.04 0.09SLE 1960–74 — — — — — —SLE 1975–94 –3.45 1.27 –1.46 –0.47 –0.49 0.09SLE 1995–2004 –4.67 1.88 –1.39 –0.57 0.30 0.09STP 1960–74 — — — — — —STP 1975–94 — — — — — —STP 1995–2004 — — — — — —SWZ 1960–74 — — — — — —SWZ 1975–94 — — — — — —SWZ 1995–2004 — — — — — —SYC 1960–74 — — — — — —SYC 1975–94 — — — — — —SYC 1995–2004 –3.23 –1.15 0.63 0.94 0.40 0.09ZAF 1960–74 1.72 –0.49 –0.57 –0.37 –0.17 0.09ZAF 1975–94 –2.45 –0.83 –0.16 –0.03 0.12 0.09ZAF 1995–2004 –1.07 –0.77 –0.29 0.69 0.32 0.09ZAR 1960–74 –0.79 1.57 –0.97 –0.59 –0.27 –0.48ZAR 1975–94 –4.52 1.89 –0.70 –0.93 –0.62 –0.48ZAR 1995–2004 –4.11 3.29 –0.88 –1.15 –0.05 –0.48ZMB 1960–74 –0.74 1.21 –0.90 –0.86 –0.41 –0.48ZMB 1975–94 –4.13 1.39 –0.66 –1.00 –0.33 –0.48ZMB 1995–2004 –0.92 1.75 –1.11 –0.70 0.28 –0.48ZWE 1960–74 — — — — — —ZWE 1975–94 –0.58 0.38 –0.31 –1.04 0.46 –0.48ZWE 1995–2004 –5.41 0.46 –0.82 –0.77 –0.35 –0.48
Source: Author calculations based on data sources in the appendix.
Note: — = not available.

EXPLAINING THE AFRICAN GROWTH RECORD: WHAT APPEARS TO MATTER MOST 95
Trading partner Terms of Black Governmentgrowth trade Political market consumption/ Time rates shock instability Inflation premium GDP effects Residual
0.59 0.01 0.16 0.09 0.14 0.14 1.25 –3.58–0.07 0.00 0.18 0.00 –0.05 0.12 –0.06 –4.04–0.09 0.43 0.13 0.01 0.15 0.19 –0.83 –3.27
0.28 0.04 0.21 0.08 0.01 0.14 1.16 1.14–0.47 –0.05 0.19 –0.01 –0.27 0.02 –0.18 –0.58–0.48 0.14 0.21 –0.13 0.06 0.19 –0.83 1.32
— — — — — — — —— — — — — — — —— — — — — — — —
0.55 0.00 0.18 0.09 0.14 –0.12 1.25 –2.39–0.34 0.07 0.11 0.07 0.16 –0.20 –0.18 –1.39
— — — — — — — —0.41 0.03 0.02 0.08 –0.07 0.45 1.25 0.12
–0.18 0.08 –0.04 –0.09 –0.85 0.22 –0.18 –1.45–0.02 1.01 –0.20 –0.04 –1.18 0.04 –0.83 0.05
— — — — — — — —–0.32 –0.09 0.13 –0.32 –0.43 0.29 –0.18 –1.47–0.07 0.12 –0.23 0.01 0.14 0.15 –0.83 –4.24
— — — — — — — —— — — — — — — —— — — — — — — —— — — — — — — —— — — — — — — —— — — — — — — —— — — — — — — —— — — — — — — —
–0.32 –0.69 0.21 0.09 –0.72 –0.49 –1.04 –1.170.42 0.01 0.08 0.09 0.12 0.00 1.25 1.26
–0.06 –0.01 –0.29 0.01 0.16 –0.16 –0.18 –1.11–0.23 0.07 0.10 0.07 0.17 –0.17 –0.83 –0.29
0.67 –0.50 0.00 –0.03 –0.43 –0.40 1.16 –0.52–0.18 –0.15 0.12 –0.40 –0.70 –0.31 –0.06 –2.02–0.52 0.19 –0.03 –1.06 –0.40 0.32 –1.04 –2.31
0.63 0.02 0.21 0.05 –0.24 –0.80 1.16 –0.31–0.27 –0.16 0.17 –0.32 –0.75 –0.72 –0.18 –0.82–0.47 0.46 0.08 –0.10 0.12 0.20 –0.83 –0.11
— — — — — — — —–0.36 –0.05 0.06 –0.02 –0.33 –0.05 –0.40 1.56–0.21 0.27 0.01 –0.40 –0.52 0.09 –0.83 –1.87

96 CHALLENGES OF AFRICAN GROWTH
�0.13
�0.35 �0.34�0.36
�0.22
�0.02
�0.40
�0.30
�0.20
�0.10
0.001960–74 1975–94 1995–2004
low-growth countrieshigh-growth countries
FIGURE 3.13Evolution of Contribution of Policy
FIGURE 3.14Evolution of Contribution of Shocks
0.110.08
0.58
0.140.12 0.11
0.00
0.10
0.20
0.30
0.40
0.50
0.60
0.70
1960–74 1975–94 1995–2004
resource-rich countries resource-poor countries
Source: Author calculations based on data sources in the appendix.
Source: Author calculations based on data sources in the appendix.

EXPLAINING THE AFRICAN GROWTH RECORD: WHAT APPEARS TO MATTER MOST 97
Conclusions
Following the unpacking of the clusters of the constraints to growth, it is
clear that demographic factors dominate in terms of Africa’s contrast to the
conditions for growth obtaining in the other regions. Particularly strong
among these are age dependency ratios and life expectancy. The former
appears to have gotten much worse in the growth contraction phase before
starting to improve in the past decade, furnishing evidence for the onset of
demographic transition in Africa from the 1980s. However, relative to EAP
and SAR, the contributions have deteriorated even in the past decade,
indicating that the gap between Africa and the Asian economies is widen-
ing with respect to demographic indicators. Life expectancy rates, how-
ever, have worsened even in the growth recovery phase, on account of
health pandemics like HIV/AIDS. Hence, it is imperative that greater atten-
tion be paid to improvement of human development indexes to comple-
ment the demographic transition in Africa.
Openness of trade and policy improvement are the other two areas of
greatest impact. This is particularly the case for low-growth countries
whose growth rates have not even averaged zero percent in the period
from 1995 to 2004. Nevertheless, relative to the other developing regions,
some significant improvements in policy have taken place, particularly in
the high-growth countries in Africa.
Finally, it is clear from the results that Africa needs to pay more atten-
tion to factors other than policy in order to compensate for the unfavor-
able endowments related to geography. The evidence points to significant
improvements in policy during the past decade, and probably the payoff in
terms of scaling up growth would now tend to be higher from efforts in
tackling the other constraints to growth.
Notes
1. Such shortages of foreign exchange during the late 1970s and 1980s, for exam-ple, were much less stringent for importing capital goods, since official devel-opment assistance, which funded most of the public enterprise investments,precluded financing raw material or recurrent costs.
2. This cost differential is also reflected in the wide divergence between the averageshare of investment in GDP for Sub-Saharan Africa measured in domestic andinternational prices. In domestic prices, this ratio for the period 1960 to 1994

98 CHALLENGES OF AFRICAN GROWTH
(weighted by average GDP at 1985 international prices) was 19 percent com-pared to only 9.5 percent at 1985 international prices. For East Asia, China, andindustrialized countries, there is virtually no gap between the two measures.
3. To show the impact of the costs of doing business, we compare the residualsfrom two estimations of productivity as follows:
Gross TFP is estimated as and
Net TFP is estimated as
where _i is net TFP, IC is indirect costs, and (Y – M – IC) is net value added.
4. There are other analyses of the role of ethnicity in the private sector in Africa.Most notable is a study by Taye Mengistae, which looks very rigorously at therole of ethnicity in the indigenous private sector in Ethiopia (Mengistae 2001).More recently, Marcel Fafchamps (2004) examined the dynamics of the pri-vate sector, including the role of ethnicity, in a comprehensive analysis of mar-kets in Sub-Saharan Africa.
5. The data for the figures are from the 1990s surveys conducted by the WorldBank in Africa; this information is not gathered in the current Investment Cli-mate Surveys.
6. We have also tested these hypotheses econometrically, with the use of regres-sion models. We try to determine whether an entrepreneur’s access to a uni-versity education is significant in determining start-up size, as well as his orher access to a formal loan. Both university education and access to a loan atstart-up are also significant for the whole sample. University education is sig-nificant for indigenous entrepreneurs in both East and West Africa, and formalloans help only entrepreneurs in East Africa.
7. The deviation of a region/country i’s period t average growth rate from thesample mean (git – g) can be decomposed into the sum of the observed residualof the region/country i and the regression-weighted sum of the deviations ofa region/country i in the growth determinants as:
The symbol ^ denotes an ordinary least squares estimate, is the set of factorsthat vary over time, and l is the set of factors that are time invariant.
g g y y x xit i t kj
itj
j− =− − + − +− ∑ˆ(ln ln ) ˆ ( ) ˆ
,
____
γ φ λλ εlil
l itz z( ) ˆ− +∑
ln( ˆ ) ln( ) ln( ) ln( )A Y M IC K Li i i i i i i= − − − − −α β δZ
ln( ˆ ) ln( ) ln( ) ln( )A Y M K Li i i i i i= − − − −α β δZ

Much of the analytical work done to explain the tragedy of the collapse of
African growth during the 1970s and 1980s and the slow recovery during
the 1990s has focused on correcting policy mistakes, or what Collier and
Gunning (1999) referred to as “sins of commission.” Indeed, in combina-
tion with the sharp paradigmatic shifts away from an emphasis on correct-
ing for market failure to a greater focus on government failure, the thrust
of the reforms during this period were on restoring macroeconomic stabil-
ity, getting the prices right, freeing up markets, and scaling back govern-
ment involvement in the development agenda. In the process, too little
attention was paid to “sins of omission,” particularly underprovision of
public goods and services essential for reducing firm-level costs and mak-
ing potential opportunities for investment and trade more profitable.
In this chapter we look more deeply at some of the critical constraints
that have been overlooked because of the emphasis on traditional policy
approaches. As we saw from the previous chapter, while traditional macro
policy shortfalls did reduce Africa’s growth rates, many of these policies are
now at international norms. We also saw that human development, polit-
ical, demographic, and geographic variables were much more important in
explaining Africa’s slow economic growth.
The rest of this chapter tackles three main sets of constraints. The first
two are part of Africa’s endowments—geographic, i.e., isolation and frag-
mentation, tropical climates and diseases, the natural resource curse; and
CHAPTER 4
Constraints to Growth
99

100 CHALLENGES OF AFRICAN GROWTH
the second set is delayed demographic transition. Some constraints cannot
be changed; others cannot be changed quickly. But ways to compensate
must be developed. The third set of constraints is largely historic, institu-
tional, or policy related and is subject to change and amelioration. This set
consists of transaction costs, risks, and capacity limitations.
Africa’s Unfavorable Endowments: A Constraint to Growth but Not a Predicament
Africa has atypically large parts of its population living in countries with
economic characteristics that globally have been disadvantageous, and a
history that has made ethnic and regional polarization a major challenge
(table 4.1). A third of its population lives in landlocked, resource-poor
countries. Another third lives in countries with large natural resource
rents, whose growth performance globally has tended to be significantly
poorer than that of non-resource-rich developing countries. Polarization
and fractionalization have invariably been major root causes of conflict
and have saddled the young African nations (most of them less than a half-
century old) with huge costs of nation building and peacekeeping.
Geographical disadvantages account for uncharacteristically high costs
of development in Africa (Ndulu 2006b). It has been argued that high
transportation costs and an environment favorable for diseases conspire to
make capital accumulation and productivity growth much more expensive
in Africa than elsewhere in the developing world (Bloom and Sachs 1998;
Gallup, Sachs, and Mellinger 1999; Sachs and Warner 1995, 1997, 2001).
Africa’s Growth Is Unusually Constrained by
Geographical Disadvantages
Distance and being landlocked influence a country’s access to international
markets, hinder its ability to exploit economies of scale, and lower its pro-
duction efficiency (Sachs and Warner 1995, 1997, 2001). Being land-
locked, remoteness of populations from ports or ocean-navigable rivers,
and large overland transportation distances all reduce growth, studies
around the globe have found (Bloom and Sachs 1998; Gallup, Sachs, and
Mellinger 1999). Economic isolation is more acute in Sub-Saharan Africa,
where 31 percent of the countries are landlocked, compared to only

CO
NSTR
AIN
TS
TO
GR
OW
TH
10
1
TABLE 4.1Interregional Comparison of Geographical and Sovereign Fragmentation Indicators
Natural resource rents dominancec
Ratio of Average Proportion of Average Share of number of population Average population in transport costs Proportion of natural-resource-
countries to density number landlocked ($ per container natural-resource- rich countries inRegion area (*10–10) (people per sq. km.) of borders countries (%) from Baltimore) rich economiesd each regione
SSA 2.00 77.65 4.00 40.20a 7,600 30 34EAP 1.44 405.50 2.09 0.42 3,900b 19 7ECA 1.17 74.58 4.93 23.06 — 19 12LAC 1.52 119.92 2.34 2.77 4,600 20 17MNA 1.60 136.27 3.94 0.00 2,100 63 29SAR 1.67 382.94 2.75 3.78 3,900b 0 0
Sources: Ndulu 2006b and Collier and O’Connell 2006.
Note: — = not available; SSA = Sub-Saharan Africa; EAP = East Asia and Pacific; ECA = Europe and Central Asia; LAC = Latin America and the Caribbean; MNA = Middle East and North Africa; SAR = South Asia.
a. Democratic Republic of Congo, Sudan, and Ethiopia have been treated as landlocked countries.
b. Data on transportation costs are available for East and South Asia regions together (Limao and Venables 1999).
c. An economy is classified as resource-rich if it generates more than 10 percent of its GDP from primary commodity rents (the excess of world prices over production costs). The categories of primary commoditiesincluded are energy resources, other minerals and forests. They are also referred to as "natural resources."
d. As a share of the total number of countries in each region.
e. As a share of the total number of “natural resource” economies (41 in the world).

102 CHALLENGES OF AFRICAN GROWTH
12 percent of all the other developing countries. Nearly 40 percent of the
Sub-Saharan Africa (SSA) population lives in these landlocked countries,
with high transportation costs and poor trade facilitation (figure 4.1).1
Although there are important variations across countries in the region,
for most African countries, distance from their primary markets and the
high transport intensities of their products (low value–high weight and
sparsely produced) are major impediments to production and trade (Esfa-
hani and Ramirez 2003). Frankel and Romer (1999) find that distance
strongly undermines growth due to its impact on international trade. Africa
is by far the most remote continent by this measure, and trade is an even
stronger predictor of growth for African countries than it is for non-African
countries (O’Connell and Ndulu 2000). And the situation is much worse for
landlocked countries. Relative to other regions, the transport costs of intra-
SSA trade are much higher. The median transport costs for intra-African
trade, at $7,600 for a 40-foot container, are almost the same as for imports
from the rest of the world (involving much longer distance), and it is $2,000
more than for intraregional trade in other developing regions. Nominal
freight rates on African exports are normally much higher than those on
similar goods shipped from outside the region (AfDB 1999). For example,
freight charges on African exports to the United States as a proportion of
cost, insurance, and freight value are on average approximately 20 percent
higher than for comparable goods from other low-income countries.
The situation is worse for landlocked countries. In 1990, the ratio of
freight cost to exports for African landlocked countries, at 30 percent, was
twice the average for the region as a whole. Using shipping and CIF-free
on board ratio data, Limao and Venables (2001) find that a representative
landlocked economy has 50 percent higher transportation costs and
60 percent less trade volume than a typical coastal economy. However, the
authors note that landlocked countries are able to offset a significant pro-
portion of this disadvantage through improvements in their own and their
transit countries’ infrastructure. Sub-Saharan Africa is a highly fragmented
region. It has 48 small economies with a median gross domestic product
(GDP) of $3 billion (Wormser 2004). For a given geographic area, the
region has the highest number of countries, with each country sharing
borders with four neighbors on average, often with different trade and
macro policy regimes (Ndulu 2006b). This fragmentation has its origin in
the region’s colonial history, kicked off during “the scramble for Africa.”
This got worse after independence, with the breakup of federations (for

CONSTRAINTS TO GROWTH 103
example, the Northern Rhodesia Federation), customs unions, currency
zones (only the CFA zone [a monetary union] survived), central banks,
and immigration systems—as countries established their own trade
regimes. This process further fragmented policy frameworks, fractured
transportation networks (for example, the disbanding of East African Rail-
ways), and led to more transshipments and longer transit times, as well as
more limited backhauls. So the problem of isolation is not merely one of
market size, but also the absence of cohesion of policy across potentially
larger investment areas.
Ndulu (2006b) reviewed the very substantial evidence mustered at
macro, meso, and micro levels to show how important infrastructure is for
growth—the bulk of it linked to bridging the gaps in geographical disloca-
tion. We highlight here those that have direct bearing on African growth.
At the macro level, the two most recent and comprehensive studies are
those by Esfahani and Ramirez (2003) and Calderon and Serven (2004).
Esfahani and Ramirez (2003) use a structural model to estimate the rela-
tionship between infrastructure and output growth. After accounting for
the simultaneity between infrastructure and GDP, they find that the con-
tribution of infrastructure services is substantial and in general exceeds
the cost of provision of those services. Drawing on these results, the study
finds that if, for example, the growth rate of telephones per capita rises
parametrically from about the current 5 percent per year in Africa to
FIGURE 4.1Sub-Saharan Africa Geographical Distribution
coastal, resource rich26%
coastal, resource poor43%
landlocked, resource poor26%
landlocked, resource rich6%
Source: Author calculations based on classification in Collier and O’Connell (2006).
Note: Data are rounded.

104 CHALLENGES OF AFRICAN GROWTH
10 percent per year, as in East Asia, the annual growth of GDP would rise
by about 0.4 percentage points. In the power sector, an increase of per
capita production growth rate from the current 2 percent in Africa to 6
percent, as in East Asia, can raise the annual GDP growth rate by another
0.5 percentage points. Private ownership of infrastructure assets and gov-
ernment credibility—for example, low risk of contract repudiation—
matter with respect to infrastructure growth. Because of network
properties of infrastructure assets, returns to infrastructure investment
rise with population density. Being landlocked or experiencing difficulty
of access to international markets has a significant negative effect on
steady state investment and productivity in non-infrastructure sectors.
Calderon and Serven (2004) undertake an empirical evaluation of the
impact of infrastructure development on economic growth and income dis-
tribution using a large-panel data set encompassing more than 100 coun-
tries and spanning the years 1960–2000. They consider an aggregate index
of infrastructure quantity and quality, rather than concentrating on any
single type of infrastructure (for example, roads, power, or transport and
communications only). To account for the potential endogeneity of infra-
structure (as well as that of other regressors) they use a variety of GMM
(generalized method of moments) estimators based on both internal and
external instruments, and report results using both disaggregated and syn-
thetic measures of infrastructure quantity and quality. The two robust
results of this study are (1) growth is positively affected by the stock of
infrastructure assets and (2) income inequality declines with higher infra-
structure quantity and quality.
At the meso level, using a gravity model, Limao and Venables (2001)
estimated elasticity of trade with respect to transport costs and found it
typically to be quite high at –3. Distance to key markets is an important
impediment to trade as expected, but in their model, poor infrastructure
(measured by an index combining road, rail, and telecom density)
accounts for 40 percent of the predicted transport cost for coastal countries
and up to 60 percent for landlocked countries.
Applying the results from this analysis to SSA trade performance, they
find that whereas a basic gravity model suggests that African trade, both
internal and with the rest of the world, is lower than predicted (in contrast
to the earlier findings of Foroutan and Pritchett [1993]), augmenting the
model to include infrastructure improves the predictive power of the
model as the predicted value gets much closer to the actual values. The

CONSTRAINTS TO GROWTH 105
median landlocked country has only 30 percent of the trade volume of a
median coastal country. What is also striking from this study is that hold-
ing activity levels and direct distances between trading partners constant,
improving landlocked country infrastructure is as important as improving
the infrastructure in the transit country.
At the micro level, Elbadawi, Mengistae, and Zeufack (2002) estimate
the impact of geography (supplier and market access) on exports of man-
ufactures using an export market participation equation on a sample of
1,400 textile and garment producers from six countries in Africa and two
from outside the region. Supplier and market access are essentially meas-
ured by the inverse of transport costs (international plus domestic) and
trade policy constraints (degree of openness as measured by Sachs and
Warner 1995). They find that (1) firm-level exports increase with both
supplier access and foreign market access—a doubling of foreign market
access would raise exports by 7 percent, whereas exports would increase
by 20 percent with doubling of supplier access; (2) the degree of openness
has a strong twofold impact on exports; (3) domestic transport costs seem
to have significant and much stronger impact on exports than interna-
tional transport—the elasticities with respect to suppliers’ access are much
higher and more robust than with respect to market access; and (4) pro-
ductivity in the firms increases with both supplier access and access to for-
eign markets. Mengistae and Pattillo (2004) have further evidence of
productivity gains through exposure to foreign competition pressure, as
well as through technological learning.
Tropical Climate as a Host for Diseases
More than 90 percent of Sub-Saharan Africa lies within the tropics, where
the burden of disease is high. This compares with 3 percent for Organisa-
tion for Economic Co-operation and Development (OECD) countries and
60 percent for East Asia. Sachs and Warner (2001) and Masters and McMil-
lan (2001) emphasize the high burden of human and animal diseases in
tropical climates, and its impact on life expectancy, human capital forma-
tion, labor force participation, and economic growth. They also find a sig-
nificant negative impact of a malaria index on growth. Easterly and Levine
(2003) and Acemoglu, Johnson, and Robinson (2001) show an indirect
impact of the disease environment on long-term growth. Artadi and Sala-
i-Martin (2003) estimate the forgone growth in Africa as a result of malaria
106 CHALLENGES OF AFRICAN GROWTH
prevalence at 1.25 percent per annum, a figure that surely reflects the
influence of other highly correlated aspects of the health environment.
Demographic Pressure
African countries’ populations grew more rapidly than the non-African
developing world had grown at its peak. The ratio of (overwhelmingly
young) dependents to the working-age population grew steadily, exceed-
ing historical developing-country norms by 1970, and remaining above
these through 2000.
The fertility rate began to fall in Africa in the mid-1980s, suggesting
entry into the final phase of the demographic transition, but at a slower
pace. This observation is further complicated by the huge impact of
HIV/AIDS, starting in the late 1980s, on life expectancies. These very dis-
tinctive demographic features of Africa compared to other regions weigh
unusually heavily on national savings and undermine the building up of
the human capital needed for growth. As we saw in the previous chapter,
the rapid growth of the population, as manifested by a high dependency
ratio, is inimical to rapid economic growth.
The findings in chapter 3 that the delayed demographic transition in
Africa has been a substantial drag on economic growth are not surprising.
Indeed, there exists substantial literature on the benefits of the demo-
graphic transition on economic growth in Asia and elsewhere, which is,
after all, the flip side of the coin. For example, Robert Lucas (2003), in an
essay on the Industrial Revolution, says the following:
On this general view of economic growth, then, what began in Eng-
land in the 18th century and continues to diffuse throughout the
world today is something like the following. Technological advances
occurred that increased the wages of those with the skills needed to
make economic use of these advances. These wage effects stimulated
others to accumulate skills and stimulated many families to decide
against having a large number of unskilled children and in favor of
having fewer children, with more time and resources invested in
each. The presence of a higher-skilled workforce increased still fur-
ther the return to acquiring skills, keeping the process going.
The demographic transition and economic growth. Similarly, Bloom, Canning,
and Sevilla (2001) conclude that the demographic transition throughout
CONSTRAINTS TO GROWTH 107
the world resulted in a changing age structure of the population, with the
growth of the working-age population outstripping that of the non-
working-age population. They then offer a number of reasons why age
dependency has a powerful effect on economic growth. These are labor
supply, savings, and human capital.
Labor supply. The transition mechanism here is largely mechanical. The
demographic transition, in which mortality rates decline first, followed by
fertility rates, leads to a situation in which the population first gets younger
(mortality declines are disproportional among infants and children), and
then the baby boom becomes a boom in the workforce. It is also likely that
declines in childbearing free more women to also participate in the labor
force directly.
Savings. The impact of the demographic transition on savings is also largely
mechanical. Children and the elderly consume more than they save, while
working-age people, for the most part, do the opposite; thus, increasing
the proportion of working-age to dependent population automatically
increases savings.
Human capital. One of the reasons for declining birthrates is the fact that
changes in the economy (rural to urban migration, for example) change,
in a fashion explained by Gary Becker, the calculus that parents use in
deciding whether it is better to emphasize quality or quantity in their chil-
dren. Economic development shifts the incentives by providing greater
rewards and reduced costs to investing in children, thus leading to higher
levels of human capital investment.
As can be seen from table 4.2, in 1960 high-income countries had
reduced their age dependency ratios to 0.6, whereas most countries in
the rest of the world had high age dependency ratios (Sub-Saharan
Africa and Latin America and the Caribbean), and those in Asia were
beginning to decline. Over the next decades, East Asian age dependency
ratios approached those of the high-income countries, whereas those of
South Asia and Latin America and the Caribbean began to decline. The
Middle East and North Africa experienced increasing age dependency
ratios until 1970, when they began to decline, while Africa’s dependency
ratios increased until 1990, when declining fertility rates began to have
an effect.

108 CHALLENGES OF AFRICAN GROWTH
So what has been the global demographic experience since 1960? The
demographic transition information is presented in figure 4.2. In 1962, vir-
tually all regions of the developing world were experiencing the same rate
of population growth (between 2.5 percent and 3.0 percent). However, East
Asia and the Pacific, and to a lesser extent Latin America and the Caribbean,
TABLE 4.2Age Dependency Ratios
Region 1960 1970 1980 1990 2000
East Asia and Pacific 0.79 0.81 0.71 0.55 0.50Europe and Central Asia 0.61 0.60 0.56 0.55 0.50High-income OECD countries 0.60 0.59 0.53 0.49 0.49Latin America and the Caribbean 0.87 0.88 0.80 0.70 0.61Middle East and North Africa 0.90 0.96 0.92 0.89 0.70South Asia 0.78 0.81 0.77 0.72 0.67Sub-Saharan Africa 0.87 0.92 0.94 0.95 0.91
Source: World Bank, World Development Indicators 2006.
FIGURE 4.2Demographic Transition Information: Rate of Natural Increase
0.0
5.0
10.0
15.0
20.0
25.0
30.0
35.0
1962 1967 1972 1977 1982 1987 1992 1997 2002 2004
year
per 1
,000
pop
ulat
ion
EAP LAC MNA SAR SSA
Source: World Bank, World Development Indicators 2006.
Note: EAP = East Asia and Pacific; LAC = Latin America and the Caribbean; MNA = Middle East and North Africa; SAR = South Asia;SSA = Sub-Saharan Africa.

CONSTRAINTS TO GROWTH 109
had already begun to experience lower birthrates and death rates. Over the
next 40 years, East Asia, Latin America, South Asia, and even the Middle
East and North Africa experienced a dramatic decline in population growth
because of steady decreases in mortality rates and unprecedented decreases
in fertility rates (2.2 percent per year in East Asia, 1.6 percent per year in
Latin America, and 1.5 percent per year in South Asia and the Middle East
and North Africa). However, it was not until 1980 that African fertility rates
began to fall, and then at a lower rate (about 0.8 percent per year). This
delay in the demographic transition has probably reduced African growth
rates, but it also offers an opportunity for accelerated growth rates if fertil-
ity declines can be accelerated.
What causes fertility rate declines? There is a great debate as to the causes
of fertility change, but a number of factors have been cited in much of the
literature. These include declining infant and child mortality rates, urban-
ization, increasing incomes, increased levels of education (especially for
women), increased female participation in the labor force, and increased
access to family planning services. A quick look at some of these variables
across regions goes a long way toward explaining Sub-Saharan Africa’s
delay in reducing fertility levels. These data are presented in table 4.3.
If the variables presented in table 4.3 are indeed associated with or even
causative of fertility rates, the reasons for Africa’s relatively high fertility
rate is readily explicable. Compare Sub-Saharan Africa to the regions that
are, on the whole, more developed—East Asia, the Middle East and North
Africa, and Latin America. Africa’s fertility rate is around twice theirs, its
infant mortality rate three to four times as high, its primary enrollment
rates for girls about 80 percent of the other three regions, its secondary
TABLE 4.3Socioeconomic Indicators, 2004
Infant Girls’ primary Girls’ secondary Per capita Fertility mortality enrollment enrollment Percent income
Region rate rate rate rate urban (US$ PPP)
EAP 2.01 36.77 111.75 68.87 40.56 5,335LAC 2.45 31.37 117.36 84.75 76.81 7,684MNA 3.04 55.19 96.41 70.84 56.78 5,735SAR 3.11 91.52 97.99 48.20 28.22 2,876SSA 5.31 168.19 87.56 35.00 34.73 1,871
Source: World Bank, World Development Indicators 2006.
Note: EAP = East Asia and Pacific; LAC = Latin America and the Caribbean; MNA = Middle East and North Africa; SAR = South Asia;SSA = Sub-Saharan Africa; PPP = purchasing power parity.

110 CHALLENGES OF AFRICAN GROWTH
enrollment rate for girls about half, its urbanization rate 60 percent of the
average of the other three, and its per capita income 30 percent of theirs.
Perhaps the more interesting case is South Asia, which has per capita
incomes between those of Africa and the other regions, and intermediate
socioeconomic variables as well. Indeed, South Asia is less urbanized than
Africa and has female enrollment rates not markedly higher than those of
Africa. South Asia still has high infant mortality rates as well, yet its fertil-
ity rates are much closer to those of the other regions than to those of
Africa. Nevertheless, over the 44 years between 1960 and 2004, South Asia saw its
infant mortality rates decline at 2.2 percent per year, while Sub-Saharan Africa
experienced declines of just half of that, 1.1 percent per year.
One problem, of course, is that all these variables are interrelated.
Income growth affects health outcomes directly through better nutrition
and better hygiene. Education affects health outcomes as well. Income
growth affects fertility, and that, in turn, affects income growth. The bot-
tom line is that while there is no magic bullet, the two areas that are most
likely to have spillover effects on fertility behavior are effective health
services focused on reducing infant and child mortality, and expand girls’
enrollments in secondary schools.2
Kahn, Stopnitzky, and El Zayed (2006) examined the relationship
between education and fertility in Bangladesh using multivariate analysis
and found that education had a strong impact on fertility behavior. On
average, women with no education had more than 3.5 live births each,
while women with a secondary education had a little more than two.
The literature is ambivalent concerning the impact of family planning
programs. Supporters note the large numbers of women who would like to
use modern family planning methods but for whom such services are out of
reach, either because supplies are limited or the price is too high, and argue
that unmet demand indicates that increases in the availability of affordable
contraceptives would reduce fertility (Bulatao 1998; Casterline and Sinding
2000). Detractors (particularly Pritchett 1994) argue that fertility behavior
and the desire to control fertility behavior are strongly correlated over time,
and that it is changing intentions with respect to family size, rather than the
supply of contraceptives, that drives fertility outcomes. It is also true that
Western countries experienced the demographic transition before the wide-
spread availability of modern family planning methods.
However, there is evidence that family planning programs may be more
important in reducing fertility in Sub-Saharan Africa than elsewhere. West-
CONSTRAINTS TO GROWTH 111
off and Bankole (2000) note that the percentage of women who want no
more children has risen slowly but steadily in Sub-Saharan Africa since the
1970s, having reached a level of 20 to 40 percent in many countries by the
late 1990s. Yet overall levels remain far below those seen in Asia and in
North Africa, where the level of demand for limiting births clusters in the
40 to 60 percent range. Unmet need for the means to limit births is increas-
ing fairly uniformly for most Sub-Saharan African countries; in contrast, in
Asia and North Africa, and Latin America and the Caribbean, it is generally
declining with the adoption of contraceptive use. Although the evidence
indicates that most women in Sub-Saharan Africa who practice contracep-
tion do so to space rather than to limit births, trend data suggest that the
proportion of users practicing contraception to limit births has been increas-
ing in recent years; in some countries, this proportion approaches half of all
methods used and is higher than expected elsewhere.
Westoff and Bankole (2000, 1) then conclude:
While demand for contraception is increasing throughout the devel-
oping world, most of the demand in Asia and North Africa and in
Latin America is already being met whereas much of the demand in
Sub-Saharan Africa is not. In both Asia and Latin America, where
contraceptive use is already high, providers need to gear their services
toward helping clients to continue use and to improve the effective-
ness of their contraceptive practice. In Sub-Saharan Africa, where use
is low, programs must aim to encourage adoption of modern methods.
Even if supplying contraceptives has a more limited effect on reducing
fertility than its supporters maintain, it still may be the most cost-effective
approach to the problem. We know fertility is directly linked to income
levels, urbanization, and female participation in the workforce, all of
which are part of the growth and development process and tend to change
slowly. We also know that reductions in infant and child mortality and
increased education for girls also reduce fertility, and these should be pur-
sued vigorously in any case. However, although the impact of family plan-
ning programs is still debated, there is little doubt that the costs tend to be
modest compared to other approaches.
Fraser, Green, and Dunbar (2002), in a megastudy of the costs of family
planning in Sub-Saharan Africa, present data that show that, in most
countries, family planning costs range from $10 to $20 per couple per year,
depending on the method. This would mean in Kenya, for example, with
112 CHALLENGES OF AFRICAN GROWTH
9 million women between the ages of 15 and 64, and an unmet need for
contraceptives of 30 percent, that increasing family planning programs to
cover the unmet need would mean spending an additional $30 million to
$60 million. How does this compare to improving primary health services
or expanding secondary education?
Kenya’s education budget in 2003 was $420 million, almost 30 percent
of all government expenditures. Per pupil expenditures in secondary school
were $95 per student in 2003, with girls’ enrollment reaching 1.2 million,
or 46 percent of the secondary school age group. To increase the enrollment
of girls by 25 percent (an additional 300,000 girls) would cost $29.5 million
(assuming one could expand access only for girls). The Kenya health budget
was about $6.50 per capita, well below the estimated requirement by the
World Health Organization of $12 per capita. Thus a well-funded (though
admittedly untargeted) health program would require additional expendi-
tures of around $200 million. Without really knowing the efficacy of these
investments in terms of reducing fertility, it would be hard to determine
which is more cost-effective, although by any measure, the family planning
approach is the cheapest.
Moreover, family planning programs, which, in the past, have been
largely funded by donors, have seen substantial reductions in available
finance, partly because of shifts to HIV/AIDS programs and partly because
traditional supporters have lost interest (box 4.1). At a recent symposium in
Mozambique, African health experts lamented the lack of funding for fam-
ily planning. According to Chisale Mhango, a public health expert at the
African Union’s Department of Social Affairs, “There hasn’t been adequate
emphasis on family planning as a strategy, and yet it is a cost-effective thing.
. . . When you provide family planning, you are reducing unwanted preg-
nancies and therefore maternal mortality—including deaths from abortion”
(Inter Press Service News Agency 2006).
A United Nations Economic and Social Council (ECOSOC) report issued
in January 2005 notes that funding for family planning programs decreased
by 36 percent, from $723 million in 1995 to $461 million in 2003. A similar
report, released in 2006 by ECOSOC, says that donor funding for family
planning continued to decline in 2004.
HIV/AIDS and the Demographic Transition
HIV/AIDS remains a tragedy of overwhelming proportions in
Sub-Saharan Africa, even though estimates of prevalence have been
CONSTRAINTS TO GROWTH 113
BOX 4.1
The Demographic Transition and Family Planning in Ethiopia
“Capturing the Demographic Bonus in Ethiopia,” a draft report produced bythe Africa Region of the World Bank (2006a), offers a strong analytical case forexpanded support for family planning programs. The researchers examine theproximate and structural determinants of fertility in Ethiopia, the expected de-velopment outcomes over the period from 2005 to 2030, the costs of familyplanning programs, and the links between different demographic scenariosand household and national income. Their conclusions are quite dramatic.
After developing a behavioral model in which the determinants of fertility in-clude, among other things, urbanization, women’s education, income lev-els, employment, and female empowerment, the authors simulate the evo-lution of fertility behavior between 2000 and 2030. Beginning withestimates of the changes in income, education, and urbanization over the30 years, they then add the simulations to estimates of the increased useof contraceptives, to present both a low and a high estimate. In the lowscenario, the total fertility rate (TFR) declines from 5.9 in 2000 to 3.63 in2030. In the high scenario, the TFR declines more quickly to 2.87 in 2030.
The authors then examine the differences in population levels, dependency ra-tios, and income resulting from the two scenarios and compare the gain inlong-term income to the costs of family planning programs needed to movefrom the low to the high scenario in terms of contraceptive use. Under the high-fertility scenario, the Ethiopian population in 2030 would be 135 million and theage dependency ratio would be 0.70; under the lower fertility scenario, the pop-ulation would be 124.2 million and the age dependency ratio 0.61. The welfaredifference between the two scenarios, measured in the present value of percapita consumption, is between $105.00 and $112.50. This is a massive num-ber in a country where the current mean level of per capita consumption is$117. The study estimates the cost of an accelerated family planning program as$52 million annually (less than 50 U.S. cents per capita) compared to the moremodest program implicit in the high-fertility scenario.
While any simulation is subject to differing views about reasonable esti-mates of key variables, as well as questions as to the stability of structuralrelationships over long periods, the incredible ratio of benefits to costs offamily planning are likely to be true under any imaginable scenarios. The re-port states, “In conclusion, two major messages emerge from the popula-tion projections and the simulations: (1) Development is the best contra-ceptive; and (2) Contraceptives are good for development.”

114 CHALLENGES OF AFRICAN GROWTH
readjusted downward in recent months.3 The basic facts in Sub-Saharan
Africa are as follows:
• Globally, there are 24.5 million people living with HIV; the epicenter of
the epidemic is in Southern Africa, where one-third of people infected
with HIV reside.
• There are 2.7 million new infections each year.
• The adult prevalence rate of HIV is 6.1 percent.
• Two million people die of AIDS each year. Of those, about 930,000 were
living in Southern Africa.
• Three women are HIV-infected for every two men.
• Among young people (age 15 to 24), 75 percent of the HIV-infected
population are women.
• About 17 percent of those with AIDS (810,000 people) are receiving
antiretroviral therapy.
• Two million children are living with HIV; there were about 12 million
orphans living in Sub-Saharan Africa in 2005.4
Demographic Impacts
As shown in figure 4.3, there are 4 countries in Sub-Saharan Africa with
prevalence rates above 20 percent, another 7 with prevalence rates
between 10 and 20 percent, 7 with rates between 5 percent and 10 per-
cent, and 26 with rates below 5 percent. Clearly, the biggest demographic
impacts will be on the countries with the highest prevalence rates—the
nine countries of Southern Africa and the Central African Republic. The
clearest picture of the impact on the age structure of these countries can be
seen in figure 4.4.
What is clear is that in countries with high HIV prevalence, the whole
pattern of mortality is changed, and changed dramatically. In 10 years,
Southern Africa went from having one-third of annual deaths coming
from the working-age population to two-thirds. While the AIDS pandemic
also affects fertility through a number of channels (increased death rates
and morbidity of women of childbearing ages, changes in sexual behav-
iors, and increased need for women to enter the workforce), it is unclear

CONSTRAINTS TO GROWTH 115
FIGURE 4.3HIV Prevalence in Adults in Africa, 2005Percent
Adult HIV Prevalence Rate, 2005: 20.0 % – 34.0 % 10.0 % – 19.9 % 5.0 % – 9.9 % 1.0 % – 4.9 % < 1.0 %
This map was produced by the Map Design Unit of The World Bank.The boundaries, colors, denominations and any other information shown onthis map do not imply, on the part of The World Bank Group, any judgmenton the legal status of any territory, or any endorsement or acceptance ofsuch boundaries.
IBRD 35345MARCH 2007
Source: UNAIDS 2006.
Note: For Cape Verde, The Gambia, São Tomé and Principe, and Comoros, the data values are not available.
FIGURE 4.4Age Distribution of Deaths in Southern Africa
0
5
10
15
20
25
30
35
40
0–4 5–19 20–29 30–39 40–49 50–59 60+
age groups
perc
enta
ge o
f tot
al d
eath
s
1985–90 2000–05
Source: UNAIDS 2006, 23.

116 CHALLENGES OF AFRICAN GROWTH
whether fertility will increase or decrease. What is certain is that the net
effect of the HIV pandemic on fertility and mortality will be to increase age
dependency ratios and thus reduce economic growth rates.
The high rates of fertility still common in Africa mean that Africa’s
demographic transition has been delayed. The current situation results in
high levels of age dependency, which reduces saving, reduces investment
in human capital, and results in slower growth of the labor force. All of
these factors reduce economic growth rates from what they might have
been if the age dependency ratio were lower. However, this situation pro-
vides a reserve for higher growth rates if fertility rates can be induced to
decline.
Declines in fertility rates seem to be linked to income growth, urbaniza-
tion, girls’ education, and reduced infant and child mortality rates, all of
which have been delayed in Africa because of stagnant growth rates. Thus,
as growth begins to accelerate, as it has in many African countries in the
past decade, there is a reserve fuel in the form of declining age-depend-
ency ratios that can accelerate per capita growth rates by 1 percent or
more. Given the importance of this issue, and the fact that donors have
reduced their funding for family planning programs, it would be well to
revisit the relative priority of investments in family planning.
Finally, the HIV/AIDS pandemic increases age dependency, especially in
high-prevalence countries. Bearing in mind that investments in prevent-
ing and treating AIDS are extremely important from a human point of
view, and the reduction of human suffering is clearly the prime motivating
force for HIV/AIDS programs, it is good to know that these programs may
also, in a minor way, lead to increased economic growth.
Natural Resources—Curse and Potential
Extensive empirical evidence of poor growth performance by the natural-
resource-rich economies in Africa, the Middle East, Latin America, and
East Asia and Pacific suggests that these resources are another factor that
is thought to have negative implications for growth. This is known as the
“resource curse” hypothesis because these countries appear to have failed
to realize their apparent economic potentials. Added to this is what is
known as “Dutch disease,” the fact that foreign exchange inflows from
natural resource exports may have adverse effects on the domestic econ-
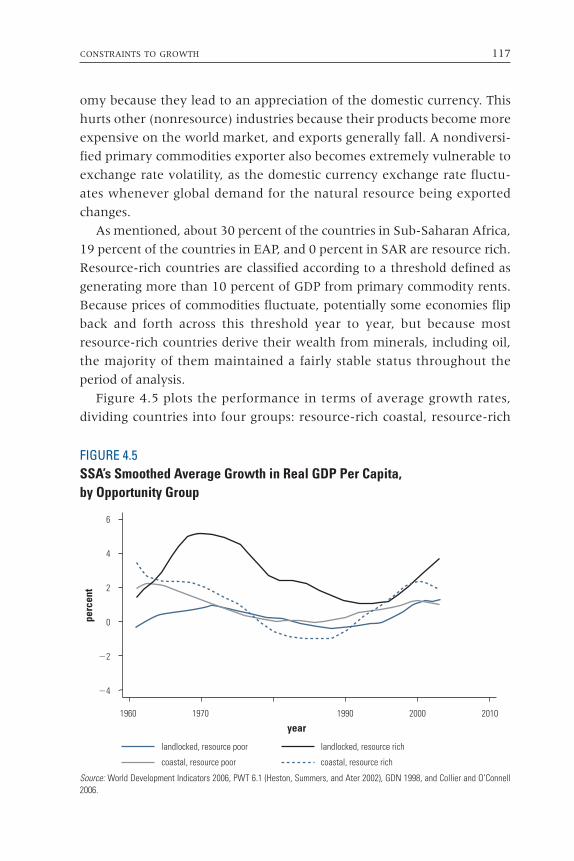
CONSTRAINTS TO GROWTH 117
omy because they lead to an appreciation of the domestic currency. This
hurts other (nonresource) industries because their products become more
expensive on the world market, and exports generally fall. A nondiversi-
fied primary commodities exporter also becomes extremely vulnerable to
exchange rate volatility, as the domestic currency exchange rate fluctu-
ates whenever global demand for the natural resource being exported
changes.
As mentioned, about 30 percent of the countries in Sub-Saharan Africa,
19 percent of the countries in EAP, and 0 percent in SAR are resource rich.
Resource-rich countries are classified according to a threshold defined as
generating more than 10 percent of GDP from primary commodity rents.
Because prices of commodities fluctuate, potentially some economies flip
back and forth across this threshold year to year, but because most
resource-rich countries derive their wealth from minerals, including oil,
the majority of them maintained a fairly stable status throughout the
period of analysis.
Figure 4.5 plots the performance in terms of average growth rates,
dividing countries into four groups: resource-rich coastal, resource-rich
landlocked, resource poor
coastal, resource poor
landlocked, resource rich
coastal, resource rich
1960 1970
year
perc
ent
1990 2000 2010
6
4
2
0
�2
�4
Source: World Development Indicators 2006, PWT 6.1 (Heston, Summers, and Ater 2002), GDN 1998, and Collier and O’Connell2006.
FIGURE 4.5SSA’s Smoothed Average Growth in Real GDP Per Capita, by Opportunity Group

118 CHALLENGES OF AFRICAN GROWTH
landlocked, resource-poor coastal, and resource-poor landlocked. In Sub-
Saharan Africa, there are only two countries with a full set of annual
growth rate observations (Botswana and Zambia) that are categorized as
landlocked, resource-rich economies. The evidence is rather ambiguous.
If we discard the resource-rich landlocked group because it is dominated
by one country with high growth rates—Botswana—the graph suggests
that being landlocked and resource poor is a strong constraint. However,
coastal resource-rich countries did better than coastal resource-poor
countries, except during the 1980s.
Risks and Uncertainty
It is well known that investors make decisions based on a function that
includes the rate of return and the risk of any investment choice: the
higher the risk, the higher the required rate of return. Each investment
carries its own particular risk-return ratios. However, in Africa a number
of environmental factors that are external to the individual investment
tend to raise the risk, and thus, for any given rate of return, reduce the rate
of investment. In this section we will examine two risk-elevating factors:
macroeconomic policies and political instability.
Macroeconomic Stability
Africa as a region has made significant progress in the area of macroeco-
nomic stability. From the mid-1990s, inflation—a standard proxy for
instability—fell from an average of 24 percent to an average of 13.3 per-
cent for the period from 2001to 2004. However, it is worth noting that
despite this recorded improvement, as figure 4.6 shows, average inflation
in Africa is higher than in other regions for the later years.
As the yearly averages for the region show, the improvement achieved
is even more pronounced. Figure 4.6 depicts a steady decline in inflation
to a level below 10 percent in both 2003 and 2004. However, the figure
also shows significant variability over the years, which is a definite threat
to perceptions of stability. In particular, from around 1990, other regions
show much less variability in their inflation rates than Africa (figure 4.7).
It is not only the inflation rate that determines stability, but also its vari-
ability over time. Noise in inflation perpetuates the perception of risk in
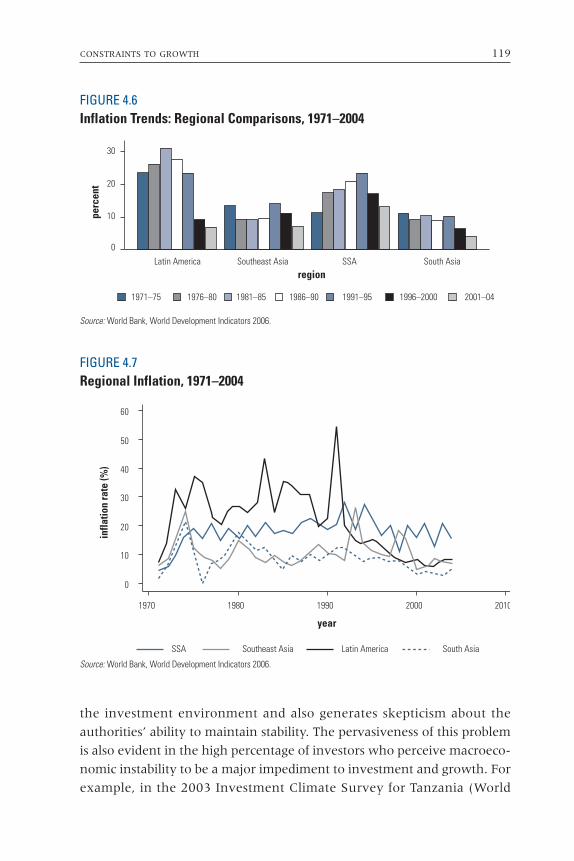
CONSTRAINTS TO GROWTH 119
the investment environment and also generates skepticism about the
authorities’ ability to maintain stability. The pervasiveness of this problem
is also evident in the high percentage of investors who perceive macroeco-
nomic instability to be a major impediment to investment and growth. For
example, in the 2003 Investment Climate Survey for Tanzania (World
FIGURE 4.6Inflation Trends: Regional Comparisons, 1971–2004
0
10
20
30
1981–85 1991–95 2001–041971–75 1986–90 1996–20001976–80
Latin America Southeast Asiaregion
perc
ent
SSA South Asia
Source: World Bank, World Development Indicators 2006.
FIGURE 4.7Regional Inflation, 1971–2004
0
10
20
30
40
50
60
infla
tion
rate
(%)
1970 1980 1990 2000 2010
year
SSA Southeast Asia Latin America South Asia
Source: World Bank, World Development Indicators 2006.

120 CHALLENGES OF AFRICAN GROWTH
Bank 2004a), 43 percent of respondent firms rated macroeconomic insta-
bility as a major obstacle to doing business, even though Tanzania has had
a steady decline in its rate of inflation, from about 21 percent in 1996 to
about 4 percent in 2003. The proportion of entrepreneurs who rate macro-
economic instability as a significant constraint to business is comparable to
Uganda and Kenya, at 45 percent and 51 percent, respectively, but for
China the percentage is considerably lower, at 30 percent. This gives a clear
message that maintaining economic stability should be a priority for
African countries.
Table 4.4 shows that the noted recovery extends to other indicators of sta-
bility, with the possible exception of external debt. Relative to other devel-
oping regions, Africa stacks up very well, again with the exception of debt,
where Africa’s average does not show any signs of declining and also per-
forms poorly relative to other regions. For example, for the period from 1997
to 2003, the debt–to–gross national income ratio of 133 percent is twice as
TABLE 4.4Fiscal Policy Indicators for Selected Regionspercent
Region 1971–80 1981–90 1991–96 1997–2003
Sub-Saharan AfricaGovernment spending (% of GDP) 16.26 17.48 16.463 15.04Growth rate of spending 7.48 3.74 1.93 6.20Fiscal balance �6.44 �5.74 �5.50 �4.81Debt/GNI 31.90 91.00 133.33 133.96Latin AmericaGovernment spending (% ofGDP) 12.99 15.26 12.97 14.55Growth rate of spending 6.56 2.50 3.68 3.21Fiscal balance �2.84 �4.59 �0.73 �2.43Debt/GNI 33.36 87.17 85.84 61.55South AsiaGovernment spending (% of GDP) 9.25 11.26 11.41 12.36Growth rate of spending 8.32 6.35 4.87 6.90Fiscal balance �6.09 �9.77 �7.24 �5.58Debt/GNI 22.82 34.48 46.10 44.16Southeast AsiaGovernment spending (% of DP) 14.38 17.54 14.31 12.73Growth rate of spending 8.14 3.61 6.57 4.50Fiscal balance �4.05 �5.58 �2.45 �3.90Debt/GNI 27.08 56.36 65.12 65.29
Source: World Bank, World Development Indicators 2006.
Note: GNI = gross national income.

CONSTRAINTS TO GROWTH 121
high as that for both Latin America and Southeast Asia, and three times that
of South Asia.
These observations suggest that while on the whole Africa has made
great strides in achieving some measure of stability, the region is not com-
pletely out of the woods. Concerted effort now has to be devoted to sus-
taining the stability, with particular emphasis on prudent management of
fiscal policy.
Recent developments, specifically developments in commodity markets
and future official development assistance flows, make the issue of fiscal
management more urgent. Most African countries rely on primary com-
modities, whose prices tend to fluctuate significantly. This has in the past
resulted in a procyclical fiscal policy that is mainly driven by developments
in commodity markets. Further, volatility of commodity prices makes it
difficult to stabilize budgetary spending. The current environment of rising
oil prices presents a particular challenge to management of windfall gains
by oil-producing countries. Dependency on oil tends to be even trickier
due to high volatility of oil prices. In addition to high fluctuations, oil price
changes are subject to exogenous shocks, which are primarily caused by
unforeseen factors and as such are difficult to project. This not only gener-
ates volatility in government spending, but also puts pressure on fiscal pol-
icy, especially with regard to sterilizing excess revenue for medium- to
long-term sustainability.
The donor community has committed to doubling aid flows to Africa
over the next few years. This will be, by any standard, a large increase, and
while the scaled-up aid will open up fiscal space for African countries, it
nevertheless presents a host of challenges to macroeconomic management
of recipient countries and could potentially be a source of imbalances. The
impact of higher aid flows will depend on policy choices regarding the uti-
lization and absorption of these resources, as well as the interactions
between monetary policy, fiscal policy, and exchange rate management.
The threats to macroeconomic stability from increased aid include the
potential for real exchange appreciations and their effect on exports and
competitiveness. Scaling up aid may also generate inflationary pressures
from increased domestic demand, unless the liquidity injections are steril-
ized. Aid flows tend to be unpredictable, which may impede a government’s
ability to plan effectively. Also related to this unpredictability, governments
must make plans for continued spending in the event that donors renege
on their commitments. This could lead to increased fiscal deficits.

122 CHALLENGES OF AFRICAN GROWTH
Political Uncertainty and Conflict
Polarization, Nation Building, and ConflictThe countries of Sub-Saharan Africa came to political independence both
later and more rapidly than those of other developing regions. While only
Ethiopia, Liberia, and South Africa existed as independent states at the end
of 1955, fully three-quarters of colonial Africa, representing the vast bulk
of its population and GDP, had achieved political independence by 1966. In
1966, the average independent state in Sub-Saharan Africa had held sov-
ereignty for fewer than 10 years; its counterparts in the rest of the devel-
oping world had been independent for the better part of a century.
Colonial structures of political control were both arbitrary—with
boundaries cutting across historical patterns of politics and trade—and
effective. Their abrupt departure meant that the challenge of economic
development was in many cases confounded from the outset with an acute
problem of nation building. Nigeria provides a telling example of the
impact of ex ante regional polarization on political and economic develop-
ment. But similar patterns of internal polarization, often created or rein-
forced in the encounter with conquering European powers, existed
throughout the continent in 1960.
While the salience of ethnoregional polarization was clear to political sci-
entists in the early 1960s (for example, Carter 1962, 1963, 1966), economists
have only recently begun to come to grips with the implications of nation
building for African economic growth. Two approaches have been important.
The first is due to Easterly and Levine (1997), who noted that as a legacy of
low population densities and arbitrary colonial boundaries, the probability
that any two randomly chosen individuals in a given African country would
belong to the same ethnolinguistic group is very small. Moreover, on a global
basis, ethnolinguistically heterogeneous countries tend to grow more slowly,
as a result of weaker public sector performance. Miguel (2004) reports a sim-
ilar finding for Kenya and Tanzania. Collier (2000) finds, however, that the
adverse impact of heterogeneity is strongly contingent on political institu-
tions. In democracies, ethnolinguistic heterogeneity has no impact either on
overall growth or on microeconomic efficiency (as measured by the eco-
nomic return on World Bank projects). In dictatorships, the impact is strong.
Azam (1995, 2005) focuses on polarization, rather than on heterogeneity
per se; a polarized society is defined here as one like Nigeria’s, in which there
are two or three large subnational ethnic groups that dominate population

CONSTRAINTS TO GROWTH 123
and politics in separate regions. Azam argues that in a situation of ex ante
ethnoregional polarization, regionally based redistribution may be required
to buy off the threat of armed conflict. The existence of such a risk is consis-
tent with the global evidence of Collier and Hoeffler (2000), who find the
risk of civil war maximized under conditions of polarization: homogeneous
societies have low exposure to civil war, but so do heterogeneous societies.
In cases of ex ante polarization, then, the Azam analysis forces a reinterpre-
tation of distortionary redistribution. If the “good policy” counterfactual
involves armed conflict and economic collapse, a redistribution program that
distorts efficiency relative to a peaceful counterfactual may be growth pro-
moting (relative to the true counterfactual). This condition shifts the grounds
of the governance critique from redistribution itself to the instruments
employed to achieve it. Political elites attempting to “buy the peace” should
be seen to do so transparently and credibly (perhaps via constitutional
means), and with a minimum of distortion, and they should simultaneously
employ instruments directly targeted at reducing polarization.
Conflict in AfricaOver the past 40 years, especially in the past two decades or so, Africa has
experienced a debilitating descent of states into persistent internal conflict
that has become an all-too-familiar phenomenon across the region. In fact,
conflicts are now arguably the single most important determinant of
poverty in Africa. According to the International Institute for Strategic
Studies, in 1999 Africa played host to more than half the world’s conflicts
as instability not only brewed within countries but spilled over into neigh-
boring states, resulting in catastrophic wars within and among countries.
While growing nationalism and ethnicity has typified these conflicts, other
factors such as abject poverty, lack of opportunities, and corruption have
contributed significantly.
Africa’s underlying proneness to rebellion, and hence to civil war, is
strongly related to economic conditions. Conflicts affect the economy
through reduced investment in both physical and human capital, as well
as through the destruction of existing assets, including institutional capac-
ity, and these are reflected in reduced economic growth. Statistics show
that countries that experienced a civil war had an average income that was
about 50 percent lower than countries that did not experience a conflict,
and investment ratios for both physical and human capital were also about
50 percent lower in conflict countries.

124 CHALLENGES OF AFRICAN GROWTH
Conflicts across the region have profoundly changed the social welfare
of affected societies as military spending has diverted increasing propor-
tions of national resources from pressing developmental needs. Local and
national economies have suffered huge output losses with devastating
consequences to the quality of life as populations became poorer. Conflicts
have led to widespread dislocation of populations and loss of household
savings. Conflicts have also caused serious reversals in health and other
human development aspects. For example, in most war-torn countries old
diseases have reappeared and new ones have emerged in situations where
health and other social facilities not only were underfinanced but were
stretched far beyond their capacities.
A study by Milanovic (2005) finds that war and underlying risk factors
are the reasons why low-income countries, and Africa specifically, failed to
catch up to the slower-growing developed countries. The poorest countries
have lost, on average, some 40 percent of their output through greater fre-
quency of war compared with the rest of the world. Wars alone explain
almost the entire relative decline of the less developed countries (LDCs)
compared with the middle-income countries. In other words, had preva-
lence of war among LDCs been at the same level as elsewhere, the LDCs
would have at least kept pace with the rest of the world.
Figure 4.8 shows the incidence of civil war in the developing world since
1960. There is a sharp increase in both absolute and relative terms in Sub-
Saharan Africa in the early 1990s. Since the mid-1990s, however, there has
been a sharp decline in the proportion of countries involved in civil conflict in
the region, and the proportion of the African population living in an environ-
ment of civil conflict has fallen more sharply, dipping below the average of
other developing regions at the turn of the 21st century. Cessation of conflict
in Sudan is not reflected in this data and should further reduce the latter pro-
portion. This positive change is corroborated by new global data on the inci-
dence of violent conflicts (Gleditsch and others 2002). Using these data,
Collier and Hoeffler (2006, 89–107) show that immediately after the end of
the Cold War, the incidence of wars declined. The number of wars peaked in
Africa in 1992, and since then the number of civil wars seems to be declining.
The Costs of WarRecent research suggests that the incidence and severity of conflicts in
Africa have had a robust, negative effect on the growth rate of income. For

CONSTRAINTS TO GROWTH 125
instance, the data show that countries that experienced civil wars had an
average income 50 percent lower than that of countries that experienced
no civil war.
The indirect cost of war can be higher than the direct cost. In war-torn
countries, many state functions that are essential for a good business envi-
ronment, such as the judiciary system, are compromised. As a result, the
production structure is altered, as agents shift their assets to sectors that
are insulated from the disruptions of conflicts. The sectors that produce
tradable goods and services and financial intermediation are adversely
affected, whereas the agriculture and defense sector grows. After the war
ends, there is reversal to the prewar structure, but such reversal occurs
gradually, and it can take years before the prewar level of activity is
recovered.
A study by Lacina and Gleditsch (2005) estimates the magnitude of the
indirect cost of war by comparing the number of battle deaths with esti-
mates of war deaths from other causes, primarily disease and malnutrition.
Their findings for a selected number of countries are reported in table 4.5.
FIGURE 4.8Countries in Civil War
0
10
20
30
40
1960 1970
Sub-Saharan Africa other developing countries
1980 1990 2000year
perc
ent
perc
ent
a. Proportion of countries in civil war
0
20
40
60
1960 1970 1980 1990 2000year
b. Proportion of population in civil war
Source: Ndulu and O’Connell 2006a (Sambani’s data set).

126 CHALLENGES OF AFRICAN GROWTH
The study confirms that the direct costs of war are only a fraction, often
less than 10 percent, of the indirect costs. Far more people die from war-
related disease and malnutrition than from battle death. These dispropor-
tional costs are borne mostly by noncombatants and provide the rationale
for intervention.
Collier and Hoeffler (2004) estimate that one year of conflict reduces
the country’s growth rate by 2.2 percent. Moreover, a civil war typically
has an average life of 7 years, implying a 15 percent reduction of the econ-
omy. However, these are not the total economic costs of wars. Postconflict,
the economy grows at more than 1 percent above the norm, but it takes
roughly 21 years to achieve a level of GDP that would have been attained
had there been no war. The total economic costs (present value at the
beginning of the war) have been estimated at 105 percent of GDP. Military
expenditure (as a percentage of GDP) rises by 1.8 percent during the war
but declines by only 0.5 percent postconflict. If we assume this lasts for 10
years postconflict, the cost is 18 percent of GDP (present value).
Conflicts affect the growth rate of African economies through reduced
investment in physical capital and the destruction of assets, including insti-
tutional capacity. Investment ratios and stocks of human capital in civil
war countries are at least 50 percent lower than the average for countries
that had no civil war.
The results for the effects of conflict on the level of income per capita are
mixed. This could reflect the fact that today’s level of per capita income is
the result of years of policy choices and exogenous shocks. Some authors
find no or negligible effects of conflict on the level of income per capita in
Africa. Others, using different quantitative estimation techniques, find a
robust and negative effect of conflict on the level of income. Artadi and
Sala-i-Martin (2003), for instance, find that civil conflict decreased the
TABLE 4.5Battle Deaths versus Total War Deaths in Selected African Conflicts
Battle deaths Estimates Battle as a percentage
Country Years of total deaths deaths of total war deaths
Angola 1975–2002 1.5 million 160,475 11Sudan 1983–2002 2 million 55,000 3Liberia 1989–96 150,000–200,000 23,500 12–16Democratic Republic of Congo 1998–2001 2.5 million 145,000 6
Source: Lacina and Gleditsch 2005.

CONSTRAINTS TO GROWTH 127
average annual growth in Sub-Saharan Africa by 0.5 percent in the second
half of the 20th century.
Regional SpilloversConflicts are bad public goods. They affect not only the countries involved,
but also neighboring countries through the flow of refugees, drug activity,
loss of remittances, and loss of export proceeds. Research shows that neigh-
boring countries lose about 43 percent of GDP, and since the average num-
ber of conflict-neighboring countries is 2.7, the total cost of a conflict in one
country is 115 percent of initial GDP of neighboring countries. The interna-
tional community intervention is therefore needed not only to help break
the cycle of violence, but also to prevent any regionalization of conflicts.
Recent TrendsEven though Africa compares unfavorably with the rest of the world, sig-
nificant progress has been made recently. The number of actual and
attempted military coups has been declining since independence in Africa.
In 2004, there were 40 percent fewer coup attempts than in the 1960s, and
all failed. There is a decline in the number of international terrorist inci-
dents in Africa, and the number of terror cells in Africa has declined.
The number of conflicts in which a government was one of the warring
parties declined from 15 to 10 between 2002 and 2003, while one-sided
violence declined by 35 percent. Reported fatalities from all forms of polit-
ical violence were down by more than 24 percent. Warfare has been less
deadly over time. The average numbers of battle deaths per conflict per
year have declined, although unevenly.
Despite those positive advances, concerns and challenges remain. The
decline in the number and scale of conflicts was gained through preventive
diplomacy and an involvement of peacekeeping forces when diplomacy
failed. The fact that wars are ended does not necessarily mean that their
underlying causes have been addressed. For peace to be sustainable over
the long run, the root causes of conflict need to be addressed.
Political Instability, Conflict, and Investor BehaviorAs discussed, political instability reduces growth rates. In the case of con-
flict, it does so by dislocating, injuring, and even killing people; destroying
infrastructure; and bringing purposive economic activity to a halt (box 4.2).
But political instability, even if it doesn’t lead to conflict, creates uncertainty

128 CHALLENGES OF AFRICAN GROWTH
BOX 4.2
Country Studies
Rwanda. Lopez and Wodon (2005) estimated the cost of armed conflict inRwanda. They found that without the genocide of 1994, Rwanda’s per capi-ta GDP would have been about 25 percent higher in 2001. The study sug-gests that the economic cost of the conflict was long-lasting, even thoughRwanda managed successfully to reverse the decline of some other socialindicators, such as the rates of enrollment in primary school and the rate ofchild mortality.
Mozambique. Mozambique is a former Portuguese colony. The civil con-flict, which started with groups funded at Mozambique’s independence in1974, ended in 1992. It is estimated that up to 1986, some 100,000 Mozam-bicans were killed, mostly civilians. More than 5 million people have beendisplaced internally, and approximately 1.7 million have been forced to fleeto neighboring countries. Long after the war ended, landmines continuedto exact a heavy toll on the population.
Impact of the genocide on per capita GDP in Rwanda
0
20
40
60
80
100
120
140
1993 1994 1995 1996 1997 1998 1999 2000 2001
GD
P
actual GDP GDP if no genocide
year
Source: Lopez and Wodon 2005.

CONSTRAINTS TO GROWTH 129
The economic losses to Mozambique because of the war were $15 billion, fourtimes the 1988 GDP. In addition to the destruction of roads, approximately 45 percent of schools had been destroyed or closed by the end of 1987. By1993, 48 percent of the total number of health posts had been destroyed. Theenvironment was severely affected too, leading to a fall in the population of ele-phants from between 50,000–65,000 in 1974 to 13,000 or less in 1990.
The Mozambique case provides a classic example of how conflict in onecountry can affect the welfare of neighboring countries. Tanzania, Zambia,and Zimbabwe are the countries that suffered the brunt of the Mozambiquewar. Their economies have been affected because of increased defensespending, and the additional costs of transportation throughout SouthAfrica, as the facilities in Mozambique became unavailable. The use ofthese ports is estimated to have cost Southern African Development Com-munity (SADC) countries $300 million a year. By 1988, Malawi had lost ap-proximately 40 percent of its GDP, Zimbabwe 25 percent, Zambia 20 per-cent, and Tanzania 10 percent. The conflict created an environmentalproblem as a result of the massive displacement of population. Malawi in1989–90, for instance, had lost approximately 12 million trees to buildingand cooking supplies.
Democratic Republic of Congo. Since independence in 1960, the DRChas been almost continuously racked by conflict. The first five years after in-dependence were extremely bloody, with assassinations and secessionsby Katanga and Kasai provinces the order of the day. In 1965, Lieutenant-General Joseph Mobutu overthrew President Kasavubu and began 32 yearsof despotic, but in Congolese terms, peaceful rule. Mobutu, in turn, wasoverthrown by a foreign-backed rebellion led by Laurent-Desire Kabila in1997. This was followed by what has been called the Second Congo War, inwhich troops from Uganda, Rwanda, Zimbabwe, Namibia, Angola, Chad,and Burundi were aligned with various internal forces. An estimated 4 mil-lion people have died, most from starvation and disease, and the EasternCongo continues to be the site of periodic conflict.
In 1974, GDP equaled about $8.0 billion; it fell by 14 percent to $6.8 billionin 1982 and rose again to a peak of $8.4 billion in 1989. Since that time, asa result of misgovernment and increasing conflict, GDP fell to $4.2 billion in2002, 50 percent of what it was in 1989. With a rapidly growing population,the average person in the DRC saw his or her income decline from $241 to$82, a decline in welfare that is largely unprecedented in the modern era.

130 CHALLENGES OF AFRICAN GROWTH
as to the direction and stability of economic policy, and thus raises the risk-
iness of investment. In unstable times, only those investors who expect
very high rates of return will invest in physical capital, while others will put
their savings in land or other safe investments, including capital flight.
Weak Institutional Capacity
A detailed discussion of the weaknesses of Africa’s institutional capacity,
along with a discussion of strategies to invigorate capacity in both the state
and nonstate sectors, can be found in “Capacity Building in Africa” (World
Bank 2005b). Suffice it to say that only four countries in Africa are above
global averages for state effectiveness and societal engagement. With few
exceptions, the first three decades of state capacity building—1960 to
1990—produced poor results. Efforts at indigenizing the inherited, colo-
nial, extractive, and elitist state were often swamped by patronage and
clientelism and unsustainable expansions in the scope of government
(Levy and Kpundeh 2004). For many Sub-Saharan countries, independ-
ence was followed by a period of political and economic instability that
was not conducive to capacity development. The postindependence insta-
bility was related variously to wars (both civil and cross-border), repres-
sion, autocratic rule, clientelism, and revolutionary socialism.
Even under these often turbulent conditions, Africa benefited from
islands of excellence in the public sector’s organizational capacity and per-
formance. The well-managed public entities included central banks,
finance ministries, revenue-generating agencies, and offices of political
leaders (presidents, prime ministers, and cabinets). They depended on
explicit decisions by political and administrative leaders to establish the
key elements of public sector management needed to run the state and
maintain power, showing that strong, committed leadership matters for
capacity development. Nevertheless, key institutions, both public and pri-
vate, necessary for private sector growth are largely weak and ineffectual.
Of particular importance are the institutions serving the financial sector.
The Financial Sector as a Constraint to Growth
This section discusses the structure of African financial sectors as it influences
private sector activity, economic growth, and poverty alleviation. Particular

CONSTRAINTS TO GROWTH 131
emphasis is placed on obstacles and challenges they present to host
economies, specifically financial depth, access, and efficiency. A vibrant, com-
petitive, and efficient financial sector that reaches the majority of an econ-
omy’s population is a cornerstone of sustained high levels of economic growth
and development. Financial markets enhance economic growth through var-
ious channels that include mobilization and pooling of resources, increased
allocative efficiency of savings, expansion and diversification of opportunities,
risk sharing, and easier exchange of goods through effective payment sys-
tems. Better functioning financial systems are particularly instrumental in
reducing external financing barriers and thus enabling entrepreneurial activ-
ity and firm expansion through increased lending activity.
Financial sectors in Sub-Saharan African countries, however, have not
contributed significantly to economic growth. African financial sectors,
especially in low-income countries, are among the least developed in the
world. The systems are shallow relative to the size of the economies. The
range of institutions is narrow and dominated by commercial banks. Lim-
ited access to basic financial services, including credit availability, contin-
ues to pose a major obstacle to entrepreneurial activity and welfare
improvement. It is worth noting that some progress is being made as finan-
cial systems continue to institute reforms, broaden their product base,
deepen their lending, and increase their reach. However, given that deeper
and more efficient systems are critical for growth prospects, clearly much
more needs to be done if financial sectors are to be in the vanguard of engi-
neering economic growth. Decisive initiatives are required to turn the tide
and make financial sectors major players in economic growth.
Financial Sector Development
Formal financial systems have been very shallow in African countries, and
they are even more so in low-income countries. Table 4.6 shows that in
terms of both M2/GDP (ratio of money and quasi money to GDP) and pri-
vate sector credit, Africa has the lowest averages. The M2/GDP ratio of about
27 percent for the period from 2001 to 2004 is considerably lower than the
43 percent for South Asia and 50 percent and 56.9 percent for Latin Amer-
ica and Southeast Asia, respectively. These comparisons are also reflected in
the private sector credit averages for the same period, whereby Africa scores
16 percent against 26 percent for South Asia, 44 percent for Latin America,
and 45 percent for Southeast Asia. Moreover, while other regions have had
the latter measure increasing, the average for Africa has tended to stagnate.

132 CHALLENGES OF AFRICAN GROWTH
Within the region itself, there are significant differences in the financial
development of individual countries. Not surprisingly, higher-income
countries appear to have more depth than their low-income counterparts
(figure 4.9). Low-income countries in Africa attained an average of 25 per-
cent and 12.6 percent, respectively, for M2/GDP and private sector credit
in the period from 2001 to 2004, compared to 32.8 percent and 35.5 per-
cent, respectively, for middle-income countries.5
Inefficiency in the Banking Sector
Interest rate spreads throughout the region have remained high, with lit-
tle indication of converging with global levels. Banks in Africa have been
more inefficient than in most other developing regions, as indicated by the
interest rate spread that is highest among African countries and widest
among all developing regions, at a median of 13 percent (figure 4.10). The
main factors causing high spreads can be grouped into high operating costs,
perceived risk from policy frameworks and lending environments, lack of
competition, and high concentration.
In most of Africa, lack of competition is pervasive, so banks do not have
to alter their way of doing business or their pricing structures to get a fair
share of the business. In addition, the small size of markets across Africa
results in diseconomies of scale and consequently leads to high fixed and
operating costs. These, compounded by the inadequacy of infrastructure,
result in high transportation and telecommunications costs. All these fac-
tors translate into high costs of intermediation, which are, in turn, reflected
in wide interest rate spreads.
TABLE 4.6Indicators of Financial Development: A Regional ComparisonPercent
Sub-Saharan Southeast Latin South Africa Asia America Asia
1996– 2001– 1996– 2001– 1996– 2001– 1996– 2001–Indicator 2000 04 2000 04 2000 04 2000 04
M2/GDP 24.4 26.7 49.6 56.9 43.1 50.0 38.5 43.6Private sector credit 17.1 16.5 44.9 45.4 43.2 43.9 22.7 26.4Liquidity liabilities 31.9 32.3 54.3 61.1 48.0 54.8 42.7 47.8
Source: World Bank, World Development Indicators 2006.

CONSTRAINTS TO GROWTH 133
The lending environment across Africa is characterized by a poor credit
culture, poor contract enforcement, and lack of protection of creditor
rights. Coupled with a lack of collateral and inability to prove creditworthi-
ness on the part of potential borrowers, these elements have resulted in a
higher perception of risk and higher external finance premiums. The
prevalence of nonperforming loans in banks’ portfolios add to these costs
as banks compensate for the cost of forgone interest income by charging
higher lending rates to performing loans.
FIGURE 4.9Financial Development in SSA
0
10
20
30
40
a. Financial development indicators by income: private sector credit
b. Financial development indicators by income: M2/GDP
perc
ent
perc
ent
time period
time period
0
10
20
30
40
1971–80 1981–90 1991–95 1996–2000 2001–04
1971–80 1981–90 1991–95 1996–2000 2001–04
middle-income countries low-income countries
Source: World Bank, World Development Indicators 2006.

134 CHALLENGES OF AFRICAN GROWTH
Access to Finance
A key characteristic of African financial sectors is low access to financial
services.6 A disproportionately small fraction of the populations across the
region is served by formal financial institutions. Data on access to financial
services are scarce, and most conclusions reached are from anecdotal but
compelling evidence.7 Figure 4.11 nevertheless gives a good idea of the
extent of this problem.
Lending to the private sector remains an impediment. Access to credit in
Africa has been a problem, particularly for small and medium enterprises,
the informal sector, low-income people, and agricultural sectors. Figure
4.12 shows that for the selected sample of African countries, not only is
credit extended at a much lower rate, but lending conditions, captured by
the interest rates and collateral requirements, are more stringent.
The limited contribution of African financial sectors to their private sec-
tors is evident in the level of resource intermediation relative to their most
productive uses. Evidence suggests that Africa has a very low propensity to
on-lend mobilized deposits. This is reflected in low ratios of loans to
deposits. The average ratio for the region is around 32 percent, with a ten-
dency for higher-income countries to have better performance ratios.
FIGURE 4.10Median Spread: A Regional Comparison
0
5
10
15
med
ian
spre
ad (p
erce
nt)
1980 1985 1990 1995 2000 2005year
SSA Latin America Southeast Asia South Asia
Source: World Bank, World Development Indicators 2006.

CONSTRAINTS TO GROWTH 135
What factors impede lending in Africa? Structural problems in financial
systems explain a large part of why access to credit remains a key obstacle
to African enterprise. These deficiencies include information problems,
limited bankable projects, perception of high risk, and in some lingering
cases, regulation of interest rates. Problematic contract enforcement, char-
acterized by lengthy and cumbersome processes of recovering claims or
realizing collateral, also features prominently in banks’ lending decisions.
FIGURE 4.11Access to Finance: Africa Relative to Other Regions
0 2 4 6 8
number of branches per 100,000 people
deposits per 100,000 people
Latin America
Southeast Asia
South Asia
Sub-Saharan Africa
Latin America
Southeast Asia
South Asia
Sub-Saharan Africa
a. Access to financial services: branches
b. Access to financial services: deposits
0 200 400 600 800
Source: World Bank 2006c.

136 CHALLENGES OF AFRICAN GROWTH
Government borrowing has crowded out private credit and has effec-
tively hampered economic activity. Over the past few decades throughout
the region, banks have relied extensively on government paper. Histori-
cally, instruments such as treasury bills offered higher interest rates
despite their being relatively risk free. As shown in figure 4.13, Africa has
one of the highest growth rates of government claims, but the main dif-
ference is in the growth rate of claims against the government relative to
claims against the private sector. Moreover, in all other regions, claims
against the private sector have been growing faster than claims against
the government. In Africa, the opposite has been true. This increased bor-
rowing by African governments has resulted in banks having little incen-
tive to seek lending opportunities in the private sector and possible
compromised development of new products and innovative ways of doing
business.
Low Savings
Mobilization of domestic savings in Africa remains at the center of the
debate over ways to harness resources for development in Africa. It is pre-
FIGURE 4.12Access to Financial Capital
perc
ent
country
0
50
100
150
200
250
Kenya Uganda Tanzania Zambia Senegal Benin Morocco China India
percentage of firms with loan average cost of loan (%) collateral as percentage of loan
Source: Ramachandran, Tata, and Shah 2006.

CONSTRAINTS TO GROWTH 137
sumed that higher investment rates will lead to higher growth. Thus,
domestic savings is considered an important determinant of growth in
developing countries. Foreign savings is also important, but investment
financed with domestic savings is considered not only less costly but also
more permanent and durable. However, Africa has had the poorest savings
performance in the world.
FIGURE 4.13Portfolio Allocation Trends
.25
.3
.35
.4
.45
1980 1985 1990 1995 2000 2005year
all countries regional average
low-income countries middle-income countries
a. Loans/deposits ratios in Africa by income levels
0
50
100
150
Latin America Southeast Asia SSA South Asia
1971
–80
1981
–90
1991
–95
1996
–2000
2001
–04
1971
–80
1981
–90
1991
–95
1996
–2000
2001
–04
1971
–80
1981
–90
1991
–95
1996
–2000
2001
–04
1971
–80
1981
–90
1991
–95
1996
–2000
2001
–04
b. Government versus private sectordeposit money institutions claims
growth—government claims growth—private sector claims
Sources: World Bank 2006c; IMF EDSS 2005.

138 CHALLENGES OF AFRICAN GROWTH
Saving rates in Africa have remained far below those of other develop-
ing regions. As figure 4.14 shows, as a region, Sub-Saharan Africa has not
only had low savings, but starting in the early 1970s, the savings rate has
declined significantly, especially in the 1980s. This trend has begun to
reverse itself with a notable increase, but the rate remains significantly
below the regional average achieved in the 1970s. The poor performance
of Africa becomes even starker when compared to other regions, especially
with respect to South Asia. In the early 1970s, the average savings rate in
Sub-Saharan Africa was higher than in South Asia. However, while the
savings rate in Africa has trended downward, South Asia has experienced
a sustained upward trend, so that by 2003 the average savings rate had
exceeded 20 percent, compared to a mere 9 percent for Africa.
The situation is even worse if one excludes resource-rich countries,
which have relatively high savings rates. Without these outliers, the aver-
age savings rate for the region would be even lower. In fact, when we
exclude these countries from the sample, the average savings rate falls from
5 percent to about 3 percent in 2003. Over the period under consideration,
the savings rates in the majority of African countries have averaged below
10 percent of GDP, with some countries actually recording negative rates.
Over time as well, individual country performance has varied signifi-
cantly. Some of these differences are depicted in figure 4.15. With the
FIGURE 4.14Saving Trends: Regional Comparison by Decade
0
5
10
15
20
Latin America Southeast Asia
perc
ent
SSA South Asia
1971–80 1981–90 1991–2003
Source: World Bank 2006c.

CONSTRAINTS TO GROWTH 139
exception of Botswana, Cameroon, and Mauritius, all countries suffered
declines in saving rates in the 1980s. The declines in the average savings
rates for the decade varied significantly, from as low as 1 percent to as
much as 20 percent.8 However, even though the saving rates for most
countries bounced back in the following decade, for some countries the
falls were sustained. Some of the countries whose declines lasted into the
1990s have started experiencing upswings in their saving rates. The
declines have been more stubborn in a few countries. A case in point is
Kenya, whose savings rate of 19 percent in the 1970s has dropped each
decade to an average of 8.6 percent, achieved since the turn of the millen-
nium. A similar situation exists in Malawi, where the savings rate also
dropped dramatically, from 14 percent in the 1970s to a current average of
negative 5 percent.
Overall, the decade starting in the 1990s is marked by improvements in
savings. However, as the figure below shows, more than 25 percent of the
countries experienced declining savings rates.
Another fundamental feature of domestic savings in Africa is the promi-
nence of public savings as a determinant of savings rates—a feature that is
absent in other developing regions where savings rates are driven by pri-
vate savings. Indeed, for Africa it has been found that where savings have
declined, public savings deteriorated at a faster rate than private savings
FIGURE 4.15Saving Trends in SSA, 1980–2004
�20
�10
0
10
20
30
40
50
Mali
Seneg
al
Burkina
Faso
Benin
Guinea
-Bissau
Tanzan
iaSud
anCha
d
Mozambiq
ue
Cape Ve
rde
Ugand
a
Maurita
nia
Madag
ascarGha
na
Nigeria
Mauriti
us
Congo
, Rep
. of
Namibi
aAng
ola
Botswan
aGab
on
Seyche
lles
Zimba
bwe
Camero
onKen
ya
South
Africa
Zambia
Ethiop
iaNige
r
Swazilan
dTog
o
Malawi
Sierra
Leone
Rwanda
Burund
i
1980–90
perc
ent
1991–2004
Sources: World Bank 2006c.

140 CHALLENGES OF AFRICAN GROWTH
(Aryeetey and Udry 2000). This observation necessitates looking sepa-
rately at the individual components of savings, because the behavior in the
two sectors, that is, public and private, is likely to be determined by differ-
ent sets of factors. This kind of decomposition may also provide better
insights into which of the sectors is a major contributor to a nation’s sav-
ings, as well as give a better indication of where efforts should be directed.
We benchmark the performance of Sub-Saharan Africa with respect to
these components against the performance of other developing regions.
Figure 4.16 shows that Africa’s performance in both public and private
FIGURE 4.16Savings Decomposition
1980
1985
1990
1995
2000
2005
15 20 25
a. Private saving: Africa versus rest of developing world
percent of GDP
percent of GDP
b. Public saving: Africa versus rest of developing world
1980
1985
1990
1995
2000
2005
year
year
�10 �8 �6 �4 �2
SSA global averagerest of developing world
Source: World Bank 2006c.

CONSTRAINTS TO GROWTH 141
savings falls below that of other developing regions. Africa’s averages in all
time periods are below the averages for the developing world. Conversely,
the averages for the rest of the developing world are in almost all cases
above the global average. However, it is also clear from the figures that
Africa’s performance is even worse in terms of public savings.
In the end, there are many reasons for low measured savings rates.
These include low per capita incomes, low deposit rates that reduce incen-
tives to save at financial institutions, and institutional impediments such as
the distance to formal financial institutions. Moreover, in rural areas, sub-
stantial amounts of savings may be in the form of physical capital—
livestock, trees, and land improvement. A case in point is provided by
Aryeetey and Udry (1998) in their study of savings in Ghana. According to
the national accounts, gross domestic savings were 8 percent of GDP, but a
household survey of Ghanaian farmers done a year later found that the
median household saved over 30 percent of its income. The nonmonetiza-
tion of savings can be attributed to the complexity, or lack thereof, of eco-
nomic activity. Specifically, where markets are shallow and fragmented
and small-scale production activities are dominant, then household port-
folios will tend to comprise a higher proportion of physical assets. Finally,
the poor have developed their own informal savings and credit institutions
that overcome, in part, the obstacles presented by failures of the formal
system. What are needed are mechanisms to link these informal institu-
tions to the formal financial sector, thus deepening the resources available
for intermediation.
Conclusions
We have presented in this chapter a number of constraints that need to be
addressed in order to reinvigorate economic growth in Sub-Saharan Africa.
We have characterized them as constraints that are difficult to address but
that can be ameliorated, and constraints that are more amenable to being
addressed. The former group includes geographic disadvantages, high pop-
ulation growth, and low levels of human development. The second group
includes institutional, political, and policy failures, which decrease the
return to private investment—high transaction costs, high levels of risk,
and weak institutions. The final chapter presents a growth strategy for
Africa that is largely centered on dealing with both sets of constraints.
142 CHALLENGES OF AFRICAN GROWTH
Notes
1. We include Sudan and Democratic Republic of Congo in this group, given thehigh concentration of their population in remote areas.
2. Most studies indicate that the impacts of expanded secondary education onfertility are much greater than the impact of expanded primary school enroll-ment.
3. Prior to this year, estimates of HIV prevalence were largely drawn from testingpregnant women at antenatal clinics and extrapolating to the population atlarge. However by the end of 2005, national population-based surveys wereavailable for 20 countries, 19 of which were in Sub-Saharan Africa. These newsurveys indicated that, except for Uganda, levels of prevalence were generallylower than the antenatal clinic surveys. For example, antenatal prevalence in2003-04 in Botswana was 38.5 percent, whereas the national survey showeda prevalence rate of 24.0 percent; similarly, in Ethiopia the prevalence rateshave been adjusted downward from 8.5 percent to less than 3.5 percent.
4. The data in this section come from UNAIDS (2006). 5. We have included South Africa in the middle-income group, which is certain
to skew the average as South Africa is definitely an outlier with a much moredeveloped financial system.
6. We define access as “ensuring provision of financial services that entail appro-priate products, reasonable cost and physical proximity.”
7. There are some commendable efforts devoted to filling this gap and some indi-cators are becoming available. See, for example, Beck, Demirguc-Kunt, andPeria (2005), and FinScope (2005).
8. These rates exclude declines for countries that were in conflict, such as SãoTomé and Principe and Rwanda, which suffered declines in excess of 25 per-cent.
Africa is on the move and appears to be perched on the cusp of breaking out
of the long economic stagnation of the 1970s and 1980s. The past 10 years
have seen renewed growth and improved governance across a number of
African states, setting the stage for taking advantage of opportunities that
are emerging from a rapidly changing world economy. The average growth
rate in African countries for 2005 is about 4.3 percent, with 17 countries
growing at 5 percent, and 9 growing at approximately 7 percent or more.
As reported in Doing Business in 2006 (World Bank 2005c), Africa has moved
from last to third among regions on the pace of reforms, ahead of the Mid-
dle East and Latin America. Africans at the grassroots level are hopeful and
are striving to do better for themselves. A recent Gallup poll shows that
Africans are more optimistic about their future than people in many other
developing regions. Following a wave of democratization in the region
since the early 1990s, there are now 31 young democracies in the region,
representing more than two-thirds of the countries. Apart from serving as a
platform for good governance, this change presents a real opportunity for
switching to peaceful regimes via elections instead of the coups that domi-
nated the transfer of power in the 1970s and 1980s, often punctuating the
development process. The number of countries in conflict likewise has
come down sharply, from 15 in early 2000 to 5 currently.
The global economy continues to grow quickly, driven by a phenome-
nal expansion in trade and investment. The rapid expansion of China’s and
CHAPTER 5
Tackling the Challenges of African Growth
143

144 CHALLENGES OF AFRICAN GROWTH
India’s economies has more recently anchored this growth and has helped
raise the prices of primary commodities, particularly basic metals, revers-
ing the downward trend for some of the key commodity prices that a sig-
nificant number of countries depend on, such as copper for Zambia.
Perhaps more significant is the advent and dominance of the new
information-based technologies as the main driver of productivity growth.
This technology is much cheaper to imitate than older mechanical tech-
nologies, and it is based on two nondepletable resources—silicon and brain
power.
This chapter draws from the analysis of the first four chapters to lay out
the strategic elements for scaling up and sustaining African growth in the
medium term. It goes beyond the focus on correcting policy failures—an
approach dominant in the 1990s—to identifying growth opportunities and
binding constraints to exploit these opportunities—and it offers ideas for
prioritizing areas for action by African countries and regional authorities.
Given the diverse opportunities and constraints each country faces, as well
as the specificity of each country’s history, growth strategies have first and
foremost to be country specific. Therefore the aim here is to offer a menu
of strategic options and ideas that draw, from the global and country-
specific experiences, lessons for country strategies and cross-cutting
regional initiatives.
The rest of this chapter is organized as follows. The next section draws
key lessons from the preceding analysis of a half-century of the African
growth experience, as well as that of other developing regions, to inform
growth strategies in Sub-Saharan Africa. The following section then docu-
ments the revival of growth that got under way in the mid-1990s and
identifies opportunities from the changing global economy. The underly-
ing influential factors behind the recent revival of African growth provide
a foundation on which to build the next stages of the region’s growth strat-
egy. We emphasize that Africa now faces a window of opportunity, with a
growing number of politically stable countries facing the prospect of mutu-
ally reinforcing declines in fertility rates and increases in capital formation
and growth.
The strategic agenda builds upon this platform and rests on five pillars,
which primarily target resolution of the constraints discussed in chapter 4,
and integrates the lessons just discussed. The focus is on a medium-term
strategy that hinges on taking action in four areas (characterized as the
four I’s): steps to improve the investment climate, a big push toward closing

TACKLING THE CHALLENGES OF AFRICAN GROWTH 145
the infrastructure gap with other regions of the world, a greater focus on
innovation as the primary motor for productivity growth and enhanced
competitiveness, and institutional and human capacity. These areas were
identified using the analysis of what matters most for growth and based on
country-specific, cross-country, and microanalysis done in chapter 3.
Finally, we offer a few suggestions on how to finance such a strategic
approach, mainly emphasizing domestic resource mobilization.
Lessons from a Half-Century of Africa’s Growth Experience
We draw six key lessons from the previous analysis to inform the growth
strategies in Sub-Saharan Africa. First, African countries’ growth experi-
ence is extremely varied and episodic. However, from a regional strategic
perspective, addressing two challenges peculiar to the region is the key to
success: the slow growth of large countries and the extreme instability of
growth across a large number of African countries. Countries with large
populations, such as the Sudan, the Democratic Republic of Congo, Nige-
ria, and Ethiopia, will have to grow more rapidly and on a more sustained
basis in order to improve the livelihoods of a “typical” African and to gen-
erate regional traction through positive spillover effects, similar to the
experiences in Southern Africa and East Asia. Nigeria and Ethiopia appear
to be on track and need to sustain recent gains in reviving growth. The
region’s stake is particularly high in reviving growth in the postconflict
economies of Sudan, Côte d’Ivoire, and the Democratic Republic of Congo.
Another cross-cutting challenge for the region is how to best manage
responses to shocks, particularly in the resource-rich countries, where
their fortunes are closely tied to the fortunes of key minerals in the world
market.
Second, while lower levels of investment are important for explaining
Africa’s slower growth, it is the slower productivity growth that more
sharply distinguishes African growth performance from the rest of the
world. Investment in Africa yields less than half the return, measured in
growth terms, found in other developing regions. This situation clearly
calls for looking beyond the creation of conditions for attracting new
investors to more explicitly pursuing measures that help to raise produc-
tivity of existing and new investments. These include reducing transaction
costs for private enterprise, particularly indirect costs; supporting innova-

146 CHALLENGES OF AFRICAN GROWTH
tion to take advantage of new technological opportunities; and improving
skills and institutional capacity to support productivity growth and com-
petitiveness. African countries and populations are still highly dependent
on agriculture for food, exports, and income earning more broadly. Pro-
ductivity in this sector lags far behind the phenomenal progress made in
Asia and Latin America and should be a key target for raising overall pro-
ductivity of African economies.
Third, consistent with much of the cross-country growth analysis, evi-
dence from the research reviewed earlier suggests that policy and gover-
nance matter a great deal for growth. Taking a half-century of African
growth experience as a whole and controlling for differences in the com-
position of opportunities, the impacts of poor policy have been shown to
typically account for between one-quarter and one-half of the difference
in predicted growth between African and non-African developing coun-
tries (Collier and O’Connell 2006). However, the evidence also suggests
that the importance of policy in explaining the growth differential between
African countries and others may have waned since the 1990s as a result
of major reforms implemented in the region, which have moved policy
performance in African countries much closer to the global average. Thus,
while it is imperative for countries to identify and address other binding
constraints, sustaining these gains in the improvement of the policy envi-
ronment will have to be a permanent feature of any growth strategy a
country adopts. More specifically, it means maintaining durable macroeco-
nomic stability and continued propping up of efficient market functioning.
Fourth, the evidence also suggests that overcoming disadvantages aris-
ing from geographic isolation and fragmentation, as well as from natural
resource dependence, will be necessary if Africa is to close the growth gap
with other regions. Estimates referred to earlier show that taking actions to
compensate for these disadvantages may facilitate closing up to one-third
of the growth gap with other developing countries (Collier and O’Connell
2006). With much higher proportions of countries and populations in
Africa being landlocked and resource rich, it is necessary to compensate for
these disadvantages, primarily by closing the infrastructure gap and better
managing and using resource rents.
Fifth, the results from the foregoing empirical analysis, and indeed from
a large body of other studies, suggest a very powerful influence from the
growth of trading partners’ economies. The key transmission mechanisms
are trade and capital flows, requiring greater openness, strengthening of

TACKLING THE CHALLENGES OF AFRICAN GROWTH 147
capabilities for taking advantage of the rapid growth in the global markets,
and improvement of the investment climate to make African countries
better destinations for global capital than in the past. On the side of trade,
evidence shows that integration with global markets is associated with
higher growth,1 underpinning the need for growth strategies to emphasize
scaling up and diversifying exports. Enhanced competitiveness and
reduced barriers to trade are the two critical areas of action. It is important
to note that, while concerns with border trade policies and facilities are still
crucial (for example, port capacity and efficiency), increasingly, constraints
such as infrastructure, standards, and access to information have become
much more binding. There is growing evidence that high trade-transaction
costs can be an important factor in harming export competitiveness and
ability of countries to attract foreign direct investment (FDI) (for example,
results of Integrated Framework studies in Madagascar and Cambodia). A
core part of any growth strategy, therefore, will need to target reducing the
costs of transacting trade—particularly reducing supply chain costs—as
well as the cost of trade processes (Braga 2006).
Finally, our analysis points to a very large role played by the delayed
demographic transition in Africa in explaining its relatively slower growth
performance. In all the empirical estimates discussed in chapter 3, differ-
ences in the demographic variables consistently predict two-thirds of the
observed difference between average growth in Sub-Saharan Africa and
other developing regions. Two types of consequences from this delayed
transition are particularly important. The first and probably the biggest
challenge is the uncharacteristically high level of age dependency, with its
implications on fiscal and household/parental pressure for taking care of
the overwhelming number of the young (and, indeed, achievement of the
Millennium Development Goals [MDGs]). The second relates to the rapid
growth of the labor force, potentially a positive driver of growth but also
possibly a negative force if employment opportunities do not keep pace.
The latter concern relates to the growing potential instability from rapidly
rising youth unemployment. It is possible to turn this potential risk into an
opportunity, since the youth are likely to be the drivers of innovation in
the region with appropriate human capital and technological investment.
In any case, they now constitute a large portion of the Africans in the dias-
pora as they migrate in search of opportunities. Thus, while the strategy
needs to address the fundamentals of the slow transition, such as how to
speed up reduction in fertility, appropriate actions are also needed to

148 CHALLENGES OF AFRICAN GROWTH
increase employability of youth and expand opportunities to engage in a
growing private sector at home.
Changing Contexts and Emerging Opportunities
Over the 10-year period since 1995, Sub-Saharan Africa has seen both a
revival and far greater stability of growth in several countries. Twelve
countries have had annual gross domestic product (GDP) growth in excess
of 5 percent,2 up from only five countries during the previous decade
(1985–94). Excluding the oil-producing countries (which account for
29 percent of the region’s population), income per capita in the fastest-
growing one-third of African non-oil-producing countries grew at a
median rate of 3.5 percent, twice the pace of the bottom one-third. These
countries, together, account for 35 percent of Sub-Saharan Africa’s popu-
lation. By 2005, nine countries were near or above the 7 percent growth
rate threshold needed for sustained poverty reduction.3
What is also striking in this recent experience is the sharp decline in the
number of countries that on average posted negative growth rates during the
period, down to four from about a dozen African countries during the first
half of the 1990s. Many of the fast-growing countries have accomplished this
for sustained periods. Any fluctuations appear to have much smaller ampli-
tudes, and bad years still register respectable growth rates. Diversification of
the economy and exports has been the main source of this greater stability.
Some of the fastest-growing countries have also done relatively well in terms
of poverty reduction, as demonstrated by a group of seven low-income
African countries,4 which succeeded in reducing poverty at an annual rate of
1.5 percentage points over the past decade (World Bank 2005e).
Sub-Saharan Africa’s recent improved economic performance reflects
some important underlying changes that are taking place across the conti-
nent. Policies and institutions are improving, peace and security is return-
ing to the region, and African governments are increasingly taking control
of their own economic destinies. Higher levels of political participation and
competition also give Africans a greater stake in their own future. Perhaps
the most significant change is that since 1983, African demography appears
to have taken a turn toward a transition that will reduce pressures on fis-
cal resources, encourage savings, and support productivity growth. We
elaborate on each of these areas of progress in turn.

TACKLING THE CHALLENGES OF AFRICAN GROWTH 149
A significant and durable improvement in the policy and institutional
environment has been observed across a growing number of countries in
the past 10 years. During that time, a large number of reforming African
countries have succeeded in reestablishing sustained macroeconomic sta-
bility, more open and liberal markets, and better conditions for private sec-
tor involvement in the economy. The following are the prime indicators of
this progress. Unweighted consumer price inflation persistently and
sharply fell within a decade, from 27 percent in 1995, to about 6 percent
by 2004. In a median African country, government spending as a propor-
tion of GDP also fell sharply in the past decade, as it has in other develop-
ing countries in the world, and the average fiscal deficit was halved to
2 percent of GDP by 2000. Except in a few countries, black market
exchange rate premiums now average just 4 percent. Through unilateral
trade reforms, African countries have also compressed tariff rates; the aver-
age rate is currently 15 percent. And as mentioned previously in the Doing
Business in 2006 report (World Bank 2005c), Africa has moved from last to
third among regions on the pace of reforms in improving business envi-
ronments, ahead of the Middle East and Latin America. Two countries are
in the world’s top 10 reformers (Tanzania and Ghana) and two-thirds of
African countries made at least one pro-business reform, up by 25 percent
from 2005. In these respects, the continent now more resembles other
developing regions, where reforms have been pursued in earnest for pro-
longed periods.
Peace and security are spreading in the region after decades of conflicts.
As we saw earlier, since the mid-1990s there has been a sharp decline in
the proportion of countries involved with civil conflict in the region, with
the number of countries in conflict falling particularly sharply since 2000,
from 15 to 5 currently. The proportion of the African population living
with civil conflict has fallen even more sharply, dipping below the average
of other developing regions at the turn of the 21st century, reflecting the
end of conflict in countries with large populations, such as Ethiopia,
Sudan, and the Democratic Republic of Congo. Southern Africa is now a
region of stability after the end of conflicts in Mozambique, Namibia, Zim-
babwe, and Angola, as well as the resolution of tension between South
Africa and its neighbors. West Africa likewise has seen the end of conflicts
in Guinea Bissau, Senegal, Chad, Sierra Leone, and, most recently, Liberia,
although the emergence of conflict in Côte d’Ivoire in that part of the
region is a major setback, considering in particular the economic spillover

150 CHALLENGES OF AFRICAN GROWTH
impacts for neighboring countries whose economies were and are still
closely linked to Côte d’Ivoire’s economy. In Central Africa, recent resolu-
tions of conflicts in Burundi and the Democratic Republic of Congo have
taken place, and if peace holds, together with Rwanda the opportunities
for progress in the Great Lakes will substantially improve. The end of con-
flict in southern Sudan considerably expands the possibility of benefiting
from the peace dividend in Eastern Africa and the Horn of Africa.
Increased political participation gives Africans a greater stake in their
own future, laying a stronger foundation for domestic accountability and
restraint against policy syndromes.
A central theme of the recent African political reforms is the restoration
of institutional constraints on the power of African political elites. A wave
of democratization swept through the continent between 1989 and 1994,
which fostered a much faster improvement in the political and participa-
tory processes (Bates 2006). There are currently 31 mostly young democ-
racies in Africa. Figure 5.1 shows, for Sub-Saharan Africa and for four
other developing regions combined, the percentage of countries in each
year that had chief executives selected by competitive, multiparty elec-
tions. In 1982, only one-tenth of African countries and two-tenths of other
developing countries had competitively elected executives (Ndulu and
O’Connell 2006b). As late as 1991, Africa showed virtually no improve-
ment, while other developing countries had doubled their figure to 40 per-
cent. By 1995, however, the gap was nearly closed, despite continuing
increases in other regions. In 2002, Africa was ahead of the other regions
by about 8 percentage points. Notwithstanding the early challenges from
democratization, the political democratization drive in Africa has created
space for peaceful regime changes, deeper debates about societal develop-
ment visions, and greater respect for human rights. Although there has
been some speculation that the initial wave of democratization was associ-
ated with a sharp rise in civil conflict in the region, this situation appears
to have reversed itself, as democratic practices are taking hold in most
countries.
There is now a significant revival of interest in regional integration ini-
tiatives in Africa, with a change in focus from preoccupation with prefer-
ential trade arrangements to an approach that emphasizes market
integration and promotion of the region as an attractive investment desti-
nation for foreign and African capital. The African Union and New Part-
nership for Africa’s Development (NEPAD) have embraced the latter two

TACKLING THE CHALLENGES OF AFRICAN GROWTH 151
objectives and are developing plans for pursuing these by promoting a crit-
ical mass of countries with a policy environment friendly to capital accu-
mulation and private business (under the African Peer Review
mechanism); improving cross-country infrastructure links; reducing the
level of risks, particularly associated with conflicts, which scare away cap-
ital (own and foreign); more vigorously employing risk-mitigating instru-
ments, particularly for transnational projects; coordinating management
of pandemics such as HIV/AIDS and malaria and protecting regional com-
mons such as the Nile River Basin and the Great Lakes; and strengthening
as well as helping to retain the pool of human skills in the region.
The Changing International Economic Environment—New Opportunities and New Challenges
The past 20 years have seen enormous changes in the international econ-
omy. Of particular note has been the rapid rate of growth of international
trade, which has risen by an average rate of 5.8 percent a year. This means
that between 1950 and 2000, world trade increased 17-fold. This growth
in trade has been associated with high rates of growth in countries that
FIGURE 5.1Share of Countries with Competitively Elected Chief Executives
0.0
0.1
0.2
0.3
0.4
0.5
0.6
0.7
1982 1987 1992 1997 2002
Africa all other developing countriesyear
ratio
Source: World Bank 2005a, 18.
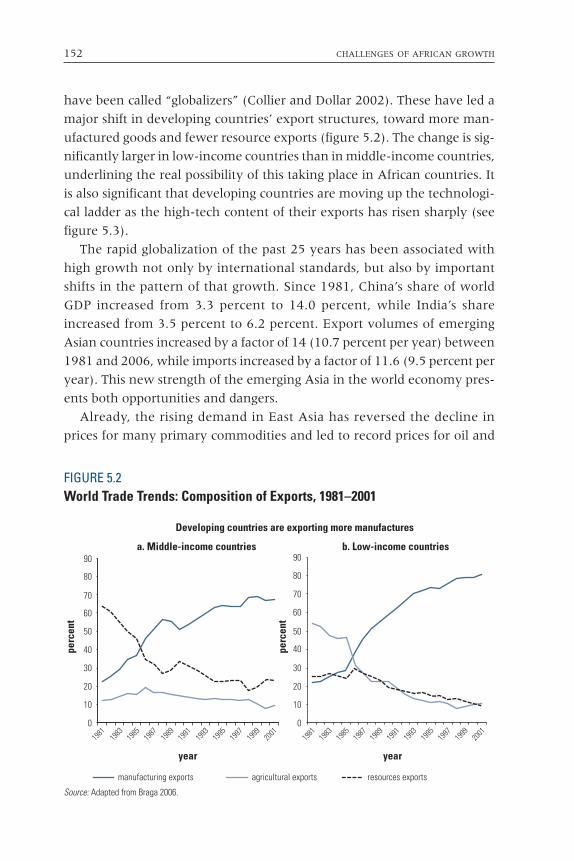
152 CHALLENGES OF AFRICAN GROWTH
have been called “globalizers” (Collier and Dollar 2002). These have led a
major shift in developing countries’ export structures, toward more man-
ufactured goods and fewer resource exports (figure 5.2). The change is sig-
nificantly larger in low-income countries than in middle-income countries,
underlining the real possibility of this taking place in African countries. It
is also significant that developing countries are moving up the technologi-
cal ladder as the high-tech content of their exports has risen sharply (see
figure 5.3).
The rapid globalization of the past 25 years has been associated with
high growth not only by international standards, but also by important
shifts in the pattern of that growth. Since 1981, China’s share of world
GDP increased from 3.3 percent to 14.0 percent, while India’s share
increased from 3.5 percent to 6.2 percent. Export volumes of emerging
Asian countries increased by a factor of 14 (10.7 percent per year) between
1981 and 2006, while imports increased by a factor of 11.6 (9.5 percent per
year). This new strength of the emerging Asia in the world economy pres-
ents both opportunities and dangers.
Already, the rising demand in East Asia has reversed the decline in
prices for many primary commodities and led to record prices for oil and
FIGURE 5.2World Trade Trends: Composition of Exports, 1981–2001
0
10
20
30
40
50
60
70
80
90
1981
1983
1985
1987
1989
1991
1993
1995
1997
1999
2001
a. Middle-income countries
perc
ent
perc
ent
Developing countries are exporting more manufactures
b. Low-income countries
year year
0
10
20
30
40
50
60
70
80
90
1981
1983
1985
1987
1989
1991
1993
1995
1997
1999
2001
manufacturing exports agricultural exports resources exports
Source: Adapted from Braga 2006.

TACKLING THE CHALLENGES OF AFRICAN GROWTH 153
copper, as just two examples. Asian investment in Africa is growing rap-
idly and represents an important diversification FDI sources to Africa. The
rising wages in East Asia could, in the future, make certain labor-inten-
sive manufactured goods more costly to produce, and thereby expand the
potential market for manufactured goods from Africa. However, China
and India have taken advantage of the end of the Multifiber Agreement,
with exports of textiles and clothing increasing by 46.3 percent and 22.2
percent, respectively, in 2005, while exports from Sub-Saharan Africa
declined. African countries must find ways to take advantage of their low
wages to compete effectively with China and India in the global market,
including in South-South trade.
One of the hallmarks of global economic activity in the 21st century is
the importance of information. This is exemplified by the increased impor-
tance of trade in services and of outsourcing of simple services such as
accounting, bookkeeping, and telephone ordering, as well as more complex
services, such as radiology and software production. But information is not
only embedded in services, it is also embedded in products and processes.
Floriculture is a good example. The development of flower exports from
Africa has depended on creating new supply chains, identifying new end
FIGURE 5.3Developing Countries’ Share of Exports, 1981–2001
Developing countries are moving up the technology ladder
0
10
20
30
40
50
60
70
80
90
100
0
10
20
30
40
50
60
70
80
90
100
1981 2001
resource-based
lowtech
mediumtech
hightech
resource-based
lowtech
mediumtech
hightech
b. Middle-income countries
exports exports
a. Low-income countries
perc
ent
perc
ent
Source: Braga 2006.

154 CHALLENGES OF AFRICAN GROWTH
users, and being able to get flowers to Europe overnight. But moving
beyond the production of red roses will require a much more attenuated
knowledge of tastes and market opportunities, nimbleness in the ability to
adjust production to take advantage of new opportunities, and a research
capability that will enable flower growers to produce those specific blooms
that will pay the highest prices.
Information is the one factor of production that is not used up in pro-
duction and the one factor of production that is cheap to acquire. Being
effective at using information requires access to cheap communications
technology, as well as a high level of human capital to manipulate the
information productively. But if, as we have seen, being a latecomer con-
fers advantages on a country, then that advantage is multiplied in an era in
which information is a key factor of production. One needs only to look at
the huge success of mobile phones in Africa to see what is possible. Cheap,
and relatively free from excessive state control, mobile phones have pro-
vided fishermen, farmers, and other small entrepreneurs with cost-
effective information on markets and investment opportunities, increasing
the productivity of capital.
Opportunities and Options for Growth Strategies
The rapid growth of Asian countries and Chile over the past quarter-
century makes it clear that growth constraints are not insurmountable.
The experiences from these countries also present options that various
African countries could pursue, depending on their endowments and start-
ing points.
Manufactured Export-Led Growth
Some African economies can realistically hope to follow the main Asian
model, in which a central component of growth is manufactured exports.
This strategy has the advantages of generating broad-based benefits
because it creates many jobs and enables very rapid growth. One small
African country, Mauritius, has already transformed itself from an impov-
erished sugar island to a middle-income, diversified modern economy
through this strategy. Others, such as Ghana, Kenya, and Madagascar,
could follow. The basic conditions for success include a good coastal loca-

TACKLING THE CHALLENGES OF AFRICAN GROWTH 155
tion, a supportive investment climate, and reduction in the trade transac-
tion costs in order to enhance competitiveness.
Natural Resource–Based Equitable Growth
Some African countries have abundant, valuable natural resources, so their
most likely route to prosperity is through the equitable exploitation of their
resource base. Another small African country, Botswana, has already trans-
formed itself from an impoverished desert country to middle-income status
via this route. Resource-rich coastal countries, such as Nigeria, the Democ-
ratic Republic of Congo, the Republic of Congo, and Cameroon, could also
use these rents judiciously to support diversification of their export bases,
thereby reducing their dependence on volatile resource rents.
Natural Resource–Based Export Diversification
Some countries may be able to follow the emerging Latin American model
of modern agriculture. One possibility for these countries is to diversify
within the primary sector itself (such as agribusiness in Chile, Costa Rica, or
Colombia) or move toward natural resource–based, export-oriented indus-
trialization (as in the case of Indonesia or Malaysia). The latter case would
entail adding value to the exports through processing, or using rents and
revenues from natural resources to finance export-oriented industrializa-
tion. Landlocked countries pursuing this route could focus on high-value,
low-weight products, since they can more effectively absorb the high trade-
transaction costs associated with their location disadvantages.
Labor Export and High-Value Service Sector
Some countries may well be so disadvantaged that prosperity for their
populations will depend upon employment opportunities in more fortu-
nate neighboring economies or, like India, their pursuit of the high-value
service sector—the office economy. Landlocked countries in the Sahel, and
Southern African countries, have a long tradition of intercountry migra-
tion (for example, Swaziland and Lesotho vis-à-vis South Africa, or Burk-
ina Faso vis-à-vis Côte d’Ivoire), and it is likely to be a feature of a
prosperous future. Investment in human capital would also be supportive
of building such high-value service sectors.

156 CHALLENGES OF AFRICAN GROWTH
Key Strategic Challenges
The diversity of country endowments and history demands that country
strategies be specific to their circumstances. However, there are four areas
of action that are common to the majority of African countries. These
underpin the ability of countries to integrate into the global economy,
mobilize resources that can be invested, and raise the productivity of phys-
ical and human capital engaged in the growth process. They are a package
of what we refer to as the four I’s—investment climate, infrastructure,
innovation, and institutional capacity.
Investment Climate: Reducing the Cost of Doing Business
In chapter 3, we identified the main challenges for improving investment
climate to be the following: reducing indirect costs to firms, mainly related
to the costs of infrastructure services, with energy and transport topping
the list; and reducing and mitigating risk, particularly affecting security of
property related to contractual effectiveness, crime, political instability,
and corruption. These measures should be complemented at the regional
level by developing subregional cohesive investment areas through meas-
ures that promote collective good reputation (peer pressure), policy coor-
dination, and coordinated infrastructure investment to enhance
connectivity. A separate paper, prepared for this study (Ramachandran
and Shah 2006), lays out a more detailed strategy. Apart from dealing with
the challenges of the investment climate more generally, it also considers
those challenges more specific to the development of an indigenous
African private sector, partly as a way to strengthen the domestic con-
stituency for private sector development.
As we saw previously, African countries are generally at the high end in
terms of the costs of doing business (World Bank 2006b). Some of these costs
arise from a legacy of distrust of the private sector, some from excessive and
inefficient bureaucracy, and some from corruption. These causes are linked.
Distrust leads to more regulation, inefficiency increases the cost of this regu-
lation, and corruption arises from the power given officials to regulate. But
deregulation, given some of the political-economy realities discussed below,
is difficult and requires clear and dedicated political leadership.
One promising example of reform within Africa is Senegal, which has
significantly lowered its costs of doing business relative to other countries

TACKLING THE CHALLENGES OF AFRICAN GROWTH 157
in the region. The investment climate data clearly reveal a lower set of
costs in this country as opposed to the others surveyed in Africa. The Sene-
galese case needs to be explored in much further detail, with a focus on
understanding the political incentives for reform and the process of imple-
mentation. The Doing Business in 2007 (2006b) report from the World Bank
highlights 10 countries in Africa that have reformed select business indica-
tors, such as the time to register a business (World Bank 2006b); again, it
would be useful to understand the political dynamic behind these efforts.
But beyond deregulation is the need to actively develop institutions,
both public and private, that will encourage private sector activity. The list
is quite long: grades and standards agencies, particularly for exports; regu-
latory agencies for monopolies and quasi-monopolies; public research
institutions to promote new technology development and application;
export processing zones; business schools; and a plethora of new or more
effective financial institutions such as capital leasing companies and export
credit lines, a more competitive banking system, mortgage companies,
stock markets, and venture capital firms. Some of these issues are taken up
later under sections that deal with infrastructure, institutional capacity,
and innovation.
Leadership is the key ingredient. President Park Chung Hee of the
Republic of Korea became so certain that Korea’s national security lay in
economic growth and that growth depended on export promotion and
diversification, that he set weekly export targets for large exporters and
met with them each week to determine whether they were meeting their
targets. When they failed, he stimulated their ardor, using a number of car-
rots and sticks that he controlled. This is not a model that translates easily
to Africa, nor should it. What is important, however, is Park’s single-
mindedness and his focus on growth.
Leadership can come from many different quarters, necessitating a
broad engagement of interested parties and actors. Examples from the
Ugandan experience are instructive. Justice James Ogoola has champi-
oned a highly effective commercial court structure in Uganda, which relies
on pushing routine disputes into mediation and getting settlements in a
matter of days, rather than months or years. Similarly, Dr. William Kalema
returned from a prestigious career in the United States to dedicate himself
to building the private sector in Uganda. Individual entrepreneurs have
often played a role in shaping their country’s policies and in changing atti-
tudes toward entrepreneurial activity.
158 CHALLENGES OF AFRICAN GROWTH
The government’s role in improving the investment climate is pivotal
and we want to highlight here this particular dimension of the challenge.
The Washington Consensus focused on reforming government by, among
other things, privatizing state enterprises, liberalizing foreign exchange
markets, bringing government accounts into balance, liberalizing trade,
and reducing government controls over other markets. What is clear in
hindsight, particularly in contrast to the experiences in Asia, is the lack of
emphasis on the important enabling role the government can and must
play in encouraging private investment. Given the African experience of
weak public institutions, developing a strong positive role of government
that will reduce market failures and avoid government failures will be a
difficult, but necessary, task in most countries.
Infrastructure: A Big Push Necessary to Make a Difference
Analyses of investment climate surveys clearly show that investments in
infrastructure are bound to benefit all firms, large and small, minority and
indigenous. It is also very clear from available evidence that good-quality
roads and a steady, reliable supply of electricity are in very short supply in
many African countries (see chapter 3). A separate flagship study on infra-
structure is under way, which will drill down through the detailed ele-
ments of the strategy. We will restrict ourselves here to the broader
elements of the required strategic interventions, particularly with respect
to supporting growth.
Overcoming neglect. The sheer magnitude of the problem and long-term neg-
lect of infrastructure in many African countries demand a big-push solu-
tion. During the 1990s, African governments and development partners
sharply reduced the share of resources allocated to infrastructure in favor of
scaling up spending in social sectors. Several reasons were behind this shift.
One was the specter of the “white elephants” of public infrastructure proj-
ects that suffered particularly from inadequate provision for recurrent costs,
unrealistic pricing, and a wide range of regulatory forbearance. Second, the
1990s and the early 2000s saw an expansion of divestiture programs and
increased participation of the private sector in infrastructure, particularly in
telecommunications, water, and power. Finally, the deliberations of the
Copenhagen Social Summit in 1995 provided a powerful platform for a
shift in the structure of spending toward social sectors. In connection with

TACKLING THE CHALLENGES OF AFRICAN GROWTH 159
that, several African governments made commitments to achieve the Inter-
national Development Targets (IDT), primarily limited to social well-being,
and the structure of official development finance was commensurately
aligned to meet those targets (Ndulu 2006b, 10).
Two decades of neglect currently manifests itself in the form of huge
infrastructure gaps relative to needs in the region and compared with other
developing regions. It is estimated that Sub-Saharan African countries
need $18 billion a year in infrastructure financing in order to achieve the
much higher 7 percent economic growth target needed to halve extreme
poverty in the region by 2015; and to achieve the MDGs, Sub-Saharan
Africa would need another $18 billion a year (Wormser 2004).
It has also become clear that for the foreseeable future, the drive to fill
the investment gap will have to be led by the public sector—either directly
funding the buildup of infrastructure assets or underwriting risk to crowd
in private investment. The past decade has seen a sharp drop in private
investment in this area as investors have become more risk averse. It has
also become clear that public-private partnerships in infrastructure are
more effective than when either of the two parties goes it alone. This is
particularly the case for the transportation, energy, and water subsectors.
The response to these gaps should be pursued in three areas: scaling up
financing of infrastructure, reorganizing the way the sector is managed for
greater effectiveness, and exploiting the scale and coordination of regional
approaches to infrastructure investment and management of services.
Financing. African countries can absorb more financing for infrastructure and
gainfully make use of it. The rates of return to infrastructure projects appear
to have improved quite substantially with increased private sector participa-
tion and improvement in the financing of recurrent costs. Recent analysis of
World Bank infrastructure projects’ economic rates of return (ERR), for
example, not only show high rates of ERR, averaging 35 percent between
FY 1999 and FY 2003, but also show that these rates are a considerable improve-
ment over the 20 percent average ERR for the preceding 40 years (Briceno,
Estache, and Shafik 2004). Furthermore, with the participation of the private
sector in infrastructure investment and service delivery, capacity constraints
have been significantly relieved. The main challenges relate to availability of
financing and efforts by African governments to reduce investor risks.
Financing needs for improving access to quality infrastructure services
in Africa are huge. Fay and Yepes (2003) estimated the financing require-
160 CHALLENGES OF AFRICAN GROWTH
ments for meeting projected worldwide demand for infrastructure services
between 2000 and 2010. Using country-specific growth projections (from
Global Prospects Data, World Bank), they derive the needs for infrastruc-
ture services for production and consumption. The infrastructure invest-
ment and maintenance requirements are then estimated given the stock of
assets in 2000. Given these estimates, to meet the needs for ensuring qual-
ity infrastructure services, Sub-Saharan African countries would on aver-
age need to spend 5.6 percent of their GDP in the next five years to meet
their demands for quality infrastructure services (excluding electricity
transmission and distribution).
The public sector has to play a much larger role in financing infrastruc-
ture than envisaged in the past two decades. Despite the changes that have
taken place since the 1990s, the domestic public sector remains the most
dominant source of financing for infrastructure in the developing world,
accounting for 70 percent of current infrastructure spending. The private
sector and official development assistance (ODA) account for 20 to 25 per-
cent and 5 to 10 percent, respectively, for the developing world as a whole
(Briceno, Estache, and Shaflik 2004). The private sector is, in fact, a much
smaller contributor for Africa. Between 1990 and 2002, private commit-
ments for infrastructure in Sub-Saharan Africa totaled $27.8 billion, com-
pared to $804.9 billion for the developing world as a whole. Nearly
two-thirds of this amount ($18.5 billion) was for telecommunications.
And as African countries were gearing up to attract private participation,
many sponsors were pulling out of developing countries, driven by pres-
sure from shareholders to exit uncertain markets and reduce risk (Estache
2004). Inclusive of a risk premium, the cost of capital (and indeed the hur-
dle rate of return) in this sector is quite high and may shoot past the point
where most new infrastructure projects could generate adequate private
returns. The risk premium is exacerbated by the significant currency mis-
match that exists in many infrastructure transactions, where revenue
streams denominated in local currency do not match foreign currency debt
service obligations (Ndulu 2006b, 14).
More recent data now show some reversal of the decline in the infra-
structure investment flows. Private investment has doubled from $3 bil-
lion in 2002 to $6 billion (World Bank, PPI data).5 ODA flows likewise
appear to be on the rise, for example, increasing from $3 billion in 2003 to
$4 billion in 2004. Nontraditional donors, particularly China, are increas-
ingly and rapidly expanding their involvement in the region, with tenta-

TACKLING THE CHALLENGES OF AFRICAN GROWTH 161
tive estimates of around $2 billion in flows to African countries in 2004
and 2005 (Honohan and Beck 2006).
Innovative financing arrangements and instruments are emerging and
should be encouraged. One such arrangement involves ODA being used to
leverage private sector finance by underwriting risk in public-private part-
nerships in infrastructure investment and service provision. An example
here is the South Africa Regional Gas Project, which has mobilized about
$1 billion in private sector investment—equivalent to one-third of Africa’s
total private sector investment in infrastructure in 2002—by combining a
World Bank partial risk guarantee and Multilateral Investment Guarantee
Agency political risk guarantees with International Finance Corporation
(IFC) equity (World Bank 2003a).
Regionwide infrastructure funds are another new instrument that can
be expanded considerably to scale up funding of infrastructure projects.
Three of these are already in existence. The oldest among these is the
Southern Africa Infrastructure Fund, sponsored by the African Develop-
ment Bank, Standard Investment Corporation, and South African insti-
tutional investors, with a commitment of $130 million in infrastructure
projects in Southern Africa. The second is the AIG African Infrastructure
Fund, sponsored by the U.S.-based AIG insurance company and IFC,
with a goal of funding infrastructure projects in reforming African coun-
tries in the form of equity, quasi-equity, or convertible debt, with rates of
return ranging from 25 percent to 35 percent, net of local taxes. This
fund has targeted $500 million and had already committed $400 million
by 1999. The third is the $350 million New Africa Infrastructure Fund,
sponsored by the Overseas Private Investment Corporation, with private
management, targeting infrastructure projects in Sub-Saharan Africa
countries.
Increase in the productivity of existing infrastructure and new investments. Obvi-
ously, the most cost-effective way of increasing infrastructure services and
productivity is to improve the productivity of investments already in place.
Moreover, most of the steps necessary to do so are also important for
increasing or maintaining the productivity of new investments. The key
strategic areas are improving maintenance capacity; improving data, mon-
itoring systems, and accountability; providing financing mechanisms for
maintenance and rehabilitation; improving management in the various
infrastructure subsectors; and strengthening regulatory systems. This
162 CHALLENGES OF AFRICAN GROWTH
agenda is absolutely essential if infrastructure investments are to have
consistently high rates of return.
This is not the place to go into detail as to how to ensure that the requi-
site software is in place, but it would be useful to make several observa-
tions. First, data gaps are so large that they impede effective monitoring of
performance. We know less about access, efficiency, and equity in infra-
structure investment worldwide—much less in Africa—than we do about
virtually any other key sector (Estache 2006). As a consequence, account-
ability in infrastructure is weaker locally, nationally, and globally than
other development sectors. Thus, it is incumbent upon all actors to upgrade
their performance in this area.
Second, improved regulation is critical, not only of private sector
monopolies such as power systems, but also of public sector infrastructure
such as roads. Regulatory systems in Africa are weak and subject to cor-
ruption. Strengthening of these institutions requires some emphasis on
accountability and transparency.
Key reforms are under way in strengthening maintenance capacity and
regulatory institutions. By 2000, at least 20 Sub-Saharan Africa countries
had established road funds and boards. A primary focus of these agencies
is maintenance of infrastructure and judicious selection of new invest-
ments. Thirty percent of countries in Sub-Saharan Africa now have
autonomous regulatory agencies for the electricity sector, while 75 percent
have regulatory agencies for telecommunications (Estache 2005). The pri-
mary purpose of these is to ensure fair competition and efficiency in serv-
ice provision. Strengthened regulation is a necessary condition for efficient
private participation, to which we will now turn.
Public-private partnerships. One of the major reasons that donors turned away
from investing in infrastructure in the 1990s was a belief that the private sec-
tor would step in and fill the gap. Since many infrastructure investments
could be expected to be profitable in more liberalized environments, donors
could turn to providing truly public goods. Unfortunately, these expectations
were not realized. For Africa, only 41 percent of sample countries have pri-
vate participation in electricity generation, 28 percent in electricity distribu-
tion, and 20 percent in water and sanitation (Estache and Goicoechea 2005).
Private participation has taken many different forms, including asset
sales/privatization, concessions, build-own-operate and build-operate-
transfer schemes, management contracts, and leasing (Estache 2004).

TACKLING THE CHALLENGES OF AFRICAN GROWTH 163
The main brake on private investment in infrastructure is limited prof-
itability. Estache and Pinglo (2004) suggest that returns to capital in low-
income countries have to be at least 2 percent to 3 percent higher than in
richer developing countries, and twice the returns expected in developed
countries. This means that, ceteris paribus, the average tariff required to
generate the minimum required rate of return will have to be higher than
elsewhere. This is a difficult position for governments to take, and the
mechanisms and fiscal resources to subsidize services to make them more
affordable may not be present.
The very factors that raise the costs for private investment in general are
also relevant with respect to private sector investment in infrastructure.
High risks, whether from unstable government policy or other commercial
risks, and high transaction costs raise the cost of doing business. Thus,
while public-private partnerships offer some obvious advantages in
expanding infrastructure services, it is no panacea.
Lorrain (1999) offers the following lessons from the experiences of the
1990s to guide the development of public-private partnerships:
• Pragmatism and ad hoc project organizations adapted to each legal and
economic context have been shown to be superior to the application of
strict a priori models.
• The development of an appropriate institutional framework is vital;
such a framework must evolve from a lengthy institutional learning
(capacity-building) process.
• The public-private partnership constitutes a long-term association. This
association must be able to adapt to unforeseen events.
• The regulatory system must often rely on the involvement of an inde-
pendent body.
• Public-private partnerships are meant to be long lasting and entail a cer-
tain degree of risk between partners; all parties must be tolerant of these
risks as the project evolves.
Although market-oriented reforms of infrastructure in developing
countries have tended to focus primarily on commercially viable services
in urban areas, an increasing number of countries are beginning to exper-
iment with extending the market paradigm to infrastructure services in
rural areas that are often less attractive in commercial terms. One approach

164 CHALLENGES OF AFRICAN GROWTH
combines financing for targeted subsidies to lower the cost of private par-
ticipation, and gradual tariff reform (using a liquidity backstopping instru-
ment). For example, for small power projects in Uganda, explicit subsidies
are provided through grants to make investment more attractive for the
private sector (for example, by subsidizing the electricity connections to
poor households). More generally, Wellenius, Foster, and Malmberg-Calvo
(2004) argue that in these cases, subsidies are used to close the gap
between market requirements and development needs and are increas-
ingly determined and allocated on a competitive basis.
Regional approaches. Given the geographic disadvantages referred to in
chapters 3 and 4, particularly the number of landlocked countries and the
small size of markets, infrastructure investments should be part of a
regional or subregional strategy. The emergence of regional investments in
energy—the West African gas pipeline and the Southern Africa and West
Africa power pools, in particular, are examples of how important it is to
think regionally. Africa’s historic borders have little to do with coherent
economic units. River basins, for example, can involve more than a dozen
countries. Getting all these different interests on the same page is not easy,
but the success thus far of the Nile River Basin shows it is possible.
For landlocked countries, investment in transport links to ports is crit-
ical. This involves not only roads and railroads, but dedicated port facili-
ties and improvement in facilitation at cross-border checkpoints. But
beyond the problems that landlocked countries face is the need to escape
from the traps imposed by small markets. Most African countries have
GDPs of less than $5 billion. While exports offer access to a dynamic
world economy, the importance of being able to trade with one’s neigh-
bors cannot be overstated. Investment in a shoe factory becomes much
more economical when the potential market is not 5 million consumers,
but 30 million.
Infrastructure is one of the key areas of collective regional interest that
NEPAD and a number of subregional integration initiatives have recently
become interested in. The objectives here are partly to foster integration of
African markets through improved connectivity, and partly to facilitate
cross-country investment within Africa. Where improvements in infra-
structure services entail the use of shared natural resources, such as the
Nile Basin and the Great Lakes, African governments have also collectively
sought to protect them as regional commons and to avert potential conflict

TACKLING THE CHALLENGES OF AFRICAN GROWTH 165
in relation to their use (for example, hydroelectric power sharing under
the Nile Basin Initiative).
The high proportion of landlocked countries necessitates cross-border
trade facilitation and coordination in transboundary infrastructure invest-
ment. In other cases, transboundary cooperation in the provision of infra-
structure services could lead to a substantial reduction in costs among
members and could enhance the reliability of services. A good example of
potential here is the West Africa Power Market Development Project
(WAPP), where there is great potential for significant reduction in power
generation costs. Nigeria and Côte d’Ivoire could reduce their oil thermal
generation costs of $.08 to $.10 per kilowatt hour to $.035 to $0.45 per
kilowatt hour.
Two approaches are being pursued for regional infrastructure initiatives:
regional or multicountry projects, and coordination among individual
country projects to maximize the cross-country synergetic effects of infra-
structure projects. Examples of the former include the gas pipeline project
between Mozambique and South Africa, the Nile Basin energy and conser-
vation projects, and the planned West African gas pipeline project. An
example of investment coordination is the Southern Africa Power grid
sharing and the roads program under the East African Community.
Investment guarantees for long-term ventures, and funds to cover
transfer risks, are widely used in other regions to leverage private invest-
ment in non-export-generating activities (for example, power). Credit
guarantees by multilateral development banks, such as the Andean and
the ASEAN Development Banks, are used as catalysts for cofinancing
arrangements for long-term investment. Since the gaps are more severe
for cross-national undertakings, loan guarantees by creditworthy regional
and multilateral development banks can be particularly helpful in financ-
ing public-private infrastructure projects for improving regional connec-
tivity. Furthermore, a Currency Convertibility Fund for cross-national
guarantees would help reduce transfer risks associated with the nonexport
orientation of such ventures.
Innovation to Underpin Productivity Growth
and Competitiveness
African countries can exploit their status as late starters to intermediate
technologies by adapting and applying available technological inventions.

166 CHALLENGES OF AFRICAN GROWTH
Like a big book in the sky, technological knowledge and inventions are a
global public good. But one can only use them if one can reach the book,
turn the pages, and read from it. Juma (2006, 3–4) identifies the condi-
tions that helped emerging economies do this effectively:
First, these countries invested heavily in basic infrastructure, including
roads, schools, water, sanitation, irrigation, clinics, telecommunica-
tions, and energy. The investments served as a foundation for techno-
logical learning. Second, they nurtured the development of small- and
medium-sized enterprises. Building these enterprises requires develop-
ing local operational, repair, and maintenance expertise, and a pool of
local technicians. Third, government supported, funded and nurtured
higher education institutions, as well as academies of engineering and
technological sciences, professional engineering and technological
associations, and industrial and trade associations.
Recent economic history demonstrates that successful innovation
requires careful action by growth-oriented governments. Chandra and
Kolavalli (2006) point out that their study of 10 successful examples of
intervention required a common set of industry-specific measures to pro-
mote technological innovation (see box 5.1 for details):
• Governments set goals to support a nascent or nontraditional industry
because it was a valuable source of export-led growth.
• Political commitment sometimes took the form of a guiding national
vision; in other cases, it involved taking actions to help the industry,
even in an otherwise closed economy.
• Governments rewarded winners and abandoned losers, using success in
the world market as an indicator.
• With a few important exceptions, governments did not pick winners,
they rewarded winners.
• Governments supported competition among both domestic and foreign
firms.
• Governments supported the rule of law and enforcement of contracts.
We have earlier noted the unique position of knowledge as a factor of
production, and its importance in the global economy. Some knowledge is
embedded in particular pieces of capital, while other knowledge exists

TACKLING THE CHALLENGES OF AFRICAN GROWTH 167
BOX 5.1
Technology, Adaptation, and Exports:
How Some Developing Countries Got It Right
As global markets have become more deeply integrated and competitive,the challenge of diversifying away from dependence on primary commodi-ties has become more daunting. Not only are small local markets and poorbusiness environments constraining competitiveness, but there is also agap in sophistication of standards and productivity. Technology can helpbridge this gap, but individual firms often lack the incentive, expertise, andresources to pursue the required innovation.
In a volume that draws lessons from 10 cases of developing countries thatsuccessfully adapted new technologies to catch up with developedcountries—both in specific industries and across a wide range of incomelevels—Chandra and Kolavalli (2006) draw the following key lessons.
1. Latecomers can leapfrog across several stages of development. In-dia’s global share of outsourced information technology has grown fromless than 1 percent in 1996/97 to 3.3 percent in 2003/04 with sales increas-ing from $1.86 billion to $15.6 billion within this period. Taiwan (China) in-creased its per capita income 10-fold within four decades, largely on theback of rapid expansion of electronic exports (accounting for nearly 13 per-cent of global total). Malaysia has moved from exporting crude palm oilprocessed in Europe and only 10 percent of global processed palm oil in1995 to 50 percent of processed oil by 2001. Chile raised its share of worldproduction of salmon from 1.5 percent in 1987 to a whopping 35 percent in2002 and increased its share of wine products from 0.5 percent in 1988 to5 percent in 2002. Kenya’s floriculture exports grew 300 percent between1995 and 2003, and Kenya is currently the world’s third-largest exporter ofcut flowers. In all cases, economic activity in the industry was either non-existent or at best nascent until public support kicked in and other condi-tions changed in favor of harnessing technologies.
2. Technological learning was the key channel of innovation behind
their successes. Along with Lall (2000), the study attributes significant dif-ferences in economic performance among countries with similar levels oftechnology investment to technological learning—technological mastery at
(Box continues on the following page.)

168 CHALLENGES OF AFRICAN GROWTH
BOX 5.1 continued
first and technological deepening later. The channels of technology trans-fer are multifaceted, and the countries and industries studied followed avariety of them. These include the following:
• Within-firm transfers through FDI (from parent to subsidiaries—for ex-ample, electronics in Malaysia and Taiwan, floriculture in Kenya, Nileperch fisheries in Uganda, and wine and salmon in Chile).
• Licensing, contracting, and subcontracting (buyers must develop ownmarketing capabilities). This is a more limited channel.
• Capital goods imports in the presence of capabilities to use and adaptthe technology embodied in the imports.
• Local adaptation or development through interactions between firmsand technical institutional training abroad (for example, India and Chile).
• Contracts and consultants to meet product or service specifications (forexample, Nile perch processing in Uganda).
• Formal research and development.
• Harnessing of the diaspora to disseminate technological knowledge tolocal firms (for example, Indian software and Taiwanese electronics).
3. Underproduction of technology requires public action to support
acquisition of knowledge necessary for using technology assets.
For example, leading industrial clusters in Organisation for Economic
independently of any material investment. That knowledge, although
sometimes protected by copyrights or patents, is often free; however, using
it in a developmental way may have some costs. Information or knowl-
edge can be used effectively under two conditions—the presence of a
skilled labor force that is able to manipulate complex ideas and, in fact, to
build new knowledge on the base of the old, and the existence of a dense
network of modes of communicating that knowledge, in other words,
information technology.
As Sebastian Edwards (2001) notes in the case of Latin America, for
example, growth acceleration in the region will require a significant boost

TACKLING THE CHALLENGES OF AFRICAN GROWTH 169
in productivity. Productivity growth associated with the wave of market
reforms has waned, and a second wind of faster productivity growth will
depend on expanding the role of technology, the Internet, and the new
economy. In order to take full advantage of this new technology, Edwards
argues, Latin American countries will have to make major investments in
the complementary areas—research and development, education, and
infrastructure, as well as institutional and economic reforms (including
more flexible labor markets).
Information and communications technology (ICT) is now the main
technological driver for productivity growth. Its importance has recently
Co-operation and Development economies, including in Singapore andTaiwan (China), owe their existence to government actions (Yusuf 2003).There are several reasons for the apparent market failures. Collectivebenefits exceed those accruing to innovating firms with traditionalspillover effects (Ruttan 2001): market prices do not reveal the profitabili-ty of investments in new technology, deferring discovery (informationalspillover), and large-scale complementary investments are required priorto new investment in technologies becoming profitable (coordinationspillover; Rodrik 2004). The key preconditions are capable institutions,mainly for enforcing property rights and contracts (Porter 1990); infra-structure; and skills.
4. The following are key areas of public support. (a) Negotiating withmultinational corporations for technological transfers (Taiwan [China] andMalaysia), including the use of fiscal incentives and other forms of lures;(b) providing financial support to domestic firms and research organiza-tions to help spin off firms (for example, Fundación Chile and Corpo-ración de Fomento starting off first commercial-scale salmon fishing); (c) providing technological extension services across a wide range ofthese cases; (d) promoting exports to help reach new markets and devel-op new products (for example, export processing zones offering gener-ous incentives and infrastructure services); (e) providing nonforbearingregulatory services and enforcement of standards, particularly for ex-ports of fresh produce and phytosanitary standards; and (f) investing tomeet technical manpower needs (for example, by investing in scienceand technology education and promoting in-house training within firms).

170 CHALLENGES OF AFRICAN GROWTH
received empirical support in OECD country studies. For example, Nord-
haus (2001) uses a new data set to conclude that for the U.S. business sec-
tor, information technology accounts for a little over one-third of recent
productivity acceleration. Jorgenson and Stiroh (1999) and Jorgenson
(2001) found that information technology has contributed 1 percentage
point per year on average (1996–99) to U.S. output growth. Investment in
ICT facilitates innovation, primarily through organizational changes
(Brynjolfsson and Hitt 2000, 5). The following are two main channels
through which investment in information technology influences aggregate
growth: (1) a higher stock of ICT will make investment in human capital
and in organizational capital more productive, and (2) investment in infor-
mation technology will have a direct effect on growth. The effect of invest-
ment in information technology on GDP growth will depend on the levels
of both human capital and organizational capital (box 5.2).
BOX 5.2
ICT Helping to Improve Financial Services in Africa
Financial services in most of Sub-Saharan Africa are limited for a number ofreasons, including high information and transaction costs, governance is-sues, and lack of competition. If financial services are to be provided to abroader group of savers and borrowers, then innovations, both organiza-tional and technological, are necessary, particularly to reduce costs. Someof these innovations are now being introduced or have already begun tospread in certain areas.
Smart Cards—the Remote Transactions System (RTS) in Uganda.Three mi-crofinance institutions are piloting the RTS, which allows the processing ofloan payments, savings deposits, withdrawals, and transfers. Each client orclient group purchases a smart card with a given value. At the front end ofthe technology is a point-of-sale device that reads the cards and is net-worked to a server, which is then linked to the institution’s management in-formation and accounting systems. The technology has challenged the lim-its of local infrastructure (unreliable electricity supply and erratic telephoneconnectivity) and the literacy of the customers. Moreover, the pilot pro-gram demonstrated that it would only be economical at a scale that re-quired the different financial institutions to share the infrastructure.

TACKLING THE CHALLENGES OF AFRICAN GROWTH 171
According to a study by the Centre for Economic Policy Research, a
country that has reached a level of mobile phone penetration of 10 percent
of the population adds 0.59 percent to its GDP per capita growth rate. Fur-
thermore, strong empirical evidence exists (see figure 5.4) that investment
in ICT improves competitiveness (WEF 2006). Historically, African coun-
tries have not treated ICT as an important sector for economic growth and
prosperity. For example, in 2003, Internet access in a sample of African
countries cost an average of $78 per month, while the cost in a set of other
developing countries was $19.40. In 2002, there were only 1.5 million
Internet users in all of Sub-Saharan Africa, half of whom were in South
Africa. Typically, African governments have tried to monopolize Internet
usage, charged high tariffs, treated imported computers as consumer rather
than investment goods (in terms of external tariff rates), and done little to
encourage growth of the ICT sector.
Cell phone banking. Celpay is a payments company that works in the De-mocratic Republic of Congo and Zambia. To make a payment, a customersends a text message with the details to Celpay, which then returns atext message requesting the customer’s personal identification number.Once that is done, Celpay transfers money between the participants’ ac-counts. Currently, there are 2,000 users in Zambia who make one to twotransactions per month at a cost of 1 to 2 percent of the transaction.
International remittances. The volume of identified international remit-tances into Africa in 2005 reached $8 billion, almost double the 2004 lev-el. For some countries with large numbers of workers overseas, such asLesotho and Cape Verde, remittances can reach from 15 to 30 percent ofGDP. Transaction costs here are high, and there are substantial legal andregulatory barriers to formal remittance avenues. The potential for usingcell phone technology is very high. The Washington Post (October 3, 2006)described the current use of cell phones in remittances by providing an ex-ample from the Philippines, where an uncle living in London transferredsmall amounts of money to his niece living in Manila. The article goes onto say, “With cellphone use booming across the developing world, hand-sets that cost as little as $30 are enabling struggling nations to leapfrogpast the need for landline phones and ATMs.”
Source: Honohan and Beck 2006.

172 CHALLENGES OF AFRICAN GROWTH
The one exception has been mobile phones, which have been lightly
regulated, and whose development has been the responsibility of private
firms, some indigenous and some foreign.
The result has been perhaps the most breathtaking success in recent
African economic experience. From Somalia to Nigeria, mobile phone
growth has been spectacular. Since 1998, the number of mobile phone
subscribers in Africa has increased from 2 million to more than 100 mil-
lion. Access to mobile phones is much greater since many businesses have
sprung up renting mobile phones for periods of 10 minutes up to 10 days
or more. In fact, a burgeoning market for air minutes has been created,
generating new employment on its own. In Tanzania, it is estimated that
97 percent of the population has access to mobile phones.
This simple technology has increased the productivity of indigenous
business in myriad ways, as in the following examples: A Kenyan farmer
can easily find the best prices for the watermelons she sells. A black nurs-
ery owner near George, South Africa, always had difficulty selling to white
consumers because of their security fears; now they call him and he deliv-
ers, and his business has taken off. A fisherwoman on the Congo River,
FIGURE 5.4The Global Competitiveness Index: Impact of Investment in ICT
networked readiness index: ICT usage component (score)
glob
al c
ompe
titiv
enes
s in
dex
(ove
rall
scor
e)
–2.0 –1.5 –1.0 –0.5 0 0.5 1.0 1.5 2.0 2.5
6.5
6
5.5
5
United States
Chad
Ethiopia Mali
Pakistan
Brazil
Luxembourg
Malta
United Arab Emirates
Israel
Germany Japan
Finland
Korea, Rep. of
SingaporeDenmark
4.5
4
3.5
3
2.5
2
Source: WEF 2006.

TACKLING THE CHALLENGES OF AFRICAN GROWTH 173
with no electricity, keeps her catch alive in the water tethered to a line. Her
customers call her with an order and she prepares the fish for sale.
Moreover, as phones become more sophisticated, they will probably be
the key step to expanding Internet connectivity, freeing consumers from
the constraints of inefficient landline technology and intermittent power
availability. In five years, 200 million Africans will have access to the Inter-
net, and thus to the global economy.
Investment in higher education is shown to strongly boost competitive-
ness, partly by allowing better use of ICT. Hence, investments in human
capital and ICT are key components of the growth agenda.
The challenge of human capacity gaps. African countries cannot build compet-
itive economies and raise productivity without having the human capacity
to harness knowledge and technology to complement the other efforts
being made to improve the business environment. In this global economy,
a competitive edge is largely associated with higher productivity. Diffusion
of innovation is crucial for the achievement of productivity gains and suc-
cessful competitive performance more generally. However, as Chandra
and Kolavalli (2006), Utz (2006), Edwards (2001), Ho and Hoon (2006)
emphasize, effective diffusion of innovation requires skills and incentives
for spreading innovation into the economic environment. For example,
information technology enables producers to do more and better individ-
ually and as organizations when there is the capacity to use it. This is
demonstrated in figure 5.5, where the correlation between economic com-
petitiveness and investment in tertiary education is clearly demonstrated.
Countries in East Asia that saw this potential early positioned them-
selves to exploit this technology very successfully. A good example is what
happened under the initiative of (the Republic of) Korea 21. The Korean
government invested heavily to prepare the country for the 21st century.
This program targeted what the Korean government considered to be the
seven most important fields in science and technology required to enhance
Korea’s competitiveness in the global economy. As is now clear, the results
were phenomenal, and Korea, which started out as a developing country
barely four decades ago, has now joined the ranks of OECD status.
Progress in overcoming shortages of skilled and trained manpower in
Africa seems to be disappointingly slow, despite substantial resources
devoted by both governments and donors to this effort during the past four
decades. According to the Institute of Statistics of the United Nations Edu-
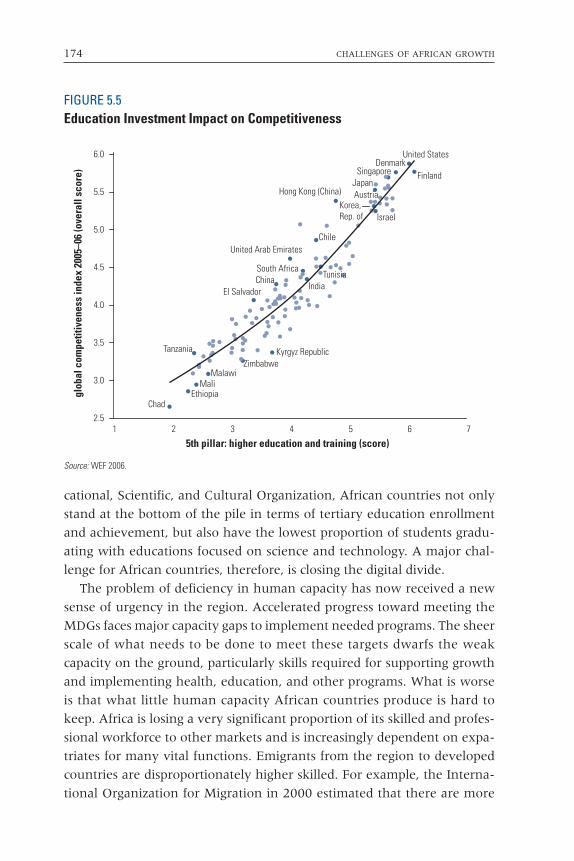
174 CHALLENGES OF AFRICAN GROWTH
cational, Scientific, and Cultural Organization, African countries not only
stand at the bottom of the pile in terms of tertiary education enrollment
and achievement, but also have the lowest proportion of students gradu-
ating with educations focused on science and technology. A major chal-
lenge for African countries, therefore, is closing the digital divide.
The problem of deficiency in human capacity has now received a new
sense of urgency in the region. Accelerated progress toward meeting the
MDGs faces major capacity gaps to implement needed programs. The sheer
scale of what needs to be done to meet these targets dwarfs the weak
capacity on the ground, particularly skills required for supporting growth
and implementing health, education, and other programs. What is worse
is that what little human capacity African countries produce is hard to
keep. Africa is losing a very significant proportion of its skilled and profes-
sional workforce to other markets and is increasingly dependent on expa-
triates for many vital functions. Emigrants from the region to developed
countries are disproportionately higher skilled. For example, the Interna-
tional Organization for Migration in 2000 estimated that there are more
FIGURE 5.5Education Investment Impact on Competitiveness
5th pillar: higher education and training (score)
glob
al c
ompe
titiv
enes
s in
dex
2005
–06
(ove
rall
scor
e)
1 2
Kyrgyz Republic
United Arab EmiratesChile
Israel
Denmark
Korea,Rep. of
AustriaHong Kong (China)Japan
Singapore
United States
Finland
India
South AfricaChina
El Salvador
ZimbabweMalawi
Tanzania
MaliEthiopia
Chad
3 4 5 6 7
6.0
5.5
5.0
4.5
4.0
3.5
3.0
2.5
Tunisia
Source: WEF 2006.

TACKLING THE CHALLENGES OF AFRICAN GROWTH 175
African scientists and engineers working in the United States than there
are in Africa. This not only exacerbates the relative scarcity of these skills,
but more important, it demobilizes middle- and lower-level skills because
of the absence of supervisory capacity. South Africa’s Bureau of Statistics
estimates that between 1 million and 1.6 million people in skilled, profes-
sional, and managerial occupations have emigrated since 1994, and that
for every emigrant, 10 unskilled people lose their jobs. This is aside from
the fact that the region is losing its potentially most enterprising and ambi-
tious young people, stifling the development of a more dynamic private
sector at home.
The losses of human capacity are not only to other regions but also to
pandemics. HIV and malaria have grown to be major challenges to African
livelihood and development. At the same time, Africa is rapidly losing
much-needed health care workers (doctors and nurses) to the developed
world, where they are relatively less needed. It is estimated that there are
more than 21,000 Nigerian doctors practicing in the United States alone.
About 60 percent of all locally trained Ghanaian doctors left the country in
the 1980s, and very few have returned. In spite of the huge HIV/AIDS pan-
demics in Southern Africa, countries in that part of the continent continue
to lose medical personnel in droves. Out of all the medical graduates pro-
duced by the University of the Witwatersrand in South Africa in the past
35 years, more than 45 percent (or 2,000 physicians) have left the country. In
the 1980s, Zambia had 1,600 doctors in the country. The number has since
plummeted to 400. Health care in some of these countries is on the brink of
collapse. It is a very serious crisis that needs an urgent and major response.
In the longer term, Africa needs to reverse the growing dependency on
outside experts for essential decision-making and managerial functions. It
has been estimated that annually 100,000 foreign experts are deployed in
African countries at a cost of nearly $4 billion per year. The OECD Devel-
opment Assistance Committee’s estimates of technical cooperation assis-
tance to Africa in 2004 reached nearly $6 billion, a significant increase
from its level in the mid-1990s. Technical assistance often targets short-
term alleviation of capacity shortfalls. In this form, it often discouraged
efforts to build and retain local capacity in government, and has tended to
engender psychological dependence on expatriate capabilities.
How should Africa and its partners respond to this challenge? African countries
should expand tertiary education enrollment and achievement as part of a

176 CHALLENGES OF AFRICAN GROWTH
growth and competition strategy. After decades of decline, many African
universities are reforming themselves, pursuing self-sufficiency in finance,
improving management, and partnering with the private sector (Bollag
2004). In fact, there has been a mushrooming of private universities, and
this development should be pursued by both the for-profit sector and the
faith-based communities. Composition of disciplines should lean away
from their earlier bias toward social sciences and move toward science and
technology and business education. A major challenge will be to reform
traditional public-funded universities to be more responsive to the chang-
ing needs of their clientele and be more cost-effective. A related challenge
will be to build quality-assurance mechanisms (for example, independent
postgraduation certification that will help users determine the type of
products they are getting from the skyrocketing number of tertiary educa-
tional institutions).
African countries also must stem the tide of skills emigration. They can-
not contain the problem of brain drain by erecting hurdles to contain emi-
gration. The region could not arrest the flight of its financial wealth by
erecting barriers. Success in reversing capital flight has begun in those
countries that have created attractive investment climates and expanded
opportunities for investors. A similar strategy is needed to contain human
capital flight. Talent will flee from where it finds no gainful use. Expanding
opportunities for gainful and well-remunerated engagement is part of a
lasting solution to the brain-drain problem. In a virtuous circle, better skills
lead to higher growth, and in turn, higher growth leads to increased
demand for skills. The two main sources for expanding opportunities for
gainful application of skills are private sector growth and professionaliza-
tion of the public sector. In the current era of globalizing production sys-
tems, people move and jobs move. Globalization therefore has raised the
potential for relocating skilled jobs to Africa through foreign direct invest-
ment and outsourcing, which has been a significant factor behind East
Asia’s phenomenal growth experience. In combination with ongoing pub-
lic service reforms, which partly aim to reintroduce meritocracy in public
service and restructure incentives in favor of a professional cadre, the
potential for raising the demand for skills and productivity at home is real.
The countries should make better use of the skills of Africans in the
diaspora. Some of these skilled personnel could temporarily return to per-
form specialist functions when needed. A qualified doctor, for example,
would be helped to return home to teach, perform operations, and share

TACKLING THE CHALLENGES OF AFRICAN GROWTH 177
skills for a limited time period. Information technology can also enable a
virtual return through skill sharing, teaching, mentoring, and even mark-
ing exam papers via the Internet and video conferencing. This approach is
considered particularly attractive because of its cost-effectiveness. Others
may make an economic return by encouraging African professionals with
adequate capital or access to it to invest in their home countries or the
region. African governments could provide information on investment
opportunities and facilities for channeling capital to the region.
Another way the African diaspora skills can be utilized is as technical
assistance in place of foreign experts. The policies for deployment of tech-
nical cooperation have largely precluded the use of nationals even if they
are qualified. A study by Haque and Khan (1997) has shown that deploy-
ing national emigrants for technical assistance is not only likely to be more
cost-effective, but also likely to get those in the hard-to-get higher end of
the skill profile. The argument advanced by the authors is that for each
skill category, the emigrant would be willing to accept a much smaller pre-
mium to return and perform the required task than would a foreign
national. This is not surprising, as one of the important features of African
migrants is that most maintain social and cultural links with their home
countries.
Strengthening Critical Institutions for Growth
African countries tend to cluster in the lower ranks of institutional per-
formance measures that are correlated with growth. While economists still
know relatively little about how durable improvements in public sector
performance are achieved, three observations seem relevant to the African
situation. First, when institutions are initially weak, the resultant institu-
tional vacuum leaves too much discretion and too little accountability in
the hands of political elites. Much then depends on the quality and dispo-
sition of the leadership in power (Reinikka and Collier 2001; Glaeser et al.
2004). Wherever political leaders were unable to reconcile the benefits of
a market-friendly institutional environment with their own priorities,
institutional performance deteriorated and growth suffered. Second, as
Collier (1991) argued, donor conditionality was ill-suited to fill the institu-
tional vacuum or act on behalf of the disenfranchised African population.
Donors had their own constituencies and could not credibly threaten to
terminate aid on the basis of poor policy performance. Third, in the 1990s
178 CHALLENGES OF AFRICAN GROWTH
there was too much focus on correcting “sins of commission”—that is,
what governments had done wrong—and too little attention on “sins of
omission”—underprovision of public goods and services to reduce costs to
firms and make potential opportunities more profitable. A key strategic
challenge faced by many African countries is, therefore, that of strength-
ening the role of the government in supporting the growth process with-
out encumbering private initiative and efficiency.
Consistent with experiences in East Asia and Botswana, for example,
successful states followed the market where it led (Wade 1993), and pre-
dominantly initiated projects that were viable ex ante at shadow prices
(Ndulu 2006b). Success also depended partly on the institutional capacity
of a state to pursue this prudent path6 and partly on government’s com-
mitting itself to credibility and tying its own hands through effective polit-
ical restraint mechanisms.
Strengthening state capacity entails three dimensions—capacity of indi-
viduals (manning the institutions), organizational effectiveness, and rules
of the game. It is clear that there are a whole range of African institutions,
both public and private, that need to be strengthened for both growth and
poverty-alleviation purposes. While there has been a strong emphasis in
recent years on institutions of financial accountability, particularly because
of the increasing emphasis on providing programmatic assistance, we will
focus on a few key areas here that will have the biggest payoff in terms of
private sector–led growth: the enforcement of contracts; exercise of voice
as an agency of restraint; revenue transparency, particularly in natural
resource–rich countries; and reduction of corruption, particularly in criti-
cal areas that undermine confidence.
Enforceability of contracts. Economic activity requires trust. Each nonsimul-
taneous purchase requires an implicit or explicit contract, and thus
depends on a belief that the contract will be adhered to, and, if it is not,
that there is a mechanism to enforce its terms. In fact, Nobel Prize winner
Douglas North has written that nonenforcement of contracts is perhaps
the single most important determinant of underdevelopment. Other schol-
ars believe that weaknesses in formal systems of enforcement, such as
courts, can be balanced by a network of trust. In Africa, much of this trust
comes from various forms of affiliation—family, village, ethnicity, and his-
tory. This works well in small communities or along ethnic and linguistic
lines. But by their very nature, these networks limit the potential size of

TACKLING THE CHALLENGES OF AFRICAN GROWTH 179
the market, and thus limit the degree of specialization. Formal enforce-
ment institutions become necessary as markets expand and as corporate
businesses become part of the picture.
Richard Messick (2004) lays out several lessons that the World Bank has
learned around the world in supporting judicial reform. These include the
following:
• Judicial reform is harder than project designers believe.
• Projects cannot be developed on the cheap. It is especially important to
invest in developing quantitative indicators of performance before mov-
ing forward with the project.
• Altering incentives is crucial. This is true not only for judges, but also for
clerks and other actors in the system.
• Speedier case disposition in and of itself does not constitute reform.
• Too little attention is paid to alternative dispute mechanisms.
Exercise of voice. As Pritchett and Woolcock (2002) emphasize, while mar-
kets create managerial discipline and induce efficacy through the exercise
of private choice, governments are principally disciplined through the
exercise of voice to enforce representative public choice. Inclusiveness is,
therefore, a crucial feature of a developmental state and can be broadly
characterized by representational political processes, accountability and
openness, a participatory process in national policy choice, and feedback
on outcomes and impact in the delivery of public services. Space for the
exercise of voice in the development process is necessary for sustaining
reforms and achieving results from public programs on the ground. This is
a theme that the World Development Report (World Bank 2004) pursues in
remarkable detail, following on the equally remarkable work on voice in
the earlier World Development Report (World Bank 2000b). Conceptual
underpinnings and systematic empirical evidence linking participation and
inclusiveness to efficiency are at an early stage of development (Cleaver
2000; Mansur and Rao 2003); however, substantial work in this direction
increasingly supports these assertions.
Governments should commit with credibility, administrative systems
should be accountable, political and economic environments should min-
imize risk to enable longer time horizons for actors, domestic politics
should encompass most interest groups, and the political system should be

180 CHALLENGES OF AFRICAN GROWTH
open to contestation. In the same vein, devolution of decision making and
development management to subnational levels (local governments and
communities) is important, not only for ensuring better use of funds but
also as part of a strategy for better governance.
Domestic politics will ultimately dictate the speed with which African
countries can move toward more transparency and increased accountabil-
ity and good governance, which cannot be sustained in an environment
that is characterized by exclusive politics (Hamdok 2002: 19, 27). Political
contestation is a means of tying the hands of governments through a cred-
ible but peaceful threat of regime turnover. It encourages greater trans-
parency and increased accountability. As the rapid process of liberalizing
political systems continues, there is mounting pressure for greater inclu-
siveness of stakeholders in designing development programs. This devel-
opment poses perhaps the greatest challenge to reformulating the aid
relationship. The current dual-accountability system of recipient govern-
ments to donors and the local constituency may need to be reconfigured
into a single integrated system. The growing emphasis on a partnership
approach and local ownership is a very useful response. But to make part-
nership and local ownership a reality, the immense challenges of sur-
mounting attitudes and changing procedures for aid management first
must be faced.
One weakness of the main model of inclusiveness presented in this
paper and much of the related literature is that it glosses over the question
of whether participatory political institutions necessarily produce policy
choices that serve the public interest. Quite often, inclusive or participa-
tory political systems have an encompassing point of view, but it does not
follow that (for example) a majoritarian political system, which may be
viewed as highly participatory, would succeed in aggregating many indi-
vidual interests into a truly encompassing welfare function. It is possible to
envisage such regimes leading to populist results, for example, with a high
tax rate on capital that seeks to finance progressive redistribution but fails
by undermining growth. In nascent democracies, such as Ghana, there
could be fitful policy performance due to emergence of populist pressures
during and after the transition to democracy. Developing a system with a
high degree of resistance to populist pressures is a constitutional problem
(such as that studied in the Federalist Papers), and it confronts us with the
fairly deep question of whether participation and ownership as a domestic
political process can potentially be prone to populism and other mistakes.
TACKLING THE CHALLENGES OF AFRICAN GROWTH 181
What would be sufficient conditions for emerging encompassing regimes
to generate sustained pro-growth policies?
Moreover, there is a political economy conundrum that needs to be
addressed by asking a difficult question: what are the incentives for
African governments to develop a broad-based private sector? Many
African governments have created business environments in which
minority-owned firms have been able to perform better than indigenous
firms. This may partly be a side effect of poorly formulated and misguided
policies, but it may also be a result of the underlying structure of incen-
tives. Is it truly in the interest of governments to facilitate a broad-based
private sector? Or is it safer to have a private sector that is dominated by
ethnic minorities who do not pose a significant threat to political power
but can provide a steady stream of rents? Tangri (1999) argues that the
minority Asian community in East Africa, which has thrived even in dif-
ficult times, often coexists with a small, wealthy, indigenous private sec-
tor. This group relies on its political connections and its rent-sharing
arrangements with the government for its survival. The government, in
turn, relies upon it for extrabudgetary revenues. This suggests that one
has to consider the difficult problem of dismantling some of the key con-
trol points that certain governments continue to maintain, which are
used to penalize firms that represent a political threat (Ramachandran
and Shah 2006). While the situation on the ground is changing, what
some governments still seem to fear the most is a private sector that gen-
erates wealth independent of government controls and that makes its
own unfettered decisions.
It is worth pointing out that in some cases, the unease on the part of
government officials exists on purely economic grounds, arising from real
concerns about protectionism in developed country markets or lack of
domestic demand. In other cases, it is the uncertainty that arises from a
lack of control over the generation of wealth, particularly where the pri-
vate sector is dominated by a few players.
The key question that arises from these concerns is how African govern-
ments can be encouraged to take steps to develop a broad-based, relatively
unfettered private sector, even when this may be against their short-term
interests. There is a chicken-and-egg problem here. Even in a democratic
system, the crystallization of politics based on economic interests takes
time. In Africa, most politics are regionally, ethnically, or personality based.
It takes the rise of a middle class to move toward economics-oriented pol-

182 CHALLENGES OF AFRICAN GROWTH
itics. But without such politics, it is less likely that political decisions will be
oriented toward rapid economic growth and the development of the mid-
dle class. It is critical to strengthen those institutions that promote voice
and accountability and those institutions that speak for an indigenous,
export-oriented private sector.
But real accountability is more than the possibility of regime change.
The World Development Report (World Bank 2004) develops an analytic
framework that defines accountability as a relationship among actors that
has five features: delegation, finance, performance, information about per-
formance, and enforceability. Thus, an employee is given a set of tasks (del-
egation), and paid a wage (finance). The employee works (performance), the
contribution of the employee is assessed (information), and the employer
rewards or punishes the employee (enforceability). This is quite similar to a
government’s provision of services, such as infrastructure. A well is to be
built (delegation to provider), finances are made available, the well is built
(or not), the potential users have the information to know if the well is
working, but they may not be able to enforce needed changes if it is not.
The last two links—information and enforceability—are critical for
making government accountable. For many, if not most, aspects of service
provision, information is usually available, at least to clients. A road is built
or is not, drugs are available at a clinic or not, teachers come to the class-
room or they do not. What is less easy to determine is their quality, and
what contracts the government has made with frontline providers.
One example of the importance of information is the famous Uganda
primary school case. In 1991–95, only 13 percent of per-student capitation
grants actually made it to the schools. The Ugandan government then
began publishing data on monthly transfers in newspapers and on radio.
This information could be used by parents and local leaders to make
schools and school officials accountable. In 1995, the median school
received zero capitation funds; by 2001, they were receiving 80 percent of
the funds. In this case, information was enough. Parents were able to
enforce performance because the embezzling officials were known locally
and were subject to enormous pressure.
In the mid-1980s, Mali, Benin, and Guinea were in economic and fiscal
crisis. One result was a decline in public resources for health clinics and the
effective elimination of public clinics as a source for health care and medi-
cines. Health status indicators plummeted. The three governments became
participants in the Bamako Initiative, an effort by West African govern-

TACKLING THE CHALLENGES OF AFRICAN GROWTH 183
ments and donors to revitalize rural health provision (Knippenberg et al.
2003). The basic strategy was to do the following:
• Decentralize decision making and management from the national to the
local level.
• Institute community cost-sharing and comanagement of health services.
• Ensure the availability of affordable medicines by allowing communities
to control their own resources.
Health care providers and health care financers were now accountable to
local communities. There were a number of important technical reforms
that made care cheaper and more effective, but the core of the program was
accountability through decentralization and a public-private partnership.
Health outcomes for all three countries improved as a result of this initiative.
In the case of voice, improvements may need to be made at a number
of levels:
• Delegation. For example, performance-based contracts between the gov-
ernment and the providers can be introduced. So, if the job of the cus-
toms official was twofold—collecting revenues and ensuring rapid
movement of goods through the port—and if his performance was
measured and incentives created to encourage performance, then
importers might receive more effective services.
• Information. By being clear and specific about expected results and by
collecting relevant data and publishing the data, key clients can glean
the information they need to determine whether providers are per-
forming as expected and intended.
• Enforceability. The key process here is to decentralize both politically and
administratively to give clients the ability to enforce performance.
Of course, effective voice means the opening of space for nonstate
actors—media, civil society, and parliament—to have a larger share in the
public discourse. The better trained and the more accountable these actors
are, the more effective their voices will be as an instrument of
accountability.
Revenue transparency. We have noted before that mineral resources, partic-
ularly oil, can lead to weak governance and high levels of corruption,

184 CHALLENGES OF AFRICAN GROWTH
which can reduce economic growth rates in the nonmineral sectors. One
way to mitigate this result is to strengthen public finance institutions that
manage mineral rents and taxes and that spend these resources for public
investment and consumption. A first step is to make the relationship
between the government and the mineral producer transparent, in the
hope that transparency will lead to better behavior. This turns out to be a
complicated problem. In 2003, the United Kingdom launched the Extrac-
tive Industries Transparency Initiative (EITI), which built on the non-
governmental organization campaign Publish What You Pay (PWYP). Both
aim to enhance the transparency of natural resource revenue. PWYP
strives for mandatory disclosure of payments by extractive industry com-
panies; the EITI aims for voluntary disclosure by governments as well as
companies. In the EITI, companies and governments use similar templates
for reporting all revenue flows, whether accruing directly to government
or through a national oil company. Any discrepancies become evident by
comparing the templates. More than 20 oil-producing countries have
endorsed the EITI, and most have started to implement it. The United
Kingdom currently provides a secretariat, and an international advisory
group is preparing proposals for a future management structure and a
monitoring and validation system.
Of the 22 countries that have signed on to the EITI, so far only Azerbai-
jan, Gabon, the Kyrgyz Republic, and Nigeria have published EITI reports,
and they all reveal serious deficiencies in coverage or government account-
ing procedures, or both. These deficiencies will have to be addressed
through broader public finance reform for the achievement of genuine
political accountability for the spending of mineral revenues. Nevertheless,
real progress is being made. Nigeria, the largest oil and gas producer in
Africa, is probably a poster child for EITI. President Olusegun Obasanjo
committed to EITI in November 2003 and launched Nigeria EITI (NEITI) in
February 2004. The National Stakeholders Working Group (NSWG) steers
implementation and is composed of 28 individuals from civil society,
media, and government, as well as national and multinational companies.
On March 16, 2005, a consortium led by the London-based Hart Group
signed a contract to audit Nigeria’s oil revenues. The NEITI process consists
of three stages. The first audit is aimed at reconciling information on pay-
ments and receipts. A second audit is focused on amounts of oil and gas
produced, lifted, lost, refined, and exported. A third audit reviews the
transparency and appropriateness of the industry processes and makes rec-

TACKLING THE CHALLENGES OF AFRICAN GROWTH 185
ommendations for improvement. In addition, all the information and data
on the extractive industries is made public through a communications
strategy and the engagement of regional civil society groups.
On April 26, 2006, the NSWG announced the results of the Hart Group
audits for the period from 1999 to 2004. Based on EITI criteria, these audits
examined financial and physical data from private and state-owned com-
panies, national and international companies, and regulatory authorities.
The report included a set of recommendations that the government wants
to translate into a time-bound plan of action to correct the identified weak-
nesses and improve the relevant systems to avoid future failures. The NEITI
bill, which was approved by the House of Representatives of the National
Assembly on January 19, 2006, is now awaiting passage by the Senate.
This legislation will guarantee mandatory annual audits of the extractive
industries sector, oil companies will be legally required to disclose all pay-
ments made in its operations, and the recently established Oil Revenue
Monitoring Unit will be made independent from the Finance Ministry and
merge with the EITI Secretariat.
Obviously, reforming the revenue side is not sufficient, although it is an
important first step. Whenever the audits are complete, Nigerians will
know exactly how much money is flowing into the government’s coffers
from oil rents, and the public audits should reduce or eliminate leakages.
The next step is to improve management of the spending side, and that
will be even more difficult. For it is in spending, as well as in revenue col-
lection, that the opportunities for fraud, waste, and abuse are manifold.
Reduction of corruption. Corruption is now recognized as one of the major
obstacles to development. It manifests itself through rent-seeking behavior
that raises the transaction costs on many public and private activities,
including bribes to pass goods through customs and highway checkpoints
and bribes to police officers to be permitted to do something that might be
illegal. Corruption not only raises the costs of doing business and leads to
squandering of public resources, it also is corrosive to the national psyche.
It erodes the culture of trust that is necessary for the deepening and broad-
ening of markets.
The World Bank’s strategy for reducing corruption has five elements:
• Increasing political accountability
• Strengthening civil society participation
186 CHALLENGES OF AFRICAN GROWTH
• Creating a competitive private sector
• Strengthening institutional restraints on power
• Improving public sector management
We have already dealt with many of these topics—voice and accounta-
bility, deregulation of private sector activity coupled with effective regula-
tion of monopolies, and transparency of mineral revenues. Others are
somewhat beyond our scope—such as political institutions, which have
been shown to be very important. In this section, we want to focus on a
few small points that have not already been made.
Andersen and Rand (2005) empirically tested the proposition that
investment in ICT will reduce corruption. They point out that as govern-
ments use the Internet more broadly, more of their economic workings
will be made public. For example, the Nigerian EITI Web site publishes
every audit of the oil revenue system. Second, the Internet allows an infor-
mal press to flourish. In China, a number of investigative reporters have
been very effective by traveling the country reporting on corruption and
publishing the results on the Internet. Andersen and Rand’s regressions
demonstrate that an increase of one standard deviation in Internet users
per thousand leads to roughly a 0.58 standard deviation increase in the
Corruption Perception Index. In 2002, moving Vietnam up one standard
deviation in Internet usage would have resulted in moving it from 100 to
86 in the Transparency International Corruption Perception Index
ranking.
Just as ICT development can reduce corruption, so can increased eco-
nomic openness. A number of studies (for example, Bonaglia and Bussolo
2001; Gatti 1999) have demonstrated that trade reform is associated with
reduced levels of corruption. Fisman and Gatti (2000) have found that
decentralization is associated with reduced levels of corruption, presum-
ably because clients at local levels have increased information and
increased ability to enforce good behavior.
Preventing and resolving of conflict. Some of the methods for solving conflicts
have been tested, while others are still under consideration. One major
preventive tool at the disposal of policy makers is economic policy. Equity
and governance in the context of a growing economy can help reduce the
base upon which rebellions thrive. However, economic policy making by
TACKLING THE CHALLENGES OF AFRICAN GROWTH 187
major development agencies does not take into account the unique chal-
lenges faced by countries on the brink of war. Policy makers often com-
plain that they lack the fiscal space they need to effectively implement the
required redistributive policies due to commitment they made to interna-
tional financial institutions.
In societies on the brink of war or the ones surrounding them, a case
can be made for a proactive investment in infrastructure in order to pre-
vent war—that is, offer a bribe to avoid conflict. Thus, roads can be built,
and airports and transportation infrastructure investment can be front-
loaded in the areas most likely to be affected (Azam 2006). This exercise
may raise awareness of the involved parties about the cost of war before-
hand, and this awareness may elicit additional efforts to prevent or contain
conflicts. It is interesting to note that the World Bank can play a unique
role as an independent evaluator of the required investments and can alert
donors accordingly.
Well-designed institutions can be effective channels for the peaceful
resolution of conflicts between individuals, groups, or nations. Every time
violence is observed, it is important to thoroughly investigate whether
improvements in the design of institutions could have prevented it. The
institution that has received the most attention is democracy. Improved
governance and transparency in the conduct of public officials can help
reduce support for groups motivated by grievance to start a conflict.
Improved governance and transparency are also necessary for the design
of sound and sustainable economic policies.
While it is clear that a well-functioning democracy is more adept at
peacefully managing conflicting interests, other types of institutional
designs have received some attention. Elbadawi and Sambanis (2000), for
instance, suggested that democracy alone may be insufficient to prevent
conflict. They view innovative arrangements as more effective conduits to
peacefully resolve grievances and make optimal decisions. Decentraliza-
tion is an example of such an institutional innovation. By giving regions
enhanced autonomy and ownership of their decisions, it is expected that
the motivation to rebel is reduced.
A special mention and encouragement needs to be given to initiatives
by third-party countries and regional and international institutions in
conflict prevention and resolution. A case in point is that of African coun-
tries that have been involved in peacekeeping and conflict resolution in
the region. Nigeria’s leadership was decisive in the resolution of the con-
188 CHALLENGES OF AFRICAN GROWTH
flicts in Liberia, Sierra Leone, Gambia, Côte d’Ivoire, and the Sudan.
South Africa, too, has been heavily involved in preventive diplomacy to
contain the conflicts in the Democratic Republic of Congo, Côte d’Ivoire,
and Burundi.
At the regional level, the African Union’s Peace and Security Council,
inaugurated in 2004, was set up to prevent and help in the resolution of
conflicts within the Union. Other institutions exist, such as the West
African Monetary Union in West Africa. As illustrated by the recent con-
flict in Sudan, the main limitations of African institutions for conflict pre-
vention and resolution is the lack of resources. The emphasis on consensus
before any action is taken has also been criticized as conducive to delays
and a slow response to conflicts. A rapid reaction force is being contem-
plated in response to these concerns.
During hostilities, a priority of the international community is to pro-
vide emergency relief and secure cessation of hostilities. In a comprehen-
sive study of postconflict countries, Collier and Hoeffler (2002) find
evidence that aid ideally should be phased in during the decade after hos-
tilities end. However, aid historically has not been higher in postconflict
countries. Instead, it tended to diminish over the course of the decade. The
authors also find that policy improvements tend to have higher impact on
growth in postconflict countries.
Mobilizing Resources for Growth
There is no doubt that accelerating African growth will require substantial
increases in resources for investment, coming from both external and
domestic sources. Shanta Devarajan of the World Bank has estimated the
increase in external resources needed to meet the MDGs as $40 billion to
$60 billion worldwide (Africa would require half that). However, despite
the need for additional external financing, it is also important that domes-
tic resources be mobilized, especially as growth proceeds, to avoid
increased aid dependence.
Prospects for Aid Financing
Donor commitments of increased aid made at Monterrey, Gleneagles, and
other venues promise at least a doubling in aid to Africa in the next six

TACKLING THE CHALLENGES OF AFRICAN GROWTH 189
years, rising from $30 billion to $60 billion in 2004 dollars. Aid levels to
Africa had dropped substantially in the 1990s, but by 2004 were slightly
higher in real terms than 1993–94 levels. However, a large share of the
recovery has come in the form of emergency aid and debt relief, which do
little to expand fiscal space for African governments. In fact, aid going
directly to governments, aid that could open fiscal space, declined from
$24 billion to $20 billion in real terms between 1993 and 2004. Over the
same period, aid going to emergency and debt relief grew from 15 percent
to 32 percent of total ODA.
Moreover, there has been an important shift in the sectors ODA sup-
ports. Between 1994–95 and 2003–04, the share of aid going to the social
sectors went from 27 percent to 43 percent; aid to productive sectors went
from 16 percent to 12 percent; and program aid went from 20 percent to
11 percent. This suggests, then, that it is perhaps unfair to evaluate the effec-
tiveness of aid in terms of growth when aid was not intended to promote
growth. Any growth strategy will require a rebalancing of this allocation
toward the productive sectors. Finally, the expected increases in assistance
are heavily back-loaded, with aid increasing by 10 percent per year between
2005 and 2006, and by 20 percent per year from 2007 to 2010.
Aid brings with it a number of problems. Too much of current aid is
duplicative and ill-targeted. Donors bring their own agendas with the aid,
and often those agendas clash with those of the recipients. Aid in Africa is
extremely intrusive, providing up to 50 percent of government resources
in some cases, and the large numbers of donors and projects undermine
ownership and lead to inefficiencies in investments. Implementing the
Paris Agenda for improved harmonization and alignment is crucial to
improve the effectiveness of aid. In addition to the institutional and strate-
gic dependencies implicit in high levels of aid, financial dependency is also
a problem. Expanded investments in economic and social services bring
with them a commitment for long-term recurrent finance. The history of
the volatility of aid flows leads to great uncertainty as to whether new
investments can be supported over the medium and long terms.
There is need to enhance aid targeting so as to reduce or eliminate aid
dependence, at least in the long term. This requires a careful balancing act
between social development and growth-enhancing goals, with the recog-
nition that high growth rates are critical for pulling countries from under
the burden of dependence. The concern that in the past aid did not gener-
ate economic growth is valid. Exploring reasons why aid underperformed
190 CHALLENGES OF AFRICAN GROWTH
in the past is a first step toward ensuring effectiveness of present and future
assistance, and it is one of the purposes of the present study. One main rea-
son for the failure of aid in accelerating growth and development is
because these were not always among the stated objectives. The past
15 years have seen a clear shift in the allocation of ODA away from infra-
structure and agricultural development and toward social expenditures.
The question here is whether, in the absence of growth-oriented invest-
ment, it will be possible to sustain these expenditures. This shift does not
respond to the priorities African countries themselves have set. It is now
broadly accepted that countries must lead in defining strategies for scaling
up development, national plans, and aid priorities, and donors should
align their programs and projects to these national strategies and priorities.
Increased levels of ODA, therefore, require African countries to boost
capacity for mobilizing domestic resources. There will be a need to sustain
spending once aid is withdrawn or phased out to keep the growth momen-
tum going. Given the current situation with domestic savings, what meas-
ures need to be taken to reverse the trend? From the earlier discussion on
determinants of savings in Africa, there are some factors that will take a
long time to reverse. In particular, widespread poverty will remain a chal-
lenge for some time. However, several factors present a window of
opportunity.
A major problem that has been identified by numerous scholars (for
example, Aryeetey and Udry 2000) is that the bulk of savings by African
households is in nonfinancial assets. Several factors are responsible for
this, but some stand out, namely, the structural and institutional impedi-
ments that make it difficult for formal financial institutions to offer services
to certain types of clientele, particularly low-income populations, clients in
remote areas, and the informal sector. In some cases, however, there are
clear indications that formal financial providers are disinclined to serve
these particular clients and have designed measures intended to dissuade
this clientele from seeking the services of the intermediaries. This is evi-
dent in the operational procedures of these institutions that entail meas-
ures such as prohibitively high minimum balances and astronomical
transaction costs. In yet other cases, the conditions in the financial sector
itself, such as weak balance sheets and bank distress, discourage monetiza-
tion of assets by those the institutions target.
These represent a source of resources that can be tapped into immedi-
ately. The question is whether we can realistically expect African banks to

TACKLING THE CHALLENGES OF AFRICAN GROWTH 191
reform quickly enough to be able to overcome these constraints. Unfortu-
nately, the reform agenda remains formidable, especially when the returns
from marginal clientele are perceived as being too low to warrant the effort
of designing suitable instruments and delivery mechanisms (box 5.3).
If we accept the possibility that the formal financial bodies are not the
answer to the problem of access for everyone, at least in the foreseeable
future, what are the alternatives? Can microfinance and other semiformal
institutions be the remedy and effectively provide services to the under-
served? In most societies, microfinance is increasingly being pursued as a
potentially effective tool for delivering financial services to those not
served by the formal sector. However, microfinance frameworks need to
be strengthened in order to be successful. Structural inadequacies hamper
their effectiveness. Generally, microfinance institutions manage to mobi-
lize only a small pool of savings, have limited coverage, and have narrow
areas of operation. Furthermore, cost management has been a persistent
problem, with excessive overheads being the norm, leading to negative net
worth positions and higher probabilities of failure. Regulatory frameworks
also tend to be deficient, with consequent loss of confidence.
There is no doubt that microfinance is well placed to fill the existing gap;
hence, it is considered a complement to the formal sector, rather than a
substitute. Yet more needs to be done to render it more effective in fulfill-
ing the required mandate. Proper legal, policy, and regulatory frameworks
have to be developed. Policy makers have to build or strengthen institu-
tional capacities in order for microfinance institutions to be self-sustaining
and competitive. A few countries have gone some way in this direction. In
Benin, positive profits and self-sustenance came through expansion of
deposits and loan portfolios combined with recovery of nonperforming
loans, whereas in Ghana and Guinea, performance has improved as a
result of enhanced commercial orientation, better loan management, and
better financial reporting (Basu, Blavy, and Yulek 2004).7 There is a need
for operational skills in the different areas, particularly supervisory person-
nel who have the competence to effectively monitor the sector.
While in the short term the formal financial institutions may not be in
a position to serve marginal clientele, this should be a medium- to long-
term objective. In fact, the formal financial sector should be a catalyst in
mobilizing domestic resources. Thus, continued efforts to reform and
strengthen formal financial sectors are crucial for enhanced savings mobi-
lization from both the excluded clientele and the clientele already served.

192 CHALLENGES OF AFRICAN GROWTH
We made a case for microfinance institutions being a complement rather
than a substitute to formal finance in that they serve those members of
society that are excluded by the other sector. But there is a two-pronged
caveat to this argument. Microfinance institutions are not in a position to
fill the entire gap left by the formal sector. But more important, formal
financial institutions should have the lead in providing financial services.
In fact, Honohan and Beck (2006) argue that the formal financial sector
has a natural advantage over their informal counterparts, which emanates
BOX 5.3
Banking Sector and Savings Mobilization in Zambia
Zambia has had a very pronounced shift in its saving pattern. Starting withvery high savings rates in excess of 35 percent in 1971, Zambia currentlyhas savings rates of 18 percent, but the period in between has beenmarked by significant variability in the savings rate.
From the picture, we see a significant drop from the middle of the 1970sthat is sustained well into the 1980s before a short period of recovery. Thisdecline in the savings rate was precipitated by adverse developments in theterms of trade that turned out to be permanent because, following the 1973collapse, copper prices never recovered. Government savings collapsed
60
40
20
0
–201970
domestic saving
1980
year
dom
estic
sav
ings
/GD
P gr
owth
/m2g
dp Saving in Zambia, 1971–80
1990 2000 2010
m2gdpGDP growth

TACKLING THE CHALLENGES OF AFRICAN GROWTH 193
from its ability to provide a broader range of services and its head start on
product design and delivery. The authors argue further that considerable
progress in access of formal financial services is imminent, especially
through new technology aimed specifically at overcoming barriers to
finance in Africa.
Elsewhere in the developing world, financial institutions are being reor-
ganized to efficiently extend services to marginal clients. Through innova-
tive product design and technology, intermediaries are finding new ways
from the severe decline in copper-related revenues. In addition, wide-scaleimpoverishment of the general population emerged. Zambia went from hav-ing one of the highest per capita incomes in Sub-Saharan Africa, to beingone of the poorest countries in the region, with a per capita income of $366.This general impoverishment contributed significantly to the decline of thesavings rate as more people were reduced to levels of subsistence con-sumption. This situation was further compounded by the emergence ofmacroeconomic instability characterized by high levels of inflation.
The generally poor state of the economy also manifested in declining profitmargins, particularly for banks. To compensate, some banks took greaterrisks, which consequently led to distress in the banking system and subse-quent closure of three banks in 1995, including of the largest banks. The clo-sure of banks resulted in a general loss of confidence in the banking sector,which fell disproportionately on local banks. Unprecedented deposit with-drawals resulted from this and generated severe liquidity problems, whichprecipitated more bank failures in 1997 and 1998. The effects of these bankfailures on the savings rate are evident from the figure, as again the rate de-clined following these episodes. These failures dissipated public confidencein the banking sector, especially the local banks, and resulted in a generalflight to quality, not only from local banks to foreign banks but also from fi-nancial to nonfinancial assets. Some of these shifts were imposed by thebanking system. Anecdotal evidence suggests that Zambia is one of thecountries that suffer great bias against small depositors. Foreign banks inZambia require higher minimum balances and are reluctant to open ac-counts for individuals not in formal employment. These practices have ex-cluded a large proportion of private savings.
Source: World Bank, World Development Indicators 2005.
194 CHALLENGES OF AFRICAN GROWTH
of expanding access by providing low-cost and convenient products. This
active pursuit of small depositors recognizes that the aggregate volume of
resources is not negligible. But more important, as the innovators scale up,
large institutions are beginning to reassess their decision to stay out of
these markets Honohan and Beck (2006). There are now concerted efforts
in most of Africa to come up with innovative ways of reaching the
untapped markets (see box 5.4). The spillover of these efforts is that com-
bining technology and financial innovation to lower costs benefits the
served clientele and increases their use of formal financial services.
Public revenues in African countries are too low. In the short to medium
term, it is unlikely that the public sector will be able to mobilize significant
levels of resources. The expenditure burden that most African states shoul-
der makes it very difficult for the governments to achieve any significant
savings, particularly in the absence of sustained growth.
The low levels of public revenues in Africa are due in part to domestic
revenue bases that are too small. This is not a case that is unique to Africa
but applies to most developing countries. In particular, Tanzi and Zee
(2001) find that tax revenue as a ratio of GDP in developing countries was
18 percent, compared to 38 percent for industrial countries. This ratio is
much lower for low-income countries, but more so for low-income Africa,
with countries like Chad and Madagascar having ratios well below 10 per-
cent, while ratios for countries like Tanzania and Uganda hovered around
11 percent.
For a self-sustaining process of development, African states benefit by
enhancing public revenues. In particular, the countries that have been
enjoying reasonable growth rates will likely show some impact on public
revenues. From the figures, it is clear that for many countries, the task of
boosting government revenues is quite formidable. However, it is by no
means insurmountable.
Currently, the biggest obstacle to the mobilization effort is the ineffi-
ciency of tax systems. The systems are characterized by loose laws with
numerous loopholes that encourage and enable tax evasion. Poor enforce-
ment of tax laws is rife, hampering tax collection efforts. The complexity of
tax legislation makes identification and assessment of tax liabilities diffi-
cult. Finally, there are numerous exemptions, some of which do not serve
any beneficial purpose, that encourage corruption and are poorly targeted.
Thus, efforts at improving revenue collection should aim at simplifying
the tax systems and broadening tax bases. These reforms have been under-

TACKLING THE CHALLENGES OF AFRICAN GROWTH 195
BOX 5.4
Some Initiatives to Expand Access and Encourage Enhanced
Savings
Innovations made possible by financial engineering and information andcommunication technology offer definite opportunities to overcome someof the obstacles to doing business. In addition to having barriers removed,the innovations need to have low unit costs. Several countries are cur-rently spearheading these efforts through new measures and some re-vamped methods.
In South Africa, banks have taken decisive measures to expand provision ofbasic first-level financial services to low-income populations and other un-banked people. One such initiative is a low-cost account intended to pro-vide access to affordable banking services. The account known as Mzansiwas launched in October 2004 and is offered by the four main banks inSouth Africa. To ensure simplicity of use and also low cost, the account is abasic standardized debit-card-based transactional and savings account,with transactions limited to deposits, withdrawals, and debit card transac-tions Kirsten (2006). To ensure access, the banks have shared ATMs withina 10 kilometer radius of the clients in the townships and rural areas. Al-though the scheme is relatively new, the prognosis is good. Over the firstseven months of its existence, 1.6 million accounts were opened, with to-tal balances of some 325 million South African rand. But most important, ofthe accounts opened, more than 90 percent are held by the previously un-banked population, and about 54 percent of all accounts are held bywomen. In October 2005, a new money transfer service was added to theaccount.
The not-so-new but revamped initiative is the use of mobile banking units,which travel to areas where there are no bank branches. Equity Bank ofKenya has reintroduced mobile banking units that combine the use of vansand laptop computers linked to a branch, enabling the bank not only toreach a wider client base but also to provide a wide menu of products. Inaddition, the bank is providing saving services more adapted to the needsof low-income clientele with small, high-volume transactions. There arealso signs of possible success with considerable net savings (Honohan andBeck 2006).
196 CHALLENGES OF AFRICAN GROWTH
taken in most countries, but results have yet to be realized. Consumption
taxes have been the most common means of simplifying tax regimes. In
the past, most countries had adopted sales tax, but increasingly countries
are switching to value added tax (VAT) as an alternative that can broaden
the tax base without compromising simplicity. Generally, the VAT is a flat
rate that is levied on a broad base and exempts a few selected services and
some goods that are typically used by low-income households.
Other measures of simplifying tax systems include removing tax exemp-
tions and treating fringe benefits as part of taxable income. These measures
have been adopted in South Africa, where before some foreign companies
were exempted from some taxes as an incentive to invest in the country,
while a substantial proportion of the remuneration package was in the
form of nontaxable fringe benefits. These actions achieve both simplifica-
tion and base broadening of objectives. In addition, the reforms by South
Africa included the strengthening of the tax authority, and this has so far
been successful.
In addition, any effort to enhance public revenues will benefit from
improvement of the tax administration. Done properly and not in isolation
from other reform measures, improvement of tax administration can
increase tax collection for both direct and indirect taxes.
Many African countries have created revenue authorities with the objec-
tive of enhancing the capacity and efficiency of tax administration. Success
of these developments has been, at best, questionable. While Kenya has
had relatively high tax revenues, with an average of just over 20 percent of
GDP, most of this was realized from corporate taxes, and it was clear that
with additional reforms and other measures, there was potential to increase
income from taxes. The Kenya Revenue Authority was established as one
such measure. However, it did not result in increased ratios of tax revenue
to GDP. This failure has been attributed to the structural weaknesses of the
economy. In essence, the small size of the formal sector workforce has
meant that income taxes have a limited coverage, constraining capacity for
revenue expansion. In Tanzania and Uganda, reforms of the tax administra-
tion resulted in revenue increases, but these could not be sustained over a
longer term. Failure in both cases emanated chiefly from fiscal corruption.
A missing component of the reforms has been providing autonomy to
tax authorities. In addition, there has been a lack of political will and trans-
parency. And despite extensive reforms, tax systems remain complex in
most of Africa.

TACKLING THE CHALLENGES OF AFRICAN GROWTH 197
The recommended agenda for enhancing public revenue includes
reforms to improve tax structures and simplify tax systems. Excessive and
arbitrary taxation have been major disincentives to meeting tax obliga-
tions, while nontransparency and complex tax structures have aided cor-
ruption and encouraged tax evasion. These reforms also aim to ensure
cost-effectiveness of revenue collection, as well as to reduce excessive tax
burdens to the economies. Some of these reforms will have long-term
effects, such as the elimination of ineffective tax preferences.
Simplified tax systems and improved tax structures require proper
administration. However, tax administration reforms are more effective
when applied to transparent and less complex systems. Thus, reforming
tax structures would necessarily precede tax administration reforms.
African countries have instituted a vast menu of reforms to tax collection
mechanisms. However, there is a need to take stock, to look at what
reforms were instituted and, particularly, how these reforms were
sequenced.
Remittances
Remittances constitute a significant proportion of funds flowing to develop-
ing countries and more so in low-income countries. African countries have
received their own share of remittances, and though they are the lowest as
a proportion of remittances to the entire developing world, these flows are
still substantial. More important, remittances to Sub-Saharan African coun-
tries now exceed the flows of ODA, but they also have been found to be
more stable. As of 2004, remittances to Sub-Saharan Africa totaled $160 bil-
lion, from $58 billion in 1995, while ODA flows in 2004 were $79 billion,
relative to $59 billion in 1995 (Africa Partnership Forum 2006). Not only are
African countries receiving substantial remittances, but these have grown
very rapidly over the past decade, growing more than twofold. Within the
region, the remittances vary widely, with Nigeria receiving the highest
amount in absolute terms; however, as a percentage of GDP, Lesotho has the
highest share, at about 26 percent. These figures represent recorded transac-
tions, but anecdotal evidence suggests that the use of informal means is rife,
primarily because of high transaction costs and weaknesses in the banking
sector. Given the current situation with outward migration from Africa, it
can be reasonably expected that the remittances will remain a significant
part of the flows to Africa, at least in the medium term.

198 CHALLENGES OF AFRICAN GROWTH
The question that has been raised is whether remittances contribute to
economic growth and can therefore be considered part of the develop-
mental resources. Remittances indeed contribute to economic objectives of
recipient countries in numerous ways. There is conclusive evidence that
remittances reduce poverty as they expand the budget, allow more con-
sumption, and fund other developmental activities such as schooling.
Adams and Page (2005) show empirically that a 10 percent increase in
international remittances reduces poverty by 3.5 percent in developing
countries. But whether remittances contribute to growth depends on their
use. If they are used for consumption only, then their impact on growth is
transitory. However, if some or all of the remittances are invested, either
directly or indirectly through deposits, they have the potential to affect
growth. Again, empirical evidence and country studies show that remit-
tances are used for investment and savings and have contributed to pro-
ductive activity. Quartey (2006) shows that in Ghana about 17 percent of
remittances were used for investment purposes; most migrants invest in
activities such as small and medium enterprises and improved agricultural
supplies. Further, remittances used for activities related to education made
up 27 percent of the total. These proportions are significant and suggest
that migrant remittances have substantial long-term effects on the eco-
nomic goals of recipient countries.
Clearly, remittances are going to be an integral part of the African devel-
opmental agenda for some time to come and as such will receive a com-
mensurate part of the resource mobilization effort. In particular, the
developmental potential of remittances can be increased through meas-
ures that would not only increase the flow but also encourage a larger pro-
portion of remittances to flow through formal channels. This implies
addressing the bottlenecks that presently exist. Paramount to all this is
efforts to reduce transaction costs of remitting money. The current high
costs discourage remittances and can be regarded as a regressive tax on
migrants, who usually can afford to send only small amounts of money
(Adams and Page 2005). Evidence suggests that banks in most developing
countries have not shown any particular interest in entering the remit-
tance arena, mainly because of complicated procedures for what are, at
most, low-value transactions. Honohan and Beck (2006) conclude that
Africa is not using the formal remittance infrastructure to its full potential.
The ability to tap into remittances is hampered by the low level of access to
formal banking services. Efforts may also be aimed at enhancing the safety
TACKLING THE CHALLENGES OF AFRICAN GROWTH 199
of funds as well as improving the infrastructure, including the payment
system. Also, remittances are subject to complex paperwork and docu-
mentation that causes delays in processing transactions, and the process
could be simplified. These recommendations will improve the efficiency of
remittance services and possibly encourage an increase in remittances.
Evidence from other developing regions shows that strategic alliances
between local banks and their international correspondents or between
banks and transfer companies lower transaction costs substantially, while
financial instruments tied to remittances act as an incentive to have a larger
share flowing through the banking system. These are areas worth exploring.
Conclusions
We have laid out a set of actions that, if taken, will accelerate economic
growth in Africa. The experience of a number of African countries over the
past 10 years shows that accelerated growth is possible in a variety of set-
tings. We have pointed out how important it is for the continent as a whole
to have its largest countries—Nigeria, Ethiopia, Sudan, and the Democra-
tic Republic of Congo—make the decisions necessary to grow faster. It is
important to emphasize that each country situation is unique, with indi-
vidual constraints and opportunities. The broad strategic approaches pre-
sented here can be tailored to the specific situation of each country,
following specific analysis of each country setting. The approaches can
then be converted into specific action plans that reflect the political, social,
and economic environments.
There are lessons to be learned from the experiences of East and South
Asia, as well as from the successful countries on the continent. What does
Botswana have to teach African countries about managing mineral
wealth? What does Mauritius have to teach about export diversification?
What can be learned from Mozambique’s transformation from a postcon-
flict country to one of the fastest growing countries in the world?
Can Africa learn from the rest of the developing world, such as India?
While there is no doubt that India’s reform processes have a long way to go,
there are likely some lessons, particularly on the political economy front.
How did India reduce the regulatory burden on the private sector? What
are the underlying forces that have transformed, and are continuing to
transform, political will and attitudes toward the private sector? The emerg-

200 CHALLENGES OF AFRICAN GROWTH
ing literature on India’s reforms point to three things: the demonstration
effect of India’s success in the high-tech sector, the emergence of MBA politi-
cians who are focused on improving the productivity of the private sector,
and the realization that public revenues generated from higher rates of eco-
nomic growth may well be more beneficial than fluctuating rents. It is well
within the capabilities of several countries in Africa to replicate some fea-
tures of the Indian success story. Call centers and back-office processing
firms in Ghana and South Africa, and high-tech firms in Madagascar and
Mauritius, are all emerging as strong competitors in the international arena.
These and other firms will need the support of their governments and a
business environment that will provide a reliable supply of power and water
and a transparent system of taxation and regulation.
We have not emphasized the importance of ensuring that growth effects
are broadly shared, not only because growth that does not reduce poverty
does not meet Africa’s and the world’s goals, but also because inequality
itself undermines growth and stability. Therefore, it is vital that growth be
shared. We have also not gone into detail about a number of specific areas
that will be the subject of other Flagship studies—infrastructure, financial
markets, and agriculture. Finally, we support the expansion of aid but
emphasize the requirement of dealing with capacity constraints to make
aid effective, the importance of improved efficiency through harmoniza-
tion and alignment, and the absolute necessity to ensure that aid does no
harm, either through undermining capacity, undermining leadership, or
undermining incentives for domestic resource mobilization.
In the end, decisions must be made about priorities, specific actions, and
modes of financing. The central question is leadership. Political leadership
that makes growth the number one priority and focuses the efforts of both
government and nongovernment on achieving accelerated growth cannot
fail. None of the steps necessary to achieve levels of growth sufficient to
reduce poverty is easy. There will be political, technological, and capacity
constraints. But these can be overcome, and African countries can succeed
if the will to succeed is present.
Notes
1. The World Bank publication Global Economic Prospects, 2001 (World Bank 2001)shows that countries with increasing export share also tend to grow faster.

TACKLING THE CHALLENGES OF AFRICAN GROWTH 201
Although not a causality statement, raising export orientation of the economyconditionally also raises the probability of experiencing higher growth.
2. They include Angola, Botswana, Cape Verde, Chad, Equatorial Guinea,Liberia, Mali, Mozambique, Rwanda, Sudan, Tanzania, and Uganda.
3. These are Angola, Cape Verde, Democratic Republic of Congo, Ethiopia,Mozambique, Republic of Congo, Sierra Leone, Sudan, and Tanzania.
4. These countries include Burkina Faso, Cape Verde, Ghana, Mozambique,Senegal, Tanzania, and Uganda.
5. PPI data is from the Private Participation in Infrastructure database at: http://ppi.worldbank.org/explore/ppi_exploreRegion.aspx?regionID=1.
6. Robert Wade’s (1993) distinction between two types of government interven-tions—”leading the market” and “following the market”—is relevant here.Leading the market means that government initiates projects that private busi-ness people would not undertake at current prices (ex ante unviable at currentprices but viable at shadow prices or unviable at both current and shadowprices). Following the market means that the government assists in projectsthat the private businesses want to undertake at current prices (market-oriented dirigisme).
7. While commercial orientation is a healthy practice with visible benefits, it nev-ertheless can defeat the purpose for which microfinance is being promoted.Commercialization of institutions sometimes comes at the expense of the verypoor. There is evidence to the effect that successful microfinance tends to tar-get the higher ends of the excluded populations, as well as the populationalready served by the formal sector, leaving those in poverty outside the loop.


Estimating the Growth Model
In this appendix, we assess the importance of major factors influencing
growth, which were identified in the growth literature and discussed in
detail in chapter 4. We update the analysis conducted under the African
Economic Research Consortium (AERC) growth research to identify chan-
nels through which these drivers operated (see O’Connell and Ndulu 2000;
Ndulu and O’Connell 2006a; and Hoeffler 1999/2000). The main objective
here is not to establish causality but to infer the relative significance of the
drivers for growth and to use the results for conditional prediction by iso-
lating variation in the determinants of growth. By identifying systematic
features of the growth process and documenting their relative importance
on a global basis, growth regressions can direct country-level work into its
most productive areas (Collier and Gunning 1999).
We estimate a pooled conditional model using a least squares
approach in a global regression setting. These ordinary least squares
(OLS) regression models have very strong descriptive content and pro-
vide a reliable basis for conditional predictions within any sample drawn
from the joint distribution that produce the data at hand.1 Although the
primary objective is to determine which factors explain Africa’s growth
performance, the global regression is necessary here, partly to compen-
sate for data limitations for individual African countries, and partly to
APPENDIX
Empirical Analysis of Influential Factors of Growth
in Africa
203

204 CHALLENGES OF AFRICAN GROWTH
infer the relative importance of different factors from the global
experience.
We are aware of the many pitfalls in the use of growth regressions, par-
ticularly the problem of endogeneity—reverse causalities from growth to
the right-hand-side variables, that is, the factors affecting growth. For
example, policy variables that have been used as right-hand-side
variables—inflation, black market premium, and ratio of government
consumption to GDP—have also been found to be subject to reverse cau-
sations. These are included in the model to investigate their effects on
growth rates. However, one can expect that macroeconomic stability and
growth tend to mutually reinforce each other. Greater stability, in this
sense, reduces investment uncertainty and hence is supportive of higher
long-term growth. Conversely, strong and sustainable growth makes it
easier to achieve greater macroeconomic stability, by enhancing the sus-
tainability of domestic and foreign public debt. For this reason, OLS
regressions do not give a causal relationship; instead, they give us condi-
tional expectations. That is, the coefficients can be interpreted as condi-
tional on a given level of the included determinant prevailing/observed in
a typical country, and average growth rates are expected to be increased
or reduced to the extent of the estimated coefficient (Ndulu and O’Con-
nell 2006a).
There are primarily two sources of endogeneity: one from true
simultaneity—investment determines growth, but growth also determines
investment—and the other from the omission of key determinants that are
correlated with the included variables. Instrumental variables have often
been used to circumvent this problem. For example, instead of using
investment rate as an explanatory variable for growth, demographic vari-
ables are used. These factors affect investment in the form of national sav-
ing, and yet they are plausibly more predetermined (or slow moving) over
the five-year span of country observations. However, it is a daunting task
to find good instruments for all the potentially endogenous variables in the
growth framework.
If endogeneity arises from the omission of unobserved but time-
invariant attributes of countries, a second approach is to eliminate all cross-
country variation from the data. This can be done by estimating the
regression model using deviations from country averages (the “fixed
effects” estimator). The cost here is that many of the most important
growth determinants (for example, geography) vary more strongly across
APPENDIX: EMPIRICAL ANALYSIS OF INFLUENTIAL FACTORS OF GROWTH IN AFRICA 205
countries than within countries; a substantial amount of information is
therefore lost. Column 2 of table A.1 reports the OLS regression with
country-specific clusters, since we expect errors to be correlated for differ-
ent half-decadal observations of the same country. As suspected, the land-
locked factor drops out of significance.
Influential Factors of Growth and Data
Unless specifically mentioned, the majority of the data are derived from
the Global Development Network (GDN) database, for the period 1960
through 1997, and subsequent updates from the World Development Indi-
cators (GDF and WDI, April 2006) database. Apart from the initial condi-
tions mentioned later, the original annual data for the set of remaining
drivers are averaged over a five-year period. The dependent variable is
growth in real gross domestic product (GDP) per capita, which is the aver-
age growth rate of real GDP in constant local currency for the half-decade.
Data were supplemented using the Penn World Table (PWT) 6.1.
Human Development
Under this category we include three variables, all related to demography
and human development. One of these enters the regression in the form
of initial conditions–life expectancy, and the other two enter as half-
decadal averages of the annual data recorded for age dependency and
potential labor force growth rate.
Initial life expectancy at birth in years for the total (male and female) popu-
lation is either the data observed or recorded for each country in the first
year of each half-decade or the values linearly interpolated or extrapolated
to the initial year where necessary. Figure A.1 depicts the trend in the evo-
lution of life expectancy rates prevailing in Sub-Saharan Africa as opposed
to those in the other developing regions over the period from 1960 to
2004. The downward trend is unmistakable after the new millennium
started. Countries like the Seychelles and Mauritius maintained their
above-regional-average life expectancy rates at 71 and 68 years, respec-
tively, whereas for countries like Botswana, plagued by the AIDS epidemic,
the rates deteriorated sharply.

206 CHALLENGES OF AFRICAN GROWTH
Age dependency. Rising dependency ratios dilute the contribution of any
given real GDP growth per worker to real GDP growth per capita. Bloom
and Williamson (1998) emphasize the demographic dividend that accrued to
East Asian countries between 1960 and 2000 as a result of a falling ratio of
dependents to workers. Bloom and Sachs (1998) emphasize additional
adverse impacts operating through the discouraging effect of high depend-
ency ratios on national saving and the quality of human capital formation.
The ratio of population below age 15 or over age 65 (dependent popula-
tion) to working-age population grew steadily. The fertility rate began to
fall in Africa in the mid-1980s, suggesting entry into the final phase of the
demographic transition but at a slower pace. This observation is further
complicated by the huge impact of HIV/AIDS on life expectancies starting
in the late 1980s.
Potential labor force growth rate is defined as the difference between the aver-
age growth rate of the population of labor force age 15 to 65 and the aver-
age growth rate of the total population over each five-year period. The rate
shows persistent growth, but it has not been growing fast enough to over-
shadow the effects of high age-dependent populations. Figure A.2 shows
that this disparity remains valid even when compared with all the other
developing regions.
40
50
60
70
80
year
year
s
1960 1970 1980 1990 2000 2010
SSA other developing countries
FIGURE A.1Smoothed Average Life Expectancy at Birth
Sources: GDN 1998 and WDI 2006.

APPENDIX: EMPIRICAL ANALYSIS OF INFLUENTIAL FACTORS OF GROWTH IN AFRICA 207
Exogenous Shocks
Three clusters of exogenous shocks are grouped under this caption—income
effects of terms of trade, trading partner growth, and political instability.
Income effects of terms of trade (TOT) improvements is the half-decadal aver-
age income effect of the change in the terms of trade using the final year
of the previous half-decade as base. Higher values represent more favor-
able terms-of-trade movements. The risk-related effects of income terms of
trade are largely driven by the price volatility in the commodity market.
Given the large share of primary commodities in income generation and
export earnings in the majority of African countries, volatility in the prices
of these commodities also translate into volatility of income growth.
Although these shocks are reversible, where management of responses to
such shocks is weak or not prudent, second-round effects may be triggered
in the form of policy distortions, which tend to have more lasting effects on
growth.
The variable is defined as the product of the share of exports in GDP
pertaining to the initial year of the half-decade and the cumulative effect
1.01.52.02.53.0
1960 1970 1980 1990 2000year
a. Smoothed populationgrowth rate
234567
1960 1970 1980 1990 2000year
b. Smoothed fertility rate
60708090
100
1960 1970 1980 1990 2000year
aver
age
grow
th (%
)
aver
age
grow
th (%
)
aver
age
(%)
aver
age
birt
hspe
r wom
an
c. Smoothed age dependency ratio
�.4�.2
0.2.4.6
1960 1970 1980 1990 2000year
d. Smoothed potential laborforce growth rate
SSA other developing countries
FIGURE A.2Demographic Indicators
Sources: GDN 1998 and WDI 2006.

208 CHALLENGES OF AFRICAN GROWTH
of the changes in terms of trade, which is then averaged over the five-
year period. (Terms-of-trade data have been supplemented by data made
available from the Collins-Bosworth growth accounting data set,
updated through 2003.) For the half-decade starting in year H, this is cal-
culated as:
where TOT (H–1) is the terms of trade prevailing in the final year of the
half-decade immediately preceding the half-decade starting in year H, and
x(H) is the ratio of exports to GDP in the initial year of the half-decade:
namely year H.
Trading partner growth. Ability to engage in international markets also has
an indirect but positive impact on a country’s performance. Generally,
higher growth rates of the trading partners tend to enhance a country’s
potential benefits from cross-country productivity spillovers as well as
from increased demand for the home country’s exports. Thus, high growth
rates of a trading partner are positively correlated with the growth of a
country. Some of the effects of export expansion on growth may be com-
ing from the demand side in the short run, as captured by the terms-of-
trade variable. A long-run growth impact could also operate through either
increased investment or learning-by-doing externalities from expanded
export production. Trading-partner growth is the half-decadal average
weighted growth rate of real GDP per capita for the country’s trading part-
ners, with weights defined as the partner’s share in total imports plus
exports. The trade weights were calculated from the exports–imports data
in the IMF: Directions of Trade database.
Political instability is measured by the half-decadal period average number
of assassinations, revolutions, and general strikes occurring in a year in a
country. The data are available in the Arthur S. Banks Cross National Time-
Series Data Archive (2004).
Political instability exerts an adverse effect on security of property and
hence on investment and growth, primarily on account of the uncertainty
associated with an unstable political environment (Barro 1991). We are
aware of the reverse causality from growth to political stability discussed
widely in the existing literature; for instance, poor economic performance
ctot H x H TOT H t TOT Ht
( ) ( ) ( / ) [ln ( ) ln ( )],= × + − −1 5 1==∑
1
4

APPENDIX: EMPIRICAL ANALYSIS OF INFLUENTIAL FACTORS OF GROWTH IN AFRICA 209
may lead to government collapse and political unrest. However, our inter-
est for now is the other direction of influence.
Policy
The government can affect the economic environment for growth in at
least four major ways: by intervening in markets, by producing or distrib-
uting goods and services, by providing social overhead capital, and by
defining and/or enforcing property rights. The first two categories consti-
tute what is conventionally treated as economic policy in the growth
econometrics literature. Policy failures are at the heart of a critique of
African governance that began with Bates (1981) and the World Bank’s
Berg Report (1980) and converged in the early 1980s with the emergence
of structural adjustment lending throughout Africa and Latin America
(Ndulu and O’Connell 2006a).
The two standard indicators of the policy environment considered in
this analysis are inflation indexes and black market premium rates.
Inflation. High inflation distorts the information content of price signals,
generating large forecast errors and endangering efficiency of resource
allocation. High and unpredictable inflation discourages investment and
saving (Barro 1995), and through this channel adversely affects the growth
of economic activity. Furthermore, risk or uncertainty associated with high
and volatile inflation has adverse effects on the rate of return to capital and
investment (Bruno 1993; Pindyck and Solimano 1993), accumulation of
human capital and investment in innovations, and total factor productiv-
ity because of frequent changes in prices, which are costly to firms, and
changes in the optimal level of cash holdings by consumers (Briault 1995).
The annual inflation rate is calculated as 100*ln(1 + π), where π is the con-
sumer price index inflation rate. Data have been supplemented by the GDP
deflator series wherever necessary.
Black market foreign exchange premium. Black markets for foreign exchange
arise as a result of the imposition of exchange controls. Governments
impose exchange controls to protect international reserves, which in turn
create excess demand that needs to be satisfied at a premium in a parallel
market, thus giving incentives for the emergence of a black market for for-
eign currency. Thus, a black market premium arises when there is a deep

210 CHALLENGES OF AFRICAN GROWTH
inconsistency between domestic aggregate demand policies and exchange
rate policy, or when the government tries to maintain a low level of the
exchange rate in order to counteract a balance-of-payments crisis (Ndulu
and O’Connell 2006a). Therefore, the existence of sizable black market
premiums over long periods of time reflects a wide range of policy failures,
including unsustainable macroeconomic policy, inward-looking trade and
exchange rate regimes, and patronage-driven governance structure
(O’Connell and Ndulu 2000). Investment is encouraged if official exchange
rates are stabilized, or if there is a gradual cessation of the parallel market
and, hence, the elimination of black market exchange rate premiums.
The black market premium is the percentage excess of the annual aver-
age black market exchange rate over the annual average official exchange
rate. Parallel market exchange rate data were obtained from the Easterly,
Levine, and Roodman (2004) data set. For the years 2001–04, these data
were obtained from the Monetary Research International publication MRI
Bankers’ Guide to Foreign Currency. For both inflation and the black market
premium, we omit half-decadal observations where these take values
above 500 percent.
Government current consumption. The ratio of real government current con-
sumption (spending) to GDP is another policy indicator used in this analy-
sis. Fiscal deficits often coexist with high government spending. These
have implications for macroeconomic stability and funding with respect to
the public investment necessary to raise the absorptive capacity of the
economy and crowding-in of private investment. The ratio of real govern-
ment current consumption (spending) to real GDP, both at constant inter-
national prices, has been obtained from PWT 6.1. Data beyond 2000 have
been updated using the series: ratio of nominal government current spend-
ing to nominal GDP from the national accounts in the United Nations
Common Database (UNCDB). Figure A.3 shows that substantial differ-
ences existed in the ratio of average government spending to GDP levels
and black market exchange rates prevailing in the region over the entire
period, in contrast to the other developing regions. All three policy vari-
ables followed the same pattern as the rest of the developing world, with
average inflation rates almost identical and the black market premium
converging around 2002. Government consumption is the only policy
variable that did not bridge the gap between Africa and the rest of the
developing world.

APPENDIX: EMPIRICAL ANALYSIS OF INFLUENTIAL FACTORS OF GROWTH IN AFRICA 211
Geography. Although there are important variations across countries in the
region, for most African countries distance from their primary markets and the
high transport intensities of their products (low value–high weight and sparsely
produced) are major impediments to production and trade (Esfahani and
Ramirez 2003). The measure of geographic isolation considered in the present
analysis is the landlocked dummy variable, which takes on a value of one if the
country has zero miles of coastal boundary, and zero if it has a positive number
of coastal boundaries. Specifically, in developing countries, the attribute of being
landlocked is detrimental to presenting positive opportunities for growth by dis-
couraging investment in capital (by both foreign and domestic agents), because
of the high transport costs together with the poor infrastructure services prevail-
ing in these economies. Average growth rates of the landlocked economies in
other developing regions, for example, were 1.0 to 2.5 percent lower than the
coastal countries over the period from 1960 to 2004.
Infrastructure. Limao and Venables (2001) note that landlocked countries
are able to offset a significant proportion of their disadvantages related to
being landlocked and to sovereign fragmentation, through improvements
in their own and their transit countries’ infrastructure. Thus, ceteris paribus,
a country that is landlocked would have to incur higher transport costs
FIGURE A.3Policy Variables over Time
05
101520
020406080
16
20
24
c. Smoothed governmentconsumption/GDP
a. Smoothed inflation b. Smoothed black market premium
year
aver
age
(%)
aver
age
(%)
aver
age
(%)
year
year1960 1970 1980 1990 2000
1960 1970 1980 1990 2000 1960 1970 1980 1990 2000
SSA other developing countries
Sources: GDN 1998; WDI 2006; Easterly, Levine, and Roodman 2004; Monetary Research International 2001–2004; PWT 6.1 (Hes-ton, Summers, and Aten 2002); UNCDB 2006.

212 CHALLENGES OF AFRICAN GROWTH
and suffer the consequences of barriers of transit countries to reach the
world market. This is globally true for developing countries because a sig-
nificantly higher proportion of the intercontinental and international com-
merce takes place using water and land (intracontinental trade) rather
than the more costly air transportation.
Figure A.4 shows the significant differences prevailing in Africa and
other developing regions and the diverging trends in the evolution of one
such infrastructure stock index: telephone mainlines per 1,000 people,
from 1975 to 2004.
Initial income. Initial income is incorporated to capture the effect of the con-
ditional convergence paradigm; that is, countries that are poorer relative to
their own country-specific steady states grow faster. Hence, we expect the
sign of the coefficient to be negative, implying that the lower the level of
initial income prevailing in a certain country in 1960, the higher the poten-
tial for growth in terms of a country converging toward its own steady
state. Initial income is measured by the value of purchasing power parity
adjusted, real GDP per capita at 1996 international prices, for the first year
of each half-decade (PWT 6.1).
Table A.1 presents the pooled conditional regression results, including
the institutions and infrastructure factors. The R-squared for the original
model (1) is 0.35, implying that approximately 35 percent of the variabil-
ity of real per capita growth rates is accounted for by the included variables
FIGURE A.4Telephone Lines
0
50
100
150
200
1970 1980 1990 2000 2010
year
per 1
,000
peo
ple
22 SSA 58 other developing countries
Source: WDI 2006.

APPENDIX: EMPIRICAL ANALYSIS OF INFLUENTIAL FACTORS OF GROWTH IN AFRICA 213
in the model. The F statistics are reported below the R-squared. The F-test
for the inclusion of all the right-hand-side variables is statistically signifi-
cant for all three specifications, which means that the model’s specification
is overall significant. The p-value of the F-test also reveals that the overall
model is significant in all three cases.
TABLE A.1Regression Results
Growth in real GDP per capita(1) (2)a (3) (4)
Pooled With country With institutional With telephoneconditional model clusters quality lines per capita
ln (initial income) �1.17 �1.17 �1.66 �1.47(�0.44)** (�4.41)** (�0.76)** (�0.59)**
Life expectancy 0.06 0.06 0.02 0.04(0.25)** (2.01)* (0.08) (0.19)+
Age dependency ratio �0.04 �0.04 �0.07 �0.05(�0.29)** (�3.85)** (�0.51)** (�0.36)**
Growth of potential 0.92 0.92 0.84 1.13LF participation (0.19)** (3.27)** (0.18)** (0.24)**
Landlocked �0.58 �0.58 �0.66 �0.30(�0.08)+ (�1.52) (�0.09) (�0.04)
Trading partner growth 0.38 0.38 0.42 0.62(0.15)* (2.43)* (0.12)+ (0.20)**
Income effect of terms-of-trade 0.04 0.04 0.04 0.05changes (0.09)** (2.66)** (0.12)* (0.12)**
Political instability �0.31 �0.31 �0.16 n.a.(�0.13)** (�4.11)** (�0.08) n.a.
Inflation �0.01 �0.01 �0.01 �0.01(�0.08)* (�2.27)* (�0.12)* (�0.09)*
Black market �0.01 �0.01 �0.00 �0.01premium (�0.14)** (�3.79)** (�0.08) (�0.17)**
Government consumption/GDP �0.03 �0.03 �0.02 �0.01(�0.11)** (�2.24)* (�0.08) (�0.05)
African coastal economies �0.87 �0.87 �1.90 �0.91(�0.12)** (�2.09)* (�0.29)** (�0.13)*
International Country Risk Guide n.a. n.a. 0.18 n.a.n.a. n.a. (0.27)** n.a.
Telephone lines per capita n.a. n.a. n.a. 2.09n.a. n.a. n.a. (0.15)+
Constant 10.91 10.91 17.41 13.25(3.88)** (4.15)** (7.04)** (4.79)**
Observations 687 687 312 513R-squared 0.35 0.35 0.35 0.31F-stat 17.56 11.04 9.91 13.26p-value (prob > F) 0.0000 0.0000 0.0000 0.0000
Source: Author calculations based on specific data in the appendix.
Note: n.a. = not applicable. Normalized beta coefficients in parentheses.
a. Robust t statistics in parentheses.
+ Significant at 10%; * significant at 5%; ** significant at 1.

214 CHALLENGES OF AFRICAN GROWTH
Results
The estimated coefficients of the original model (1) are discussed in this
section. The estimates of the other models in table A.1 have similar inter-
pretations. All variables included in the regression have expected signs and
are significant at least at the 10 percent level or less, with nine out of the
12 included variables (not including the half-decadal dummy variables)
significant at 1 percent. What comes out quite strongly is the powerful
influence of demographic and opportunity variables (location and trading
partners’ growth).
From the table, we can see that initial income affects the growth rate
negatively as expected, consistent with the conditional convergence effect.
For example, if other factors were constant and if the initial income level
of a country was lower by $1 at international prices, its growth would rise
by 1.2 percent.
Life expectancy has a significant positive effect. One more year of life
expectancy achieved by a country would raise the growth rate by 0.06 per-
cent. Both indicators of demography have the expected impact on growth,
with highly significant coefficients. Age dependency has a negative impact
of 0.05 percent, while growth of the potential labor force is expected to
increase economic growth by 0.92 percent.
A rise in the trading partner growth rate is a positive shock to the econ-
omy. A 1 percent rise in the growth rate of a country’s trading partner is
associated with an increase in the country’s growth rate by 0.4 percent.
The result also supports the hypothesis that an outward-oriented economy
can gain more by exploiting the potential gains from trade, especially in
the form of technology transfers and specialization of inputs of production.
Income effects of terms of trade likewise have the expected effect on
growth, though with a very small positive coefficient. The result confirms
the importance of first-order effects of terms-of-trade changes, particularly
for primary commodity-dependent economies. Finally, as expected, an
increase in political instability reduces growth, with a negative coefficient
of 0.3 percent.
All three macroeconomic indicators have their expected significant
effects. A 1 percent rise in inflation or black market premium rate nega-
tively affects growth by 0.01 percent, while a 1 percent increase in the
ratio of government consumption to GDP is associated with a reduction in
growth by 0.03 percent. The estimates confirm the expectations that high

APPENDIX: EMPIRICAL ANALYSIS OF INFLUENTIAL FACTORS OF GROWTH IN AFRICA 215
inflation indexes are related, with greater risk and hence uncertainty about
investment decisions, while increasing government consumption has its
implications for existence of commensurate fiscal instability.
As expected, being a landlocked country exerts a negative and signifi-
cant influence on growth at the global level. Ceteris paribus, if there were a
1 percent greater chance of a country being landlocked, its growth rate
would decline by 0.6 percent.
Finally, the negative coefficient for the dummy variable capturing the
effect of being an African coastal economy represents a lost opportunity.
African economies have been unsuccessful in exploiting their positive
opportunities for growth; that is, countries that are endowed with greater
proximity and accessibility to the world market for trade and commerce
are unable to grow as fast as coastal economies in the rest of the world
(Collier and O’Connell 2006).
The results of the pooled conditional model previously discussed give us
an idea of how each factor affects growth. While it is clear that all the driv-
ers have some part in explaining growth performance, we are also aware
that some variables would be considerably more important than others,
even though in the pooled conditional regression, the size of the estimates
implies otherwise. Therefore, to better inform policy making, we need to
know the strengths of these factors relative to all included variables. For this
purpose, we use the beta coefficients reported in table A.1.2 With beta coef-
ficients, all the variables are standardized and the units of measurement are
the same. Thus, the relative magnitudes of these coefficients have a mean-
ingful interpretation, which allows us to make conclusions about which
driver contributed the most to explaining the growth performance.
The strengths of individual factors for predicting growth range from as
high as 0.44 percent to as low as 0.08 percent. It is apparent that, globally,
initial income has the strongest explanatory power for predicted growth.
This implies that the relatively low income status of many of the African
countries potentially provides its most powerful motor for accelerating
growth to the levels required to meet the Millennium Development Goals
(MDGs). The estimated beta coefficients for the cluster of demographic
variables follow next, at -0.29 percent for age dependency, followed by ini-
tial life expectancy at 0.25 percent and labor force participation at 0.19
percent. Trading partner growth, black market premium, political instabil-
ity, and ratio of government consumption spending to GDP rank next in
that order. The rest have beta coefficients of less than 10 percent.

216 CHALLENGES OF AFRICAN GROWTH
In terms of clusters of the growth drivers, the three demographic
variables—age dependency, life expectancy, and growth of labor force par-
ticipation, have the strongest influence on growth. This calls for a particu-
larly strong focus on the demographic transition in Africa. Risk and
openness to trade are the next strongest cluster of drivers, but almost sim-
ilar to the strength of the cluster of policy variables.
Models (3) and (4) look at two additional factors that have been known
to drive growth in the positive direction in the existing literature, but we
do not have data for those factors for the entire 45 years of the African
growth experience. In column (3), growth model (1) is presented, along
with an index of institutional quality, which incorporates perceptions of
corruption, law and order, and quality of bureaucracy as indicators of the
institutional environment prevailing in a country. Data on this index go
back only until 1984. Higher values of this index are expected to exert a
positive effect on growth rates, since the index not only favors accumula-
tion of human and physical capital by attracting more private investment
on account of a better investment climate, but it also improves productiv-
ity of labor and capital for both public and private investment through the
synergistic effects of diffusion of technology and skills. Results in column
(3) can be interpreted as an increase in this index by one unit, leading to a
rise in predicted growth rates by 0.18 percent. Political instability and some
of the policy variables are correlated with this institution’s index, since
they have an adverse effect on private property rights and are related to
corruption and perceptions of rule of law, resulting in these variables
falling out of significance.
In column (4) of table A.1, we consider another factor that has been
known to be crucial in terms of driving growth in a favorable direction.
Provision of social overhead capital, including public investments in trans-
portation and communications infrastructure, primary education, and
health, is a vital function of a growth-promoting government (Ndulu and
O’Connell 2006a). Internal infrastructure stocks, such as telephone main-
lines per capita and road density, are expected to improve growth perform-
ance because they serve to promote capital and labor accumulation by
raising the standards of investment climate prevailing in a country at the
same time as boosting productivity of factors of production. Data on tele-
phone mainlines per capita are available from 1975 onward. In column
(4), the variable’s coefficient is interpreted as an increase in this communi-
cations infrastructure asset by one unit, leading to an increase of expected

APPENDIX: EMPIRICAL ANALYSIS OF INFLUENTIAL FACTORS OF GROWTH IN AFRICA 217
growth rates by 2.09 percent. The impact of a country being landlocked
falls out of significance because of its correlation with this infrastructure
variable.
Notes
1. Ndulu and O’Connell (2006a, 16) explain that the fundamental assumptionsbehind estimating a pooled, conditional model are that the observations fordifferent countries and time periods are governed by the same joint distribu-tion of variables and that OLS estimation provides a good approximation ofthe expected value of growth conditional on observed determinants(Wooldridge 2003).
2. The beta coefficients can be obtained by transforming the growth and all theincluded determinants, subtracting their respective means, dividing by thestandard deviation, and then fitting the least squares regression on the trans-formed data.


Acemoglu, D., S. Johnson, and J. Robinson. 2001. “The Colonial Origins of Com-parative Development: An Empirical Investigation.” American Economic Review91 (December): 1369–1401.
———. 2003. “An African Success Story: Botswana.” In Search of Prosperity: AnalyticNarratives on Economic Growth, ed. Dani Rodrik, 80–119. Princeton, NJ: PrincetonUniversity Press.
Adams, R., and J. Page. 2005. “The Impact of International Migration and Remit-tances on Poverty.” World Development 33 (10): 1645–69.
AERC (African Economic Research Consortium). Forthcoming. The Political Econ-omy of Economic Growth in Africa, 1960–2000, ed. Benno Ndulu, Stephen O’Con-nell, Robert Bates, Paul Collier, and Charles Soludo. Cambridge, UK: CambridgeUniversity Press.
AfDB (African Development Bank). 1999. African Development Report 1999. Oxford,UK: Oxford University Press for the African Development Bank.
AfDB/OECD (Organisation for Economic Co-operation and Development). 2005.“African Economic Outlook.” Development Centre, Paris. http://www.oecd.org/dataoecd/35/20/36739479.pdf.
Africa Partnership Forum. 2006. “Resources for Development in Africa.” Paperprepared for the African Partnership Forum Meeting in Moscow, October 2006.
Agu, C. C. 2004. “Efficiency of Commercial Banking in the Gambia.” In AfricanReview of Money Finance and Banking, 2004 issue: 31–50.
Alawode, Abayomi A. 2003. “Analyzing Financial and Private Sector Linkages inAfrica.” Africa Region Working Paper 43, World Bank, Washington, DC.
Bibliography
219
220 CHALLENGES OF AFRICAN GROWTH
Allen, Donald S., and Léone Ndikumana. 2000. “Financial Intermediation andEconomic Growth in Southern Africa.” Journal of African Economies 9 (2):132–60.
Amjadi, Azida, and Alexander J. Yeats. 1995. “Have Transport Costs Contributed tothe Relative Decline of Sub-Saharan African Exports? Some Preliminary Empir-ical Evidence.” Policy Research Working Paper 1559, World Bank, Washington,DC.
Andersen, Thomas Barnebeck, and John Rand. 2005. “Mice Do Not Take Bribes.”Discussion Paper, University of Copenhagen, Denmark.
Anoruo, Emmanuel, and Yusuf Ahmad. 2001. “Causal Relationship betweenDomestic Savings and Economic Growth: Evidence from Seven African Coun-tries.” African Development Bank.
Apraku, K. K. 1991. African Emigres in the United States. A Missing Link in Africa’sSocial and Economic Development. New York: Praeger.
Artadi, Elsa V., and Xavier Sala-i-Martin. 2003. “The Economic Tragedy of the XXthCentury: Growth in Africa.” Working Paper 9865, National Bureau of EconomicResearch, Cambridge, MA.
Aryeetey, Ernest. 2004. “Household Asset Choice among the Rural Poor in Ghana.”Institute of Statistical, Social and Economic Research, University of Ghana.
Aryeetey, Ernest, and Lemma W. Senbet. 2004. “Essential Market Reforms inAfrica.” Technical Publication 63, Institute of Statistical, Social and EconomicResearch, University of Ghana.
Aryeetey, Ernest, and Christopher Udry. 1998. “Household Asset Choice in Ghana.”Institute of Statistical, Social and Economic Research, University of Ghana.
———. 2000. “Saving in Sub-Saharan Africa.” Working Paper 38, Center for Inter-national Development, Harvard University, Cambridge, MA.
Atieno, Rosemary. 2001. “Formal and Informal Institutions’ Lending Policies andAccess to Credit by Small-Scale Enterprises in Kenya: An Empirical Assess-ment.” Research Paper 111, African Economic Research Consortium, Nairobi.
Azam, Jean-Paul. 1995. “How to Pay for the Peace? A Theoretical Framework withReferences to African Countries.” Springer Public Choice 83(1–2) April: 173–84.
———. 2005. “Political Geography and Redistribution.” Paper prepared for theAfrican Economic Research Consortium/Harvard University workshop onExplaining African Economic Growth, 1960–2000, Weatherhead Center forInternational Affairs, March 18–19, 2005.
———. 2006. “Aid and the Delegated Fight against Terrorism.” Review of Develop-ment Economics 10 (2) April: 330–44.
Barro, Robert J. 1991. “Economic Growth in a Cross-Section of Countries.” Quar-terly Journal of Economics 106 (2) May: 407–43.
———. 1995. Determinants of Economic Growth. London: The MIT Press.
BIBLIOGRAPHY 221
———. 1999. “Notes on Growth Accounting.” Springer Journal of Economic Growth4 (2) June: 119–37.
Barro, Robert J., and Jong-Wha Lee. 1993. “International Comparisons of Educa-tional Attainment.” Journal of Monetary Economics 32 (3) December: 363–94.
Barro, Robert J., and Xavier Sala-i-Martin. 1995. Economic Growth. New York:McGraw-Hill.
Basu, A., R. Blavy, and M. Yulek. 2004. “Micro Finance in Africa: Experience andLessons from Selected African Countries.” Working Paper 04/174, InternationalMonetary Fund, Washington, DC.
Bates, Robert H. 1981. Markets and States in Tropical Africa: The Political Basis of Agri-cultural Policies. Berkeley, CA: University of California Press.
———. 2006. “Institutions and Development.” Journal of African Economies 15 (1):10–61.
Beck, Thorsten, Asli Demirguc-Kunt, and Maria Soledad Martinez Peria. 2005.“Reaching Out: Access to and Use of Banking Services across Countries.” Draft,World Bank, Washington, DC.
Berthelemy, Jean-Claude, and Ludvig Soderling. 2001. “The Role of Capital Accu-mulation, Adjustment and Structural Change for Economic Take-Off: Empiri-cal Evidence from African Growth Episodes.” World Development 29 (2):323–43.
———. 2002. “Will There Be New Emerging-Market Economies in Africa by theYear 2020?” Working Paper 02/131, International Monetary Fund, Washing-ton, DC.
Bhattacharya, Amar, Peter J. Montiel, and Sunil Sharma. 1997. “How Can Sub-Saharan Africa Attract More Private Capital Flows?” Finance and Development 34(June): 3–6.
Biggs, Tyler, and Manju Shah. 2006. “African SMEs, Networks and ManufacturingPerformance.” Journal of Banking and Finance 30 (11): 3043–66.
Bigsten, Arne, and Måns Söderbom. 2005. “What Have We Learned from a Decadeof Manufacturing Enterprise Surveys in Africa?” Policy Research Working Paper3798, World Bank, Washington, DC.
———. 2006. “What Have We Learned frim a Decade of Manufacturing EnterpriseSurveys in Africa?” The World Bank Research Observer 2006 21(2): 241–65.
Blattman, Christopher, Jason Hwang, and Jeffrey G. Williamson. 2004. “TheImpact of the Terms of Trade on Economic Development in the Periphery,1870–1939: Volatility and Secular Change.” Working Paper 10600, NationalBureau of Economic Research, Cambridge, MA.
Bloom David E., David Canning, and Jaypee Sevilla. 2001. “Economic Growth andthe Demographic Transition.” Working Paper 8685. National Bureau of Eco-nomic Research, Cambridge, MA.

222 CHALLENGES OF AFRICAN GROWTH
Bloom, David, and Jeffrey D. Sachs. 1998. “Geography, Demography, and Eco-nomic Growth in Africa.” Brookings Papers on Economic Activity 2: 207–73.
Bloom, David, and Jeffrey G. Williamson. 1998. “Demographic Transitions andEconomic Miracles in Emerging Asia.” World Bank Economic Review 12(3):419–55.
Bollag, Burton. 2004. “Improving Tertiary Education in Sub-Saharan Africa: ThingsThat Work.” Africa Region Human Development Working Paper, World Bank,Washington, DC.
Bonaglia, Braga de Macedo, and Maurizio Bussolo. 2001. “How GlobalizationImproves Governance.” Discussion Paper 2992, Center for Economic and PolicyResearch, London, UK.
Borensztein, E., J. De Gregorio, and J-W. Lee. 1998. “How Does Foreign DirectInvestment Affect Economic Growth?” Elsevier Journal of International Economics45 (1) June: 115–35.
Bosworth, Barry, and Susan Collins. 2003. “The Empirics of Growth: An Update.”Brookings Papers on Economic Activities 2 (Sept. 22): 113–79.
Braga, Carlos A. Primo. 2006. “The Doha Development Agenda: An Update.” Pre-sentation for Vietnam: Trade Policy and World Trade Organization Accession,May 15, 2006.
Briault, C. 1995. “The Costs of Inflation.” Bank of England Quarterly Bulletin Febru-ary: 33–45.
Briceno, C., Antonio Estache, and Nemat Shafik. 2004. “Infrastructure Services inDeveloping Countries: Access, Quality, Costs, and Policy Reform.” PolicyResearch Working Paper, World Bank, Washington, DC.
Bruno, Michael. 1993. “Inflation and Growth in an Integrated Approach.” Work-ing Paper 4422, National Bureau of Economic Research, Cambridge, MA.
Brynjolfsson, Erik, and Lorin M. Hitt. 2000. “Beyond Computation: InformationTechnology, Organizational Transformation and Business Performance.” Journalof Economic Perspectives 14 (4): 23–48.
Bulatao, Rodolfo A. 1998. “The Value of Family Planning Programs in DevelopingCountries.” Rand Corporation, Santa Monica, CA.
Burnside, Craig, and David Dollar. 2000. “Aid, Policies, and Growth.” American Eco-nomic Review, American Economic Association 90 (4) September: 847–68.
Calderon, Cesar, and Luis Serven. 2004. “The Effects of Infrastructure Develop-ment on Growth and Income Distribution.” Policy Research Working Paper3400, World Bank, Washington, DC.
Carrington, W. J., and E. Detragiache. 1999. “How Extensive Is the Brain Drain?”Finance and Development: A Quarterly Magazine of the IMF 36 (2).
Carter, Gwendolen M., ed. 1962. African One-Party States. Ithaca, NY: Cornell Uni-versity Press.
BIBLIOGRAPHY 223
———., ed. 1963. Five African States: Responses to Diversity. Ithaca, NY: Cornell Uni-versity Press.
———., ed. 1966. National Unity and Regionalism in Eight African States. Ithaca, NY:Cornell University Press.
Casterline, J., and S. Sinding. 2000. “Unmet Need for Family Planning in Develop-ing Countries and Implications for Population Policy.” Policy Research DivisionWorking Paper 135, The Population Council, New York.
Chandra, Vandana, ed. 2006. Technology, Adaptation and Exports—How Some Develop-ing Countries Got It Right. Washington, DC: World Bank.
Chandra, Vandana, and Shashi Kolavalli. 2006. “Technology, Adaptation, andExports—How Some Developing Countries Got It Right.” In Technology, Adapta-tion and Exports—How Some Developing Countries Got It Right ed. Vanadana Chan-dra, 1–48. Washington, DC: World Bank.
Chigumira, Gibson, and Nicolas Masiyandima. 2003. “Did Financial Sector ReformResult in Increased Savings and Lending for the SMEs and the Poor?” ResearchPaper 03–7, International Labour Organization.
Chirwa, Ephraim W., and Montfort Mlachila. 2004. “Financial Reforms and InterestRate Spreads in the Commercial Banking System in Malawi.” IMF Staff Papers 51 (1).
Cleaver, F. 2000 “Participatory Development at the World Bank: The Primacy ofProcess.” In Participation: the New Tyranny? ed. B. Cooke and U. Kothari. London:Zed Books.
Coe, David T., Elhanan Helpman, and Alexander W. Hoffmaister. 1997. “North-South R&D Spillovers.” Economic Journal 107 (440) January: 134–49.
Collier, Paul. 1991. “Africa’s External Relations: 1960–1990.” African Affairs 90:339–56.
———. 1999. “On the Economic Consequences of Civil War.” Oxford Economic Papers51 (1): 168–183.
———. 2000. “Ethnicity, Politics and Economic Performance.” Economics and Politics12 (3) November: 225–45.
———. 2002. “Implications of Ethnic Diversity.” Economic Policy 32 (April):129–66.
Collier, Paul, and David Dollar. 2002. “Globalization, Growth, and Poverty: Build-ing an Inclusive World Economy.” World Bank and Oxford University Press,Washington, DC; London.
Collier, Paul, and Jan Willem Gunning. 1999. “Explaining African Economic Per-formance.” Journal of Economic Literature 37 (March): 64–111.
Collier, Paul, and Anke Hoeffler. 2000. “Greed and Grievance in Civil War.” PolicyResearch Working Paper 2355, World Bank, Washington, DC.
———. 2002. “On the Incidence of Civil War in Africa.” Journal of Conflict Resolution46 (1): 13–28.
224 CHALLENGES OF AFRICAN GROWTH
———. 2004. “Greed and Grievance in Civil War.” Oxford Economic Papers 56(4)October: 563–95.
———. 2006. “Military Expenditure in Post Conflict Societies.” Economics of Gover-nance, vol. 7, no. 1. 88–107.
Collier, Paul, Anke Hoeffler, and Catherine Pattillo. 1999. “Flight Capital as a Port-folio Choice.” Policy Research Working Paper 2066, World Bank, Washington,DC. http://ssrn.com/abstract=569197.
Collier, Paul, and Stephen A. O’Connell. 2006. “Opportunities and Choices.” DraftChapter 2 of the synthesis volume of the African Economic Research Consor-tium’s Explaining African Economic Growth project.
Collins, Susan M., and Barry P. Bosworth. 1996. “Economic Growth in East Asia:Accumulation versus Assimilation.” Brookings Papers on Economic Activity 2:135–203.
Cramer, Chris. 1999. “The Economics and Political Economy of Conflict in Sub-Saharan Africa.” CDPR Discussion Paper 1099, School of Oriental and AfricanStudies, University of London.
Daumont, Roland, Francoise Legall, and François Leroux. 2004. “Banking in Sub-Saharan Africa: What Went Wrong?” Working Paper 04/55, International Mon-etary Fund, Washington, DC.
Deaton, A. S. 1992. “Saving and Income Smoothing in Côte d’Ivoire.” Journal ofAfrican Economies 1 (1): 1–24.
Dehn, Jan. 2000. “Commodity Price Uncertainty and Shocks: Implications forInvestment and Growth.” PhD dissertation, 232, Oxford University.
Devarajan, Shantayanan, Margaret J. Miller, and Eric V. Swanson. 2002. “Goals forDevelopment: History, Prospects and Costs.” Policy Research Working Paper2819, World Bank, Washington, DC.
Dick, Astrid. 1999. “Banking Spreads in Central America: Evolution, Structure andBehavior.” Development Discussion Paper 694, Harvard Institute for Interna-tional Development, Cambridge, MA.
Easterly, William. 2001. Global Development Network Growth Database (GDN1998). World Bank, Washington, DC.
Easterly, William, Michael Kremer, Lant Pritchett, and Lawrence Summers. 1993.“Good Policy or Good Luck?” Journal of Monetary Economics 32 (3): 459–83.
Easterly, W., and Ross Levine. 1997. “Africa’s Growth Tragedy: Policies and EthnicDivisions.” Quarterly Journal of Economics 112 (4) November: 1203–50.
———. 1998. “Troubles with the Neighbours: Africa’s Problem, Africa’s Opportu-nity.” Journal of African Economies 7 (1): 120–42.
———. 2003. “Tropics, Germs, and Crops: The Role of Endowments in EconomicDevelopment.” Journal of Monetary Economics 50 (January): 1.
Easterly, William, Ross Levine,and David Roodman. 2004. “Aid, Policies, and
BIBLIOGRAPHY 225
Growth: Comment,” American Economic Review, American Economic Associa-tion, vol. 94(30):774-780, June.
Eatwell, J. 1996. Global Unemployment Loss of Jobs in the 90s. New York: M. E. Sharpe.
Economic Commission for Africa. 2000. “Finance and Development in Africa.”Issues Paper for the Eighth Session of the ECA Conference of Ministers ofFinance, Addis Ababa, November 21.
Edwards, Sebastian. 2001 “Information Technology and Economic Growth in theEmerging Economies.” http://www.anderson.ucla.edu/faculty/sebastian.edwards/.
Edwards, S., and Henry Ford. 2001. “Information Technology and EconomicGrowth in the Emerging Economies.” Unpublished manuscript.
Eifert, Benn, Alan Gelb, and Vijaya Ramachandran. 2005. “Business Environmentand Comparative Advantage in Africa: Evidence from the Investment ClimateData.” Working Paper 56, Center for Global Development, Washington, DC.
Elbadawi, Ibrahim, Taye Mengistae, and Albert Zeufack. 2002. “Geography, SupplierAccess, Foreign Market Potential, and Manufacturing Exports in Developing Coun-tries: An Analysis of Firm Level Data.” Policy Research Working Paper, WorldBank, Washington DC. http://www.csae.ox.ac.uk/conferences/ 2001NIRaFBiA/PDFS/elbadawi_meg_zeu.pdf.
Elbadawi, Ibrahim, and F. Mwega. 2000. “Can Africa’s Saving Collapse BeReversed?” World Bank Economic Review 14 (3): 415–43.
Elbadawi, Ibrahim, and N. Sambanis. 2000. “Why Are There So Many Civil Warsin Africa?” Journal of African Economies 9 (3): 244–69.
Ersado, Lire, Jeffrey Alwang, and Harold Alderman. 2000. “Changes in Consump-tion and Saving Behavior Before and After Economic Shocks: Evidence fromZimbabwe.” Paper Presented at the International Food and Agribusiness Man-agement Association Conference, Chicago, IL, June 25.
Esfahani, Hadi Salehi, and Maria Teresa Ramirez. 2003. “Institutions, Infrastruc-ture and Economic Growth.” Journal of Development Economics 70 (2): 443–77.
Estache, Antonio. 2004. “Emerging Infrastructure Policy Issues in DevelopingCountries—A Survey of the Recent Economic Literature.” Policy ResearchWorking Paper 3442, World Bank, Washington, DC.
———. 2005. “PPI Partnerships vs. PPI Divorces in LDCs.” Policy Research Work-ing Paper 3470, World Bank, Washington, DC.
———. 2006. “Infrastructure: A Survey of Recent and Upcoming Issues.” Paperpresented to the ABCDE Conference, Tokyo, May 29.
Estache, Antonio, and Ana Goicoechea. 2005. “How Widespread Were PrivateInvestment and Regulatory Reform in Infrastructure Utilities during the1990s?” Policy Research Working Paper 3595, World Bank, Washington, DC.
Estache, Antonio, Ana Goicoechea, and Marco Manacorda. 2006. “Telecommuni-

226 CHALLENGES OF AFRICAN GROWTH
cations Performance, Reforms, and Governance.” Policy Research WorkingPaper 3822, World Bank, Washington, DC.
Estache, Antonio, and M. E. Pinglo. 2004. “Are Returns to Public-Private Infra-structure Partnerships in Developing Countries Consistent with Risks since theAsian Crisis?” Policy Research Working Paper 3373, World Bank, Washington,DC.
Faber, M. 1997. “Botswana’s Somnolent Giant: The Public Debt Service Fund—ItsPast, Present and Possible Future.” In Aspects of the Botswana Economy: SelectedPapers, ed. J. S. Salkin et al. Oxford, UK: James Curry.
Fafchamps, Marcel. 2004. Market Institutions in Sub-Saharan Africa. Cambridge, MA:MIT Press.
Fay, Marianne, and Tito Yepes. 2003. “Investing in Infrastructure: What Is Needed from2000 to 2010?” Policy Research Working Paper 3102, World Bank, Washington, DC.
FinScope. 2005. “Botswana, Namibia, Lesotho, and Swaziland Pilots.” www.finscope.co.za.
Fisman, Raymond J., and Roberta Gatti. 2000. “Decentralization and Corruption:Evidence across Countries.” Policy Research Working Paper 2290, World Bank,Washington, DC. http://ssrn.com/abstract=629144.
Fjeldstad, Odd-Helge, and Lise Rakner. 2003. “Taxation and Tax Reforms in Devel-oping Countries: Illustrations from Sub-Saharan Africa.” Paper Presented at aseminar organized by the Norwegian Agency for Development Co-operation,Oslo, April 24, 2003.
Fofack, Hippolyte. 2005. “Nonperforming Loans in Sub-Saharan Africa: CausalAnalysis and Macroeconomic Implications.” Policy Research Working Paper3769, World Bank, Washington, DC.
Foroutan, Faezeh, and Lant Pritchett. 1993. “Intra-Sub-Saharan African Trade: Is ItToo Little?” Journal of African Economies 2 (1) May: 74–105.
Frankel, Jeffrey A., and David Romer. 1999. “Does Trade Cause Growth?” Ameri-can Economic Review 89 (3) June: 379–99.
Fraser, Ashley, Russell Green, and Megan Dunbar. 2002. “Costing Cairo: An Anno-tated Bibliography of the Cost Literature on ICPD Programme of Action Com-ponents in Sub-Saharan Africa.” Bay Area International Group, University ofCalifornia, Berkeley, CA.
Freeman, C. 1991. “Networks of Innovators: A Synthesis of Research Issues.”Research Policy 20: 499–514.
Gallup, John Luke, Jeffrey D. Sachs, and Andrew Mellinger. 1999. “Geography andEconomic Development.” In Annual World Bank Conference on Development Eco-nomics 1998, ed. Boris Plescovic and Joseph E. Stiglitz. Washington, DC: WorldBank.
Gatti, Roberta. 1999. “Corruption and Trade Tariffs, or a Case for Uniform Tariffs.”Unpublished manuscript.
BIBLIOGRAPHY 227
Gelb, Alan. 2000. Can Africa Claim the 21st Century? Washington, DC: World Bank.
———. 2006. “Costs and Competitiveness in Africa.” PSD Forum June 2006, WorldBank, Washington, DC. http://rru.worldbank.org/Documents/ PSDFo-rum/2006/alan_gelb.pdf.
Gelb, Alan, et al. 2007. “What Matters to African Firms? Evidence from the Invest-ment Climate Surveys.” Unpublished manuscript.
Glaeser, E, R. La Porta, F. Lopez-de-Silanes, and A. Shleifer. 2004. “ExplainingGrowth: Institutions, Human Capital, and Leaders.” Paper presented at theBrookings Panel, March 2004.
Gleditsch, Nils Petter, Peter Wallensteen, Mikael Eriksson, Margareta Sollenberg,and Håvard Strand. 2002. “Armed Conflict 1946–2001: A New Dataset.” Journalof Peace Research 39 (5): 615–37.
Government of Zambia. 2006. “Public Financial Management Performance Reportand Performance Indicators.” Lusaka, Zambia.
Guillaumont, Patrick, Sylviane Guillaumont Jeanneney, and Jean-Francois Brun.1999. “How Instability Lowers African Growth.” Journal of African Economies8(1) March: 87–107.
Gupta, Sanjeev, Robert Powell, and Yongzheng Yang. 2005. “The MacroeconomicChallenges of Scaling Up Aid to Africa.” Working Paper 054/179, InternationalMonetary Fund, Washington, DC.
Haddad, Lawrence James, Harold Alderman, Simon Appleton, Lina Song, andYisehac Yohannes. 2002. “Reducing Child Undernutrition: How Far DoesIncome Growth Take Us?” FCND Discussion Paper 137, International Food Pol-icy Research Institute, Washington, DC.
Hall, Robert J., and Robert Jones. 1999. “Why Do Some Countries Produce So MuchMore Output Than Others?” Quarterly Journal of Economics 114 (1): 83–116.
Hamdok, A. 2002. “Governance and Policy in Africa: Recent Experiences.” InReforming Africa’s Institutions: Ownership, Incentives and Capabilities, ed. SteveKayizi-Mugerwa. Tokyo, Japan: United Nations University Press.
Hanushek, Eric A., and Dongwook Kim. 1995. “Schooling, Labor Force Quality,and Economic Growth.” Working Paper 5399, National Bureau of EconomicResearch, Cambridge, MA.
Haque, Nadeem Ul, and M. Ali Khan. 1997. “Institutional Development: SkillTransference through a Reversal of ‘Human Capital Flight’ or Technical Assis-tance.” Working Paper 97/89, International Monetary Fund, Washington, DC.
Haque, Ul. N., and J. Aziz. 1998. “The Quality of Governance: ‘Second–Generation’Civil Service Reform in Africa.” Working Paper 164, International MonetaryFund, Washington, DC.
Hejazi, W., and E. Safarian. 1999. “Trade, Foreign Direct Investment, and R&DSpillovers.” Journal of International Business Studies 30: 491–511.

228 CHALLENGES OF AFRICAN GROWTH
Heston, Alan, Robert Summers, and Bettina Aten. 2002. “Penn World Table Ver-sion 6.1.” Center for International Comparisons at the University of Pennsylva-nia (CICUP).
Ho, Kong Weng, and Hian Teck Hoon. 2006. “Growth Accounting for a Follower-Economy in World Ideas: The Example of Singapore.” Working Paper 15-2006,Singapore Management University, Singapore.
Hoeffler, A. 1999/2000. “The Augmented Solow Model and the African GrowthDebate.” Centre for the Study of African Economies, University of Oxford. Back-ground paper, revised April 2000.
Honohan, Patrick, and Thorsten Beck. 2006. Making Finance Work for Africa. Wash-ington, DC: World Bank.
Iimi, Atsushi. 2006. “Did Botswana Escape from the Resource Curse?” WorkingPaper 06/138, International Monetary Fund, Washington, DC.
Ikhide, S. 1996. “Commercial Bank Offices and the Mobilization of Private Savingsin Selected Sub-Saharan African Countries.” Journal of Development Studies 33 (1).
IMF. 2005. Economic Data Sharing System (EDSS). International Monetary Fund,Washington, DC.
Inter Press News Agency. September 19, 2006. “Health Africa: There Hasn’t BeenAdequate Emphasis on Family Planning.” Inter Press News Agency. http://ipsnews.net.
Ishikawa, S. 2006. “Comments on the World Bank’s New Growth Strategies forSub-Saharan Africa.” Professor Emeritus, Hitotsubashi University, Tokyo.
Jones, B. F., and B. A. Olken. 2004. “Do Leaders Matter? National Leadership andGrowth since World War II.” Working Paper, Harvard University, Cambridge,MA.
Jorgenson, Dale W. 2001. “Information Technology and the U.S. Economy.” Amer-ican Economic Review 91 (1) March: 1–32.
Jorgenson, Dale W., and Kevin Stiroh. 1999. “Information Technology andGrowth.” American Economic Review 89 (2): 109–115.
Juma, Calestous. 2006. “Reinventing Growth.” In Going for Growth: Science, Technol-ogy and Innovation in Africa, ed. Calestous Juma. London: The Smith Institute.
Kahn, Qaiser, Yaniv Stopnitzky, and Syed Rashed El Zayed. 2006. “Reaping thebenefits of Girls’ Secondary Education in Bangladesh—Impact on Fertility andMalnutrition.” Presentation at the World Bank, Washington, DC, July.
Kelly, Roger, and George Mavrotas. 2003. “Savings and Financial Sector Develop-ment: Panel Cointegration Evidence from Africa.” Discussion Paper 2003/12,World Institute for Economics Development Research, Helsinki.
Kirsten, M. 2006. “Policy Initiatives to Expand Financial Outreach in South Africa.”Paper Prepared for the World Bank/Brookings Institute Conference, Washing-ton, DC, May 30–31.

BIBLIOGRAPHY 229
Knack, Stephen, and Philip Keefer. 1995. “Institutions and Economic Performance:Cross-Country Tests Using Alternative Institutional Measures.” Economics andPolitics 7 (3): 207–28.
Knippenberg, Rudolf, Fatoumata Traore Nafo, Raimi Osseni, Yero Boye Camara,Abdelwahid El Abassi, and Agnes Soucat. 2003. “Increasing Clients’ Power toScale Up Health Services for the Poor: The Bamako Initiative in West Africa.”Background paper to the World Development Report, World Bank, Washington, DC.
Lacina, B., and N. P. Gleditsch. 2005. “Monitoring Trends in Global Combat: A NewDataset of Battle Deaths.” European Journal of Population 21: 145–66.
Lall, S. 2000. “Technological Change and Industrialization in the Asian NewlyIndustrializing Economies: Achievements and Challenges.” In Technology, Learn-ing and Innovation. Experiences of Newly Industrializing Economies, ed. L. Kim and R.R. Nelson. Cambridge, UK: Cambridge University Press.
Lawson, A., P. de Renzio, and Mariam Umarji. 2006. “Final Report on the CurrentStatus of PFM Systems and Processes, Overview of Reforms and Perspectives for2006.” ODI and SAL Consultoria e Investimentos Lda., London and Maputo.
Levine, Ross, and David Renelt. (1993). “A Sensitivity Analysis of Cross-CountryGrowth Regressions.” American Economic Review 82 (4): 942–63.
Levy, Brian, and Sahr Kpundeh. 2004. Building State Capacity in Africa: NewApproaches, Emerging Lessons. Washington, DC: World Bank.
Limao, Nuno, and Anthony J. Venables. 2001. “Infrastructure, Geographical Disad-vantage and Transport Costs and Trade.” World Bank Economic Review 15: 451–79.
Lindbaek, J. 1997. “Emerging Economies: How Long Will the Low-Wage Advan-tage Last?” Background paper for a speech by IFC Executive Vice President atthe APPI Meeting, Helsinki, Finland, October.
Loayza, Norman, Klaus Schmidt-Hebbel, and Luis Serven. 2000. “What Drives Pri-vate Savings across the World?” Review of Economics and Statistics 82 (2) May:165–81.
Lopez, Humberto, and Quentin Wodon. 2005. “The Economic Impact of ArmedConflict in Rwanda.” Journal of African Economies 14 (4): 586–602.
Lorrain, D. 1999. “Ten Years of Public Utility Reforms: 7 Lessons from Privatizationto Public-Private Partnership.” In Financing of Major Infrastructure and Public Ser-vice Projects, ed. J. Y. Perrot and G. Chatelus, 31–40.
Lucas, Jr., Robert E. 2003. “The Industrial Revolution: Past and Future.” In FederalReserve Bank of Minneapolis, Annual Report. Minneapolis, MN.
Luckham, Robin, et al. 2001. “Conflict and Poverty in Sub-Saharan Africa: AnAssessment of the Issues and Evidence.” Working Paper 128, Institute of Devel-opment Studies, Brighton, UK.
Lumbila, K. N. 2005. “What Makes DFI Work? A Panel Analysis of the GrowthEffects of FDI in Africa.” African Region Working Paper 80, World Bank, Wash-ington, DC.

230 CHALLENGES OF AFRICAN GROWTH
Maddison, Angus. 2001. The World Economy: Historical Statistics. Paris: Organisationfor Economic Co-operation and Development.
Maimbo, S. M., and George Mavrotas. 2003. “Financial Sector Reforms and Sav-ings Mobilization in Zambia.” Discussion Paper 2003/13, World Institute forEconomics Development Research, Helsinki.
Maipose, Gervase S., and Thalepo C. Matsheka. 2006. “The Indigenous Develop-mental State and Growth in Botswana.” Draft Chapter 15 of the synthesis vol-ume 2 of the African Economic Research Consortium’s Explaining AfricanEconomic Growth project.
Mansuri, G., and V. Rao. 2003 “Evaluating Community Driven Development: AReview of the Evidence.” Policy Research Working Paper 3209, World Bank,Washington, DC.
Masters, William, and Margaret S. McMillan. 2001. “Climate, Scale and EconomicGrowth.” Journal of Economic Growth 6 (3).
Mauro, P. 1995. “Corruption and Growth.” Quarterly Journal of Economics 110 (3):681–712.
Mengistae, Taye. 2001. “Indigenous Ethnicity and Entrepreneurial Success inAfrica: Some Evidence from Ethiopia.” Policy Research Working Paper 2534,World Bank, Washington, DC.
Mengistae, Taye, and Catherine Pattillo. 2004. “Export Orientation and Productiv-ity in Sub-Saharan Africa.” IMF Staff Papers 51 (2): 6.
Messick, Richard. 2004. “Judicial Reform and Economic Growth: What a Decade ofExperience Teaches.” Presented at “A Liberal Agenda for the New Century: AGlobal Perspective,” a conference cosponsored by the Cato Institute, the Insti-tute of Economic Analysis, and the Russian Union of Industrialists and Entre-preneurs, Moscow, April 8–9.
Miguel, E. 2004. “Tribe or Nation? Nation-Building and Public Goods in Kenya ver-sus Tanzania.” World Politics 56 April: 327–62.
Milanovic, Branko. 2005. “Why Did the Poorest Countries Fail to Catch Up?” CarnegiePaper 62, Carnegie Endowment for International Peace, Washington, DC.
Mkandawire, T., and C. C. Soludo. 1999. Our Continent, Our Future: African Perspec-tives on Structural Adjustment. Trenton, NJ: Africa World Press.
Monetary Research International. 2001-04. MRI Bankers' Guide to Foreign Currency.Houston: Monetary Research International.
Mwanawina, Inyambo, and James Mukungushi. 2006. “Zambia.” Draft Chapter 27of the synthesis volume 2 of the African Economic Research Consortium’sExplaining African Economic Growth project.
Mwega, F. 1997. “Saving in Sub-Saharan Africa: A Comparative Analysis.” Journalof African Economies 6 (3) Supplement: 199–228.
Ndulu, Benno J. 2006a. “The Evolution of Global Development Paradigms andTheir Influence on African Economic Growth.” Draft Chapter 9 of the synthesis

BIBLIOGRAPHY 231
volume of the African Economic Research Consortium’s Explaining AfricanEconomic Growth project.
———. 2006b. “Infrastructure, Regional Integration and Growth in Sub-SaharanAfrica: Dealing with the Disadvantages of Geography and Sovereign Fragmen-tation.” Journal of African Economies 15 December: 212–44.
Ndulu, Benno J., and Stephen A. O’Connell. 2003. “Revised Collins/BosworthGrowth Accounting Decompositions.” Explaining African Economic Growthproject, African Economic Research Consortium, Nairobi, Kenya.
———. 2006a. “Policy Plus: African Growth Performance 1960–2000.” Draft Chap-ter 1 of the synthesis volume of the African Economic Research Consortium’sExplaining African Economic Growth project.
———. 2006b. “The African Development Challenge from a Global Perspective.”Draft.
Ndung’u, Njuguna S., and Rose W. Ngugi. 2000. “Banking Sector Interest RateSpread in Kenya.” Discussion Paper 5, Kenya Institute for Public Policy Researchand Analysis, Nairobi.
Nordhaus, William D. 2001. “New Data and Output Concepts for UnderstandingProductivity Trends.” Working Papers 8097, National Bureau of EconomicResearch, Cambridge, MA.
O’Connell, Stephen A., and Benno J. Ndulu. 2000. “Explaining African EconomicGrowth: A Focus on Sources of Growth.” Working Paper Series, African Eco-nomic Research Consortium, Nairobi.
Pindyck, Robert S., and Andres Solimano. 1993. “Economic Instability and Aggre-gate Investment.” Working Paper W4380, National Bureau of EconomicResearch, Cambridge, MA.
Porter, Michael E. 1990. The Competitiveness of Nations. New York: Free Press.
Porter, Michael E., Klaus Schwab, and Augusto Lopez-Claros, eds. 2006. The GlobalCompetitiveness Report 2006–2007. New York: PalgraveMacmillan.
Pritchett, Lant. 1994. “Desired Fertility and the Impact of Population Policies.” Pop-ulation and Development Review 20 (1).
———. 1998. “Patterns of Economic Growth: Hills, Plateaus, Mountains, andPlains.” Policy Research Working Paper 1947, World Bank, Washington, DC.
Pritchett, Lant, and Michael Woolcock. 2002. “Solutions When the Solution Is theProblem: Arraying the Disarray in Development.” Paper presented at KennedySchool of Government, Harvard University, Cambridge, MA, April 1.
Quartey, P. 2006. “Shared Growth in Ghana: Do Migrant Remittances Have aRole?” Paper prepared for the Cornell/ISSER/World Bank International Confer-ence on Shared Growth in Africa, Accra, July 21–22, 2005.
Ramachandran, Vijaya, and Manju Kedia Shah. 2006. “Why Are There So FewBlack-Owned Businesses in Africa?” Unpublished manuscript.

232 CHALLENGES OF AFRICAN GROWTH
Ramachandran, Vijaya, Gaiv Tata, and Manju Kedia Shah. 2006. “The Challenge ofGrowth in the African Private Sector.” Manuscript.
Rau, Neren. 2004. “Financial Intermediation and Access to Finance in AfricanCountries South of the Sahara.” Africa Development and Poverty ReductionForum Paper, Cornell University, Ithaca, NY.
Ravallion, Martin. 2001. “Growth, Inequality, and Poverty: Looking Beyond Aver-ages.” World Development 29 (11): 1803–15.
Reinikka, Ritva, and Paul Collier, eds. 2001. Uganda’s Recovery: The Role of Farms,Firms, and Government. Washington, DC: World Bank.
Rodrik, Dani. 1998a. “Globalisation, Social Conflict and Economic Growth.” WorldEconomy 21 (2): 143.
———. 1998b. “Where Did All the Growth Go? External Shocks, Social Conflict,and Growth Collapses.” Draft, John F. Kennedy School of Government, HarvardUniversity, Cambridge, MA, August.
———, ed. 2003. In Search of Prosperity: Analytic Narratives on Economic Growth.Princeton, NJ: Princeton University Press.
———. 2004. “Industrial Policy for the Twenty-First Century.” Discussion Paper4767, Center for Economic and Policy Research, London, UK.
Rodrik, Dani, and Arvind Subramanian. 2004. “From ‘Hindu Growth’ to Produc-tivity Surge: The Mystery of the Indian Growth Transition.” CEPR DiscussionPaper 4371, Center for Economic and Policy Research, London, UK.
Rojas-Suarez, and Steven R. Weisbrod. 1996. “Financial Markets and the Behaviorof Private Savings in Latin America.” Paper presented at the International Devel-opment Bank–Organisation for Economic Co-operation and Development Con-ference on Promoting Savings in Latin America, Paris, November 7–8.
Roy, Amit. 2006. “Africa Fertilizer Crisis: Summit Background and Process.” Pre-sented at the Technical Session: High-Level Dialogue, Africa Fertilizer Summit,Abuja, Nigeria, June 9.
Ruttan, Vernon W. 2001. Technology, Growth, and Development. New York: OxfordUniversity Press.
Sacerdoti, Emilio. 2005. “Access to Bank Credit in Sub-Saharan Africa: Key Issuesand Reform Strategies.” Working Paper 05/166, International Monetary Fund,Washington, DC.
Sachs, Jeffrey D., John W. McArthur, Guido Schmidt-Traub, Margaret Kruk, Chan-drika Bahadur, Michael Faye, and Gordon McCord. 2004. “Ending Africa’sPoverty Trap.” Brookings Papers on Economic Activity 1: 117–216.
Sachs, Jeffrey D., and Andrew Warner. 1995. “Economic Reform and the Processof Global Integration.” Brookings Papers on Economic Activity 1: 1–95.
———. 1997. “Sources of Slow Growth in African Economies.” Journal of AfricanEconomies 6 (3): 335–76.

BIBLIOGRAPHY 233
———. 2001. “The Curse of Natural Resources.” European Economic Review 45 (4–6):827–38.
Sala-i-Martin, Xavier, Gernot Doppelhofer, and Ronald I. Miller. 2004. “Determi-nants of Long-Term Growth: A Bayesian Averaging of Classical Estimates(BACE) Approach.” American Economic Review 94 (4): 813–35.
Solo, Tova Maria, and Astrid Manroth. 2006. “Access to Financial Services inColombia: The Unbanked in Bogota.” Policy Research Working Paper 3834,World Bank, Washington, DC.
Stotsky, J. G., and Asegedech WoldeMariam. 1997. “Tax Effort in Sub-SaharanAfrica.” Working Paper 97/107, International Monetary Fund, Washington, DC.
Subramanian, Arvind. 2001. “Mauritius: A Case Study.” Finance and Development 38(4).
Syrquin, M., and H. Chenery. 1989. “Three Decades of Industrialization.” WorldBank Economic Review 3: 145–81.
Tangri, Roger. 1999. The Politics of Patronage in Africa. Trenton, NJ: Africa World Press.
Tanzi, Vito, and Howell Zee. 2001. “Tax Policy for Developing Countries.” IMF Eco-nomic Issues 27, International Monetary Fund, Washington, DC.
Temple, Jonathan. 1999. “The New Growth Evidence.” Journal of Economic Litera-ture 37 (1): 112–156.
Timmer, C. Peter. 2003. “Food Security and Rice Price Policy in Indonesia: The Eco-nomics and Politics of the Food Price Dilemma.” In Rice Science: Innovations andImpact for Livelihood, ed. T. W. Mew, D. S. Brar, S. Peng, D. Dawe, and B. Hardy.Proceedings of the International Rice Research Conference, Beijing, September16–19, 2002.
UNAIDS (Joint United Nations Programme on HIV/AIDS). 2006. Report on the GlobalAids Epidemic. New York: UNAIDS.
UNCTAD (United Nations Conference on Trade and Development). 2000. “CapitalFlows and Growth in Africa.” UNCTAD, Geneva.
United Nations Statistical Division. 2006. United Nations Common Database(UNCDB). United Nations, New York.
Utz, Anuja. 2006. “Fostering Innovation, Productivity and Technological Change:Tanzania in the Knowledge Economy.” Discussion Paper, World Bank Institute,Washington, DC.
Valverde, S., R Lopez del Paso, and F. Fernandez. 2004. “Banks, Financial RegionalGrowth.” Unpublished manuscript. Department of Economics, University ofGranada, Spain.
Van Biesebroeck, Johannes. 2005. “Firm Size Matters: Growth and Productivity inAfrican Manufacturing.” Economic Development and Cultural Change 53:545–83.
Versi, Anver. 2006. “Fertilizers—Food for a Hungry Earth, Africa Launches GreenRevolution.” African Business December: 18.

234 CHALLENGES OF AFRICAN GROWTH
Vishny, R., and A. Shleifer. 1993. “Corruption.” Quarterly Journal of Economics 108(3): 599–617.
Wade, James. 1993. “Dynamics of Organizational Communities and TechnologicalBandwagons: An Empirical Investigation of Community Evolution in theMicroprocessor Market.” Proceedings of the Eighth Annual Texas OrganizationsConference, University of Texas at Austin, April 1993, 124–28.
Washington Post. October 3, 2006. “New Conductors Speed Global Flows of Money.”The Washington Post, Washington, DC.
WEF (World Economic Forum). 2006. Global Competitiveness Report, 2005–2006. NewYork: Oxford University Press.
Wellenius, Bjorn, Vivien Foster, and Christina Malmberg-Calvo. 2004. “PrivateProvision of Rural Infrastructure Services—Competing for Subsidies.” PolicyResearch Working Paper 3365, World Bank, Washington, DC.
Westoff, C., and A. Bankole. 2000. “Trends in the Demand for Family Limitation inDeveloping Countries.” International Family Planning Perspectives 26 (2).
Wooldridge, Jeffrey M. 2003. Introductory Econometrics: A Modern Approach. Mason,OH: Thompson South-Western.
World Bank. 1981. Accelerated Development in Sub-Saharan Africa: An Agenda forAction. Washington, DC: World Bank.
———. 2000a. Can Africa Claim the Twenty-First Century? Washington, DC: WorldBank.
———. 2000b. World Development Report. Washington, DC: World Bank.
———. 2001. Global Economic Prospects, 2001. Washington, DC: World Bank.
———. 2003. “Project Overview, Southern Africa Regional Gas Project (SASOL).”World Bank, Washington, DC.
———. 2004a. Investment Climate Assessment: Improving Enterprise Performance andGrowth in Tanzania. Washington, DC: World Bank.
———. 2004b. World Development Report. Washington, DC: World Bank.
———. 2005a. “Building Effective States, Forging Engaged Societies.” Report ofthe World Bank Task Force on Capacity Development in Africa, World Bank,Washington, DC.
———. 2005b. “Capacity Building in Africa.” An Operations Evaluation Depart-ment Evaluation of World Bank Support, World Bank, Washington, DC.
———. 2005c. Doing Business in 2006. Washington, DC: World Bank.
———. 2005d. Economic Growth in the 1990s: Learning from a Decade of Reform. Wash-ington, DC: World Bank.
———. 2005e. “Meeting the Challenges of Africa’s Development: A World BankGroup Action Plan.” Africa Region, World Bank, Washington, DC.
———. 2005f. World Development Report. Washington, DC: World Bank.

BIBLIOGRAPHY 235
———. 2006a. “Capturing the Demographic Bonus in Ethiopia: The Role of Gen-der Equitable Development and Demographic Actions.” Country Departmentfor Ethiopia, World Bank, Washington, DC.
———. 2006b. Doing Business in 2007: How to Reform. Washington, DC: World Bank.
———. 2006c. World Development Indicators. World Bank, Washington, DC.
———. 2006d. World Development Report. Washington, DC: World Bank.
———. 2007. Private Particpation in Infrastructure Database. World Bank, Wash-ington, DC.
Wormser, Michel. 2004. “FPSI’s Role in Alleviating Poverty and Promoting Growthin Africa.” Draft.
Yeats, Alexander, and Francis Ng. 1997. “Open Economies Work Better! DidAfrica’s Protectionist Policies Cause Its Marginalization in World Trade?” WorldDevelopment 25 (6).
Yusuf, Shahid. 2003. Innovative East Asia: The Future of Growth. Washington, DC:World Bank.
Zagha, Roberto. 2005. “Economic Growth in the 1990s: Learning from a Decade ofReform.” World Bank, Washington, DC. http://www1.worldbank.org/prem/lessons1990s/.
Zeleza, P. T. 1998. African Labor and Intellectual Migrations to the North: Building NewTransatlantic Bridges. Urbana, IL: Center for the Studies of African Studies, Uni-versity of Illinois at Urbana-Champaign.


Boxes, figures, notes, and tables are
indicated by “b,” “f,” “n,” and “t”
following the page numbers.
AAP. See African Action Plan (AAP)
accountability, 180, 182, 183
AERC. See African Economic
Research Consortium (AERC)
AfDB. See African Development
Bank (AfDB)
African Action Plan (AAP), 1
African Development Bank
(AfDB), 21
African Economic Research Con-
sortium (AERC), 1, 2, 78, 203
African Union, 150, 188
age dependency, 12, 16, 80–94,
106, 107–8, 147, 206, 207fA.2
age dependency ratios, 79, 97,
107, 108t4.2
levels of, 116
link to growth, 80–83, 84–95, 214
agriculture, 23, 53–55, 146
Côte d’Ivoire, 49b2.1
exports, 155
labor force, 54
role of, 15
aid, 121, 188–97, 201n7
AIG African Infrastructure Fund,
161
Asian countries
demographic factors in growth
of, 79–80, 108–11
exploitation of technology, 173
GDP, 152
growth experience compared to
Africa, 37–39
investments in Africa, 153
banking sector, 190–91,
192–93b5.3
cell phone banking, 171b5.2
inefficiency in, 132–33,
134f4.10
Index
237

238 CHALLENGES OF AFRICAN GROWTH
mobilization of savings in Zam-
bia, 192–93b5.3
and remittances, 198–99
Barnako Initiative, 182–83
barriers to trade, 147
battle deaths, 125, 126t4.5
beta coefficients, 215, 217n2
birthrates, 107, 109, 111
black market premiums, 80–82,
84–95, 149, 209–10
borrowing by governments, 136,
137f4.13
Botswana, growth strategies,
50–51b2.2
business enterprises
costs of doing business, 67–71,
156–58
environments for, 149
indigenous entrepreneurs com-
pared to minority-owned
firms, 75–77, 98nn4–5
Can Africa Claim the 21st Century?, 1,
2
capacity, 21
capital
accumulation of, 11, 17, 59,
64–65
costs, 72, 73f3.6
flight of, 176
flows of, 146–47
levels of, 11, 17
link to growth, 64, 65, 66
social overhead, 216–19
as source of growth, 59, 60t3.1,
61–63t3.2
capitation grants, 182
cell phones, 171b5.2
Celpay, 171b5.2
Centre for Economic Policy
Research, 171
choices, exercise of, 179–83
civil wars, 123–27
climate, as constraint to growth,
19–20, 105–6
commodities, 121, 144, 152–53,
207–8
competition, 10, 69, 132
competitiveness
enhancement of, 147
global competitiveness index,
172f5.4
impact of education on, 173,
174f5.5
innovations to increase growth,
165–77
and transaction costs, 24
conditions of growth
African countries compared to
other regions, 79–81
evolution of importance of,
80–83, 84t3.5
overview of benchmarking of,
78–79, 98n7
conflicts
as constraint to growth, 123–30
costs of, 124–27, 128–29b4.2
decline in, 149–50
link to investment climate, 20
preventing and resolving of,
186–88
relationship to per capita
income, 5
constraints to growth, 12, 13, 144
capacity, 130
climate, 105–6

INDEX 239
diseases, 105–6
financial sector, 130–36,
142nn5–7
investments, 20–21
macroeconomics, 118–21
overview, 19–22, 100, 101t4.1
politics, 122–30
prices, 20–21, 31n7
relative contributions of, 80–83,
84t3.5
savings, 136–41, 142n8
See also conflicts; demographic
transition; demography;
geography; policy
environment
consumption, government, 80–83,
84–92, 210, 211fA.3, 214–15
contraception, 111–12, 113b4.1
copper industry, Zambia, 52b2.2
corruption, 185–86
costs
comparison of firm-level by
country, 72, 73f3.6
of conflicts, 124–27,
128–29b4.2
of doing business, 67–71, 72,
73f3.6, 156–58
of power generation, 165
Côte d’Ivoire, development strate-
gies, 47–49b2.1
credit, access to, 76–77, 98n5,
134–36
crime, 71
cross-border trade, 164, 165
cross-country growth analysis,
18–19, 31n6
debit card transactions, 195b5.4
debt relief, 189
debt-to-gross national income
ratio, 120–21
delegation, and performance-based
contracts, 183
Democratic Republic of Congo
(DRC), costs of conflict in,
129b4.2
democratization, 143, 150
demographic transition, 12–13, 16,
216
as growth constraint, 106–12,
113b4.1, 142n2
and HIV/AIDS, 112, 114–16,
142n3
link to growth, 147
rate of natural increase, 108–9
role of, 19
demography, 97, 214
Asian countries, 108–11
as constraint to growth,
12–13, 28–29t1.1, 106–16,
142n2
demographic indicators,
207fA.2
as factor in deviation of growth,
79–81
human development factors,
205–6, 207fA.2
Latin American and Caribbean
countries, 109–11
link to growth, 80–83, 83–95
Middle East and North African
countries, 109–11
See also age dependency; demo-
graphic transition; fertility
rates; incomes; life
expectancy; mortality rates
deviations in growth, 79–81

240 CHALLENGES OF AFRICAN GROWTH
link to growth drivers, 80–83,
84–96
diffusion, 63
diseases, as constraint to growth,
105–6
Doing Business in 2006, 143, 149
Doing Business in 2007, 157
donor conditionality, 177
DRC. See Democratic Republic of
Congo (DRC)
drivers of growth, 80–83, 84t3.5,
216
contributions of individual com-
ponents of, 80t3.4
as factors in growth deviation,
83–96
See also demography; geography;
income; policy environment;
shocks
dual-accountability systems, 180
“Dutch disease,” 51b2.2, 116
EAGER. See Equity and Growth
through Economic Research
(EAGER)
East Asia and Pacific (EAP)
countries
contributions of drivers to
growth, 84–96
demographic factors in growth,
79–80
GDP compared to African coun-
tries, 4
growth experience compared to
Africa, 37–39
link of drivers of growth to devi-
ations in growth, 83,
84t3.5
economic growth and develop-
ment, 148
and demographic pressures,
106–12, 142n2
and enforcement of contracts,
178–79
and financial sector, 130–36,
142nn5–7
impact of conflicts on, 123–30
impact of infrastructure on, 104
new opportunities and chal-
lenges for, 151–54
overview, 33–35
role of savings on, 136–41,
142n8
sources of, 58–66, 97n1
Economic Growth in the 1990s: Learn-
ing from a Decade of Reform,
2–3
economies, structural transforma-
tion of, 53–55, 56n3
ECOSOC. See United Nations Eco-
nomic and Social Council
(ECOSOC)
education
and fertility rates, 110–12,
142n2
impact on competitiveness, 173,
174f5.5
investments in, 173, 174f5.5
link to size of firms, 75–76, 77,
98n6
promotion of, 175–76
as source of economic growth,
59, 60t3.1, 61–63t3.2
EITI. See Extractive Industries
Transparency Initiative (EITI)
elections, 150, 151f5.1

INDEX 241
electricity, 68–69, 74
Emerging Africa project, 2
emigration of professional work-
force, 174–75, 176
employment opportunities, 23, 147
endogeneity, 204–5
energy costs, 68–69, 72
enforcement of contracts, 178–79,
182, 183
entrepreneur-owned firms, 75–77,
98nn4–5
Equity and Growth through Eco-
nomic Research (EAGER), 2
Ethiopia, demographic transition
and family planning in,
113b4.1
ethnicity, role in private sector,
98n4
ethnic polarization, 19–20
ethnolinguistic heterogeneity, 122
ethnoregional polarization, 122–23
exchange rate, 80–83, 84–92, 149
exogenous shocks, 207–9
exports
agricultural, 155
costs of, 73
Côte d’Ivoire, 49b2.1
developing countries share of,
152, 153f5.3
high-value service sector labor,
155
impact of geography on, 105
increase in share of, 200–201n1
link to growth, 23, 154–55
link to productivity, 74–75
link to technology, 167–69b5.1
manufactured export-led
growth in, 154–55
Mauritius, 48–49b2.1
minerals, 23
regulation of, 69, 70f3.3
structure of, 55, 152, 152f5.2
and transport costs, 102
Extractive Industries Transparency
Initiative (EITI), 184–85
factor accumulation, rate of, 57
family planning programs, 110–12,
113b4.1
FDI. See foreign direct investment
(FDI)
fertility rates, 106, 107, 109–10,
206
and education, 110–12, 142n2
Ethiopia, 113b4.1
factors linked to, 116
impact of HIV/AIDS on, 114–16
reductions in, 13
TFR, 16, 34, 113b4.1
fertilizer use, 15
financial sector, 191–94
access to finance, 134–36,
137f4.13, 142nn6–7
development of, 131–32,
133f4.9, 142n5
impact of ICT on, 170–71b5.2
overview, 130–31
See also banking sector
financing
gaps in, 26
of infrastructure, 159–61
fiscal policy, indicators of, 120–21
floriculture, 153–54
foreign direct investment (FDI), 26,
64, 147
Côte d’Ivoire, 49b2.1

242 CHALLENGES OF AFRICAN GROWTH
diversification of sources of, 153
impact on growth, 21
foreign exchange, 64, 97n1, 116–17
black market premiums, 80–82,
84–95, 149, 209–10
foreign experts, 175, 177
fragmentation, 146
impact on trade, 102–3
indicators of, 101t4.1
free on board, 102
GDN. See Global Development Net-
work (GDN) database
GDP. See gross domestic product
(GDP)
generalized method of moments
(GMM), 103
generators, types of firms owning,
68–69
genocide, 128b4.2
geography, 97, 103f4.1, 146
as constraint to growth, 12,
19–21, 28–29t1.1, 100,
103–5, 142n1
and growth rates, 42–43, 46f2.8
link to growth, 80–83, 83–95,
211
regional approaches to infra-
structure, 164–65
Ghana, 141
global competitiveness index,
172f5.4
Global Competitiveness Report,
2005–2006, 10
Global Development Network
(GDN) database, 205
Global Economic Prospects, 2001,
200–201n1
global economy, growth of,
143–44, 166, 168
globalization, 152, 176
globalizers, 152
global markets, 147, 200–201n1
link to technology and exports,
167–69b5.1
GMM. See generalized method of
moments (GMM)
goods and services, underprovision
of, 178
governance, 146, 180
failures in, 65
link to growth, 18–19
and policy environment, 209
governments
borrowing by, 136, 137f4.13
and exercise of voice to enforce
public choice, 179–83
growth-oriented, 166
and policy environment,
209–13
role in investment climate, 158
and transparency, 183–85
types of interventions utilized,
178, 201n6
government spending, 149, 210,
211fA.3, 214–15
link to growth, 80–83, 84–92
gravity model, 104–5
green revolution, 15, 53
gross domestic product (GDP), 148,
201n2
Asian countries share of, 152
DRC, 129b4.2
East Asia compared to Africa, 4
and government consump-
tion/GDP, 80–83, 84–92

INDEX 243
government spending share of,
210, 211fA.3
growth per worker, 59, 60t3.1,
61–63t2.1
industry share, 53
and investment ratios, 26
M2/GDP ratio, 131–32
Mozambique, 129b4.2
per capita index, 39f2.5
remittances as share of, 197
tax revenue as share of, 194, 196
See also real gross domestic prod-
uct (GDP)
gross total factor productivity,
72–75, 98n3
growth
drivers of growth link to growth
deviations, 83–96
lessons from past 45 years,
145–48, 200–201n1
link to physical capital accumu-
lation, 64, 65
major studies of, 1–3
mobilizing resources for,
188–99, 201n7
regional comparisons of,
28–29t1.1
in SSA, 46f2.9
See also long-term growth expe-
riences; U-shaped growth
pattern
growth indicators, categorized by
opportunity groups, 44–45t2.1
growth model, 26–27, 30f1.4,
203–5, 217n1
growth performance
Africa compared to non-African
countries, 18–19, 31n6
diversity of, 5–8, 31n3
factors influencing, 16–19, 31n6,
205–13
impact of natural resources on,
116–18
long-term, 15–16
regional comparisons, 28–29t1.1
relationship to poverty, 4
relationship to strategies and
policy environment, 6–9
See also long-term growth expe-
riences; U-shaped growth
pattern
growth rates, 143, 148
and conflicts, 126, 127–30
financial sector as constraint to,
130–36, 142nn5–7
impact of institutional capacity
on, 130
impact of investor behavior on,
127–30
and incomes, 10, 43, 44–45t2.1,
46f2.9, 47, 56n2
link to country size, 43
link to development strategies,
47–52
link to geography, 42–43, 46f2.8
link to price of investment
goods, 20–21, 31n7
low-income countries, 8
and opportunity groups, 41–47
patterns of, 16
and political instability, 127–30
Hart Group, 184–85
health care workers, 175, 176–77,
183
health clinics, 182–83

244 CHALLENGES OF AFRICAN GROWTH
high-growth countries, 84,
86–88t3.6, 96f3.13, 97
HIV/AIDS, 83, 97
and demographic transition,
112, 114–16, 142n3
impact on life expectancy, 206
human capacity, 145, 173–75
human capital, 59, 107
human development
and growth rates, 8–9, 28t1.1
human development indexes,
97
Mauritius, 48b2.1
variables used in growth model,
205–6, 207fA.2
ICT. See information and commu-
nications technologies (ICT)
IDT. See International Development
Targets (IDT)
IFC. See International Finance Cor-
poration (IFC)
incentives, for investment, 17
income
African vs. non-African popula-
tions, 4–6
effects of terms of trade on, 85,
207–8
and growth rates, 43, 44–45t2.1,
46f2.9, 47, 56n2
impact of conflicts on, 126–27
inequality of, 104
related to nutrition, 9
Sub-Saharan Africa, 3, 13nn1–2
See also per capita incomes
indicators
fiscal policy for selected regions,
120–21
of geographical and sovereign
fragmentation, 101t4.1
socioeconomic, 109t4.3
indigenous entrepreneurs, com-
pared with minority-owned
firms, 75–77, 98nn4–5
Industrial Revolution, 106
infant mortality rates, 109t4.3, 110
inflation, 29, 149
link to growth, 80–83, 84–95
link to macroeconomic stability,
118–20
rates of, 210
information
availability of, 77, 98n6
flow of, 65
importance of, 153–54
link to performance, 182, 183
information and communications
technologies (ICT), 10, 25
access to, 154, 171, 173, 186
and corruption, 186
investments in, 10, 170–71,
172f5.4
link to growth and competitive-
ness, 165–77, 172f5.4
outsourcing of, 167b5.1
progress in, 59, 63–64
infrastructure, 10, 21, 145, 216
as cost of doing business, 67–68,
102–3
financing of, 159–61
increase in productivity of exist-
ing infrastructure, 161–62
investments in, 13–14, 166
link to growth, 103–4, 211–12,
212fA.4
link to output, 103–4

INDEX 245
overcoming neglect of, 158–59
quality of, 68
regional approaches to, 164–65
for remittances, 198
role of public–private partner-
ships in, 162–64
and transport costs, 102–3
used as strategy to prevent con-
flict, 187
infrastructure stock index, 212,
216
initial income levels, 79,
81–82ff3.10–3.12, 212–13,
214, 215
link to growth, 80–83, 84–95
initiatives
to expand access and encourage
savings, 194, 195b5.4
trade, 150–51
innovations, 63, 145
in ICT link to savings, 194,
195b5.4
as pillar of growth strategy, 25
promotion of, 14
role of, 17
as strategy for productivity
growth and competitiveness,
165–77
inspections, 70f3.4, 71
institutional capacity, 25, 145
as growth constraint, 12, 13, 14
impact on growth, 130
institutional environment, 149
institutional quality index, 216
institutions
quality of, 20
strengthening of, 177–88, 201n6
used to prevent conflict, 187
interest rates, 132–33, 134f4.10
International Development Targets
(IDT), 159
International Finance Corporation
(IFC), 161
International Food Policy Research
Institute, 9
International Institute for Strategic
Studies, 123
International Organization for
Migration, 174–75
Internet, 171, 173, 186
invention, 59, 60
investment climate, 66–75,
97–98nn2–3, 144–45
investment climate surveys, 17–18,
57–58, 157
investment, 12
by Asian countries, 153
in education, 173, 174f5.5
as growth constraint, 20–21
in ICT, 10, 171, 172f5.4
impact of remittances on, 198
improving climate for, 13, 24
incentives for, 13, 17, 66
in infrastructure, 162–64, 165
levels of, 59
link to growth, 145–46
link to macroeconomic stability,
119–20
Mauritius, 48b2.1
productivity of, 161–62
by public–private partnerships,
162–64
regional nature of, 64–65
Zambia, 52b2.2
See also foreign direct investment
(FDI)

246 CHALLENGES OF AFRICAN GROWTH
investors, impact of political insta-
bility and conflicts on,
127–30
judiciary, and contract enforce-
ment, 178–79
Kalema, William, 157
Kenya Revenue Authority, 196
labor force, 83, 107, 147
agriculture, 54
labor exports, 155
skilled labor, 22, 173–74, 176
landlocked countries. See
geography
Latin American and Caribbean
countries, demography,
109–11
LDCs. See less developed countries,
(LDCs)
leadership, 200
and conflict resolution,
187–88
and institutional environment,
177
relationship to sustainable
growth, 11
role in investment climate,
157–58
learning, technological,
167–68b5.1
less developed countries (LDCs),
124
life expectancy, 79, 97, 205,
206fA.1, 214
link to growth, 80–83, 84–95
living standards, 10
long-term growth experiences
benchmarking against Asian
economies, 37–39
diversity across Africa, 39–52,
56nn1–2
evolution of, 35–37
sectoral composition, 53–55,
56n3
U-shaped path of, 33
See also growth experiences;
growth performance
low-growth countries, 84,
86–88t3.6, 96–97
low-growth syndrome, 9–11
M2/GDP ratio, 131–32
macroeconomic indicators,
214–15
macroeconomic policy, 19
macroeconomic stability, 118–21,
149, 210
management of regulations, 70–71
manufacturing sector, rise in, 53,
55
markets, 105, 164, 208
See also trade
Mauritius, development strategies,
47–49b2.1
MDGs. See Millennium Develop-
ment Goals (MDGs)
microfinance institutions, 191,
192–94, 201n7
Middle East and North Africa
countries, demography,
109–11
military coups, 127
Millennium Development Goals
(MDGs), 1, 26
INDEX 247
and growth rates, 8
and human capacity, 174
and income status, 215
resources needed to meet, 188
mineral wealth, 3, 23, 51b2.2
minority-owned firms, compared
with indigenous entrepre-
neurs, 75–77, 98nn4–5
mobile phones, 171, 172–73
models of growth, 26–27, 30f1.4,
203–5, 217n1
Monetary Research International,
210
mortality rates, 107, 109, 114–16,
125, 126t4.5
Mozambique, costs of conflicts on,
128–29b4.2
Multifiber Agreement, 153
Mzansi, 195b5.4
National Stakeholders Working
Group (NSWG), 184–85
nation building, 122
natural resources, 116–18, 155,
183–85
rents dominance, 101
See also resources
NEPAD. See New Partnership for
Africa’s Development
(NEPAD)
net total factor productivity, 72–75,
98n3
networked readiness index,
172f5.4
networks of business professionals,
76
New Africa Infrastructure Fund,
161
New Partnership for Africa’s Devel-
opment (NEPAD), 150–51
non-indigenous entrepreneurs,
75–77, 98nn4–5
NSWG. See National Stakeholders
Working Group (NSWG)
nutrients, and farmland degrada-
tion, 15
nutrition, 9
ODA. See official development
assistance (ODA)
OECD. See Organisation for Eco-
nomic Co–operation and
Development (OECD)
official development assistance
(ODA), 26, 160–61, 188–90
Ogoola, James, 157
oil wealth, 43, 56n1
OLS. See ordinary least squares
(OLS) regression models
opportunities for growth, 144, 215
composition of, 19
differences in structures of, 19
emergence of, 148–51, 201nn3–4
and growth rates, 41–47
in international environment,
151–54
relationship to growth, 6–8
strategy options, 154–55
ordinary least squares (OLS)
regression models, 203–4
Organisation for Economic Co-
operation and Development
(OECD), 12, 22, 64–65,
168–69b5.1
output growth, link to infrastruc-
ture, 103–4
248 CHALLENGES OF AFRICAN GROWTH
output per worker, 59, 60t3.1,
61–63t3.2
outsourcing, of information tech-
nology, 167b5.1
per capita growth rates, 50–51,
56n1
per capita income, 54t2.2
2004 relative to 1960, 5–6, 8
Africa compared to non-African
countries, 4–6
Botswana vs. Zambia, 50b2.2
Côte d’Ivoire vs. Mauritius,
47–49b2.1
and growth rates, 10
population-weighted, 16, 34–37
regressive nature of, 43,
44–45t2.1, 46f2.9, 47, 56n2
relationship to growth strate-
gies, 7f1.3, 8
in SSA, 193b5.3
and sustained growth, 9
See also incomes
performance-based contracts, 183
physical capital accumulation, 59,
60t3.1, 61–63t3.2, 64, 65
pillars of growth strategies, 24–26,
27
See also competition; infrastruc-
ture; institutional capacity;
investments; leadership
polarization, 122–23
policy environment, 97, 99, 146,
149
avoidance of policy distortions,
13
as constraint to growth, 12, 13
fragmented nature of, 102–3
impact of government on,
209–13
link to growth, 6–9, 18–19,
80–83, 84–96
political economy, 27, 30f1.4, 181,
199–200
political violence, 127
politics
and exercise of choice, 179–83
impact of political instability on
investor behavior, 127–30
link to growth, 80–83, 84–92,
122–30
political instability, 208–9, 216
reforms in, 150
population
decline in, 108–9
link to growth, 16, 33–34,
34f1.1, 41, 83
and per capita income, 16,
34–37
ports, 164
potential labor force growth rates
link to growth, 80–83, 84–95,
206, 207fA.2
poverty reduction, 148, 201n3
as growth challenge, 4–9,
31n3
link to remittances, 198
relationship to inequality, 9
power generation, 165
power outages, 68–69
PPP. See purchasing power parity
(PPP)
prices
of commodities, 152–53
of investment goods, 64–65,
97–98n2

INDEX 249
link to growth constraints,
20–21, 31n7
primary enrollment rate, 8–9
private sector
credit for, 131–32
development of, 181–82
growth of, 58
investments in infrastructure,
163
lending to, 134
public–private partnerships, 25,
161, 162–64
role in investment climate,
157–58
role of ethnicity in, 98n4
production, 154
productivity, 105
of new investments, 161–62
residual, 59, 66
See also total factor productivity
(TFP)
productivity growth, 13, 14–15,
145
importance of, 17
innovations for, 165–77
link to ICT, 25
weakness in, 64, 97n1
professional workforce, emigration
of, 174–75, 176
profitability, in agriculture, 15
protectionism, 181
public action, scrutiny of, 25
public goods, underprovision of, 13
public management, 22
public–private partnerships, 25,
161, 162–64
public sector, role in financing
infrastructure, 160
purchasing power parity (PPP),
109t4.3
real gross domestic product (GDP)
African economies compared to
Asian economies, 37–39
per capita, 205
as percent of growth rate, 8,
28t1.1
smoothed average growth in,
34, 34f2.1, 38f2.4, 40–41
See also gross domestic product
(GDP)
regional issues
access to finance, 135f4.11
approaches to infrastructure,
164–65
conflicts, 127, 187–88
fiscal policy indicators, 120–21
growth comparisons, 28–29t1.1
indicators of financial develop-
ment, 131–32
interregional comparison of
fragmentation indicators,
101t4.1
investments, 64–65
savings, 138, 140–41
sources of growth, 59, 60t3.1
trade initiatives, 150–51
regression-based growth decompo-
sition, 79, 98n7
regulatory framework, 69–71, 162
remittances, 171b5.2, 197–99
remote transactions system (RTS),
170b5.2
rent-sharing systems, 181
research and development (R&D),
63, 64
residual growth, 80–83, 84–92

250 CHALLENGES OF AFRICAN GROWTH
resources
dependence on, 146
export-oriented, 155
link to growth, 96f3.14
natural resources, 116–18, 155,
183–85
and savings rate, 138
returns to investment, 64
revenues, 194, 196–97, 200
risks
of investments in infrastructure,
163
macroeconomic stability, 118–21
political uncertainty and con-
flict, 122–30
RTS. See remote transactions sys-
tem (RTS)
Rwanda, costs of conflicts on,
128–29b4.2
SADC. See Southern African Devel-
opment Community (SADC)
countries
SAR. See South Asia (SAR)
countries
savings, 107
as constraint to growth, 136–41,
142n8
mobilization of, 191–96
in nonfinancial assets, 190
security
costs of, 71
link to political instability, 208–9
Senegal, 156–57
services sector, 53–54, 155
shocks, 80–83, 83–96, 207–9
Singapore, technological progress,
63–64
size of firms, link to education of
owners, 75–76, 77, 98n6
skilled professionals, 22, 76,
173–74, 176
smart cards, 170b5.2
social overhead capital, 216–17
socioeconomic indicators (2004),
109t4.3
sources of growth, 12
1960–2003, 59, 61–63t3.2
analysis of, 58–66, 97n1
decomposition of, 17
by regions, 59, 60t3.1
South Africa Regional Gas Project,
161
South Asia (SAR) countries
contributions of drivers to
growth, 84–96
demographic factors in growth,
79–80
growth experience compared to
Africa, 37–39
link of drivers of growth to devi-
ations in growth, 83, 84t3.5
Southern Africa Infrastructure
Fund, 161
Southern African Development
Community (SADC) coun-
tries, 129b4.2
spillover effects, 63, 64, 127, 145
SSA. See Sub-Saharan Africa
(SSA)
state capacity, 22, 178
strategies for growth
agenda for, 144–45
innovation for productivity
growth and competitiveness,
165–77

INDEX 251
interventions to support growth
in infrastructure, 158–63
investment climate, 156–58
lessons drawn from analysis of,
22–24
link to growth rate, 47–52
opportunities and options for,
154–55
pillars of, 24–26, 27
proposed actions for, 13–14
reducing corruption, 185–86
relationship to policy environ-
ment, 6–9
strengthening institutions for,
177–88, 201n6
structural transformation of
economies, 53–55, 56n3
Sub-Saharan Africa (SSA)
average growth rates of per
capita income, 35–37
climate as growth constraint,
105–6
compared to Asian countries,
37–39
contributions of drivers to
growth, 84–96
diversity of, 14
financial development in,
131–33, 134f4.10
GDP and population shares, 42,
44–45t2.1
GDP per capita index, 39f2.5
geographical distribution,
103f4.1
and geographic constraints, 100,
102–5, 142n1
growth experience, 37–39,
46f2.9
impact of ICT on financial serv-
ices, 170–71b5.2
incomes, 3, 13n1–2
infrastructure, 67–68
investment levels, 59
lessons from 45 years of growth,
145–48, 200–201n1
life expectancy rates, 205,
206fA.1
opportunities for growth,
148–51, 201nn3–4
per capita income, 193b5.3
remittances to, 197–99
savings trends, 138–40, 142n8
smoothed average growth by
opportunity groups, 46f2.6
subsidies, 163, 164
suppliers, 76–77, 105
Sustainable Budget Index, 51b2.2
sustainable growth, 3, 9, 10, 11
tax systems, 194, 196–97
technical assistance, 175, 177
technologies, progress in, 59, 63–64
technology transfer, 168b5.1
telephone lines, 212fA.4
terms of trade (TOT), income
effects of, 85, 207–8
TFP. See total factor productivity
(TFP)
TFR. See total fertility rate (TFR)
time, link to growth, 86–95
TOT. See terms of trade (TOT)
total factor productivity (TFP)
estimates of, 72–75, 98n3
growth of, 50t3.1, 59, 61–63t3.2
total fertility rate (TFR), 16, 34,
113b4.1

252 CHALLENGES OF AFRICAN GROWTH
trade, 64, 97, 146–47, 214
cross-border trade, 164, 165
geography as constraint for
growth of, 102
impediments to, 104
increase of, 151–53
link to growth, 80–83, 84–92,
102
structural features that impede,
63–64
terms of trade, 207–8
trading partner growth, 208
trade credit, 76–77
trained manpower, 22, 76
transaction costs, 17, 20, 24–25, 147
of remitting money, 198
role of, 67
transparency, 180, 183–85
Transparency International Cor-
ruption Perception Index,
186
transportation costs, 21
transport costs, 101, 102, 105
Uganda, 170b5.2, 182
United Nations Common Database,
210
United Nations Conference on
Trade and Development, 26
United Nations Economic and
Social Council (ECOSOC),
112
United Nations Educational, Scien-
tific, and Cultural Organiza-
tion, 173–74
unofficial payments, 71
U-shaped growth pattern, 33,
35–37, 58, 80, 83
and diversity in African coun-
tries, 40–41
and sources of economic
growth, 59, 60t3.1,
61–63t2.1
value added tax (VAT), 196
voice, exercise of, 179–83
WAPP. See West Africa Power Mar-
ket Development Project
(WAPP)
Washington Consensus, 158
welfare, and growth rates, 43,
44–45t2.1, 46f2.9, 47, 56n2
West Africa Power Market Devel-
opment Project (WAPP), 165
World Development Report, 25
Zambia, 50–51b2.2, 192–93b5.3


The World Bank is committed to pre-serving endangered forests and naturalresources. The Office of the Publisherhas chosen to print Challenges of AfricanGrowth on 50% recycled paper includ-ing 30% post-consumer recycled fiberin accordance with the recommendedstandards for paper usage set by theGreen Press Initiative, a nonprofit pro-gram supporting publishers in usingfiber that is not sourced from endan-gered forests. For more information,vis-it www.greenpressinitiative.org.
ECO-AUDITEnvironmental Benefits Statement
Saved:
• 4 trees• 396 lbs. of solid waste• 786 gallons of water• 632 lbs. of net
greenhouse gases• 5 million BTUs of total
energy


ISBN 0-8213-6882-6
Poverty in Africa is largely the outcome of slow growth. With the region hosting 10 percent of the world’s population but a stag-gering 30 percent of the world’s poor, the challenges it faces are
enormous but NOT insurmountable. The message of this book is clear—poverty-eradicating development in Africa is possible. In fact, there are indications that Africa is at a turning point, and there is growing momentum among front-runner economies in the region toward higher and sustained growth. This study challenges African countries and their development partners to consolidate and continue this momentum and to exploit the advantages of the continent as a latecomer, particularly in innovation and in drawing lessons from successful export-led growth experiences in Asia and Latin America.
Challenges of African Growth identifi es opportunities, constraints, and strategic choices that African countries face in their quest for achieving the growth necessary for poverty alleviation. More important, the study provides a broad menu of strategic options for ensuring not only that countries embark on a growth path, but also that the growth is shared and sustainable. The critical areas for action rest on four pillars:
• The investment climate with the focus on reducing indirect costs to fi rms, reducing and mitigating risk, and pooling individual country efforts for cohesive investment activities.
• Infrastructure involving a “Big Push” in investment with a particular focus on landlocked countries, enhancing regulatory capacity and public–private partnerships, and coordinating a regional approach to cross-border infrastructure initiatives.
• Innovation for increasing productivity and competitiveness with an emphasis on investment in information and communications technology and higher education.
• Institutional capacity focusing on enforcing contracts, exercising voice for scrutiny of public policy and action, enhancing revenue transparency in resource-rich countries, and preventing corruption as a country-driven agenda.