challenges in bulk nuclear forensics sample analysis · challenges in bulk nuclear forensics sample...
TRANSCRIPT

Technical Session 3E
IAEA-CN-218-49
1
Challenges in Bulk Nuclear Forensics Sample Analysis
L. Collettia, L. Ortega
a, K. Haynes
a, P. Mason
b, R. Essex
b, K. Kuhn
a, L. Tandon
a
a Los Alamos National Laboratory
Los Alamos, NM 87545
United States of America
b New Brunswick Laboratory
Argonne, IL 60439-4899
United States of America
Abstract. Analytical chemistry operations at Los Alamos National Laboratory (LANL) and Lawrence
Livermore National Laboratory (LLNL) support technical nuclear forensics by providing chemical and physical
measurements of bulk special nuclear material for a consortium of key United States (US) government agencies.
Capabilities to support the nuclear forensic mission continue to evolve from the basic analytical method set
developed half a century ago to support reactor operations and US defense programs. Evolution of analytical
chemistry capabilities includes new certified reference materials (CRMs) for quality assurance and quality
control to maintain historical measurement surety but with improved fidelity and defensibility. A lack of
traceable, matrix-matched standards, with certified uncertainties representative of modern analytical techniques
has been recognized as affecting confidence in the measurement results on important nuclear materials. Drawing
guidance from the National Institutes of Standards and Technology (NIST) and New Brunswick Laboratory
(NBL), the US nuclear forensic community is working to define and develop the well-characterized reference
materials necessary to ensure the integrity of critical forensic measurements. In this paper, discussions will deal
with a case for using available pedigreed materials that are commonly used to provide quality assurance on
relevant nuclear materials for nuclear forensic CRMs. A discussion of challenges associated with transitioning
from a production-oriented, analytical laboratory to an ISO 17025 accredited laboratory will also be presented.
1. Introduction
Analytical chemistry operations at Los Alamos National Laboratory (LANL) and Lawrence Livermore
National Laboratory (LLNL) provide chemical and physical measurements of special nuclear material
(SNM) for a consortium of United States (US) government agencies. The discussion herein will focus
exclusively on LANL capabilities. Analyses range from assay of the major components down to trace
analysis of impurities – a concentration span of over seven orders of magnitude – and consist of both
non-destructive and destructive analyses. LANL has the necessary facilities, glove boxes, hoods,
analytical instrumentation, and technical expertise for handling and analyzing microgram to kilogram
quantities of special nuclear material safely [1, 2]. These capabilities evolved from a classical
analytical method set developed at the onset of actinide research that have been refined over the last
half a century to support reactor fuel development and US defense programs. The depth and quality of
characterization capabilities have improved with advances in computing, analytical instrumentation,
actinide separation science, and material structure and composition imaging at the microscopic level
[1, 2, 3, 4].
Today, the results from nuclear material analysis is further evolving to support international
engagements (State Department, Department of Energy), emergency response, nuclear forensics
(criminal law enforcement, environmental law enforcement), national and international regulations
(safeguards and safety), as well as support the more historical defense and energy programs. Because

L. Colletti et al.
2
of ongoing actinide product certification work at LANL, analytical chemistry capabilities already
operate under comprehensive quality assurance (QA) and quality control (QC) guidelines. However,
the transitioning of analytical chemistry capabilities to support new programs requires a corresponding
improvement in operational QA to meet courtroom admissibility standards [5]. For example, nuclear
forensic work requires much more stringent application for chain-of-custody of sample materials than
standard requirements for international accountability and safeguards. In addition, application of new
analytical methods to material analysis is often required. Pcynometry, scanning electron microscopy,
and x-ray diffraction are methods traditionally used in areas of research and development rather than
in routine characterization of SNM materials. These new methods require development of standards
and appropriate controls if they are to be useful to all programs [2].
The majority of the existing certified reference materials (CRMs) for bulk SNM analysis were
produced in support of international safeguards, but are also relevant to nuclear power and defense
programs, amongst others. In the nuclear forensic analysis community, the ability to prove or trace
sample measurement data back to a traceable, established metrological standardization scheme is
critical to defensibility. Availability of a limited number of traceable, matrix-matched standards with
certified values and uncertainties representative of modern analytical techniques has been recognized
as affecting confidence in the measurement results on important nuclear materials [2]. In addition,
available matrix-matched, traceable standards are (1) limited in material type (U, Pu…) and
compositions; (2) provide certified values for a limited analyte set focused on past nuclear program
needs; (3) carry measurement uncertainties determined using old and less precise methods; (4) are
packaged in amounts too large for easy shipping or site handling; or (5) are often not available at all
for important characteristic measurements. Extensive discussions of these shortcomings are published
in the Inn et. al. 2008 [6] and 2013 paper [7].
Drawing guidance from the National Institute of Standards and Technology (NIST) and New
Brunswick Laboratory (NBL), the US nuclear forensic community is working to define and develop
the reference materials necessary to ensure the integrity of critical forensic measurements. From this
work, various federal agencies have developed a plan to produce CRMs and working reference
materials (WRMs) for trace actinides, trace metal elements, and chronometers in uranium (U) and
plutonium (Pu) matrices [6, 7]. Separately there is an ongoing effort at the international level through
the various metrology labs from across the globe (including NIST, NBL, Commission
d’ÉTAblissement des Méthodesd’Analyse: Analytical Methods Committee [CETAMA], and the
Institute for Reference Materials and Measurements [IRMM]) to provide support for nuclear forensics
and the International Atomic Energy Agency (IAEA) [8, 9]. In this paper, work LANL has performed
towards the overall goal of providing well-characterized, homogeneous, stable, pedigreed materials for
QA and traceability on nuclear forensic materials is discussed.
In the absence of relevant reference materials, well established QA programs with appropriate QC
materials, inter-laboratory comparison programs, application of independent methods based on
different principles, and method implementation by different operators are often used to verify and
validate analytical methods and techniques [9, 10, 11]. It was anticipated that adding the ISO 17025
program could build on the existing quality program to ensure legal defensibility of data for forensic
programs, especially when limited RM is available. In 2012 the first 6 methods were accredited with
another 7 methods accredited in 2013. Acquiring ISO 17025 accreditation has further strengthened
LANL’s reputation as a leader within the international nuclear community for its technical depth and
ability to produce accurate and precise analytical data. A discussion of challenges associated with
transitioning from a non-accredited to an ISO 17025 accredited analytical laboratory will be discussed.
2. Use and support of traceable pedigreed materials.
Analytical chemistry at LANL has addressed traceability in a multi-faceted effort. Initially, as part of
the broader community working with nuclear materials, expert personnel participated in discussions
over the last six decades to identify existing and emerging needs of the analytical laboratory
communities [7, 9, 12]. From recent discussions, LANL has collaboratively acted on 3 approaches to
making pedigreed materials more available: repackaging, recertifying, and producing new reference

L. Colletti et al.
3
materials. LANL is a logical and effective partner for these activity as it possessed (1) the facilities to
handle both the high activity and quantity of material; (2) trained personnel; (3) a 60 year,
demonstrated history with providing measurements for certification and production of Pu reference
materials in conjunction with NBL and NIST; (4) demonstrated excellence in providing high quality
measurements; and (5) a robust QA program.
2.1. Repackaging
The activity of many Pu CRMs have significantly increased due to 241
Am in-growth from 241
Pu decay
over the decades following certification., In many instances, the increased activity of Pu CRMs had
increased to the point that it became difficult to ship these materials to sites with very limited abilities
to handle more than milligram quantities of SNM. These sites could not receive the RMs as originally
packaged. Thus, repackaging into smaller amounts became an effective and relatively quick solutions
to make currently certified materials more widely available without the expensive and time-consuming
option of having to completely refabricate and re-certify these materials.
In 2008, LANL analytical chemistry repackaged CRM 136, 137, and 138 into smaller quantities.
These standards are most commonly used as isotopic QCs or calibration standards. The plutonium
sulfate tetrahydrate (Pu(SO4)2-4H2O), isotopic CRMs had been originally packaged in 1970 by NIST,
then called the National Bureau of Standards, as SRMs 946, 947, and 948. In 1982, the ownership of
these materials transferred to NBL and their identification changed to CRM 136, 137, and 138 with
new certificates of analysis issued. Each original SRM vial held 0.25g of material. Upon receipt and
un-packaging of this material, LANL identified several issues with the degradation of the old, original
packaging (see Figure 1).
Figure 1: Photos showing original packaging of these materials as received. Material was verified in
good condition, and the outer bag intact. Forty years of aging effects seen in the inner packaging. A)
Original colorless glass vials now opaque with brittle caps, B) inner containment bag completely
disintegrated.
These SRMs were successfully repackaged into 10 mg and 50 mg quantities. To verify that handling
during the repackaging process did not contaminate the materials, blanks modeling the entire process
were performed prior to the introduction of the RMs to the workspaces. This process was proceeded
by preparing the area with extensive clean up and introduction of new materials and supplies used for
processing. Blanks in this case returned values at the picogram levels for Pu. In addition, process
blanks were created and handled through the entire process of repackaging alongside the RMs. Pu
isotopic analyses of the re-packaged materials were carried out via thermal ionization mass
spectrometry on randomly selected vials. All verification measurements performed at LANL are
A
B

L. Colletti et al.
4
traceable to CRM 126a. (See Table 1 for comparison of the analyzed and certified values.) The
measurements carried out to support this work are within the uncertainties associated with the original
certified values, and the data verified that the material was not contaminated during handling [13].
Table 1: Example of verification data. Ten replicate analyses across multiple vials provided the data
below.
CRM 137 Pu Isotope Weight % (2/10/09)
238 239 240 241 242
LANL Average 0.230 78.705 19.039 0.7846 1.242
LANL uncertainties 0.001 0.008 0.008 0.0008 0.002
Certified Value,
(decay corrected) 0.228 78.703 19.040 0.786 1.244
Certificate uncertainties,
95% confidence interval 0.007 0.015 0.015 0.005 0.003
Absolute Difference 0.002 0.002 -0.001 -0.001 -0.002
The repackaged material became available through NBL in mid-2009. Figure 2 shows the materials as
they are currently packaged.
Figure 2: Newly re-packaged standards in A) first tape sealed, zip lock bag, B) second, heat-sealed,
Mylar bag, and C) final container ready for shipping.
2.2. Recertification
Another more involved approach is to recertify existing stocks of CRMs with more modern analytical
methods and technologies while applying principles from the Guide to the Expression of Uncertainty
in Measurement (GUM), also known as ISO/IEC Guide 98-3. In 2011, LANL worked with NBL to
analyze CRM 125a for U assay values using a modified Davies-Gray analysis. The original U125a
assay values are from the 1997 certificate determined using the high accuracy and precision NBL
titration method that was traceable to NBL’s CRM 99 Potassium dichromate standard.The LANL
modified Davies-Gray method was traceable to NBL CRM 112a U metal standard. LANL assay
values (Table 2) showed no statistically significant difference from the original certified value within
the uncertainty of the measurements, and supported an NBL decision to continue using the original
certified assay values produced by the high accuracy and precision titration method.
A B C

L. Colletti et al.
5
Table 2: Example of verification data provided to NBL for CRM 125a. Each analyst had n = 5 and
performed his or her work on different days.
CRM 125a U Assay (wt. %)
Expanded
uncertainty,
k = 2 (wt. %)
Certified value 1997 88.129 0.014
LANL, analyst 1, avg. 88.112 0.062
LANL, analyst 2, avg. 88.117 0.065
Absolute difference, analyst 1 -0.017 N/A
Absolute difference, analyst 2 -0.012 N/A
In 2013, NBL reissued the certificate of analysis including expanded information with many orders of
magnitude improvement in the certified isotopic accuracy and associated uncertainties. Also included
on the reissued certificate is a model purification date. This revised latter information is extremely
important for nuclear forensics applications since for the first time it provides a U chronometry RM
[8]. The great improvement in accuracy and uncertainty information, as well as the certified
purification date, allow this standard to be used in many more applications and provide the traceability
that many new forensic methods require.
2.3. Production
Finally, the most difficult and costly approach is to produce new RMs. The analytical chemistry group
and the wider Los Alamos assets have been involved in the production and independent
characterization of Pu-based RMs – for example, the Pu metal CRM126a (an isotopic and assay
standard) was produced and certified in 2004. More recently, LANL produced, packaged, and
characterized two Pu oxide reference materials. These will be certified for the trace actinides in Pu
along with Pu assay and isotopic compositions.
The first proposed RM material started as doubly electro-refined (very high purity) Pu metal. This
material was converted to oxide by exposure to air. The second proposed RM material was prepared
from kilogram quantities of oxide that went through extensive cleanup for actinides and trace element
including dissolution and ion exchange followed by oxalate precipitation and oxide conversion. In
both cases, the entire processing history of the material is known including the dates of chemical
separation. Both RMs were stabilized by calcining with slow ramp heating and then holding the final
temperature for two hours at 750 oC and 650
oC respectively. For relatively pure PuO2 RMs, these
temperatures ensure the materials are stable as determined by loss-on-ignition measurement. Higher
calcination temperatures could have been used, but this can result in a material that is much more
difficult to dissolve with standard acid dissolution protocols utilized globally. These temperatures are
high enough to ensure the RMs remain stable over time in the current storage/packaging environment.
These new RMs were portioned in labeled, sealed containers. Each container held between 160 to 200
mg of Pu oxide with 150 units total prepared. Characterization measurements were performed using
analysis protocols developed with NBL that ensured high quality results with traceability to existing
certified standards. These methods have been validated through participation in inter-laboratory
comparison programs where these attributes have been tested annually for the last decade.
Measurements performed included (1) Pu assay by controlled potential coulometry; (2) U assay by
isotopic dilution mass spectrometry; (3) Pu/U isotopic analysis by thermal ionization mass
spectrometry; (4) Am by gamma spectrometry; and (5) Np by total alpha counting and alpha
spectrometry and inductively coupled plasma mass spectrometry. Measurements were performed on
multiple vials, in duplicate for each sample for all measurements. A final report on these materials
was submitted to NBL to initiate the formal certification process in October 2013.

L. Colletti et al.
6
3. ISO 17025 Transition Challenges
LANL analytical chemistry has always maintained a robust QA program due to the consistent work
for nuclear energy (NQA-1 Quality Assurance Requirements for Nuclear Facility Applications
requirements) and defense programs (QC-1, Weapon Quality Policy requirements). Analytical
methods and associated procedures have defined QC measures to assure validity of a method’s
precision, accuracy, and sensitivity. Quality control measures may include, but are not limited to,
method blanks, laboratory control samples, laboratory surrogates, internal standards, matrix spikes and
matrix spike duplicates, interference check samples, serial dilution, and environmental contamination
controls. The acceptance criteria for each QC measure are identified and tracked via control charts.
Thus, the additional requirement to become ISO 17025 accredited requested by some external
customers did require a philosophical change to the way the QC program was implemented. To start
the process, a review of our existing programs against ISO 17025 requirements was conducted for the
group by independent QA specialists. This section will focus on the analytical quality activities that
required most effort.
3.1. Validation of ongoing methods
All QA programs at LANL require that a method be validated and tested for performance based on
accepted, peer reviewed, scientific principles. However, ISO 17025 requires that the validation of
bias, accuracy, and uncertainty have to be formally documented. Most of the methods used by the
analytical chemistry at LANL have formal validation reports for operations support documented over
the last several decades. These validation reports were modified as new technologies and instruments
were implemented within the method. However, during preparation for the ISO 17025 audit it was
discovered that no formal validation documentation existed for a few historical/classical methods.
Furthermore, these methods had been modified slightly due to the evolution in both environmental law
and health/safety rules and regulations since the time the originating peer reviewed papers were
published.
Due to the inadequate documentation, analysts reviewed 25 years of records and data to establish that
the modifications made to the original methods did not affect the quality of results being provided.
For example, analytical chemistry at LANL has been using a version of the Davies-Gray titrimetric
analysis modified to use ceric sulfate as the titrant with CRM 112a for calibration since 1992. The
record review found that two separate LANL technicians had run identical samples using the original
dichromate standard titrant method and the modified ceric sulfate titrant method prior to
implementation of the changes. These records included comments regarding modified method’s
performance. In addition, the modified method LANL currently uses was published in a peer report
by NBL [14]. This report was a rigorous statistical comparison of the original and modified methods,
finding that the two methods produced identical data on appropriately matrix-matched materials.
Finally, the method had continuous participation in an ongoing inter-laboratory comparison program
evaluating against International Target Values. As a result, memos and yearly reports from an
independent evaluator proved the modified method was yielding continuous, unbiased, and accurate
results with uncertainties that met international standards. With these facts in hand, a validation memo
formally documenting the history, the statistical accuracy, and uncertainty of the method, as well as
the ongoing excellent performance, was issued.
3.2. Procedural issues and potential impacts
Once a method is validated, and after proving long-term statistical control, the next challenge is to
keep the method validated by exercising the measurement system on a regular basis. It is also
important to maintain traceability through use of appropriate calibration and QC materials. Nuclear
forensic samples can sometimes provide unique challenges by being greatly different than production
samples [7, 15, 16, 17]. To address this, the program must be designed in a manner that allows for
variability found in material types so that the results are admissible in court or pass scientific peer
review. Therefore, when updating methods with new information, care must be taken to ensure that
additions to or deletions from the procedure do not change the overall validation status of the method.

L. Colletti et al.
7
The validation process should evaluate a sufficient variety of material types to verify and retain
method flexibility and conditional boundaries needed to produce defensible result in terms of
accuracy, precision, and uncertainty. For instance, Table 3 gives examples of wording that can
potentially lead to issues that preclude admissibility in court. However, if more flexible phrasing is
used with options for unusual materials or situations, the analyst can produce results that are court
admissible. Therefore, the initial method and associated validation approved by the customer and
performed by the analyst has to be designed in a careful, thoughtful manner. Years of experience at
LANL in the support of various national and international programs have resulted in procedures
already containing some flexible wording needed to address the variability sometimes encountered.
However, as part of the ISO17025 accreditation, this aspect was especially scrutinized. In some cases,
it was found that an updated validation was required to include some additional aspect or additional
flexibility in a method.
Table 3: Inflexible procedural wording compared to flexible procedural wording
Example Inflexible Flexible
Minimum number of
sample replicates
Run three replicates of
every sample.
Three replicates of each sample are
typically run unless the amount of available
sample is limited.
The supervisor will consult with the
customer to see if an analysis using less
than three replicates is acceptable or if the
customer wants the analysis cancelled.
Acceptance criteria
Sample analyzed “x”
value exceeding the
calibration range cannot
be used.
If a sample analyzed “x” value exceeds the
calibration point by
· For calibrations ≤ 1000 ppm, >250 ppm,
· For calibrations above >1000 ppm, >25%
1) Analyze a check standard that has a
certified value as close as possible to the
reported sample value.
2) If the check standard results are within
3-sigma from the standard’s certified value,
then the returned result for the sample may
be reported.
3) If the check standard results are not
within 3-sigma from the standard’s
certified value, the sample must not be
reported. Instead, obtain recuts and
recalibrate the system using the higher
value standard or reanalyze the sample
using a smaller sample size.
3.3. Performance assessment protocols
In order to assure a customer that the results provided are accurate and meet expected uncertainties,
ISO 17025 requires that all certified/accredited methods be evaluated by performance testing. The
minimum testing specified is two techniques per year with all certified techniques tested once within a
four-year window. Since analytical programs are only recently ISO-17025 compliant, LANL has
conservatively chosen to exceed this requirement by testing every method at least once every year for
both Pu and U matrices Assurance can be accomplished by participating in performance tests, inter-
laboratory comparison programs, or by monitoring QC data for matrix-matched, traceable standards.
The challenge for LANL – and all laboratories that do bulk special nuclear material nuclear forensic
L. Colletti et al.
8
work – is that there are currently very few certified (ISO 17043) performance test programs available
to participants in the US. This means round-robins or QC data from traceable RMs must be used.
Fortunately, US Department of Energy (DOE) has required US laboratories providing Materials
Control and Accountability analyses to participate in inter-laboratory control programs in order to
provide independent verification of analytical QC [18] and have long funded the NBL SME program
for U materials. Other agencies within the US government and international agencies (such as the
IRMM, CETAMA, IAEA and individual countries such as Japan) are beginning to implement regular
national and/or international performance test and benchmarking studies to study key attributes.
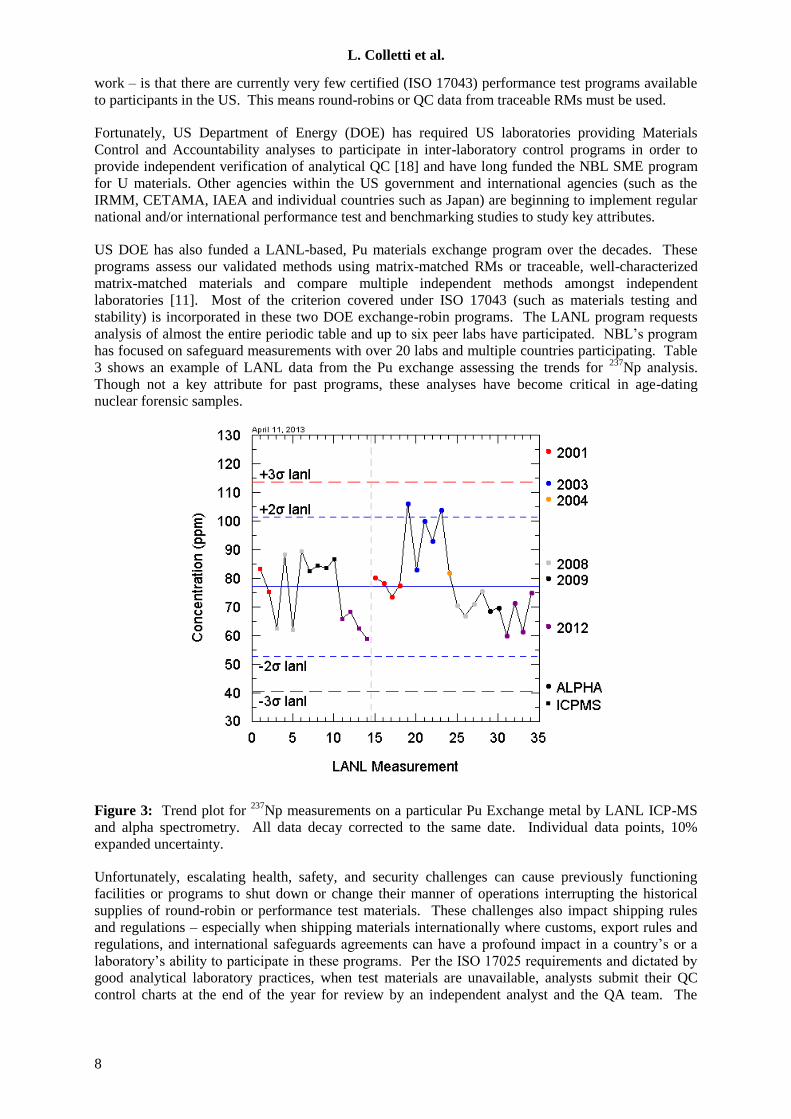
US DOE has also funded a LANL-based, Pu materials exchange program over the decades. These
programs assess our validated methods using matrix-matched RMs or traceable, well-characterized
matrix-matched materials and compare multiple independent methods amongst independent
laboratories [11]. Most of the criterion covered under ISO 17043 (such as materials testing and
stability) is incorporated in these two DOE exchange-robin programs. The LANL program requests
analysis of almost the entire periodic table and up to six peer labs have participated. NBL’s program
has focused on safeguard measurements with over 20 labs and multiple countries participating. Table
3 shows an example of LANL data from the Pu exchange assessing the trends for 237
Np analysis.
Though not a key attribute for past programs, these analyses have become critical in age-dating
nuclear forensic samples.
Figure 3: Trend plot for 237
Np measurements on a particular Pu Exchange metal by LANL ICP-MS
and alpha spectrometry. All data decay corrected to the same date. Individual data points, 10%
expanded uncertainty.
Unfortunately, escalating health, safety, and security challenges can cause previously functioning
facilities or programs to shut down or change their manner of operations interrupting the historical
supplies of round-robin or performance test materials. These challenges also impact shipping rules
and regulations – especially when shipping materials internationally where customs, export rules and
regulations, and international safeguards agreements can have a profound impact in a country’s or a
laboratory’s ability to participate in these programs. Per the ISO 17025 requirements and dictated by
good analytical laboratory practices, when test materials are unavailable, analysts submit their QC
control charts at the end of the year for review by an independent analyst and the QA team. The

L. Colletti et al.
9
review includes comparing QC data to the acceptance criteria stated in written procedures to ensure
that it is continuing to meet the specified performance conditions.
3.4. Law enforcement requirements
All forensic science must meet requirements of certainty such as maintaining a chain-of-custody,
ensuring sample integrity, applying corroborating methods of analysis, and rigorously validating
sensitivity and selectivity. Nuclear forensics often requires rapid analysis of unique samples with
additional safety and security requirements. In the US, analytical reports must follow Rules 701 and
706 of the Federal Rules of Evidence [5]. To meet these requirements, the reasoning and methodology
must be scientifically valid, properly applied, and have relatively widespread acceptance within the
scientific community. In addition, the techniques used must be previously tested, have existing
standards, and known error rates (uncertainties) [5].
The gap related to calculation of uncertainties proved to be the most challenging, not specifically for
the implementation of ISO 17025 itself, but because of customer requirements. The customer required
uncertainties be calculated using the GUM rather than reporting the simpler standard deviation from
repeat measurements or historical method uncertainty that many programs typically request. The
generation of these reports for forensic samples can be complex, labor intensive, and require additional
experimentation to provide legal support for the data used in the uncertainty models. Once initially
trained on GUM, analysts reviewed existing QC data to determine uncertainty factors for the models’
variables. For variables that did not have historical QC data, experiments were designed to not only
understand the measurement systems in greater detail, but to provide the required information for the
GUM models in order to calculate both Type A and Type B uncertainties. Finally, independent peer
review of the GUM models has resulted in greatly improved models that capture known sources
uncertainties for the techniques being modeled.
In addition, participation in the nuclear forensic program necessitated the development of detailed data
packages. Traditionally, data packages included relevant general information in support of the results.
However, with the potential for legal review, a procedure for the development of a full casebook was
written. The casebook procedure details the need to include, at the time of the report, all measuring
and testing equipment and associated calibrations, information sufficient for traceability
reconstruction, chain-of-custody documentation, raw data, associated correspondences, etc.
Understandably, these data package requirements create a significant amount of additional work.
4. Conclusions
Drawing guidance from the NIST and NBL, the US nuclear forensic community is working to define
and develop the well-characterized reference materials necessary to ensure the integrity of critical
forensic measurements. LANL, has assisted the global community of nuclear forensic analysis by
repackaging, providing measurements for re-certification, and producing these pedigreed materials to
assure traceability and validation for measurements. In addition, the analytical chemistry resources at
LANL have continued to validate historical methods, update protocols, and apply law enforcement
requirements to forensic samples while achieving and maintaining ISO 17025 accreditation.
ACKNOWLEDGEMENTS
Multiple agencies within the US Department of Energy National Nuclear Security Administration
(NNSA), US Federal Bureau of Investigation (FBI), and the US Department of Homeland Security-
Domestic Nuclear Detection Office (DHS-DNDO) supported the work described. Los Alamos
National Laboratory is operated by Los Alamos National Security, LLC for the U.S. Department of
Energy under Contract number DE-AC52-06NA25396. We would like to thank FBI: James
Blankenship, Kevin McLeary; NBL: Richard Essex, Peter Mason; NNSA: Steve Goldberg, Steve
LaMont, Heather Dion; DHS: Jeffery Morrison; NIST: Jacqueline Mann; LLNL: Michael Kristo;
LANL: Chris Worley, Elmer Lujan, Mariam Thomas, Khal Spencer, and Kathy Garduno.

L. Colletti et al.
10
REFERENCES
[1] TANDON et. al, “Nuclear, chemical, and physical characterization of nuclear materials” J.
Radioanal. Nucl. Chem. 276 (2008) 467-473.
[2] TANDON et. al, “Destructive analysis capabilities for plutonium and uranium
characterization at Los Alamos National Laboratory,” INMM 51st Ann. Proceed. (2010).
[3] KRAIEM, M., ESSEX, R.M., MATHEW, K.J., ORLOWICZ, G.J., SORIANO, M.D., ” Re-
certification of the CRM 125-A UO2 fuel pellet standard for uranium isotopic
composition,” Int. J. Mass Spectrom. 352 (2013) 37–43.
[4] RICHTER, S., et. al., “Improvements in routine uranium isotope ratio measurements using
the modified total evaporation method for multi-collector thermal ionization mass
spectrometry,” J. Anal. At. Spectrom., 26 (2011) 550.
[5] LEGGIT, J., INN, K., GOLDBERG, S., ESSEX, R., “Nuclear forensics—metrological basis
for legal defensibility,” J. Radioanal. Nucl. Chem., 282 (2009) 997-1001.
[6] INN, K.G.W, et. al. “A blueprint for radioanalytical metrology CRMS, intercomparison
and PE,” Ap. Rad. Iso., 66 (2008) 835.
[7] INN, K.G.W, et. al.; “The urgent requirement for new radioanalytical certified reference
materials for nuclear safeguards, forensics, and consequence management,” J. Radioanal.
Nucl. Chem., 296 (2013) 5-22.
[8] JAKOPIČ, R., STURM, M., KRAIEM, M., RICHTER, S., AREGBE, Y., “Certified
reference materials and reference methods for nuclear safeguards and security,” J. Environ.
Radioactiv., 125 (2013) 17-22.
[9] ROUDIL, D., RIGAUX, C., RIVIER, C., HUBINOIS, JC, AUFORE, L., “CETAMA
contribution to safeguards and nuclear forensic analysis based on nuclear reference
materials,” Procedia Chem., 7 (2012) 709-715.
[10] GRANIER, G., BALSLEY, S.D., BULYHA, S., AREGBE, Y., ROUDIL, D., “Round robin
‘Impurities in uranium matrix’: a success for CETAMA and IAEA,” Procedia Chem., 7
(2012) 666-672.
[11] BURR, T., KUHN, K., TANDON, L., TOMPKINS, D., “Measurement performance
assessment of analytical chemistry analysis methods using sample exchange data,” Int.. J.
Chem., 3 4 (2011) 40-46.
[12] WATERBURY, G.R., et. al., “Nuclear Materials (Fuels)-Panel 64,” Standard reference
materials and meaningful measurements: proceedings of the 6th Materials Research
Symposium, (Seward, R.W. Ed.), Institute for Materials Research: National Bureau of
Standards, Washington DC, (1975), 643-654.
[13] LUJAN, E.J., et. al. “Re-Packaging of Certified Reference Materials (CRM),” Rep. LA-UR-
09-4297, Los Alamos National Laboratory, NM (2009).
[14] ZEBROWSKI, J.P., ORLOWICZ, G.J., JOHNSON, K.D., SMITH, M.M., SORIANO,
M.D., “Evaluation on the Use of Cerium in the NBL Titrimetric Method,” Rep. NBL-332,
New Brunswick Laboratory, IL (1995).

L. Colletti et al.
11
[15] WALLENIUS, M., MAYER, K., RAY, I., Forensic Sci. Intern., 156 (2006) 55.
[16] MOODY, K.J., HUTCHEON, I.D.,GRANT, P.M. “Nuclear forensic Analysis,” CRC Press,
Taylor & Francis Group, Boca Raton, FL (2005).
[17] MAYER, K., WALLENIUS, M., FANGHANEL, T., “Nuclear forensic science—From
cradle to maturity,” J. Alloy. Cmpd., 444-445 (2007) 50-56.
[18] United States Departement of Energy, DOE Manual 474.1-1, Chapter II.4.e (7), (2000).

Technical Session 3E
IAEA-CN-218-51
1
Proof of Principle for the Preparation and Validation of an Uranium
Age Dating Reference Material
Z. Vargaa, K. Mayer
a, A. Hubert
b, I. Hutcheon
c, W. Kinman
d, M. Kristo
c, F.
Pointurierb, K. Spencer
d, F. Stanley
d, R. Steiner
d, L. Tandon
d, R. Williams
c
a European Commission
Joint Research Centre, Institute for Transuranium Elements
P.O Box 2340, 76125
Karlsruhe, Germany
b Commissariat à l’Energie Atomique et aux Energies Alternatives (CEA)
Bruyères-le-Châtel
91297 Arpajon Cedex, France
c Lawrence Livermore National Laboratory
7000 East Avenue, Livermore, CA, 94550
United States of America
d Los Alamos National Laboratory
P.O. Box 1663
Los Alamos, NM 87545
United States of America
Abstract. The present paper discusses the outcome of a joint effort of expert nuclear forensic laboratories in the
area of age dating of uranium. Completely separated uranium materials of known production date were
distributed among the laboratories, and the samples were dated according to the routine laboratory procedures.
The measurement results were in fairly good agreement with one another and also with the known production
date, thus strongly underlining that the concept for preparing such age dating reference material is valid and a
useful and appropriate certified reference material can be produced applying this methodology. The detailed
knowledge of the laboratory procedures used for measuring the age of the sample allows to identify possible
improvements in the current protocols and to develop the best practice for uranium age dating in the future. The
availability of age dating reference materials as well as the evolvement of the age dating best-practice protocol
will increase the relevance and applicability of age dating as part of the tool-kit available for nuclear forensic
investigations.
1. Introduction
If nuclear materials are diverted and afterwards interdicted, detailed investigation is required to
identify the possible origin, intended use and hazard related to the material. Such analysis, which is
now commonly referred to as nuclear forensics, involve the comprehensive physical, chemical and
isotopic measurements (e.g. physical dimensions, crystal structure, radioactive and stable chemical
impurities, classical forensic analysis) as well as the interpretation of these measured parameters [1-3].
Based on this complex information, the assumed origin of the material can be verified or for an
unknown material the provenance can be identified with high reliability.

Z. Varga et al.
2
Numerous characteristics (so-called signatures) of the material can be used for such purpose, such as
the isotopic composition of U, Pb or Sr, elemental impurities, trace-level radionuclide content, crystal
structure or anionic residues. Besides these parameters the elapsed time (commonly referred to as the
"age" of the material) since the last chemical purification of the material can also be measured for
radioactive (nuclear) materials. This unique possibility is based on exploiting the presence and decay
of the long-lived radionuclide (usually uranium or plutonium as major component in case of nuclear
materials): in the course of the production the radionuclide is chemically purified from the impurities,
including also its radioactive decay products. After production, the radioactive progenies start to grow-
in again in the material. Assuming that the parent-daughter separation was complete, the elapsed time
since the last separation, thus the production date, can be calculated according to the decay equations
after the measurement of the parent-daughter ratio in the sample. This age value enables either to
identify the origin of the unknown sample or to verify the source of the feed material. In contrast to
most other characteristics used in nuclear forensics, the production date of the material is a predictive
signature, thus it does not require comparison samples for origin assessment. This feature makes the
production date one of the most prominent signatures for attribution.
However, in order to put the obtained results on a more solid scientific or legally defensible
foundation, dedicated reference materials are required. In consequence, an emerging need for such
materials has been recently expressed by the community involved in national or international nuclear
security programs.
Our major objective was the preparation and validation of a uranium-based reference material, which
can be applied for the validation of age measurements based on the 230
Th/234
U chronometer. The
material was prepared from high-purity uranium solutions with various uranium enrichments by
completely separating the thorium decay product [4]. By this means, the production date is very
precisely known (with an uncertainty of less than about 5 hours). In contrast to other methods of
producing age dating reference materials , this approach does not require measuring the age of the
final material and thus deriving a certified production date, because, if all conditions are fulfilled
(completeness of separation, long-term stability, closed system), the 230
Th present in the material will
solely depend on the radioactive decay laws. Therefore, the material prepared can be used as a primary
standard for age dating of uranium materials.
The aim of the present collaboration is two-fold: firstly, to prove the applicability of this methodology
for the preparation of a uranium age dating reference material by the independent measurement of
expert laboratories. Since the validation requires the measurement of the 230
Th decay product at very
low level from the freshly separated material, state-of-the-art instruments and well-established
techniques are required. Secondly, this joint effort enables the identification of the best methodologies
(best practices) for uranium age dating. The availability of age dating reference materials will help
validate current and future age dating protocols, leading to a more robust source of nuclear forensic
signatures and a legally defensible basis for the use of age dating results in nuclear forensics
investigations. Validation of these methods will increase their relevance and applicability as part of the
tool-kit available for nuclear forensics investigations.
2. Preparation of the materials
The material was prepared from uranium after complete separation of thorium decay products (zeroing
the initial daughter nuclide concentration) at a well-known time and allowing the ingrowth of the
daughter nuclides.
The preparation of the material is described in details elsewhere [4]. The materials used were high-
purity uranium-oxide samples dissolved in nitric acid. Three uranium materials with different uranium
enrichments were prepared: natural uranium (0.71% 235
U abundance), low-enriched uranium (LEU,
approximately 4% 235
U abundance) and a highly-enriched uranium material (HEU, 235
U abundance is
about 70%). The dissolved uranium samples were purified with three consecutive extraction
chromatographic separations in order to completely remove the 230
Th decay product.

Technical Session 3E
IAEA-CN-218-51
3
The final thorium purification of the material took place on 19 July 2011. The purified uranium
solutions were aliquoted into screw-capped PFA vials right after the uranium purification and sample
homogenization. Approximately 30 mg U was placed into each vial, and then they were evaporated to
dryness right after its preparation to avoid loss of Th by adsorption.
The separation efficiency of Th was determined by gamma spectrometric measurement and by the
addition of 232
Th to the starting material and its re-measurement following the chemical separations. A
total separation factor of approximately 3 × 10⁷ was achieved, which corresponds to a
230Th/
234U ratio
in the final reference material of 10-11
– 10-13
at the time of preparation. Therefore, the residual 230
Th is
negligible compared to the ingrowth thereafter (corresponds to less than a few hours’ expressed as
time), and the amount of 230
Th in the material is then solely the function of the 234
U amount. The
number of atoms of 230
Th can be derived from the decay equations:
tt
UTh
UUTh
ThU eeNN 230234
234230
234234230
(1)
where NTh-230 and NU-234 are the number of atoms of 230
Th and 234
U in the sample, respectively, Th-230
and U-234 are the decay constants of 230
Th and 234
U, respectively, and t is the elapsed time since the
separation of the material.
3. Reported results from the participating laboratories
Aliquots of the prepared samples were shipped to the participating expert nuclear forensic laboratories,
where the production dates of the materials were determined according to their routine procedures.
The participating laboratories in this study were Lawrence Livermore National Laboratory (USA), two
laboratories from the Los Alamos National Laboratory (USA), DIF of CEA (France) and EC JRC
Institute for Transuranium Elements (European Commission). It should be noted, though, that the
analytical determination of the production date by measuring the parent/daughter ratio is fairly
challenging because the time span between the preparation and the measurement (approximately 2.5
years) is very small compared to the half-life of the parent nuclide 234
U (245 000 years). In
consequence, only minute quantities of daughter nuclide 230
Th will grow in and have to be separated
and accurately quantified. The reported age results are shown in Figs 1-3.
FIG. 1. Reported production dates for the natural uranium sample. Red line: known production date
(19 July 2011); Green line: average of the reported dates with the confidence interval expressed as
one standard deviation of the reported dates (dotted lines).

Z. Varga et al.
4
FIG. 2. Reported production dates for the low-enriched uranium sample. Red line: known production
date (19 July 2011); Green line: average of the reported dates with the confidence interval expressed
as one standard deviation of the reported dates (dotted lines).
FIG. 3. Reported production dates for the highly-enriched uranium sample. Red line: known
production date (19 July 2011); Green line: average of the reported dates with the confidence interval
expressed as one standard deviation of the reported dates (dotted lines).
The reported average production dates for the natural, LEU and HEU samples are 21/06/2011 (with an
uncertainty of 117 days at k = 2), 23/07/2014 (with an uncertainty of 42 days at k = 2) and 23/07/2011
(with an uncertainty of 23 days at k = 2), respectively. For all samples the reported averages are in
good agreement with the known production date of 19/07/2014 within measurement uncertainty. The
differences between the known production dates and the reported average production dates for the
natural, LEU and HEU samples are 27.2 days, 4.7 days and 4.5 days, respectively. As no significant or
systematic bias could be identified between the known and reported values of all three materials, the
methodology for such uranium age dating reference material is expected to be applicable, which is an
additional confirmation of the earlier study [4]. All the reported production dates of the individual
laboratories overlap with the average results even at 1-sigma level.
However, if one compares the individual laboratory results, significant differences can be observed.
While all reported individual HEU age results overlap with one another, in case of the LEU and
natural uranium samples the reported individual results from the laboratories are significantly different
(Figs 1-3). This difference is much higher for the natural uranium sample than for the LEU material,
which is in correlation of the 234
U content (and therefore with the amount of 230
Th progeny). As the
difference is possibly not related to the reference material properties (e.g. inhomogeneity between the
items), it is assumed to the consequence of the difficulties in the measurement of the trace-level 230
Th.

Technical Session 3E
IAEA-CN-218-51
5
In case of the natural uranium and LEU samples the corrections for the trace-level 230
Th measurement
are more significant than for the HEU material, thus more detailed studies and investigations are
necessary to develop more robust procedures in the participating laboratories. By sharing the details of
the existing methodologies, the possible inappropriate steps in the procedures can be rectified (Table I
and II). By this means the approaches can be harmonized and the best practices for age dating
measurements can be developed.

Z. Varga et al.
6
Table I. Analytical measurement methodologies of the participating laboratories
Lab A Lab B Lab C Lab D Lab E
Sample preparation
Sample taking, subsampling or sample pre-treatment
Sample was dissolved and aliquots were taken for U/Pa and U/Th analysis
Sample dissolved in original sample vials and transferred with rinses into weighed vial
Sample was dissolved in original vial prior to splitting
Total sample was dissolved in the original Teflon vial without splitting.
Total sample was dissolved in the original PFA vial without splitting/transfer.
Dissolution conditions (e.g. type of acid, temperature, labware type)
HCl UP, heated to 90°C overnight
4 M HNO3 + 0.05 M HF, into 30 mL PFA vial for primary solution, warmed on low temperature hotplate and ultrasonicated
Dissolved in heated acid (80-90 oC) for ~ 1 hour and allowed to equilibrate overnight prior to use.
24 hour closed vessel digestion on hotplate at 90˚C in 8M HNO3 (Optima HNO3 + triple distilled H2O)
Subboiled ccHNO3 (3 ml to 30 mg U), heated to 90 oC for 1 hour
Uranium analysis
Measurement technique and instrument type
TIMS (Triton) Static multi-collection on NuPlasma MC-ICPMS. U-isotopic composition measured first on un-spiked aliquots. U IDMS on separate spiked aliquot from secondary diluton
TE TIMS- VG Sector 54 Multi-collector TIMS U isotopic analysis TIMS, MTE-TIMS (Triton) and ICP-MS (Element2)
234U quantification method Isotope dilution with 233U IDMS using 233U spike. Isotope Dilution Isotope dilution on Element 2 ICP-MS + U isotopic composition by MC-TIMS
Isotope dilution
Sample amount used for U analysis
1.2 µg done in triplicate 0.4-0.6 µg U 3 mg 500 ng for U isotopic, 5 ng for U IDMS measurement
5 mg, done in duplicate
Thorium analysis
Measurement technique and instrument type
ICP-MS (Element XR) Peak jumping on secondary electron multiplier (229-230), NuPlasma MC-ICPMS
Ion Counting TIMS- Isotopx Isoprobe T
Isotope dilution on Element 2 ICP-MS (Element2)
Thorium chemical separation method
Ion chromatography (AG1X8), single step
Three step: anion exchange, TEVA extraction, anion exchange
Ion Chromatography (Lewatit MP5080)
Anion exchange x 3 (2 8M HNO3 columns then 1- 9M HCl column)
Extraction chromatography (TEVA), single step
230Th quantification method Isotope dilution Isotope dilution Isotope Dilution Isotope dilution Isotope dilution
Standards (calibrants) applied, manufacturer
229Th (AEA Technology) NBL U010 used for mass bias correction. NBL 229Th NIST SRM 4342A 230Th radioactivity solution
Custom-made natural 232Th (certified as weight fraction (Spex Certiprep Inc.)
Sample amount used for Th separation
1.2 µg done in triplicate 2.25 to 4.52 milligram U. 27 mg 1-3 mg, three replicates of each sample except natural U sample.
1 mg, three replicates are done
Mass bias/mass fractionation factor for Th measurement (if applied)
Exponential law correction with IRMM183 (U standard) in bracketing
0.99309 (230Th/229Th) determined from U standards during analytical session.
None applied as not enough data to quantify
NBL CRM-U010 measured by ICP-MS
Using uranium with CRM U010
Detector efficiency/gain measurement for Th
None (single collector ICP-MS) N/A – peak jumping on same detector. None None (single collector ICP-MS)
Abundance sensitivity measurement (if applied)
None measurement of 229Th/230Th; no significant amount of 232Th
None. Not applied. WARP used Measured 236U in NIST U-960 (natural U) as a monitor of peak tailing. No correction applied. Measured 232Th signals < 1e6 cps for all samples, natural U samples with comparable 238U signals exhibited negligible tailing.
Used on 230Th/232Th ratio with natural uranium with 236U abundance less than 10-9, linear correction
Typical absolute method blank Below 1 fg (4-5)×106 atoms 230Th 85 fg of 230Th 10-30 fg 230Th 30 fg of 230Th
Quality control sample used IRMM-184 (U standard) Table Mountain Latite, secular equilibrium standard for spike calibration check.
U-630 U and Th Fractions IRMM-035 IRMM-035

Technical Session 3E
IAEA-CN-218-51
7
Table II. Age dating calculation procedures of the participating laboratories
Age calculation 234
U half-life used 245 250 ± 490 years (k=2) (Cheng et al.,2000 [5])
245250 ± 490 years (Cheng et al., 2000 [5])
245500 ± 545 (k=1), from IAEA Live Chart
245,250 ± 490 years at 2σ (Cheng et al., 2000 [5])
245500 ± 600 (k=1), from Decay Data Evaluation Project (DDEP) [6]
230Th half-life used 75690 ± 230 years (k=2)
(Cheng et al., 2000 [5]) 75690 ± 230 years (Cheng et al., 2000 [5])
75400 ± 300 (k=1), from IAEA Live Chart
75690 ± 230 years at 2σ (Cheng et al., 2000 [5])
75380 ± 300 (k=1), from Decay Data Evaluation Project (DDEP) [6]
Quality control sample used
NBS100 None U 630 from NBL NBL CRM-125A and NBL CRM-U630 Self-prepared completely separated U with known production date
Software used for calculation
Excel spread sheet Excel GUM Workbench Pro Excel based LANL developed software
GUM Workbench
Approach used for uncertainty calculation
Error propagation BIPM Guide Estimates of uncertainty are standard deviations on internal independent observations propagated in quadrature with a coverage factor of two
BIPM Guide
Major uncertainty components
229Th concentration of the
tracer and counting statistic of 229
Th and 230
Th.
1) 230
Th measurement (229
Th spike calibration – Th standard uncertainty)
2) 234
U measurement (233
U spike calibration)
3) 234
U half-life 4) Mass bias corrections
Measured 229
Th/230
Th ratio,
229Th and
233U
concentration of the standard.
Measured 230
Th/229
Th ratio, 230
Th and 233
U concentration of isotope dilution standards, mass bias correction factors (NBL CRM U-010)
Measured 230
Th/230
Th ratio, 232
Th and 233
U concentration of the standards, mass bias correction factors

8
4. Conclusions
Based on the results we can conclude that the production methodology is a valid approach to obtain a
measureable and fit-for-purpose uranium age dating reference material. The average reported
production date results are in good agreement with the known production date. The reported individual
laboratory values for the HEU sample (containing higher amounts of 230
Th) are in agreement with one
another within measurement uncertainty. However, for the natural uranium and LEU samples more
pronounced differences could be observed. This reflects the enormous challenges associated with age
dating of such young material, particularly when the sample size is fairly small. Thus, further efforts
are required to improve existing methodologies for the lowest enriched and/or most recently-produced
materials.
REFERENCES
[1] MAYER, K., et al., Nuclear forensic science: Correlating measurable material parameters to
the history of nuclear material, Chem. Rev. 113 (2013) 884.
[2] KRISTO, M.J., TUMEY, S.J., The state of nuclear forensics, Nucl. Instrum. Meth. Phys.
Res. 294 (2013) 656.
[3] TANDON, L., et al., Nuclear, chemical, and physical characterization of nuclear materials,
J. Radioanal. Nucl. Chem. 276 (2008) 467.
[4] VARGA, Z., et al., Development and validation of a methodology for uranium
radiochronometry reference material preparation, Anal. Chim. Acta 718 (2012) 25.
[5] CHENG, H., et al., The half-lives of uranium-234 and thorium-230, Chem. Geol. 169
(2000) 17.
[6] DDEP, Monographie BIPM-5 - "Table of Radionuclides",
http://www.nucleide.org/DDEP.htm, accessed on 17 March 2014 (2014)

Technical Session 3E
IAEA-CN-218-29
1
First Certified Uranium Reference Material for the Production Date
in Nuclear Forensics
C. Venchiaruttia, Z. Varga
b, A. Nicholl
b, S. Richter
a, J. Krajko
b, R. Jakopic
a, K.
Mayerb, Y. Aregbe
a
a European Commission
Joint Research Centre, Institute for Reference Materials and Measurements (IRMM)
Retieseweg 111, B-2440 Geel
Belgium
b European Commission
Joint Research Centre, Institute for Transuranium Elements
P.O Box 2340, 76125
Karlsruhe, Germany
Abstract. In order to support research in Nuclear Forensics, the European Commission - Joint Research Centre
Institute for Reference Materials and Measurements in Geel (IRMM, Belgium) and the EC-JRC Institute for
Transuranium Elements in Karlsruhe (ITU, Germany) joined efforts to produce the first ever uranium reference
material certified for the production date. IRMM-1000 has been prepared from a low-enriched uranium solution
after complete separation of thorium decay products at a well-known time. Such a CRM is indispensable to
establish the accurate age of a nuclear material using validated mass spectrometric or radiometric methods. This
paper describes the preparation of IRMM-1000 and first steps towards the certification of this reference material,
as certified for the production date based on the 230
Th/234
U radiochronometer. The IRMM-1000 was produced in
compliance with ISO Guide 34 and will be available beginning of 2015 in units of two sizes, 20 mg for mass
spectrometric methods and 50 mg for radiometric methods.
1. Introduction
Nuclear forensics is a relatively young science, which develops and applies thorough, interpretative
and comparative (radio-) analytical methodologies to investigate the origin and intended use of nuclear
or other radioactive material intercepted from illicit trafficking. The parameters to be investigated are
inherent to the material and range from isotopic composition, microstructure, chemical impurities to
decay products [1-3].
Among these parameters, the elapsed time since the production of the material, commonly referred to
as the "age" of the material, is measured for nuclear materials. Indeed, during its production, the
nuclear material is chemically purified from impurities, which includes the removal of radioactive
decay products or daughter nuclides (typically decay products from U and Pu for nuclear materials),
thereby "zeroing" the initial amount of daughter nuclides in the nuclear material at the time of
separation. Therefore, assuming that the parent–daughter separation was complete and allowing the
ingrowth of the daughter nuclides in the sample, the elapsed time since the last separation (i.e. the age
of the material) can be determined by measuring the parent-daughter ratio later in the sample,
according to the equations of radioactive decay [4-5].
Unlike other characteristic parameters, this age of the material- i.e. the time elapsed since the last
chemical separation of the daughter nuclides from the mother radionuclide - does not require

C. Venchiarutti et al.
2
comparison samples or reference data for interpretation. It is a self-explaining parameter and supports
without ambiguity the identification of the origin of unknown material or helps to verify the source of
intercepted nuclear material. However, up to now, no certified reference material exists for validation
of measurement procedures to determine accurately the age or the production date of a nuclear
material. "Age determination" has been based so far on historical data, archives and on the
determination of the aforementioned combined parameters for the characterisation of nuclear material.
As a consequence, the European Commission - Joint Research Centre Institute for Reference Materials
and Measurements, IRMM in Geel (Belgium) and the EC-JRC Institute for Transuranium Elements,
ITU in Karlsruhe (Germany) joined efforts to produce the first ever uranium reference material
certified for the production date (IRMM-1000) to answer the emerging need expressed by
communities involved in national or international nuclear forensics, security and safeguards
programmes for such a reference material [2-3]. Reference materials are a prerequisite for method
validation. Such validated methods in combination with correct propagation of uncertainties are
required when characterising intercepted nuclear material, establish its origin, and identify perpetrators
and their network as well as providing evidence to bring them to justice [6].
Two parent/daughter pairs are generally used to determine the age of a highly enriched uranium
material: 234
U/230
Th and 235
U/231
Pa [7-8]. However, the lack of a suitable isotopic tracer and the
challenging processing currently prevent a broader application of the 235
U/231
Pa isotope ratio as an
efficient chronometer for U-age dating. Another constraint on the use of these radiochronometers is
the low concentration of daughter products, and therefore it requires a very sensitive measurement
technique such as Thermal Ionisation Mass Spectrometry (TIMS) or High-Resolution Inductively
Coupled Plasma Mass Spectrometry (ICP-MS) [7-8].
In this paper, we describe first the production of this reference material from low-enriched uranium
after the complete separation of the 230
Th decay product from its mother nuclide 234
U, thereby using
the 234
U/230
Th as radiochronometer for the determination of the production date. Then, we present the
characterisation and homogeneity study carried out according to ISO Guide 34 and ISO 17025 to
establish the reference value (i.e. the production date) and its uncertainty (according to ISO/IEC Guide
98-3) towards final certification and distribution as IRMM-1000.
2. Principle of uranium age-dating
The age of a uranium material can be calculated from the ratio of the measured 230
Th and 234
U amount
contents. Consequently, for the confirmation and homogeneity studies carried out in the context of the
certification of the IRMM-1000, as presented in the next sections, the 'target value' was the age of the
material estimated from the measurements of the thorium and uranium amount contents in the uranium
reference material at a certain time.
The method used to determine the two concentrations is based on Isotope Dilution Mass Spectrometry
(IDMS). In IDMS, a known amount of an isotope (ideally not present in the sample) of the element of
interest, called spike or tracer, is introduced in the sample and the ratio of the blend is then measured
[9]. Therefore, for the 230
Th determination a 232
Th spike was used and for 234
U, a 233
U spike was added
to the uranium fractions.
The simplified IDMS equation used to calculate the amount content of the analyte in the sample is
then expressed as follows:
YSpikeCRm
m
RR
RRXsampleAnalyteC X
X
Y
XB
BY ,,,
Equation 1
Where RX is the amount ratio in the unknown sample, RY the amount ratio in the spike, RB the amount
ratio in the blend (spiked sample), mX and mY are respectively the masses (in g) of unknown sample
and of spike used for the measurement and C (Spike, Y) is the amount content of the spike.

C. Venchiarutti et al.
3
That, for instance, gives the following equation for the 230
Th determination, with RX, RY, RB equal to
the amount ratio n(230
Th)/n(232
Th) in the sample, spike and blend respectively:
YX
X
Y
XB
BY
X ThCRm
m
RR
RRThC 232230
Equation 2
Note that to determine the production date/time of last purification of the daughter radionuclide from
the parent nuclide, the following assumptions are made: firstly, that there is disequilibrium between
the two radionuclides, secondly that the daughter nuclides have been completely removed after the last
separation (as assessed by the separation factor) and thirdly, a closed system is assumed with a
constant content of the parent nuclide (i.e. no variation in the 234
U content in the time frame of the
analysis). Therefore, based on these assumptions the equations of the radioactive decay can be
simplified and the age can be then determined using the measured amount ratio of n(230
Th)/n(234
U) in
the sample and the following equation [8, 10]:
U
UTh
Un
Thn
ThUt
234
234230
234
230
230234 )(
)(1ln
1
Equation 3
where t is the age of the uranium sample (in years), λ234
U and λ230
Th are the respective decay constants
of 234
U and 230
Th based on their half-lives (T1/2= 245.5 (1.2)·103 a and T1/2= 75.38 (0.3) ·10
3 a, k = 2,
respectively [11]) with λ= ln2/T1/2.
The amount contents of Th and U and the final age are traceable to the SI and their combined standard
uncertainties were determined by identifying and quantifying the sources of uncertainties for IDMS
according to the ISO/BIPM Guide to the Expression of Uncertainty in Measurement (GUM).
3. Selection of material, preparation and characterisation
The uranium age dating reference material IRMM-1000 was prepared from a mixture of low-enriched
uranium dioxide pellets of three different origin: one natural uranium (from Sweden) and two slightly
enriched uranium (at ~ 6% from Kazakhstan and at ~ 3% from Germany), resulting in a relative mass
fraction m(235
U)/m(U) of 3.6% in the base material. The mother solution used for the separation
contained about 20 g of uranium in 3 M HNO3, from which an aliquot containing about 6 gram of
uranium was used to produce the reference material.
Most of the instrumental methods and analytical procedures for the preparation and purification of a
uranium reference material (using TEVA resin) and associated - and ICP-MS measurements have
been fully described in [8] for a (highly enriched) uranium-based radiochronometry reference material.
Therefore, the methodology is only briefly described here and the preparation steps and measurements
are highlighted when different from the method used in [8], hence relevant for the production of the
IRMM-1000.
Note that one chemical separation of the uranium material requires a full day of laboratory work from
the evaporation of the sample, subsequent dissolution and weighing, the chromatography to separate
Th from U with intermediate -spectrometric measurements of the recovered fractions, and finally
evaporation of the sample [8].
The separation of the thorium from the slightly enriched uranium bulk matrix was done by extraction
chromatographic separation applying TEVA resin, in a "sandwiched-column" containing silica-gel,
thereby allowing as well the protactinium separation from the uranium material. However, the
certified production date of IRMM-1000 has been established after complete separation of thorium
decay products, there is no guaranteed complete separation from the Pa daughter. This means that

C. Venchiarutti et al.
4
when using the Pa/U chronometer, the certified reference value of IRMM-1000 can be used as
indicative value.
The separation was carried out in four consecutive separation steps, and for each step the solution was
divided into 16 aliquots and loaded on 16 separate extraction chromatography columns (Fig.1).
Figure 1 Four-step chemical separation using TEVA resin of the thorium from the uranium base
material to ensure efficient Th removal from the uranium matrix (U/Th separation factor > 107).
In order to ensure homogeneity of the sample throughout the whole process, the uranium eluates from
the sixteen columns were combined after each separation step, measured by -spectrometry and
evaporated overnight.
As the final separation factor and uranium recovery are very important to determine the
thorium/uranium separation efficiency (i.e. the completeness of the U/Th separation) and quantify the
effective recovery of uranium, measurements of the recovered U fractions (four batches A, B, C and
D) were performed using -spectrometry between each of the chemical separation using the well-
resolved -peaks of the short-lived 234
Th (T1/2= 24.1 days) and the 235
U (at 185.7 keV) respectively [7].
Moreover, a natural 232
Th tracer (1 mg of a Custom Claritas Standard with a total Th concentration of
1000 ± 5μg/g, k=2) was added to the solution before the second chemical separation in order to
determine later on by ICP-MS the residual thorium in the reference material after the last chemical
separation (Fig.1). Then, the procedure of chromatography, weighing and spectrometry was
repeated as described above.
The fourth and last chemical separation corresponding to the "production date", i.e. the reference value
of the material, was carefully recorded as dd/mm/yyyy and time. After this separation, the final
purified solution was aliquoted into cleaned PFA vials: altogether 108 units containing about 20 mg of
uranium and 53 units containing about 50 mg of uranium were prepared. The aliquots were evaporated
and kept in solid form in the capped and sealed vials.
Table 1 summarises the results obtained from the different -measurements (between each separation
and after the final separation) for the uranium recoveries using the 235
U and separation factors using
the 234
Th. These results (Table 1) proved that the 'target value' was reached, with an overall U
recovery of 83.7% ± 0.3% (relative standard uncertainty) and a cumulative U/Th separation factor (i.e
resulting from the four successive separations) better than 2.77 × 10⁷ ± 0.93 × 10
7 (standard

C. Venchiarutti et al.
5
uncertainty) attesting of the effective/quantitative recovery of uranium in the final reference material
and of the efficiency of the separation of Th from the uranium material.
The completeness of the removal of thorium from the initial uranium material was further confirmed
by the measurements of the Th amount content and isotope ratio by mass spectrometry using ICP-MS
and the 232
Th tracer that had been added to the uranium sample after the first separation. Based on this
measurement, the final (cumulative) U/Th separation factor was found to be higher than 1.81× 10⁷, but
still fulfilling the 'target value' with thorium in the purified solution being less than 0.01 μg/g uranium.
Note that other impurities in the final U material were measured as well by the ITU Analytical
Services but were identified to be insignificant for the determination of the age.
Table 1 Summary of the uranium recoveries (based on -peak of 235
U) and separation factors based on
-peak of 234
Th and on ICP-MS measurements of the total Th (traced with 232
Th) for each of the four
chemical separations and total separation factors (cumulative, i.e. from steps 1 to 4). Reported
uncertainties are standard uncertainties.
Separation steps U recoveries (235
U) SF from Th/U SF from total Th
1 95.0 ± 0.4 % 714 ± 126 714 ± 126a
2 94.9 ± 0.4 % 22 ± 4
3 96.2 ± 0.5 % 24 ± 4 25366
4 94.4 ± 0.4 % 75 ± 12
Cumulative 83.7 ± 0.3 % 2.8x10⁷ ± 0.9x10
7 1.8x10
7
a Note that for the first step no separation factor can be calculated based on
232Th since it is only
introduced in the sample after the first step. It is therefore assumed to be equal to the separation
factor based on the -determination of the U/Th ratio.
Based on the cumulative U/Th separation factor (Table 1) and the known initial n(230
Th)/n(234
U)
amount ratio in the uranium base material, any residual amount of 230
Th present after the last chemical
separation can be estimated. This can be done from measurements by ICP-MS of the n(230
Th)/n(234
U)
amount ratio in the purified uranium material directly after the last separation, but the amount of 230
Th
is often too close to the detection limit to be accurately measured. Therefore, by applying Eq. 3, the
residual 230
Th in the reference material can be expressed as a time and was found to be less than 1.3
hours in IRMM-1000.
Finally, the uncertainty on the production date of our uranium age-dating reference material includes
the uncertainty on the date of the last chemical separation (i.e. the time interval bracketing the exact
time of the last elution of Th from the U material ) and the uncertainty coming from the residual
thorium measured in the final purified uranium material. The elution of thorium lasting about 3 hours,
the uncertainty on the last elution time of the Th from the U material was estimated to be 1.5 hours in
order to account for the whole thorium elution time. Finally, the combined standard uncertainty
inherent to the production of the reference material was estimated to be 0.08 days (k=1).
4. Confirmation measurements of the certified reference value
After ingrowth of Th in the U reference material confirmation measurements were carried out
following ISO Guide 34 to assess if the measured age corresponded to the known production date.
This confirmation step consisted of the analysis of 6 randomly selected 20 mg out of the 161 IRMM-
1000 units. The 6 randomly selected 20 mg units (referred as A, B, C, D, E, F) were first dissolved.
The expected U concentration in these samples was ~ 10 mg/ml of total U and should correspond to an
amount of ~ 1 pg of 230
Th per sample 7 months after the production of IRMM-1000. Subsequently,
aliquots were prepared gravimetrically and by dilutions from the 2 ml dissolved samples in order to
measure the U isotopic composition using TIMS, the U concentrations by ICP-MS (and the thorium
isotope ratios and concentrations with ICP-MS. For the isotope dilution measurements, a 233
U spike
was used to determine the uranium amount content, whereas two different natural Th spikes (232
Th)

C. Venchiarutti et al.
6
were used to determine the thorium amount content [8]. With each of the 6 units, a procedural blank
(using 2 ml concentrated HNO3) and an unspiked sample were prepared as well. Procedural blanks
were measured before each measurement series and amount contents in the samples were corrected for
the respective bracketing blanks. The unspiked samples were measured with each corresponding
measurement series in order to establish RX, in the IDMS equation (Eq. 2).
After evaporation, the thorium and uranium fractions were recovered in 4% HNO3 to be measured
with the double-focusing magnetic sector ICP-MS, Element 2. The detailed mass spectrometric
parameters and corrections applied for the measurements of the n(230
Th)/n(232
Th) and n(234
U)/n(233
U)
amount ratios are described in [8].
Based on the 230
Th and 234
U amount contents determined by IDMS applying Eq. 1-3, the ages from the
six selected units and their associated expanded uncertainties (k=2) were calculated according to
ISO/BIPM using the GUM Workbench Software [12]. The calculated age values reported in Fig.2
were then compared with the known elapsed time between the production of the reference material
and the last chemical separation carried out for this study. The date of the separation of the first batch
A was taken as the reference date hereafter referred to as the "known age". Since the reference value,
i.e. the exact production date of IRMM-1000, cannot be revealed yet, the age values, calculated in
days, are presented in this study normalised to the known age (Fig.2).
A good agreement of the calculated ages per single units, the average age and the known age was
established (Fig.2); successfully confirming the completeness of the separation of the thorium from
the uranium during the production of the uranium reference material. Note that the associated
uncertainty of the known age (Fig.2) combines the uncertainty on the production date as given in the
previous section, i.e. 0.08 days (k=1), and the uncertainty of the reference time of the Th/U separation
for this study and is therefore of 0.21 days (k=2). Finally, the uncertainties on the calculated ages take
into account the performed replicate measurements (standard deviation), thereby resulting in an
expanded uncertainty of 4.6 days (k=2) on the calculated average age.
Figure 2 Final ages obtained for the 6 units selected for the characterisation study (blue), their
average (red) and the known age based on the reference value (burgundy) with their expanded
uncertainties (k=2).The age values are here normalised to the known age.
5. Homogeneity study
The homogeneity study took place about 14 months after the production of the reference material. For
the homogeneity test, 10 units (5 of 20 mg and 5 of 50 mg uranium units) were randomly selected
among the whole batch of IRMM-1000. The 20 mg uranium samples were referenced from A to E and
the 50 mg uranium samples from F to H.

C. Venchiarutti et al.
7
The randomly selected units of 20 mg and 50 mg uranium, in dry form, were first dissolved and
subsequently the same measurement procedures were applied as for the confirmation measurements
described in the previous section. All together 10 units/series of 3 replicates were prepared together
with an unspiked sample with each series and 8 procedural blanks, resulting in a total number of 48
samples to be measured for the homogeneity study.
The chemical separations were performed for each aliquot at consecutive dates. Therefore, the
separation for the first series of samples is considered as the reference date for the comparison of the
final results. The thorium fractions were measured with HR-ICP-MS in a randomised order as follows:
I, D, B, J, C, H, F, G, A, E.
Applying Eq 1-3 on the determined 230
Th and 234
U amount contents, the 30 ages for the selected units
and their associated expanded uncertainties (k=2) were calculated according to ISO/BIPM using the
GUM Workbench Software [12]. The results from the homogeneity study for the calculated ages per
selected unit (10 values) are presented in Fig. 3 in the chronological order of the ICP-MS
measurements. The overlap of the average age value with the known age, as well as with all the
individual age values confirmed the homogeneity of the complete IRMM-1000 batch.
The final evaluation of the homogeneity was carried out using an ANOVA Single Factor analysis
(analysis of variance) on the 30 age values (3 Th replicates x 10 units). No trend was observed in the
results related to the chronological order of the analysis and measurements (Fig.3).
The ANOVA analysis allows the separation of the method variation (swb) from the experimental
averages over the replicates measured in one unit to obtain an estimation for the real variation between
units (sbb). The relative standard uncertainty for method repeatability (swb) was 0.43%. The absolute
expanded uncertainty resulting from the homogeneity study was 7.8 days (k=2). This uncertainty will
be the major component of the expanded uncertainty of the reference value of IRMM-1000.
Figure 3 Calculated ages obtained for the 10 units selected for the homogeneity study (blue), their
average (red) and the known age based on the reference value (burgundy) with their expanded
uncertainties (k=2). The age values are here normalised to the known age.

C. Venchiarutti et al.
8
6. Conclusion
Combining the complementary capabilities of two JRC institutes enables the conception, preparation
and certification of the first ever uranium reference material certified for its production date. The
release of this new reference material, IRMM-1000 responds to a demand expressed by the Nuclear
Forensics International Technical Working Group (ITWG) and laboratories in the field. The results
from the verification and homogeneity studies both confirmed the completeness of the chemical
separation of thorium from uranium in IRMM-1000, and were fully consistent with the date of last
chemical separation. Moreover, these two studies demonstrated the accurate characterisation of this
material and the reference value as it will be given on the reference material certificate in dd/mm/yyyy
± days (k=2).
This new reference material is certified for the production date in uranium age-dating and can be used
in applications such as nuclear forensics, security and safeguards using the 234
U/230
Th parent/daughter
pair. Prior to the release of IRMM-1000, first the long-term stability study needs to be finalised during
summer 2014 and secondly the result reporting for the Regular European Inter-laboratory
Measurement Evaluation Programme (REIMEP-22) called "U Age Dating - Determination of the
production date of a uranium certified test sample" and based on this material needs to be closed [13].
The certified reference material IRMM-1000 should be available in 2015.
REFERENCES
[1] MAYER, K., WALLENIUS M., et al., Nuclear Forensics: A methodology applicable to
Nuclear Security and to Non-Proliferation. Journal of Physics: Conference Series 312-
062003 (2011). doi:10.1088/1742-6596/312/6/062003.
[2] MAYER K., Security: Expand nuclear forensics. Nature, 503, 461-462 (2013).
[3] MAYER, K., WALLENIUS, M., VARGA, Z., Nuclear Forensic Science: Correlating
Measurable Material Parameters to the History of Nuclear Material. Chemical Reviews,
113, 884 (2013)
[4] WALLENIUS M., MORGENSTERN A, NICHOLL, A.; FIEDLER R., APOSTOLIDIS C.,
MAYER K., Age determination of highly enriched uranium. IAEA-SM-367/5/07.
[5] VARGA, Z., SURANYI G., Production date determination of uranium-oxide materials by
inductively coupled plasma mass spectrometry. Analytica Chimica Acta, 599, 16-23 (2007).
[6] POMMÉ S., JEROME S.M., VENCHIARUTTI C., Uncertainty propagation in nuclear
forensics. Journal of Applied Radiation and Isotopes, 89C, 58-64 (2014).
[7] MORGENSTERN A., APOSTOLIDIS C., MAYER K., WALLENIUS M., Uranium age
determination: separation and analysis of 230
Th and 231
Pa. IAEA-CN-98/27P.
[8] VARGA, Z., NICHOLL, A.; WALLENIUS, M.; MAYER, K.., Development and validation
of a methodology for uranium radiochronometry reference material preparation. Analytica
Chimica Acta, 718, 25-31 (2012).
[9] DE BIEVRE P., PEISER H.S., Basic equations and uncertainties in isotope-dilution mass
spectrometry for traceability to SI of values obtained by this primary method. Fresenius,
Journal of Analytical Chemistry, 359, 523-525 (1997).
[10] LAMONT S.P., HALL G., Uranium age determination by measuring the 230
Th/234
U ratio.
Journal of Radioanalytical and Nuclear Chemistry, 264, 423-427 (2005).
[11] DDEP, 2004-2013. Table of radionuclides. Monographie BIPM-5, BIPM, Sèvres, website:
http://www.nucleide.org/DDEP_WG/DDEPdata.htm4.
[12] Programme GUM work bench 2.4 (Metrodata, GmbH, Weil am Rhein, Germany, 2009).
[13] https://ec.europa.eu/jrc/en/interlaboratory-comparison/reimep-22

Technical Session 3E
IAEA-CN-218-70
1
Atomic Energy of Canada Limited Prepares for Nuclear Forensic
Analyses
M. Totland, I. Dimayuga, A-M. Fillmore, S. Thomson, T. Shultz, R. Turgeon,
S. Howett
Atomic Energy of Canada Limited
Chalk River Laboratories
Chalk River, Ontario, K0J 1J0
Canada
Abstract. The Analytical Chemistry Branch (ACB) of Atomic Energy of Canada Limited (AECL) has focused
on the following areas of improvement to prepare for nuclear forensics analysis: accreditation to ISO/IEC
17025:2005, modernization of the sample logging database to a Laboratory Information Management System
(LIMS), and qualification under the IAEA’s Network of Analytical Laboratories (NWAL) for Nuclear Material
Analysis. The ACB obtained ISO/IEC 17025:2005 accreditation covering the Quality Assurance Plan and seven
specific procedures, including thermal ionization mass spectrometry (TIMS), inductively coupled plasma mass
spectrometry (ICP-MS), and radiochemical analysis. Modernization of the sample logging database has been
undertaken by installation of a Perkin Elmer LABWORKS LIMS. Configuration of the LIMS is nearing
completion and the testing phase has begun. The qualification procedure to join NWAL includes testing
shipment logistics and analysis of test samples. This was achieved through participation in the IAEA 2013
Nuclear Material Round Robin. Forty-five unknown uranium and plutonium nitrate salts were measured for
isotopic ratios by TIMS. Lessons learned from these endeavours will be discussed in this paper.
1. Introduction
AECL has focused on developing peaceful and innovative applications from nuclear technology for
over 60 years through its expertise in science and technology (S&T) and its more than 50 unique
facilities and laboratories, including fuel development, hot cells, gloveboxes, x-ray diffraction, neutron
beam, surface science and analytical chemistry laboratories. AECL is leading a national collaboration
with other federal government laboratories to establish a Canadian nuclear forensics laboratory
network. In preparation for AECL becoming part of this lab network, the Analytical Chemistry Branch
identified three opportunities for improvement to enhance the credibility of analytical results presented
as evidence in a court of law. These were accreditation to ISO/IEC 17025:2005 (International
Organization for Standardization/International Electrotechnical Commission), procurement of a
modern Laboratory Information Management System, and qualification as part of the International
Atomic Energy Agency (IAEA) network of analytical laboratories for nuclear materials. While
accreditation and a LIMS system are not strictly required by the partners in the Canadian National
Nuclear Forensics Capability Project, they are strongly supported by Canadian law enforcement.
Accreditation to ISO/IEC 17025:2005 started with a gap analysis between the existing quality
management system and the requirements of the standard. The ACB Quality Assurance Plan was
restructured to align with the requirements of the standard, and several procedures covering a range of
analyses were selected for the initial accreditation. An internal audit provided an opportunity to refine
our documentation and records management prior to an accreditation assessment from the Canadian
Association for Laboratory Accreditation (CALA), leading to successful accreditation to ISO/IEC

M. Totland et al.
2
17025:2005. The on-going internal and CALA assessments to maintain accreditation will provide
continual opportunities for improvement.
The ACB currently uses a quality assurance database developed in-house, using Windows Access
2000, to track samples, records, and equipment. Many features of this system became difficult to use
as the database grew, necessitating a reassessment. A decision was made to utilize a commercially
available LIMS, thus capitalizing on industry expertise in this area. Based on the client requirements
document, a commercial LIMS was procured from Perkin Elmer. Configuration of the Perkin Elmer
LABWORKS LIMS is underway, and experience gained is shared below.
As the third component of AECL’s laboratory capability improvement initiative, becoming qualified
as part of the IAEA’s NWAL for Destructive Analysis of Nuclear Materials represents the advantage
of AECL maintaining relevant equipment, procedures, and expertise. This is not only of direct value to
the IAEA program on non-proliferation and safeguards, but also of strategic importance to maintain
the capability in a ready state in the event it is required to respond to a nuclear forensics incident. As
part of the qualification process, AECL participated in a round robin exercise and subsequent technical
meeting for isotopic determination of U and Pu. Highlights from the exercise, including major lessons
learned, are discussed below.
2. ISO/IEC 17025:2005 Accreditation
Quality improvement has become a key national and international business strategy, and can raise the
national reputation and image of the ACB laboratories. Accreditation as an ISO/IEC 17025:2005
laboratory certifies that our laboratories have demonstrated the ability to produce technically valid
results and have displayed excellence in technical and laboratory management competence. This
accreditation assures continued technical competence and maintains a known standard of quality
management in the areas of personnel qualification and training, calibration and maintenance of
equipment, quality control and quality assurance procedures, testing and inspection procedures,
accurate recording and reporting of data, and appropriate test environments.
To move to accreditation, a gap analysis was performed between the existing quality management
system and the requirements of the standard. Advice was provided by AECL’s Whiteshell
Laboratories (Manitoba) as their analytical laboratory has held ISO/IEC 17025:2005 accreditation for
a number of years. Due to the detail and work involved in accreditation, it was recommended to move
progressively towards full accreditation. The initial scope included our Quality Assurance Plan (QAP)
(an overall governing document covering how analyses are performed across the ACB) and selected
procedures from the TIMS, ICP-MS, inductively coupled plasma atomic emission spectroscopy (ICP-
AES), radioanalytical and water analysis laboratories. This selection represented a cross-section of the
various laboratories within the ACB, providing an opportunity for all laboratory leaders to participate
in implementation of the ISO/IEC 17025:2005 standard, learn from the exercise, distribute the work
across a number of people, and ultimately ensure consistent application across the organization.
The ACB Quality Assurance Plan (previously structured according to the ISO 9001 standard) was
restructured to align with the requirements of ISO/IEC 17025:2005. An internal audit against the
standard was then conducted, followed by further refinement of the QAP, as well as the selected
procedures. Areas addressed included inclusion of method validation proof, and a statement that the
procedure was fit for use. Performance testing was also evaluated.
Participation in performance testing and/or interlaboratory comparisons is important in assuring the
quality of test and is a requirement for maintaining accreditation. Most laboratories in the ACB had a
strong track record in participating in voluntary performance testing with a history of 10 years.
Though some laboratories did not subscribe to regular performance testing in the past, they had
already participated in round robin testing competitions, or cross-technique comparisons.

M. Totland et al.
3
Performance testing can be a costly process. Materials, transport, reporting of results, and analyst time
all must be considered in this process. It can also be challenging to find suitable performance test
providers for some analyses/sample types on a yearly basis. When considering that performance
testing must occur regularly for accreditation and compliance, this cost must be recognized along with
the cost paid to the accrediting body. The latter is typically an annual fee comprised of a base price
plus an additional amount per procedure per matrix.
Following the refinement of ACB documentation and procedures, an external assessment was
performed for accreditation by a third party. In the case of ACB, the third party was the Canadian
Association for Laboratory Accreditation (CALA). CALA assesses in accordance with the ISO/IEC
17011 standard and assessments are conducted by highly trained volunteer assessors selected for their
strong analytical backgrounds. Issues recognized by the assessor were addressed by ACB to expedite
obtaining the ISO/IEC 17025:2005 accreditation.
Another challenge for analysis, particularly under the rigour of accreditation, is maintaining the
laboratory environment. The ACB is located in buildings built in the early 1970s and maintaining
steady temperature and humidity is difficult. Data loggers can be used to collect data for these
parameters, thus providing the documented proof of the actual conditions. Requirements have been
identified for air handling improvements for the buildings and this work is planned for the coming
summer. The laboratory ensures that the environmental conditions do not invalidate the results or
adversely affect the required quality of measurement despite the challenges of having to stop work
during adverse environmental conditions. Environment conditions that can affect the results of tests
are documented in the procedures and in some cases, it has been possible to test the impact of a wider
range of environmental conditions on the data quality and expand the acceptable operating conditions.
Following the internal audit, document and procedural refinement, and external assessment by CALA,
formal ISO/IEC 17025:2005 accreditation was received from CALA on July 29, 2013. Currently we
are preparing for our first CALA assessment following accreditation.
3. Procurement of a Laboratory Information Management System
The Analytical Chemistry Branch developed an in-house database based on Microsoft Access 2000,
which was used to log samples, quality control results, equipment information, and routine calibration
verification of pipettes and mass balances. As the database grew with use, the system became difficult
to use and maintain, some features did not get fully implemented, and functionality became limited to
only one user at a time. In addition, Access 2000 is not supported in Windows 7, thus as AECL moved
away from Windows XP, it became clear that a new database was required in order to meet the
laboratory information needs of the branch. An internal decision was made to purchase a
commercially available LIMS, thus capitalizing on the expertise from an experienced provider.
In order to plan for the implementation of a LIMS system, ACB met with other potential users at
AECL Chalk River Laboratories (CRL) to establish required features of a LIMS to facilitate
streamlined sample transfer between branches. A client requirements document (CRD) was developed
and sent out to the appropriate vendors which allowed AECL and ACB to evaluate which vendor
could meet all, or at least most, of our needs. From the vendor response, the Perkin Elmer (PE)
Labworks LIMS was chosen as the most appropriate system and vendor. Following this choice,
configuration work was initiated to align the features of the Labworks LIMS system with the
operational needs of the ACB.
As we are nearing the end of this phase and moving to testing and production, we can now reflect on
the pros, cons, challenges and lessons learned from the process. For this paper we have chosen to
highlight some of the configuration work done to develop a functional LIMS for our purposes,
specifically those which are useful for a nuclear lab and not offered in a typical or base level LIMS.

M. Totland et al.
4
3.1. Highlighted LIMS Configuration Development Work
The basic LABWORKS LIMS provides modules to define what is to be analyzed, by whom, in what
timeframe, with what equipment and quality control materials, the resultant data, and provides the
audit trail for future evidence. The Analytical Chemistry Branch also wanted to streamline data
upload, and ensure tracking of sample aliquots and equipment calibration/verification evidence. As
well, we wanted to use the LIMS to track and easily generate reports for radioisotope and fissile
material inventories for individual laboratories.
ACB chose not to interface the LIMS directly with analysis equipment. Samples are logged into the
LIMS, required analyses specified, and a batch built to specify required quality control samples. The
samples are then tracked with the unique LIMS sample identification number (also as a barcode),
analyzed as per the required lab procedure, and then data is manipulated in Microsoft EXCEL
calculation spreadsheets. To input the data into the LIMS, a macro-enabled spreadsheet was
configured by PE. The analyst is able to link data from their calculations into this sheet and easily
upload the sample and quality control (QC) results into the LIMS. User name entry is required for
upload, thus tracking the user that performed the analysis and upload. A requirement of ISO/IEC
17025:2005 is to trend QC results and this is accomplished using the base functions of the LIMS.
The EXCEL sheet is attached to the LIMS for record retention, and is available for independent
verification, including access to original data and calculations. The validation of data is tracked in the
LIMS and must be performed before an analysis report is generated from the LIMS. To meet
requirements of ISO/IEC 17025:2005 for maintaining the integrity of data, ACB utilizes locked cells
or tracked verification of manual entries in the EXCEL calculation spreadsheets. When attached to the
LIMS, record retention and audit trail requirements are met. This strategy for implementation of the
LIMS has provided ACB with the required flexibility to easily adapt to changing analysis
requirements.
An audit trail is an important part of daily operations in an ISO/IEC 17025:2005 accredited facility.
The LIMS provides an audit trail on all operations performed within the database. During
configuration, it is possible to specify actions that require user comments, a user’s password, or
stipulate actions that will be tracked in silent mode. The latter means that any time an analyst makes
changes to a sample or batch, the LIMS will capture their user name and the date without prompting
them. The LIMS was configured such that those changes deemed significant changes (to a sample or
batch) require a comment from the analyst, which is then captured and tagged to a sample.
Tracking of samples is an integral part of a LIMS. When portions of the sample are distributed to
different labs (sub-sampled), the LIMS must be able to track this as well. The LIMS was configured to
provide a unique identifier for the sub-sample, along with a new batch number. These are used by the
lab receiving the sub-sample. The original batch is linked to the sub-sample batch within the LIMS. It
is possible to generate an analysis report for all original and sub-sample tests together, or separately.
Some care was taken to ensure comments associated with the overall sample are distinct from
comments pertaining to specific analyses.
In addition to tracking samples, the ACB wanted to use the LIMS to track radioisotope and fissile
material inventories for individual labs. ACB staff worked with PE developers to utilize Special
Information Sheets to input this information into the LIMS, as well as retrieve this information from
the LIMS by generating summary reports with totals for specific categories of information. The
radioisotope inventories are used to ensure compliance with the AECL Radiation Protection Program,
while the fissile material inventory ensures compliance with the AECL Nuclear Materials and
Safeguards Management Program at a lab level. Development of the LIMS included a means of
tracking these Special Information details between labs when sub-samples are moved to a different lab
for analyses.

M. Totland et al.
5
3.2. Challenges and Lessons Learned
The LIMS procurement and configuration project generated many lessons learned for ACB. These
lessons fall into the categories: time, cost, and communication.
A considerable amount of effort was required to provide PE with more detailed descriptions of
customer requirements. This was initially underestimated. A Client Requirement Document was used
as a basis for the procurement process. In addition, a detailed design document should have been
developed prior to configuration. It was necessary to have regular meetings between key AECL staff
and PE developers to review progress on the configuration, demonstrate aspects of the LIMS, discuss
application details, provide examples of information to become part of the LIMS (for example
equipment details and code names, analyses performed, QC performed, units of measure, work flow
requirements, sample data and reporting requirements), and to brainstorm resolutions to challenges
between customer requirements and what is actually possible in the LIMS. This time commitment is
critical in the configuration phase to ensure that the features implemented in the LIMS are exact and
meet the client requirements. A detailed design document would also assist in the testing phase.
When discussing a LIMS system with a vendor, requirements must be defined very specifically. In
particular, the type of data and how it is input into the LIMS, as well as trending and output are very
important and specific to the customer. These items can be configured, but this requires that the
vendor has a proper understanding of the details of the customer, and the customer must know the
limitations of the basic LIMS. It is recommended that a facility become very familiar with a LIMS
system before looking at individual configurations.
Installation of a LIMS system requires both capital and staff resource commitment. Configuration of a
commercial LIMS to meet the needs of a laboratory requires a considerable commitment of staff time
to define the exact requirements, ensure the system functions in a meaningful way for the lab, and to
test the system. The cost of the LIMS software must also be considered, as well as the cost to have the
vendor configure the LIMS to specific requirements. Ongoing costs include the service agreement,
which covers customer support to fix issues arising while in use, as well as software updates.The
decision to utilize a commercial LIMS eliminated the need for internal program or database
development expertise, but does increase the initial cost. The cost of configuration was minimized by
limiting the scope of the configuration to two analysis groups within ACB (TIMS and multi-element).
During training, a small group of users was trained in more detail to allow them to expand the LIMS to
additional groups within the Analytical Chemistry Branch following implementation.
At this time, configuration for the two initial groups is almost complete and the testing phase has
begun. There may be additional lessons learned as we complete this work and put the LIMS into
production in the selected labs in ACB later this year.
4. Qualification for the IAEA’s Network of Analytical Laboratories for Destructive
Analysis of Nuclear Materials
In September 2012, an agreement was reached between the Canadian Nuclear Safety Commission
(CNSC) and the IAEA that stated that, with the support of the Canadian Safeguards Support
Programme, AECL Chalk River Laboratories (CRL) would proceed with qualification as a laboratory
for the IAEA’s Network of Analytical Laboratories (NWAL) for Destructive Analysis of Nuclear
Materials. A qualification procedure was provided Error! Reference source not found.] describing
the prerequisites and required steps. Staff from the IAEA visited CRL in April 2013 as part of the
planning phase covering topics of laboratory capacity, capabilities and limits, sample analysis, quality
system, shipping logistics and qualification logistics.
A significant step in the procedure is shipment and analysis of test samples, as well as review of
quality documentation. The first aspect was addressed by participation in the IAEA 2013 Nuclear
Material Round Robin [1]. Participating labs received 45 samples of U or Pu either as loaded filaments
for TIMS or microgram amounts of material as dried nitrate salts in Savillex containers. AECL chose

M. Totland et al.
6
the latter as our filament loading procedure did not match that of the IAEA. These test samples were
derived from standards and comprised of 7 U materials and 4 Pu materials. Shipment from the IAEA
Safeguards Analytical Laboratories, Seibersdorf to Chalk River, Ontario took 9 days, and was without
issue.
Preparations for the round robin included assessing the uncertainty of our TIMS measurements
relative to the 2010 international target values (ITVs) for measurement uncertainties [2], and a more
thorough implementation of GUM (the Guide to the expression of Uncertainty in Measurement) [3]
utilizing the recommendations by Bürger et al.[4].
In brief, the round robin samples were analyzed by dissolving the nitrate salts in nitric acid, further
refluxing the Pu samples with ferrous sulfamate and sodium nitrite, and adsorbing the analytes onto
small Acropor anion exchange discs. The Acropor anion exchange discs were then sintered onto zone
refined Re filaments and loaded in a double filament geometry in a MAT 262 TIMS. Operating
parameters were optimized to maximize the use of the faraday detectors for simultaneous isotope
measurements, with minor peaks being measured by peak hopping utilizing the retarding potential
quadrupole (RPQ) ion counter. Blanks and isotopic standards were prepared and analyzed along with
these samples.
The data verification step was incomplete at the deadline for submission of data. Unfortunately, an
error was made in reporting of two materials [1], even though the analyses had been correct. The
results presented here contain the corrected data (thus reflecting our normal procedure).
Figure 1 shows the results for U-235/U-238 ratio measurements, comparing the measured systematic
(s) uncertainty, random (r) uncertainty and combined (uc) uncertainty relative to the international
target values. Although all 45 samples were sent as individual materials, they were in fact 3 or 6
replicates of 11 different materials. The replicates have been pooled for this evaluation. The ITVs
differ for the different materials from depleted U (DU), natural U (NU), low enriched U (LEU) and
high enriched U (HEU), as given in FIG. 1. HEU #4 was a mixture of reference materials such that
each U isotope present was approximately a 1 to 1 ratio to the reference U-238 isotope. Figure 2
shows results for all three isotope ratios for HEU #4.
FIG. 1. AECL Measured U-235/U-238 Uncertainty vs. International Target Values (2010) Uranium
Samples, 2013 IAEA Round Robin
0.00
0.05
0.10
0.15
0.20
0.25
0.30
DU NU LEU, 2% LEU, 4.5% HEU, 35% HEU (#4) HEU, 74%
Pe
rce
nt
(%)
meas(s) ITV(s) meas(r) ITV(r) meas(Uc) ITV(Uc)
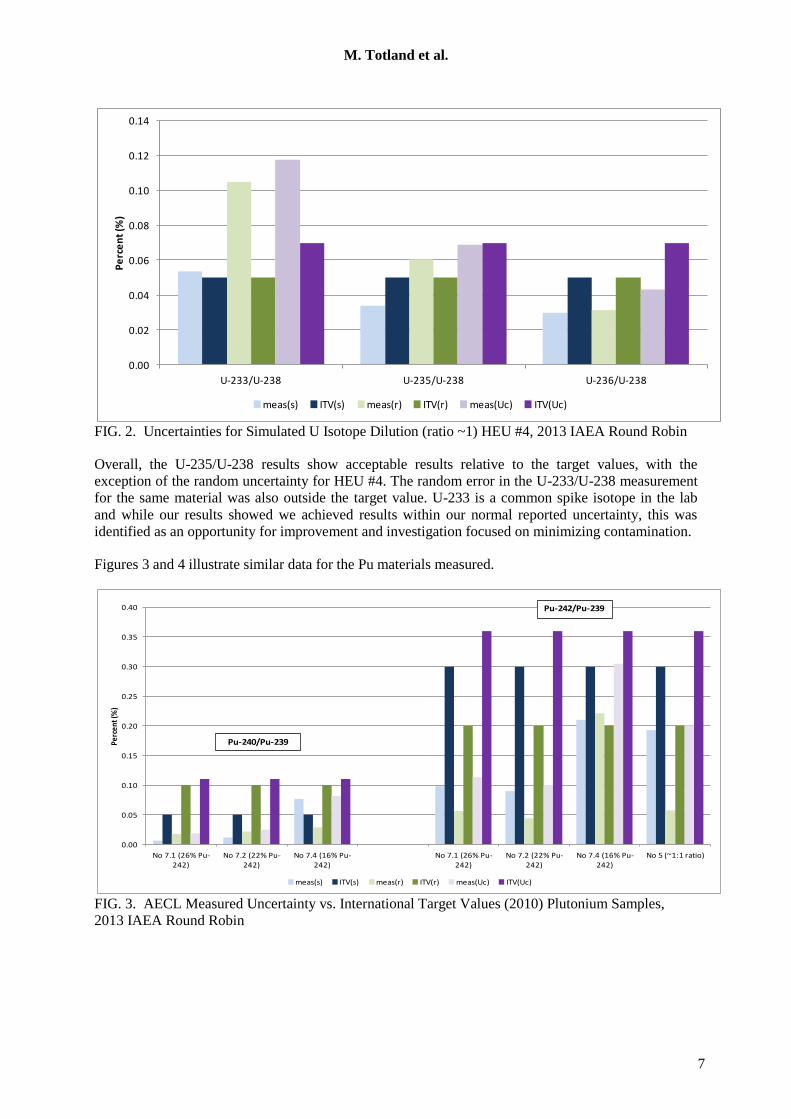
M. Totland et al.
7
FIG. 2. Uncertainties for Simulated U Isotope Dilution (ratio ~1) HEU #4, 2013 IAEA Round Robin
Overall, the U-235/U-238 results show acceptable results relative to the target values, with the
exception of the random uncertainty for HEU #4. The random error in the U-233/U-238 measurement
for the same material was also outside the target value. U-233 is a common spike isotope in the lab
and while our results showed we achieved results within our normal reported uncertainty, this was
identified as an opportunity for improvement and investigation focused on minimizing contamination.
Figures 3 and 4 illustrate similar data for the Pu materials measured.
FIG. 3. AECL Measured Uncertainty vs. International Target Values (2010) Plutonium Samples,
2013 IAEA Round Robin
0.00
0.02
0.04
0.06
0.08
0.10
0.12
0.14
U-233/U-238 U-235/U-238 U-236/U-238
Pe
rce
nt
(%)
meas(s) ITV(s) meas(r) ITV(r) meas(Uc) ITV(Uc)
0.00
0.05
0.10
0.15
0.20
0.25
0.30
0.35
0.40
No 7.1 (26% Pu-242)
No 7.2 (22% Pu-242)
No 7.4 (16% Pu-242)
No 7.1 (26% Pu-242)
No 7.2 (22% Pu-242)
No 7.4 (16% Pu-242)
No 5 (~1:1 ratio)
Perc
ent (
%)
meas(s) ITV(s) meas(r) ITV(r) meas(Uc) ITV(Uc)
Pu-240/Pu-239
Pu-242/Pu-239

M. Totland et al.
8
FIG. 4. AECL Measured Uncertainty vs. International Target Values (2010) Plutonium Samples,
2013 IAEA Round Robin
The Pu data shows that the majority of the target values were achieved, with the notable exception of
the systematic error in the Pu-241/Pu-239 measurement. Note that the systematic error can be either
positive or negative, and is plotted in Figure 4 as an absolute value for easy graphic comparison to the
ITV. In the case of Pu-241, it was a consistent negative bias that is under investigation.
Based on some of the challenges and lessons learned from this exercise, the ACB has implemented
some changes. To improve the throughput of analyses, additional staff are being trained in TIMS for
both sample analysis and data verification. In preparation for the round robin, additional
measurements were made to characterize contributors to the overall uncertainty and the Guide to the
Uncertainty of Measurement was applied manually. The GUM workbench for uncertainty
determinations has been purchased to facilitate the propagation of uncertainty and determine the
uncertainty budget. A recommendation [1] from the Technical Meeting was for laboratories to use QC
materials such as (certified) reference materials and blank samples to monitor and control the
performance of the analytical procedure and for the estimation of the associated measurement
uncertainties. The frequency of these QC measurements has been increased, as well as expanding the
use of control charts for immediate feedback and trending purposes. In response to another
recommendation of the round robin, an assessment is underway on moving to the total evaporation
technique for TIMS. AECL plans to participate in the next round robin exercise planned for 2015
which is aimed at moving towards higher masses of material and analysis of mixtures of U and Pu.
5. Conclusion
The steps taken thus far in all three areas have improved AECL’s ability to provide nuclear forensic
support to the government of Canada through the provision of timely and defensible analyses. Striving
for excellence in analysis via these improvement processes is a cornerstone of a nuclear forensics
program.
0.0
0.2
0.4
0.6
0.8
1.0
1.2
1.4
1.6
1.8
2.0
2.2
No 7.1 (26% Pu-242) No 7.2 (22% Pu-242) No 7.4 (16% Pu-242) No 7.1 (26% Pu-242) No 7.2 (22% Pu-242) No 7.4 (16% Pu-242)
Pe
rce
nt
(%)
meas(s) ITV(s) meas(r) ITV(r) meas(Uc) ITV(Uc)
Pu-238/Pu-239
Pu-241/Pu-239

M. Totland et al.
9
REFERENCES
[1] Qualification Procedure for the Network of Analytical Laboratories for Nuclear Material
Analysis, SG-SGAS-9017, IAEA Department of Safeguards, 2012 May 22.
[1] 2013 Nuclear Material Round Robin – Technical Meeting Summary, SG-RP-12319, IAEA
Department of Safeguards, 2013 July 18.
[2] International Target Values 2010 for Measurement Uncertainties in Safeguarding Nuclear
Materials, STR-368, Vienna, 2010 November.
[3] Joint Committee for Guides in Metrology, Evaluation of Measurement Data – Guide to the
Expression of Uncertainty in Measurement, JCGM 100:2008.
[4] S. BÜRGER, R.M. ESSEX, K.J. MATHEW, S. RICHTER, R.B. THOMAS,
Implementation of Guide to the expression of Uncertainty in Measurement (GUM) to multi-
collector TIMS uranium isotope ratio metrology, Int. J. Mass Spectrom. 294 (2010) 65-76.