challenges and investment opportunities for large - researchgate
TRANSCRIPT
IIFET 2012 Tanzania Proceedings
1
CHALLENGES AND INVESTMENT OPPORTUNITIES FOR LARGE-SCALE AQUACULTURE
FARMERS IN NIGERIA
Deji Adeoye, Plymouth University, United Kingdom, [email protected]
Yemi Akegbejo-Samsons, Federal University of Agriculture, [email protected]
Tunde Omoniyi, Federal University of Agriculture Abeokuta-Nigeria, [email protected]
Adewale Dipeolu, Federal University of Agriculture Abeokuta-Nigeria, [email protected]
ABSTRACT
Fisheries sector plays an important role in Nigeria economy. Contribution of the sector to the nation's economy can
be increased if challenges in the industry are minimized and the opportunities explored. Large scale aquaculture, an
economic activity earning people a living is a very important industry encompassing fish traders, fish processors,
fish farmers etc. The sector supports many Nigerians directly and indirectly. However fish importation is much more
in quantity and value. 80% of aquaculture production in Nigeria is manned by small-scale farmers, except for few
commercial ventures. Nigeria is blessed with numerous opportunities for large-scale aquaculture; however the
challenges seem to override these opportunities. Constraints to production in the industry have been identified as
recurrent high cost fish feed, poor water quality management, poor quality fish seed, technical know-how etc.
Beyond the constraints to production are more pertinent factors responsible for un-sustainability of fish farm
operation as business ventures. This paper focuses on the investment opportunities in large scale aquaculture and the
current challenges that the farmers are facing in Nigeria. The paper shows that unprofitable operation of fish farms
in Nigeria could be broadly attributed to two factors: poor production planning and inadequate technical know-how.
The paper recommends the need to commercialize the industry through broad government fiscal efforts and sectorial
re-organization in Nigeria.
INTRODUCTION
Aquaculture plays an important role in the development of many national economies and a key role in the socio-
economic resilience of rural areas, potentially offering valuable and skill-based employment opportunities, and in
some cases stabilizing the economic base of otherwise fragile communities (Edwards, 1999; Haylor and Bland,
2001; Muir, 1999). It provides livelihood options in rural areas of the developing world, as well as income and
employment in both remote regional and more developed economies.
Though aquaculture has grown strongly in most regions of the world where the potential exists, it has not done so in
Sub-Saharan Africa. In spite of various efforts since the 1950s, returns on government and international aquaculture
investments appeared to be insignificant (FAO, 2004) with less than 5% of the suitable land area being used. Sub-
Saharan Africa contribution to world aquaculture production is less than 1% (Hecht 2006). To support future needs,
capture fisheries will need to be sustained and if possible enhanced, and aquaculture developed rapidly, to increase
by over 260% i.e. an annual average of more than 8.3% by 2020 in sub-Saharan Africa alone (Muir, 2005), which is
significantly higher than recent levels.
In Nigeria, fish consumption accounts for about 35 percent of animal protein consumption. Recent data show that
Nigeria produced just over 600,000 metric tons of fish in 2007 (Table 1). Consumer demand, on the other hand, was
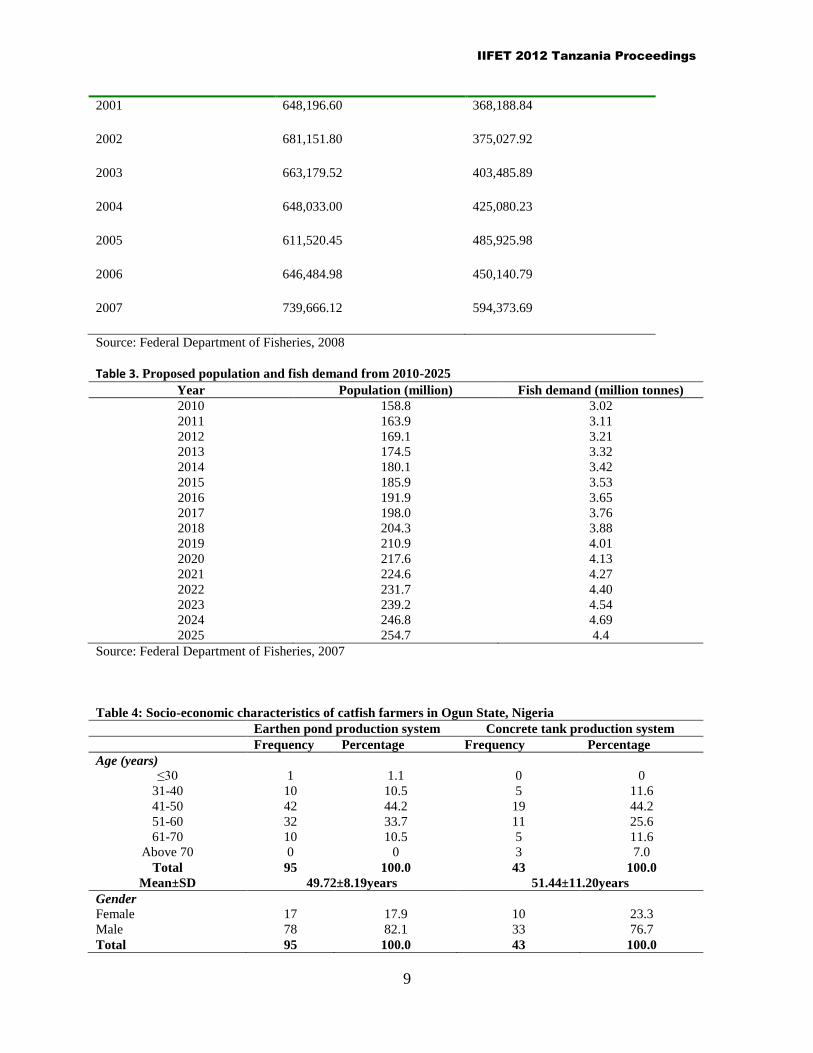
reported at 2.66 million metric tons, and was met only in part by imports of about 740,000 metric tons in year 2007
(Table 2). With rising population of Nigeria is attendant increase in fish demand and its projection (Table 3). Thus,
there is a national demand supply gap with fish importation making up the short fall at a cost of almost 0.5 billion
US dollars per annum (FDF, 2010). This leads to resultant foreign exchange drain on the nation’s economy. It is not
sustainable. However, the long term solution to the domestic fish supply gap still lies in boosting domestic
production through sustainable aquaculture practices (Aihonsu, 2001).
Today, the story of aquaculture in Nigeria is essentially the story of catfish culture and the hope of fish supply in
Nigeria hangs on its development and culture. Adewunmi et al, (2004) reported monoculture of catfish as
predominant practice in Nigeria. Thus, the growth of aquaculture in Nigeria now is largely being boosted by a
steady rise in catfish culture. African catfish is popular in the market and has great potentials to boost the rapidly
growing Nigerian aquaculture.
Though, aquaculture has been the fastest growing food-producing sector globally, its contribution to Nigeria’s total
fish production is still insignificant. Since the story of aquaculture in Nigeria is basically the story of catfish culture,
thus constraints to catfish production are also constraints to Nigeria aquaculture development and production. The

IIFET 2012 Tanzania Proceedings
2
major constraints identified as being responsible for the low production from aquaculture include shortage of inputs
(fingerlings and feed), lack of knowledge resulting in poor management practices, inadequate funding, theft and
direct involvement of government in production (Anetekhai et al, 2004). Use of poor quality catfish seeds,
inadequate information, high cost of feeds, traditional techniques, small-size holdings poor infrastructural facilities
and low capital investment are also factors reported to be limiting the growth of aquaculture in Nigeria (Ugwumba,
Ugboaja and Orji, 2006; Adeogun et al, 2007; Ugwumba & Nnabuife, 2008). Ugwumba and Chukwuji (2010) on
the other hands arranged the constraints to catfish production in descending order of severity as high cost of feeds,
lack of capital, scarcity of fingerlings, lack of modern technologies, high cost of transportation, high cost of labour,
lack of land, poaching, inadequate water supply, mortality of fish and lastly poor storage facilities.
Nath et al (2000) stated that there is still a great need for practical scientific knowledge, economic and profitability
studies and knowledge of potential areas for site selection, development and expansion. In this respect, reliable
analytical tools for use in decision making are key need in planning expansion. Thus, greater improvement in catfish
production can be achieved with a proper analysis that will lead to knowledge of the level of profitability of catfish
farming and constraints to production. This constitutes the basis for this study.
METHODOLOGY
Description of study area
The study was conducted in Ogun State, Nigeria. Ogun State is a state in South-western Nigeria. Ogun state lies
within longitude 20
45’ E and 3
0 35
’ E and latitude 7
0 01
’ N and 7
0 8’N in the tropics. It is bordered in the South by
Lagos State and Atlantic Ocean. It is bordered in the North by Oyo and Osun States. It is bordered in the East by
Ondo State and bordered in the West by Republic of Benin. Abeokuta is the capital and largest city in the state. The
State covers a land area of 16,762 km2; less than two percent of the country’s landmass. Ogun state has a population
of 4,054,272 (NPC, 2005). The areas of study are the four Extension Zones created by Ogun State Agricultural
Development Programme (OGADEP) which are: Abeokuta, Ijebu, Ikenne and Yewa Zones (Figure 1).
Data collection and analysis
The data was obtained with the aid of structured questionnaire to collect information on:
i. Socio-economic characteristics of the farmers. Socio-economic data included educational background of
the farmers, age, sex, marital status, household size, farming experience, technical know-how and
frequency of contact with extension agents.
ii. Production variables: Biological and economic inputs and output parameters of the catfish production.
Production variables considered were production units (concrete tank or earthen pond), production inputs
and their costs (farm size (number of catfish seeds stocked), labour, fertilizer, lime, medication, fuel cost,
transportation and feed), production output (yield and price of product).
iii. Production constraints. Data considered were severity of high cost of feed, inadequate fund (capital),
scarcity of catfish seeds, scarcity of quality fish seed (fingerlings/ juveniles), high cost of transportation,
high cost of labour, lack of space (land), poaching (theft), inadequate water supply, poor storage facilities,
disease outbreak, poor pricing by customers, flooding, post-harvest loss, prompt marketing after harvest;
and lack of technical know-how.
Sample Procedure
Multistage sampling procedure (involving purposive and simple random sampling technique) was adopted in this
study. The first stage was the purposive selection of the four agricultural zones (Abeokuta, Ijebu, Ikenne & Ilaro) in
the State. Two extension blocks were randomly chosen from each of the zone. The third stage involved the random
selection of twenty fish farmers from each of the block. A total of one hundred and sixty (160) respondents were
therefore selected from the four extension zones of the State. The selected fish farmers were interviewed with the aid
of structured questionnaires. The total number of questionnaires used for the analysis represented 86.25% (138) of
the total numbered of sampled fish farmers as 22 were discarded due to incomplete information.
Method of Data Analysis
Descriptive statistics was used to summarize and interpret data gathered on socio-economic characteristics.
Cost and return analysis was used to determine the profitability level of catfish production in the two production
systems; earthen pond production system (EPPS) and concrete tank production system (CTPS).
Total Cost (TC) = Total Fixed Cost (TFC) + Total Variable Cost (TVC)
IIFET 2012 Tanzania Proceedings
3
Where:
TFC consist of depreciated values of concrete tanks, earthen ponds, borehole/ well, generator, pelleting machine,
drying oven, drag net, other farm machineries & equipments.
TVC consist of costs of fish seed (fingerlings/ juveniles), lime, fertilizer, fish feeds, hired labour, medication, fuel,
transportation, and miscellaneous.
Gross Revenue (GR) consists of receipts from total sales. It is the product of quantity harvested for sales and unit
market price of fish per kilogram.
Gross Revenue = Quantity Harvested (kg) X Unit Market Price
Net Profit This was determined by deducting total cost of production (TC) from the gross revenue (GR)
Net Profit = Gross Revenue – Total Costs
Rate of Return on Investment (RRI) was determined by dividing net returns by total cost of production
Rate of Return on Investment = Net Returns/ Total Costs
Depreciation For this analysis, straight line method (SLM) which assumed salvage value of zero was used. The
formula is specified as:
Ds = (OC – SV)/ L
Where:
Ds = Annual depreciation
OC = Original cost
SV = Salvage value
L = Expected or useful life (year)
Duncan Multiple Range Test was used for ranking of production constraints in order of severity.
Stochastic Production Function The Cobb-Douglass function form for the catfish farms in the study areas is
specified as follows for the production function:
Yi = β0 + β1InX1i + β2InX2i + … + β7InX7i + Vi - Ui
Where:
Y = Catfish output (kg) X1= Lime quantity (kg)
X2= Fertilizer quantity (kg) X3= Feed input (kg)
X4=Medication X5= Labour input (man days)
X6= Fuel input (litres) X7= Farm size (number of fish seeds stocked)
Vi = random variable which assumed to be independently and identically distributed (iid) N(0,σv2) and independent
of U
Ui = non-negative random variable associated with technical inefficiency in production and is assumed to be
independent and identically distributed half normal (iid) N(0,σu2) where the conditional mean µ is assumed to be
related to farm and farms-related socioeconomic characteristics as follows:
The Inefficiency Model is specified thus,
µ = δ0 + δ2W1 + δ2W2 + … + δ5W5
Where,
W1 = Level of education of fish farmers W2 = Farmer’s age (years)
W3 = Farming experience of fish farmers (years) W4 = Length of production cycle (months)
W5 = Stocking rate (number of fish/ m2)
RESULTS AND DISCUSSION
Socio-economic characteristics of the catfish farmers
According to figure 2, 68.84% of the farmers operate earthen pond production system (EPPS) while 31.16% operate
concrete tank production system (CTPS) for catfish production. This might not be unconnected to the fact that fishes
thrive well in their natural environment. The socio-economic characteristics of the farmers in the study area are
presented in Table 4. 44.2% of the farmers operating EPPS and CTPS were between the ages of 41-50 years. 10.5%
of EPPS operators are between the ages of 61-70 years while 7.0 % of those farmers operating CTPS are above 70
years of age. However, 49.72±8.19years represent the mean age of farmers operating EPPS and 51.44±11.20years

IIFET 2012 Tanzania Proceedings
4
for those operating CTPS. This distribution shows that majority of the fish farmers are active and therefore have the
capacity for high productivity. This result is in agreement with Aromolaran et al (2008).
82.1% and 76.7% of the farmers operating EPPS and CTPS respectively are males. This result shows dominance of
men in fish farming occupation in the study area. However, more females (23.3%) operate CTPS than females
(17.9%) involved in operation of EPPS. For catfish farmers operating EPPS; 93.7% were married, 24% were single,
2.1% were widower, 1.1% divorced and 1.1% widow. However, farmers operating CTPS, 83.7% were married,
9.3% were widow, 4.7% were single and 2.3% divorced. Since most farmers sampled are married, it can be inferred
that since marriage allows for procreation and thereby providing access to use of family labour in fish farming
business. Household size of EPPS operators ranges from 1-20 people with an average of 7±3 people per household.
53.7% have 6-10 people per household, 31.6% have 1-5 people per household, 12.6% have 11-15 people per
household and 2.1% have 16-20 people per household. However, an average of 6±3 people per household was
observed among farmers operating CTPS. 55.8% have 1-5 people per house hold, 37.2% have 6-10 people per
household, 4.7% have 11-15 people per household and 2.3% have 16-20 people per household. This implies that fish
farmers can have access to use of family labour should there be scarcity of hired labour at any time.
Among farmers operating EPPS, 44.2% have secondary school education, 35.8% have tertiary education, 14.7%
have primary education, 3.2% have no formal education at all and 2.1% have adult education. However, among
farmers operating CTPS 55.8% have tertiary education, 34.9% have secondary education, 4.7% have primary
education and 4.7% again have adult education. Fish farmers are fairly well educated and this has implication for
productivity through easy acceptability of new innovation from extension workers. Years of fish farming experience
of farmers operating EPPS ranges from 1-20 with an average of 8±4.9 years. 47.4% have 6-10 years experience,
32.6% have 1-5 years experience, 14.7% have 11-15 years experience and 3.2% have above 20 years experience.
However, an average of 6.1±3.7 years of experience was observed among farmers operating CTPS. 48.8% have 1-5
years of experience, 39.5% have 6-10 years of experience, 9.3% have 11-15 years of experience and 2.3% have 16-
20 years of experience. Based on contact with extension agent, EPPS operators were distributed as follows; 73.7%
had fortnight contact, 21.1% had monthly contact, 3.2% had occasional contact and 2.1% had quarterly contact with
extension agent. For operators of CTPS however, 55.8% had fortnight contact, 14% had occasional contact and
4.7% had quarterly contact with the extension agent.
Cost and return analysis of the catfish farmers
The cost and return analysis of catfish farmers in the study area is presented in Table 5. The catfish farmers incurred
several costs in the course of catfish production. These costs include both variable and fixed costs of production.
The variable costs involved in the production include catfish seeds (fingerlings), lime, fertilizer, catfish feeds,
labour, medication, fuel, transportation and miscellaneous costs. The fixed cost items are made up of depreciation
values of earthen pond/ concrete tank, water pump, borehole, generator, pelleting machine, drying oven, dragnet and
others.
The total cost of production for farmers operating EPPS was N981, 720.79 ($5,890.32). Out of this amount, the
overall variable costs accounted for N919, 357.87 (93.65%), an equivalence of $5,516.15 while only N62,392.92
(6.35%), an equivalence of $374.36 was incurred on fixed cost items. Cost of feeds alone constituted about 61.98%
(N608,435.60, an equivalence of $3,650.61) of the total cost of production. This is followed by labour cost of
N179,441.00 (18.28%) an equivalence of $1,076.65 with a miscellaneous percentage of 0.44 (N4,275.00, an
equivalence of $25.65)
The total cost of production of farmers operating CTPS was N835,342.77k ($5,012.06). Out of this amount, the
overall variable costs accounted for 94.48% (N788,933.08, an equivalence of $4,733.60) while only 5.52%
(N46,409.69, an equivalence of $278.46) accounted for the fixed cost items. Cost of feed alone constituted 73.24%
(N615,540.50, an equivalence of $3,693.24) of the total cost of production. This is followed by cost of fingerlings of
8.65% (N72,654.76, an equivalence of $435.93) while the least is cost of fertilizer of 0.12% (N991.88, an
equivalence of $5.95).
It should be noted however that there was no significant difference at five percent level in the net profits of the two
production systems. This is supported by Ugwumba and Chukwuji (2010) who concluded that what matters in
catfish production profit is not pond type (concrete or earthen) per say but stock size (number of fingerlins stocked),
intensive feeding and sound management practices. However, Kareem et al (2008) and Adebayo and Adesoji (2008)
in their comparative study of catfish rearing in concrete tank and earthen pond system reported that fish growth is
greater in earthen pond than in concrete tank and hence their profitability too. On the other hand, Ugwumba and
Okoh (2010) revealed that catfish production using either production system is profitable.

IIFET 2012 Tanzania Proceedings
5
Stochastic production function estimation for the two catfish production systems
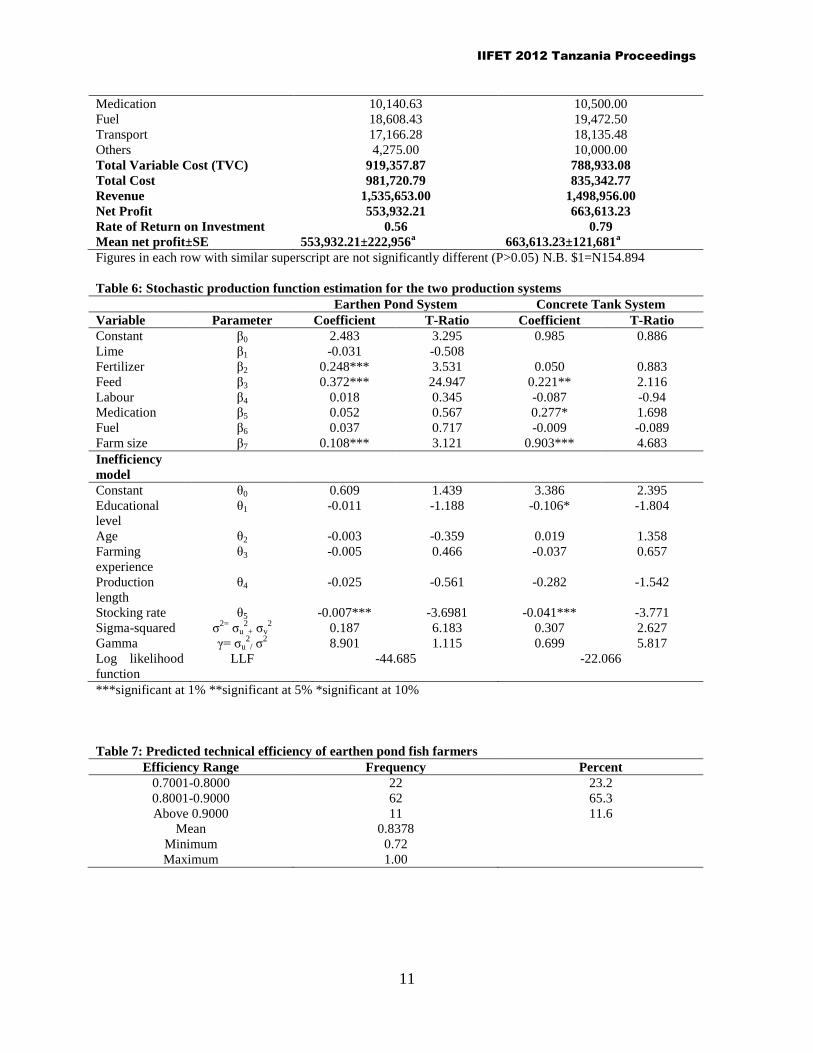
Table 6 shows the stochastic production frontier estimates for the two fish production systems. In EPPS, the results
revealed that all the variables except lime returned positive sign. Fertilizer, feed and farm-size were the variables
which significantly affect output of fish in the EPPS while lime, labour, medication and fuel were not significant.
All the significant variables (fertilizer, feed and farm size) had positive sign and were significant at 1% level. This
implies that increase in each variable will increase output of fish. Since the production function is in the Cobb-
Douglass form, the coefficients also represent elasticities of production with respect to the specific input. In the light
of this, the elasticities of fish output with respect to fertilizer, feed and farm size are 0.248, 0.372 and 0.108. This
implies that a 1% change (increase) in the quantity of fertilizer, feed and farm size will result in 0.248%, 0.372%
and 0.108% increase respectively in the output of fish. In other words, a 100% increase in the quantity of fertilizer,
feed and farm size will result in 24.8%, 37.2% and 10.8% change (increase) respectively in fish output.
The gamma value of 0.089 implies that 8.9% of the total variations in the output of fish farmers using EPPS were
due to difference in the inefficiency levels. The inefficiency model estimation revealed that stocking rate was the
only significant inefficiency variable. The variable returned a negative sign and was significant at 1% level. The
implication of this is that increase in stocking rate reduces inefficiency which means that it increases efficiency.
For CTPS, the results revealed that all the variables except labour and fuel returned positive sign. Feed, medication
and farm size were the variables which significantly affect output of fish in the CTPS while fertilizer, labour and
fuel were not significant. All the significant variables (feed, medication, and farm size) had positive sign and were
significant at 5%, 10% and 1% levels respectively. This implies that increase in each of these variables will increase
fish output.
Also, the coefficients here represent elasticities of production with respect to the specific input. Thus, the elasticities
of fish output with respect to feed, medication, and farm size were 0.221, 0.227 and 0.903 respectively. The
implication is that a 1% change (increase) in the quantity of feed, medication and farm size will result in 0.221%,
0.227% and 0.903% increase respectively in the output of fish. In other words, a 100% increase in the quantity of
feed, medication, and farm size will result in 22.1%, 22.7% and 90.3% change (increase) respectively in fish output.
The gamma value of 0.699 implies that 69.9% of the total variations in the output of fish farmers using CTPS were
due to difference in the inefficiency level. The inefficiency model estimation revealed that educational level and
stocking rate were the only significant inefficiency variables. The variables (educational level and stocking rate)
returned a negative sign and were significant at 10% and 1% levels respectively. This implies that increase in
educational level and stocking rate reduces inefficiency of CTPS and consequently increases CTPS efficiency.
This result is supported by Ogundari and Akinbogun (2010), Ugwumba and Chukwuji (2010), Olawumi et al (2010)
and Adewuyi et al (2010) who also submitted that fish output is significantly influenced by fish feed as the most
important input among others. Kareem et al (2008) using stochastic frontier production function models revealed
that pond area, quantity of lime used, and number of labour used were found to be the significant factors that
contributed to the technical efficiency of concrete pond system while pond, quantity of feed and labour are the
significant factors in earthen pond system. They therefore concluded that only years of experience is the significant
factor in concrete pond system in the inefficiency sources model.
Technical efficiency estimates of catfish farmers
Table 7 and 8 shows frequency distribution of the technical efficiency estimation of catfish farmers in the two
production systems in the study area. For farmers operating EPPS, majority (65.3%) of the farmers have technical
efficiency score ranging from 0.8-0.9, while 11.6% of the farmers have above 0.9technical efficiency score. The
mean technical efficiency score of the farmers is 0.84 with a minimum value of 0.72 and a maximum of 1.0. The
mean efficiency score still show some inefficiency in EPPS. Thus, there is still potential for increasing catfish output
at the given level of inputs being used.
Majority (18.6%) of farmers operating CTPS have technical efficiency score ranging from 0.5-0.6. However, the
mean technical efficiency score of the farmers is 0.61 with a minimum value of 0.03 and a maximum value of 0.96.
Mean technical efficiency score of 0.61 shows that there is substantial inefficiency in CTPS catfish farming in the
study area. This implies that there is potential for increasing output at the given level of inputs being used.
Kareem et al 2008 revealed that concrete pond system has 88% mean technical efficiency while earthen pond system
has 89%. Similarly, allocative efficiency results revealed that concrete pond system was 79 percent while earthen
pond had 85%. Also, Ekunwe and Emokaro (2009) in their study on technical efficiency in Kaduna metropolis,
Kaduna State, Nigeria used stochastic frontier production function analysis. Their results showed that the estimated
farm level technical efficiency ranged from 47.0 percent to 97.1 percent with a mean of 85.4 percent. About 90
percent of the farmer had technical efficiency exceeding 0.71. Fingerling, labour and pond size were efficiently
allocated as their estimated coefficient value range between zero and one.

IIFET 2012 Tanzania Proceedings
6
Production constraints of the catfish farmers
The ranking of catfish farmers’ production constraints is presented in Table 9. The constraints were ranked from one
to six; one being the most severe and six being the least severe rank. In EPPS, high cost of feed and inadequate fund
(capital) was ranked the most severe constraints to catfish production. Scarcity of fish seed (fingerlings/ juveniles)
and post-harvest loss was ranked least. Also in CTPS, high cost of feed was ranked most severe, inadequate fund
(capital) second and a group of flooding, disease outbreak and post-harvest loss were the least ranked constraints to
production.
This result is supported by Ugwumba and Chukwuji (2010) who also arranged the constraints to catfish production
in descending order of severity as high cost of feeds, lack of capital, scarcity of fingerlings, lack of modern
technologies, high cost of transportation, high cost of labour, lack of land, poaching, inadequate water supply,
mortality of fish and lastly poor storage facilities.
CONCLUSION
Judging by the Nigeria fish supply demand gap, aquaculture potential to bridge the gap and proven profitability
study of aquaculture, there exist enormous investment opportunities for large scale aquaculture venture in the
country. Foreign investors can target the pressing areas of constraints identified (cheap and quality feed production
especially) for investment. It is therefore recommended that government should intervene through broad government
fiscal efforts and sectorial re-organisation in Nigeria.
REFERENCES
Adebayo I.A., and Adesoji S.A. (2008). Comparative Assessment of the Profit margin of catfish reared in concrete
tank and earthen pond.African Journal of Agricultural Research Vol.3 (10),pp 677-680
(www.academicjournals.org/AJAR)
Adeogun, O.A; H.K. Ogunbadejo, O.A.; O.A. Ayinla; A. Oresegun; O.R. Oguntade; Alhaji Tanko and S.B. William
(2007). Urban Aquaculture: Producer perceptions and practice in Lagos state, Nigeria. Middle-East J. Sci.
Res. Res., 2:21-17
Adewunmi, M.O; Ayinde, O.E; Oladeinde, O.A. and Muhammad-Lawal, A. (2004). Economic Analysis of Fish
Farming in Ogun State of Nigeria.
Adewuyi S.A., Phillip B.B.,Ayinde I.A and Akerele D. (2010). Analysis of Profitability of Fish Farming in Ogun
State,Nigeria. JHum Ecol,31(3): 179-184
Aihonsu, S.O. (2001). Bank Loan Default by Small Scale Farmers in Ogun State, Nigeria. Ogun J. Agric. Sc., 1: 11-
20
Anetekhai, M.A.; Akin-Oriola G.A., Aderinola O.J. and Akintola S.L. (2004). Steps Ahead for Aquaculture
Development in Sub-saharan Africa-the case of Nigeria. Aquaculture, 239 (1-4): 237-248
Aromolaran A.B (2008).Analysing Research Use Efficiency on Fish Farms: A Case of Abeokuta Zone in Ogun
State,Nigeria.Aquafield 1 pp20-31
Ayansanwo T.O. (1999). Aquatic Biotopes, Fish and Fisheries of Ogun State, Nigeria. Aquafield. Volume. 1, No. 1
Banjo Oluwole Sikiru; Nosiru Marcus Omobolanle; B.J.O. Ayorinde and Odusina Olaniyi Adegoke (2009).
Improving Clarias Productivity Towards Achieving Food Security in Ijebu-Ode, Ogun State, Nigeria: A
Socioeconomic Analysis. Advances in Biological Research 3(1-2): 24-28
Barg, U. (1992) Guidelines for the promotion of environmental management of coastal aquaculture development.
Fisheries Technical Paper 328. 122pp Rome, Italy: FAO.quaculture Newsletter, 23: 4.
(http://www.fao.org/fishery/topic/14751/en#container)
Barg, U., Bartley D., Kapetsky, J., Pedini, M., Satia, B., Wijkstrom, U. and Willmann, R., 1999: Integrated resource
management for sustainable inland fish production. FAO
C.O.A. Ugwumba and R.N. Okoh (2010). African Clariid Catfish Farming in Concrete and Earthen Ponds: A
Comparative Profitability Analysis. Journal of Fisheries International Volume: 5, Issue: 1 : 14-18
Edwards, P. (1999) Aquaculture and overty: Past, present and future prospects of Impact. Fifth Fisheries
Development Donor Consultation, Rome, Italy, 22-24 February 1999 . Rome. Italy.
Egna, H.S. and Boyd, C.E. (1997). Dynamics of Pond Aquaculture. CRC Press, FL, USA.
Ekunwe, P.A and Emokaro, C.O (2009). Technical Efficiency of Catfish Farmers in Kaduna, Nigeria. Journal of
Applied Sciences Research 5(7): 802-805
FAO (1996). Food for All Summit, 13-17 November 1996, Rome.
(http://www.fao.org/docrep/X0262E/x0262e25.htm#y – accessed 14/11/2004)
FAO (2000). FAO Yearbook. Fisheries Statistics: Aquaculture Production 1998. Vol 86/2. FAO Fish. Ser. No. 56,
FAO Stat. Ser. No. 154. Rome, 169p.
IIFET 2012 Tanzania Proceedings
7
FAO (2002). The State of World Fisheries 2002 . FAO, (Ed.) 148pp FAO.
FAO (2003). The role of aquaculture in improving food and nutrition: Committee on World Food Security. 12-16
May 2003, Rome, Italy.
FAO (2004). Aquaculture extension in sub-Saharan Africa. FAO Fisheries Circular. No. 1002. Rome, FAO. 55p.
(govdocs.aquake.org/cgi/reprint/2005/115/1150200.pdf – accessed 25/07/07).
FAO (2011). Handbook of Fishery Statistical Standards. Section J: AQUACULTURE. CWP Data Collection. In:
FAO Fisheries and Aquaculture Department [online]. Rome. Updated 10 January 2002. [Cited 23 January
2012]. http://www.fao.org/fishery/cwp/handbook/J/en
FDF, Federal Department of Fisheries (2008). Fisheries Statistics of Nigeria. 5th Edition. 1995-2007, 49p.
FDF, Federal Department of Fisheries (2010). Fisheries Statistics of Nigeria. 7th Edition. 1995-2009, 56p.
FDF, Federal Department of Fisheries (2011).Fisheries Statistics of Nigeria. 8th Edition. 1995-2010, 69p.
Haylor, G. and Bland, S. (2001) Integrating aquaculture into rural development in coastal and inland areas. In:
Subasinghe, R.P., Bueno, P., Phillips, M.J., Hough, C., McGladdery, C.E. and Arthur, J.R.e., (Eds.)
Aquaculture in the third millennium technical. Proceedings of the conference on aquaculture in the third
millennium, Bangkok, Thailand, 20-25 February 2000, pp. 73-81. Bangkok, Thailand and FAO, Rome,
Italy: NACA and FAO
Hebicha, H.A; Gamal A.R. and Green, B.W. (1994). Economic Analysis of Different Tilapia Pond Culture
Hecht, T. (2006) Regional review on aquaculture development. 4. Sub-Saharan Africa –2005. FAO Fisheries
Circular. No. 1017/4. Rome, FAO. 2006. 96 pp.
Ita, E.O. and E.K. Sado (1984). Inventory survey of Nigeria Inland Water and their Fishery Resources with Special
Reference to Ponds, Lakes, Reservoirs and Major Rivers, Kainji Lake Research Institute, New Bussa.
177pp.
Jeje, C.Y. (1992). Post-larval Feeding of Clarias gariepinus (Burchell, 1822) on Cultured Zooplankton and Artemia
Diets. Proceedings of the 10th
Annual Conference of Fisheries Society of Nigeria (FISON), Abeokuta. 16-
20 November
Kareem R.O., Dipeolu A.O., Aromolaran A.B., and Y. Akegbejo-Samsons (2008).African Journal of Agricultural
Research Vol. 3 (4),pp246-254 (www.academicjournals.org/AJAR)
Kudi T.M., Bako F.P. and Atala T.K. (2008). Economics of Fish Production In Kaduna State,Nigeria.ARPN Journal
of Agricultural and Biological Science.Vol.3,No 5&6(www.arpnjournals.com)
Muir, J. (1999) Aquaculture and Poverty: Full Baskets or Empty Promises? Perspectives from DFID Aquaculture
Research Programme. Paper presented at the Fifth Fisheries Development Donor Consultation, 22-24
February, FAO, Rome.
Muir, J. (2005) Managing to harvest? Perspectives on the potential of aquaculture. Philosophical Transactions Royal
Society LondonB Biological Science (360(1453)):191–218
OGUNDARI Kolawole and Olajide O. AKINBOGUN (2010). Modeling Technical Efficiency with Production
Risk: A Study of Fish Farms in Nigeria. Marine Resource Economics, Volume 25, pp. 295–308
Oloruntoba, A. And D.A. Adegbite (2006). Improving Agricultural Extension Services through University Outreach
Initiatives. A case of Farmers in Model Villages in Ogun State, Nigeria. Journal of Agricultural Education
and Extension. 12 (4): 278-283
Pedini, M. and Shehadeh, Z. (1997) Aquaculture in Sub-Saharan Africa: Situation and Outlook. The FAO
Aquaculture Newsletter No.15. 3-6pp. Rome: Food and Agricultural Organization.
Pillay, T.V.R. and Kutty, M.N. (2005) Aquaculture: Principles and Practices. 2nd edn, 625pp Oxford: Blackwell
Publishing Ltd.
Tisdell, C. (2003). Economics and Marketing. In Aquaculture, Farming Aquatic Animals and Plants. Lucas, J.S. and
Southgate, P,C (Eds). Blackwell Publishing Ltd, Oxford OX$ “DQ, UK. ISBN 0-85238-22-7. Pp237-251
Ugwumba, C.O. A; M.O. Ugboaja and E.C. Orji (2006). Sustainable Catfish Seeds Production in Anambra state. In:
Asumugha, Ologede, Ikeorgu, Ano and Herbert (eds), Repositioning Agriculture for Sustainable Millenium
Development Goals in Nigeria: Proc. Agricultural Society of Nigeria (ASON) 40th
Annual Conference,
pp:512-514. Umudike, Umuahia, Nigeria.
Ugwumba, C.O.A. and Chukwuji, C.O. (2010). The Economics of Catfish Production in Anambra State, Nigeria: a
Profit Function Approach. J. Agric. Soc. Sci., 6: 105-109
Ugwumba, C.O.A. and E.L.C. Nnabuife (2008). Comparative Study on the Utilization of Commercial Feed and
Home-made Feed in Catfish Production for Sustainable Aquaculture. Multidiscipl. J. Res. Dev., 10: 164-
169

IIFET 2012 Tanzania Proceedings
8
FIGURE & TABLES
Figure 1. Catfish farmers’ distribution by aquaculture production system
Table 1. Nigeria domestic fish production by sectors (2001-2010) in tonnes
Sector/
Year
2001 2002 2003 2004 2005 2006 2007 200 2009 2010
Artisanal 433,537 450,96
5
446,203 434,830 490,594 518,537 504,226 511,382 598,211 616,981
Aquacultu
re
24,398 30,664 30,677 43,950 56,355 84,533 85,087 143,207 152,796 200,535
Industrial 28,378 30,091 33,882 30,421 32,595 33,778 26,193 29,986 29,698 31,510
Total Fish
Production
486,313 511,72
0
510,762 509,201 579,544 636,848 615,506 684,575 780,705 849,026
Source: Source: Federal Department of Fisheries, 2008
Table 2. Nigeria fish imports
Year Import (tonnes) Value ‘000 $
1995 266,448.00 140,308.75
1996 403,273.00 290,351.31
1997 382,442.00 158,632.74
1998 373,043.70 190,098.05
1999 444,840.00 209,958.64
2000 557,884.00 241,066.54
Concrete tank fish farmers
Eathen pond fish farmers
IIFET 2012 Tanzania Proceedings
9
2001 648,196.60 368,188.84
2002 681,151.80 375,027.92
2003 663,179.52 403,485.89
2004 648,033.00 425,080.23
2005 611,520.45 485,925.98
2006 646,484.98 450,140.79
2007 739,666.12 594,373.69
Source: Federal Department of Fisheries, 2008
Table 3. Proposed population and fish demand from 2010-2025
Year Population (million) Fish demand (million tonnes)
2010 158.8 3.02
2011 163.9 3.11
2012 169.1 3.21
2013 174.5 3.32
2014 180.1 3.42
2015 185.9 3.53
2016 191.9 3.65
2017 198.0 3.76
2018 204.3 3.88
2019 210.9 4.01
2020 217.6 4.13
2021 224.6 4.27
2022 231.7 4.40
2023 239.2 4.54
2024 246.8 4.69
2025 254.7 4.4
Source: Federal Department of Fisheries, 2007
Table 4: Socio-economic characteristics of catfish farmers in Ogun State, Nigeria Earthen pond production system Concrete tank production system
Frequency Percentage Frequency Percentage
Age (years)
≤30 1 1.1 0 0
31-40 10 10.5 5 11.6
41-50 42 44.2 19 44.2
51-60 32 33.7 11 25.6
61-70 10 10.5 5 11.6
Above 70 0 0 3 7.0
Total 95 100.0 43 100.0
Mean±SD 49.72±8.19years 51.44±11.20years
Gender
Female 17 17.9 10 23.3
Male 78 82.1 33 76.7
Total 95 100.0 43 100.0

IIFET 2012 Tanzania Proceedings
10
Marital status
Divorce 1 1.1 1 2.3
Married 89 93.7 36 83.7
Single 2 2.1 2 4.7
Widow 1 1.1 4 9.3
Widower 2 2.1 0 0
Total 95 100.0 43 100.0
Household size (persons)
1-5 30 31.6 24 55.8
6-10 51 53.7 16 37.2
11-15 12 12.6 2 4.7
16-20 2 2.1 1 2.3
Total 95 100.0 43 100.0
Mean 7.32±3.14 5.98±3.10
Educational level
Adult education 2 2.1 2 4.7
No formal education 3 3.2 0 0
Primary school 14 14.7 2 4.7
Secondary school 42 44.2 15 34.9
Tertiary education 34 35.8 24 55.8
Total 95 100.0 43 100.0
Experience (years)
1-5 31 32.6 21 48.8
6-10 45 47.4 17 39.5
11-15 14 14.7 4 9.3
16-20 3 3.2 1 2.3
Above 20 2 2.1
Total 95 100.0 43 100.0
Mean 7.99±4.85 6.13±3.66
Contact with extensionists
Fortnightly 70 73.7 24 55.8
Monthly 20 21.1 11 25.6
Occasionally 3 3.2 6 14.0
Quarterly 2 2.1 2 4.7
Total 95 100.0 43 100.0
Table 5: Cost and return analysis of catfish farmers in Ogun State Earthen pond production system Concrete tank production system
Amount(Naira) Amount (Naira)
FixedCost (Depreciation)
Pond (depreciation) 8,902.48 16,575.06
Pumping Machine 2,906.40 2,610.38
Borehole 8,446.43 10,808.61
Generator 6,937.27 4,790.90
Pelleting Machine 7,579.55 5,491.11
Drying oven 25,000.00 656.25
Dragnet 1,949.82 1,096.23
Others 640.97 4,381.15
Total Fixed Cost (TFC) 62,362.92 46,409.69
Variable cost
Seed 51,433.33 72,654.76
Lime 5345.4 -
Fertilizer 24,512.20 991.88
Feed 608,435.60 615,540.50
Labour 179,441.00 41,637.93
IIFET 2012 Tanzania Proceedings
11
Medication 10,140.63 10,500.00
Fuel 18,608.43 19,472.50
Transport 17,166.28 18,135.48
Others 4,275.00 10,000.00
Total Variable Cost (TVC) 919,357.87 788,933.08
Total Cost 981,720.79 835,342.77
Revenue 1,535,653.00 1,498,956.00
Net Profit 553,932.21 663,613.23
Rate of Return on Investment 0.56 0.79
Mean net profit±SE 553,932.21±222,956a 663,613.23±121,681
a
Figures in each row with similar superscript are not significantly different (P>0.05) N.B. $1=N154.894
Table 6: Stochastic production function estimation for the two production systems
Earthen Pond System Concrete Tank System
Variable Parameter Coefficient T-Ratio Coefficient T-Ratio
Constant β0 2.483 3.295 0.985 0.886
Lime β1 -0.031 -0.508
Fertilizer β2 0.248*** 3.531 0.050 0.883
Feed β3 0.372*** 24.947 0.221** 2.116
Labour β4 0.018 0.345 -0.087 -0.94
Medication β5 0.052 0.567 0.277* 1.698
Fuel β6 0.037 0.717 -0.009 -0.089
Farm size β7 0.108*** 3.121 0.903*** 4.683
Inefficiency
model
Constant θ0 0.609 1.439 3.386 2.395
Educational
level
θ1 -0.011 -1.188 -0.106* -1.804
Age θ2 -0.003 -0.359 0.019 1.358
Farming
experience
θ3 -0.005 0.466 -0.037 0.657
Production
length
θ4 -0.025 -0.561 -0.282 -1.542
Stocking rate θ5 -0.007*** -3.6981 -0.041*** -3.771
Sigma-squared σ2=
σu2
+ σv2
0.187 6.183 0.307 2.627
Gamma γ= σu2
/ σ2 8.901 1.115 0.699 5.817
Log likelihood
function
LLF -44.685 -22.066
***significant at 1% **significant at 5% *significant at 10%
Table 7: Predicted technical efficiency of earthen pond fish farmers
Efficiency Range Frequency Percent
0.7001-0.8000 22 23.2
0.8001-0.9000 62 65.3
Above 0.9000 11 11.6
Mean 0.8378
Minimum 0.72
Maximum 1.00

IIFET 2012 Tanzania Proceedings
12
Table 8: Predicted technical efficiency of concrete tank fish farmers
Efficiency Range Frequency Percent
≤ 0.3 4 9.3
0.3001-0.4000 6 14.0
0.4001-0.5000 6 14.0
0.5001-0.6000 3 7.0
0.6001-0.7000 6 14.0
0.7001-0.8000 4 9.3
0.8001-0.9000 8 18.6
Above 0.9000 6 14.0
Mean 0.6084
Minimum 0.03
Maximum 0.96
Table 9: Perceived ranking of Ogun State catfish farmers’ production constraints
Earthen pond production system Concrete tank production system
Production constraints Level of severity Level of severity
Scarcity of fish seed (fingerlings/
juveniles)
6 5
Scarcity of quality fish seed
(fingerlings/ juveniles)
4 3
High cost of feed 1 1
Inadequate water supply 5 4
Inadequate fund/ capital 1 2
Flooding 5 6
Disease outbreak 5 6
Poor pricing by customers 2 2
High cost of transportation 3 3
Post-harvest loss 6 6
Poor storage facilities 4 4
Prompt marketing after harvest 3 4
Lack of technical know-how 5 4
High cost of labour 2 3
Lack of space/ land 5 4
Poaching/ Theft 4 5
*1 being the most severe and 6 being the least