chabot college faculty/classified professional staff ... · faculty/classified professional...
TRANSCRIPT

Chabot College Faculty/Staff Accreditation Surveys: 1995, 2001, 2008, and 2014 Comparisons
Faculty/Classified Professional Staff/Administrator Accreditation SurveysChabot College
Based on samples of faculty, classified professional staff, and administrators.Number of Respnose: Fall 1995 (n=278), Fall 2001 (n=249), Spring 2008 (n=566), Spring 2014 (n=371)
Comparison of Fall 1995, Fall 2001, Spring 2008, Spring 2014 Similar Survey Items, by 2008/2014 Standards
Faculty/Classified Professional Staff/Administrator Accreditation Surveys
Percent who
Standard I: Institutional Mission & Effectiveness Agree Percentage of those responding
or Strongly Strongly Number PercentStrongly Agree Disagree Disagree Neutral* Agree Agree
A. Mission
to each question
Responses
I am familiar with the Chabot College vision/mission statement. 2008 71% 4% 9% 17% 49% 22% 528 95%2014 82% 3% 5% 10% 52% 30% 366 99%
I have used the Chabot College vision/mission statement in some aspect of my w 2008 61% 6% 10% 22% 42% 20% 527 94%2014 71% 5% 6% 17% 46% 25% 364 98%
I am familiar with the Chabot College values statements 2008 56% 5% 14% 25% 39% 17% 516 92%I am familiar with the Chabot College values statements. 2008 56% 5% 14% 25% 39% 17% 516 92%2014 64% 6% 12% 18% 44% 20% 363 98%
Institutional planning and decision making are guided by the vision/mission state 2008 50% 4% 11% 35% 39% 11% 424 76%2014 60% 2% 7% 30% 45% 15% 322 87%
At Chabot, there is a college-wide commitment to student learning. 2008 79% 3% 7% 12% 43% 35% 510 91%2014 87% 1% 4% 8% 44% 43% 356 96%
B Improving Institutional EffectivenessB. Improving Institutional EffectivenessPlanning
I contributed to the development of my unit plan. 2008 65% 9% 14% 12% 31% 34% 413 74%I contributed to the development of my area's program review 2014 70% 9% 10% 12% 34% 36% 304 82%The unit planning process in my area:
• is useful to me. 2008 58% 5% 11% 26% 39% 19% 384 69%The program review process in my area:
• is useful to me. 2014 56% 3% 14% 27% 39% 17% 292 79%The unit planning process in my area:
• has led to improvements in my area. 2008 53% 6% 12% 29% 35% 18% 381 68%The program review process in my area:
• has led to improvements in my area. 2014 56% 3% 14% 28% 37% 18% 284 77%p yThe unit planning process in my area:
• has led to new resources for my area. 2008 45% 8% 13% 33% 28% 17% 368 66%The program review process in my area:
• has led to new resources for my area. 2014 52% 5% 15% 27% 35% 17% 271 73%
NOTES: * 'Neutral' used in 1995 and 2001; 'Neither disagree nor agree' used in 2008 and 2014 Chabot College Office of Institutional Research Page 1 of 36

Chabot College Faculty/Staff Accreditation Surveys: 1995, 2001, 2008, and 2014 Comparisons
P t h RPercent whoStandard I: Institutional Mission & Effectiveness Agree Percentage of those responding
or Strongly Strongly Number PercentStrongly Agree Disagree Disagree Neutral* Agree Agree
B. Improving Institutional Effectiveness (continued)Planning
Responsesto each question
I have had input into the annual planning process in my division. 1995 58% 14% 17% 11% 37% 21% 247 89%I have had an opportunity to provide input into the College strategic planning pro 2001 56% 10% 16% 17% 48% 8% 202 81%I have had sufficient opportunity to provide input into the college-wide planning process.
2008 49% 7% 20% 24% 36% 13% 445 80%2014 48% 5% 16% 32% 32% 16% 315 85%
I am familiar with this year's college priority objectives. 2008 40% 8% 26% 26% 29% 12% 434 78%y g p y jI am familiar with the college's strategic plan goal 2014 58% 5% 18% 19% 40% 18% 314 85%The planning process at Chabot adequately identifies college priorities. 2008 41% 6% 16% 37% 34% 7% 372 67%
2014 47% 3% 16% 34% 37% 10% 286 77%The planning of educational programs, student services, staffing, and the use of
physical and financial resources is sufficiently coordinated. 1995 24% 12% 39% 25% 20% 5% 219 79%2001 21% 18% 41% 20% 18% 3% 193 78%2001 21% 18% 41% 20% 18% 3% 193 78%
The planning of educational programs, student services, staffing, and the use of physical and financial resources is sufficiently integrated. 2008 32% 10% 24% 34% 25% 7% 377 68%
2014 32% 8% 28% 32% 27% 5% 277 75%The college planning process is capable of responding/responds within a reasonable time to:
• changing needs such as student characteristics or demand for courses. 1995 26% 13% 36% 25% 23% 2% 226 81%h i f h d h i i l b k d d• changing factors such as student characteristics, labor markets, or course demand.
2001 18% 15% 37% 30% 16% 2% 195 78%2008 34% 9% 20% 37% 26% 8% 372 67%2014 37% 6% 23% 34% 30% 7% 283 76%
In the planning, development, evaluation, and revision of programs and services:• program review results are used. 2008 47% 5% 11% 37% 37% 11% 320 57%
2014 52% 2% 12% 34% 43% 9% 251 68%In the design and development of policies and programs:
• institutional research results are used. 1995 37% 5% 15% 43% 33% 3% 178 64%In the design, development, and revision of programs and services:
• institutional research results are used. 2001 45% 7% 16% 33% 41% 4% 150 60%In the planning development evaluation and revision of programs and services:In the planning, development, evaluation, and revision of programs and services:
• institutional research results are used. 2008 53% 4% 8% 36% 41% 12% 314 56%2014 62% 1% 6% 31% 46% 16% 241 65%
NOTES: * 'Neutral' used in 1995 and 2001; 'Neither disagree nor agree' used in 2008 and 2014 Chabot College Office of Institutional Research Page 2 of 36

Chabot College Faculty/Staff Accreditation Surveys: 1995, 2001, 2008, and 2014 Comparisons
Percent whoAgree Percentage of those responding
Standard I: Institutional Mission & Effectiveness or Strongly Strongly Number PercentStrongly Agree Disagree Disagree Neutral* Agree Agree
Faculty responses only:
Responsesto each question
The new academic program review process:• has helped me evaluate student learning in my classes. 2008 36% 8% 22% 34% 28% 7% 205 63%
The academic program review process:• has helped me evaluate student learning in my classes. 2014 51% 8% 19% 22% 40% 11% 224 69%
The new academic program review process:The new academic program review process:• is useful for identifying priorities for improvement or support. 2008 41% 8% 18% 33% 32% 9% 207 64%
The academic program review process:• is useful for identifying priorities for improvement or support. 2014 59% 5% 16% 20% 47% 13% 227 70%
B. Improving Institutional EffectivenessBudget and GrantsI have a clear understanding of the role of the College Budget Committee
in the budget process. 1995 20% 21% 39% 20% 16% 4% 237 85%College-wide and unit planning are linked to resource allocation. 2008 50% 6% 15% 30% 41% 9% 303 54%
2014 58% 3% 9% 30% 47% 10% 236 64%The status of the budget in my program/discipline/unit is available to me. 2008 53% 9% 15% 24% 39% 13% 375 67%
2014 54% 7% 13% 26% 35% 19% 281 76%I th d l t f th ll b d t I h l d t di f th l fIn the development of the college budget, I have a clear understanding of the role of:
• the College Budget Study Group (CBSG) 2001 20% 25% 37% 18% 17% 3% 174 70% • the College Budget Committee. 2008 24% 14% 28% 34% 20% 4% 488 87%
In the college planning and budgeting process, I have a clear understanding of the role of: • the College Budget Committee. 2014 27% 10% 27% 35% 20% 7% 349 94%
In the development of the college budget, I have a clear understanding of the role of:• the Institutional Planning and Budget Council (IPBC) 2001 23% 24% 35% 18% 19% 4% 177 71% • the Institutional Planning and Budget Council (IPBC) 2001 23% 24% 35% 18% 19% 4% 177 71%
• the Institutional Planning and Budget Council (IPBC) 2008 22% 14% 31% 33% 18% 4% 486 87%In the college planning and budgeting process, I have a clear understanding of the role of:
• the Planning, Review and Budget Council (PRBC). 2014 35% 9% 23% 33% 26% 9% 351 95%In the development of the college budget, I have a clear understanding of the role of:
• the Faculty Prioritization Committee. 2008 27% 13% 27% 32% 21% 7% 489 88%In the college planning and budgeting process I have a clear understanding of the role of:In the college planning and budgeting process, I have a clear understanding of the role of:
• the Faculty Prioritization Committee. 2014 36% 10% 20% 34% 26% 11% 348 94%
NOTES: * 'Neutral' used in 1995 and 2001; 'Neither disagree nor agree' used in 2008 and 2014 Chabot College Office of Institutional Research Page 3 of 36

Chabot College Faculty/Staff Accreditation Surveys: 1995, 2001, 2008, and 2014 Comparisons
Percent whoAgree Percentage of those responding
S d d I I i i l Mi i & Eff i
Responsesto each question
Standard I: Institutional Mission & Effectiveness or Strongly Strongly Number PercentStrongly Agree Disagree Disagree Neutral* Agree Agree
In the development of the college budget, I have a clear understanding of the role of:• the Enrollment Management Committee. 2008 25% 13% 27% 36% 20% 4% 485 87%
In the college planning and budgeting process, I have a clear understanding of the role of:• the Enrollment Management Committee. 2014 34% 11% 21% 34% 24% 10% 348 94%g
If I wanted to obtain a grant for my program, I know how to initiate that process at Chabot.2008 55% 7% 20% 19% 39% 16% 400 72%2014 44% 10% 23% 24% 30% 15% 301 81%
The Grant Development Office writes grant proposals to support major college priorities.2008 66% 2% 4% 28% 45% 21% 354 63%2014 66% 1% 4% 29% 44% 22% 273 74%
There is adequate coordination between faculty, classified staff, and administration in the college budget development process. 1995 11% 27% 45% 17% 10% 0% 210 76%
In the college budget development process:• there is adequate coordination between faculty, classified staff, and administration.
2001 16% 26% 36% 22% 15% 2% 165 66%In the budget development process in my area/unit:
• there is adequate communication between faculty, classified staff, and administration.2008 42% 11% 22% 24% 32% 10% 411 74%
In the budget development process in my program/discipline/area: • there is adequate communication between faculty, classified staff, and administration.
2014 49% 9% 18% 24% 36% 13% 292 79%I have adequate opportunity for participation in the budget process. 1995 22% 21% 35% 22% 21% 1% 220 79%I h ll b d d lIn the college budget development process:
• I have adequate opportunity for participation. 2001 31% 19% 28% 21% 27% 4% 186 75%In the budget development process in my area/unit:
• I have adequate opportunity for participation. 2008 46% 8% 20% 26% 34% 12% 420 75%In the budget development process in my program/discipline/area:
• I have adequate opportunity for participation. 2014 55% 6% 14% 24% 35% 20% 297 80%Research
The college evaluates how well its mission and goals are accomplished. 2008 59% 3% 9% 29% 48% 11% 361 65%2014 65% 3% 7% 26% 46% 18% 293 79%
The Office of Institutional Research provides data for college and program evaluation.2008 76% 1% 2% 21% 50% 27% 388 70%76% % % % % 7% 7 %2014 85% 0% 2% 13% 42% 42% 306 82%
I use Institutional Research data in the planning and evaluation of my courses/program/unit.2008 38% 10% 19% 33% 26% 12% 361 65%2014 51% 5% 18% 26% 28% 23% 290 78%
NOTES: * 'Neutral' used in 1995 and 2001; 'Neither disagree nor agree' used in 2008 and 2014 Chabot College Office of Institutional Research Page 4 of 36

Chabot College Faculty/Staff Accreditation Surveys: 1995, 2001, 2008, and 2014 Comparisons
Percent who ResponsesPercentage of thosePercent who Responsesreplied sometimes to each question
Standard I: Institutional Mission & Effectiveness or Number Percentoften Never Sometime Often of 558
B. Improving Institutional EffectivenessDialogue and Collaboration
respondingPercentage of those
gI participate in thoughtful, reflective dialogues about improving student learning
at these places and times:• on college-wide flex days. 2008 65% 35% 42% 23% 539 97%
2014 76% 24% 49% 28% 369 99%• in college-wide committees. 2008 46% 54% 33% 14% 531 95%
2014 56% 44% 37% 18% 369 99%2014 56% 44% 37% 18% 369 99%• in my division/discipline/program meetings. 2008 71% 29% 38% 32% 531 95%
2014 79% 21% 37% 42% 366 99%• in meetings with one or more colleagues. 2008 83% 17% 40% 42% 534 96%
2014 90% 10% 40% 50% 363 98%• informally, in hallways or offices. 2008 82% 18% 41% 41% 536 96%
2014 87% 13% 39% 48% 366 99%2014 87% 13% 39% 48% 366 99%I participate in thoughtful, reflective dialogues about improving institutional effectiveness
at these places and times:• on college-wide flex days. 2008 58% 42% 43% 15% 532 95%
2014 68% 32% 50% 18% 367 99%• in college-wide committees. 2008 45% 55% 29% 16% 528 95%
2014 53% 47% 37% 16% 367 99%• in my division/discipline/program meetings. 2008 66% 34% 43% 23% 529 95%
2014 74% 26% 47% 27% 367 99%• in meetings with one or more colleagues. 2008 76% 24% 44% 31% 532 95%
2014 81% 19% 51% 31% 370 100%• informally, in hallways or offices. 2008 74% 26% 45% 29% 531 95% informally, in hallways or offices. 2008 74% 26% 45% 29% 531 95%
2014 81% 19% 51% 30% 367 99%I collaborate or work with the following groups:
• faculty/staff in my unit or discipline. 2008 86% 14% 29% 57% 531 95%• faculty/staff in my area or discipline. 2014 92% 8% 26% 66% 365 98%• faculty or staff in my division. 2008 86% 14% 38% 48% 528 95%• faculty or staff in my division or program 2014 90% 10% 35% 55% 363 98%• faculty or staff in my division or program. 2014 90% 10% 35% 55% 363 98%• faculty or staff outside of my division. 2008 66% 34% 37% 29% 523 94%• faculty or staff outside of my division or program. 2014 76% 24% 47% 29% 365 98%
NOTES: * 'Neutral' used in 1995 and 2001; 'Neither disagree nor agree' used in 2008 and 2014 Chabot College Office of Institutional Research Page 5 of 36

Chabot College Faculty/Staff Accreditation Surveys: 1995, 2001, 2008, and 2014 Comparisons
Percent whoAgree Percentage of those responding
St d d I I tit ti l Mi i & Eff ti
Responsesto each question
Standard I: Institutional Mission & Effectiveness or Strongly Strongly Number PercentStrongly Agree Disagree Disagree Neutral* Agree Agree
B. Improving Institutional Effectiveness Integrity, Equity, DiversityThe information that Chabot College presents to the public about my program/discipline/
area is current and accurate 2008 71% 5% 8% 15% 48% 23% 416 75%area is current and accurate. 2008 71% 5% 8% 15% 48% 23% 416 75%2014 63% 5% 11% 21% 46% 17% 326 88%
Chabot College provides students with clear expectations concerning the principles of academic honesty and the sanctions for violations. 2008 69% 3% 12% 17% 50% 19% 423 76%
2014 66% 3% 10% 21% 46% 20% 335 90%Academic freedom is upheld at Chabot. 2008 79% 1% 4% 15% 50% 29% 404 72%
2014 78% 1% 2% 19% 46% 32% 298 80%When teaching, I consciously separate my personal convictions from the professionally
accepted views of my discipline. 2008 84% 1% 4% 10% 42% 42% 285 88%2014 88% 0% 1% 11% 44% 44% 252 68%
My administrator would back me up in professional classroom practices. 1995 76% 5% 3% 15% 43% 33% 194 70%2001 73% 7% 5% 15% 46% 27% 186 75%2001 73% 7% 5% 15% 46% 27% 186 75%
My dean would back me up in professional classroom practices. 2008 87% 1% 3% 8% 34% 53% 264 81%2014 87% 3% 1% 9% 40% 47% 230 62%
At Chabot, the general "campus climate" is one of respect for differences in :• race-ethnicity 1995 73% 3% 10% 14% 58% 16% 267 96%
2001 87% 0% 3% 10% 62% 24% 238 96%2001 87% 0% 3% 10% 62% 24% 238 96%2008 86% 2% 3% 10% 52% 34% 507 91%2014 90% 0% 2% 7% 46% 45% 360 97%
• gender 1995 72% 2% 7% 20% 57% 15% 264 95%2001 89% 1% 3% 7% 65% 24% 233 94%2008 85% 1% 3% 11% 51% 33% 505 91%2014 89% 1% 1% 9% 45% 43% 361 97%
• physical disability 1995 81% 2% 6% 12% 58% 22% 265 95%2001 86% 1% 2% 12% 58% 28% 238 96%2008 87% 1% 2% 11% 52% 35% 505 91%2014 91% 0% 1% 8% 50% 42% 359 97%
• age 1995 78% 2% 7% 14% 63% 15% 259 93%2001 89% 1% 2% 9% 65% 24% 236 95%2008 85% 1% 2% 12% 52% 33% 504 90%2014 86% 0% 3% 11% 47% 39% 357 96%
NOTES: * 'Neutral' used in 1995 and 2001; 'Neither disagree nor agree' used in 2008 and 2014 Chabot College Office of Institutional Research Page 6 of 36

Chabot College Faculty/Staff Accreditation Surveys: 1995, 2001, 2008, and 2014 Comparisons
Percent whoAgree Percentage of those responding
St d d I I tit ti l Mi i & Eff ti
Responses
to each question
Standard I: Institutional Mission & Effectiveness or Strongly Strongly Number PercentStrongly Agree Disagree Disagree Neutral* Agree Agree
B. Improving Institutional Effectiveness (continued) Integrity, Equity, Diversity (continued)
• sexual orientation 1995 55% 5% 13% 26% 45% 10% 240 86%2001 80% 1% 7% 11% 61% 19% 227 91%2001 80% 1% 7% 11% 61% 19% 227 91%2008 79% 1% 6% 14% 48% 31% 500 90%2014 88% 1% 2% 10% 47% 41% 356 96%
• native language 1995 56% 4% 15% 25% 48% 8% 249 90%2001 75% 0% 6% 19% 55% 20% 230 92%2008 81% 1% 3% 16% 52% 28% 493 88%2014 83% 0% 3% 14% 45% 38% 356 96%
• religion 1995 69% 1% 6% 24% 55% 14% 240 86%2001 79% 1% 4% 15% 58% 21% 221 89%2008 75% 1% 4% 19% 47% 28% 492 88%2014 80% 1% 3% 16% 44% 36% 342 92%
NOTES: * 'Neutral' used in 1995 and 2001; 'Neither disagree nor agree' used in 2008 and 2014 Chabot College Office of Institutional Research Page 7 of 36

Chabot College Faculty/Staff Accreditation Surveys: 1995, 2001, 2008, and 2014 Comparisons
Percent whoAgree Percentage of those responding
Standard I: Institutional Mission & Effectiveness (continued or Strongly Strongly Number PercentStrongly Agree Disagree Disagree Neutral* Agree Agree
B. Improving Institutional Effectiveness (continued)
to each questionResponses
Integrity, Equity, Diversity (continued)The following groups treat me with respect:
• faculty 1995 82% 2% 6% 10% 48% 34% 273 98%The following groups demonstrate honesty and truthfulness in their dealings with me:
• students 2008 75% 1% 4% 19% 52% 24% 504 90%2014 79% 0% 4% 18% 55% 23% 359 97%
• faculty 2001 80% 2% 8% 11% 55% 24% 238 96%2008 81% 2% 3% 15% 53% 27% 517 93%2014 82% 1% 2% 15% 50% 32% 357 96%
• administrators 1995 75% 3% 6% 15% 48% 28% 268 96%2001 60% 8% 13% 19% 44% 16% 243 98%2001 60% 8% 13% 19% 44% 16% 243 98%2008 72% 4% 7% 18% 50% 23% 512 92%2014 68% 4% 7% 20% 46% 22% 349 94%
• classified staff 1995 84% 1% 2% 12% 48% 37% 273 98%2001 84% 2% 4% 11% 59% 24% 238 96%2008 86% 1% 2% 11% 55% 31% 520 93%2014 87% 0% 1% 12% 53% 34% 351 95%
Chabot provides programs and services that enhance understanding and appreciation of diversity on campus. 2008 76% 2% 5% 17% 49% 28% 470 84%
2014 83% 1% 3% 12% 51% 32% 347 94%The college curriculum adequately addresses issues related to cultural diversity.
1995 51% 4% 20% 24% 37% 14% 203 73%1995 51% 4% 20% 24% 37% 14% 203 73%2001 66% 2% 8% 24% 50% 16% 194 78%2008 61% 4% 8% 26% 41% 20% 423 76%2014 61% 8% 8% 24% 43% 18% 315 85%
I feel discrimination by other college staff on this campus. 1995 16% 36% 34% 15% 12% 3% 258 93%2001 11% 41% 36% 11% 7% 5% 237 95%2008 15% 47% 26% 12% 9% 6% 446 80%2014 16% 43% 28% 14% 12% 4% 315 85%
NOTES: * 'Neutral' used in 1995 and 2001; 'Neither disagree nor agree' used in 2008 and 2014 Chabot College Office of Institutional Research Page 8 of 36

Chabot College Faculty/Staff Accreditation Surveys: 1995, 2001, 2008, and 2014 Comparisons
Of those feeling discrimination by college staff,
Standard I: Institutional Mission & Effectiveness percent that attribute it to age, gender, ethnicity p g , g , yall staff or race, sexual orientation, or other:
B. Improving Institutional Effectiveness (continued) Integrity, Equity, Diversity (continued)If I feel discrimination, it is based on my (you may check more than one):
Age 1995 4% 30%2001 6% 59%2001 6% 59%2008 3% 26%2014
Gender 1995 4% 30%2001 4% 41%2008 2% 18%2014
Ethnicity or race 1995 8% 58%2001 7% 63%2008 7% 59%2014
Sexual orientation 1995 3% 20%Sexual orientation 1995 3% 20%2001 2% 15%2008 <1% 3%2014
Other 1995 7% 48%2001 12% 107%2008 6% 53%2014
Two or more of the above categories 2008 5%2014
NOTES: * 'Neutral' used in 1995 and 2001; 'Neither disagree nor agree' used in 2008 and 2014 Chabot College Office of Institutional Research Page 9 of 36

Chabot College Faculty/Staff Accreditation Surveys: 1995, 2001, 2008, and 2014 Comparisons
Percent whoAgree Percentage of those responding
Responsesto each q estionAgree Percentage of those responding
Standard II: Learning Programs and Services or Strongly Strongly Number PercentStrongly Agree Disagree Disagree Neutral* Agree Agree
A. Instructional Programs
In the classroom, faculty members at Chabot encourage a balanced perspective
to each question
In the classroom, faculty members at Chabot encourage a balanced perspective of multifaceted issues, beliefs and world views. 1995 65% 3% 9% 24% 51% 14% 198 71%
2001 74% 2% 5% 20% 52% 21% 189 76%2008 67% 1% 7% 25% 43% 24% 373 67%2014 76% 1% 6% 17% 50% 26% 290 78%
Faculty have sufficient opportunities for input on matters of curriculum review, evaluation and revision 1995 71% 3% 10% 16% 55% 16% 204 73%evaluation, and revision. 1995 71% 3% 10% 16% 55% 16% 204 73%
2001 63% 2% 15% 20% 45% 18% 191 77%2008 65% 3% 8% 24% 47% 18% 292 90%2014 72% 2% 7% 19% 49% 24% 253 68%
Educational programs: • are continually reviewed for consistency with the college mission. 1995 48% 5% 25% 23% 40% 8% 170 61%y y g
2001 33% 5% 28% 33% 29% 4% 148 59%2008 56% 3% 8% 33% 47% 9% 341 61%2014 68% 1% 5% 27% 56% 12% 285 77%
• reflect the educational needs of students & surrounding communities. 2008 65% 3% 10% 22% 53% 12% 405 73%2014 70% 2% 7% 21% 58% 13% 316 85%
• are assessed, reviewed, and modified regularly. 2008 60% 3% 9% 28% 47% 13% 354 63%2014 73% 1% 5% 21% 57% 15% 294 79%
Overall, Chabot provides a high quality learning experience for students. 2008 83% 1% 3% 13% 55% 28% 475 85%2014 87% 1% 1% 12% 53% 34% 346 93%
Chabot instructors demonstrate a commitment to high standards of teaching.1995 76% 1% 4% 20% 50% 25% 241 87%1995 76% 1% 4% 20% 50% 25% 241 87%2001 72% 0% 7% 20% 51% 21% 225 90%2008 81% 1% 3% 15% 48% 34% 464 83%2014 84% 1% 4% 11% 50% 35% 339 91%
Most students seem prepared to succeed in the courses in which they are enrolled.1995 27% 8% 41% 25% 25% 2% 229 82%2001 40% 6% 33% 21% 31% 9% 195 78%2001 40% 6% 33% 21% 31% 9% 195 78%
My students have the necessary skills required to succeed in my courses.2008 48% 6% 17% 29% 35% 13% 289 89%2014 56% 2% 11% 31% 40% 17% 242 65%
NOTES: * 'Neutral' used in 1995 and 2001; 'Neither disagree nor agree' used in 2008 and 2014 Chabot College Office of Institutional Research Page 10 of 36

Chabot College Faculty/Staff Accreditation Surveys: 1995, 2001, 2008, and 2014 Comparisons
Percent who ResponsesAgree Percentage of those responding
Standard II: Learning Programs and Services or Strongly Strongly Number PercentStrongly Agree Disagree Disagree Neutral* Agree Agree
A. Instructional Programs (continued)
Th t i l “A” d i t Ch b t t ll t t d t hi t i
to each question
The typical “A” grade given at Chabot represents excellent student achievement in a course.1995 75% 4% 8% 13% 44% 31% 213 77%2001 72% 5% 6% 17% 52% 20% 192 77%2008 72% 2% 9% 17% 48% 24% 421 75%2014 72% 2% 4% 22% 48% 24% 316 85%
Faculty responses only
I had an opportunity to participate in the development of the new AA/AS degree and general education requirements. 2008 48% 8% 21% 23% 32% 16% 291 90%
I had an opportunity to participate in the development of the new AA-T degree and general education requirements. 2014 40% 13% 17% 30% 23% 17% 242 65%
I regularly update my course content. 2008 90% 0% 1% 9% 48% 41% 289 89%I regularly update my course content. 2008 90% 0% 1% 9% 48% 41% 289 89%2014 93% 0% 2% 5% 42% 51% 247 67%
I regularly experiment with different instructional approaches. 2008 88% 0% 4% 8% 48% 40% 292 90%2014 91% 1% 2% 6% 43% 48% 246 66%
I use a variety of teaching methodologies as a response to the learning styles of students.2008 91% 0% 1% 8% 47% 44% 293 90%2014 92% 0% 0% 7% 38% 54% 243 65%2014 92% 0% 0% 7% 38% 54% 243 65%
I use multiple methods of classroom assessment to measure student progress.2008 87% 0% 3% 10% 50% 38% 285 88%2014 92% 0% 1% 6% 44% 49% 245 66%
The purpose and value of writing and assessing student learning outcomes is clear to me.2008 69% 5% 9% 17% 41% 28% 288 89%2014 70% 6% 9% 15% 41% 30% 244 66%
I have received training from Chabot College in:• writing student learning outcomes. 2008 41% 13% 22% 25% 30% 11% 290 89%
2014 55% 8% 16% 21% 38% 17% 243 65%• assessing student learning outcomes. 2008 38% 14% 24% 24% 30% 9% 287 88%
2014 59% 9% 16% 16% 42% 17% 240 65%I have received training outside of Chabot College (conferences, workshops, reading,
self-teaching) in writing or assessing student learning outcomes. 2008 51% 12% 24% 13% 30% 21% 285 88%2014 48% 15% 22% 15% 27% 21% 246 66%
NOTES: * 'Neutral' used in 1995 and 2001; 'Neither disagree nor agree' used in 2008 and 2014 Chabot College Office of Institutional Research Page 11 of 36

Chabot College Faculty/Staff Accreditation Surveys: 1995, 2001, 2008, and 2014 Comparisons
Percent whoAgree Percentage of those responding
Standard II: Learning Programs and Services or Strongly Strongly Number PercentStrongly Agree Disagree Disagree Neutral* Agree Agree
A I t ti l P ( ti d)
Responsesto each question
A. Instructional Programs (continued)
Faculty responses only (continued)
I have contributed to the development of student learning outcomes for course(s) in my discipline.2008 59% 7% 17% 18% 33% 26% 290 89%2014 73% 4% 11% 12% 39% 34% 246 66%
I have assessed (or plan to assess within the year) student learning outcomes in my course(s).2008 62% 4% 13% 22% 39% 23% 288 89%2014 87% 1% 4% 7% 43% 45% 247 67%
My unit/discipline has developed program-level student learning outcomes. 2008 55% 4% 12% 29% 40% 15% 284 87%My program/discipline has developed program-level student learning outcomes.My program/discipline has developed program level student learning outcomes.
2014 83% 1% 2% 15% 39% 44% 246 66%I am familiar with the college-wide learning goals. 2008 55% 4% 12% 28% 41% 15% 292 90%
2014 72% 4% 7% 17% 44% 29% 245 66%I consciously encourage my students to act ethically and responsibly as citizens.
2008 92% 0% 2% 6% 40% 52% 293 90%2014 93% 0% 2% 5% 32% 61% 247 67%2014 93% 0% 2% 5% 32% 61% 247 67%
I provide students with multiple opportunities to practice communication skills (reading, writing,speaking) within the classroom or through assignments. 2008 88% 1% 3% 9% 40% 47% 292 90%
2014 91% 0% 2% 7% 29% 62% 246 66%My courses include critical thinking components. 2008 90% 1% 1% 8% 36% 54% 291 90%
2014 96% 0% 0% 4% 28% 68% 245 66%I encourage my students to think creatively and /or produce original works. 2008 86% 1% 1% 12% 36% 50% 289 89%
2014 89% 0% 2% 9% 31% 58% 248 67%My courses require basic computer literacy. 2008 67% 4% 13% 16% 34% 32% 287 88%
2014 84% 3% 2% 11% 38% 45% 245 66%I include information competency concepts (the search for and analysis of information)
in my courses/assignments. 2008 74% 3% 3% 20% 38% 36% 286 88%y g2014 81% 1% 4% 15% 36% 45% 245 66%
NOTES: * 'Neutral' used in 1995 and 2001; 'Neither disagree nor agree' used in 2008 and 2014 Chabot College Office of Institutional Research Page 12 of 36

Chabot College Faculty/Staff Accreditation Surveys: 1995, 2001, 2008, and 2014 Comparisons
Percent whostated Percentage of those responding
St d d II L i P d S ito each question
Responses
Standard II: Learning Programs and Services most or None A little Some Most All Number PercentAll
Faculty responses only (continued)
Averaging over all the courses you currently teach, HOW MUCH of the CLASSROOM TIME do you ALLOCATE for the following TYPES of TEACHING ACTIVITIES (may overlap):do you ALLOCATE for the following TYPES of TEACHING ACTIVITIES (may overlap):• Lectures: speaking or presenting only 2008 25% 10% 17% 48% 25% <1% 281 86%
2014 25% 7% 22% 45% 24% <1% 236 64%• Lectures: with interactions/discussions 2008 50% 4% 4% 43% 46% 4% 284 87%
2014 53% 3% 7% 38% 45% 8% 240 65%• Multi-media presentations using computers, powerpoint, video, slides, audio, etc
2008 31% 11% 21% 36% 23% 8% 282 87%2008 31% 11% 21% 36% 23% 8% 282 87%2014 42% 5% 15% 39% 27% 15% 239 64%
• In-class discussions involving the whole class 2008 34% 6% 13% 46% 28% 6% 282 87%2014 38% 6% 14% 42% 29% 9% 237 64%
• In-class discussions or activities in small groups 2008 23% 12% 19% 46% 20% 3% 284 87%2014 32% 8% 15% 46% 25% 7% 239 64%
• Active/hands-on activities (experimenting, performing, creating, practicing)2008 42% 12% 9% 36% 32% 10% 285 88%2014 44% 9% 10% 38% 30% 14% 239 64%
• Working with students in small groups during class 2008 27% 13% 17% 43% 22% 4% 286 88%2014 26% 10% 21% 43% 18% 8% 238 64%
• Working one-on-one with students during class 2008 22% 15% 27% 35% 16% 6% 288 89%2014 17% 13% 35% 36% 11% 5% 241 65%
What electronic means do you use for instructional delivery and/or communication with your students?Email: 2008 27% 325 100%
2014 60% 256 69%2014 60% 256 69%Website: 2008 1% 325 100%
2014 22% 256 69%Blackboard: 2008 3% 325 100%
2014 49% 256 69%Text 2014 22% 256 69%2 ways: 2008 20% 325 100%2 ways: 2008 20% 325 100%
2014 64% 158 43%3 ways: 2008 10% 325 100%
2014 25% 158 43%4 ways: 2014 11% 158 43%
NOTES: * 'Neutral' used in 1995 and 2001; 'Neither disagree nor agree' used in 2008 and 2014 Chabot College Office of Institutional Research Page 13 of 36

Chabot College Faculty/Staff Accreditation Surveys: 1995, 2001, 2008, and 2014 Comparisons
Percent whoAgree Percentage of those responding
St d d II L i P d S i
Responsesto each question
Standard II: Learning Programs and Services or Strongly Strongly Number Percent
Strongly Agree Disagree Disagree Neutral* Agree AgreeB. Student Support Programs
Counselors effectively advise students about appropriate academic courses. 1995 35% 9% 30% 25% 30% 5% 202 73%2001 46% 9% 25% 20% 39% 7% 176 71%2001 46% 9% 25% 20% 39% 7% 176 71%2008 60% 3% 13% 25% 45% 15% 378 68%
Counselors provide students with accurate and useful information about:• transfer requirements 1995 50% 6% 20% 24% 42% 8% 182 65%
2001 58% 6% 9% 26% 44% 14% 163 65%2008 64% 2% 9% 25% 45% 19% 364 65%
t h i l ti l 1995 44% 9% 18% 29% 36% 8% 153 55%• technical-occupational programs 1995 44% 9% 18% 29% 36% 8% 153 55%2001 47% 7% 16% 30% 35% 12% 147 59%2008 58% 3% 8% 32% 41% 17% 323 58%
Chabot uses research and data on students to determine: • the learning support needs of its students. 2008 69% 1% 4% 26% 51% 18% 344 62%
2014 79% 1% 4% 16% 57% 22% 285 77%2014 79% 1% 4% 16% 57% 22% 285 77%• the services and programs to address those needs. 2008 68% 1% 4% 28% 48% 20% 343 61%
2014 77% 1% 6% 16% 57% 20% 284 77%Student Services staff are dedicated to supporting student access, learning, and success.
2008 81% 1% 1% 17% 49% 31% 397 71%Student Services staff are dedicated to supporting student access,equity, and success.
2014 86% 0% 1% 13% 50% 36% 311 84%2014 86% 0% 1% 13% 50% 36% 311 84%English, ESL, and Math assessment test results have recommended appropriate
classes for my students. 1995 45% 4% 24% 26% 38% 8% 144 52%2001 46% 7% 22% 24% 37% 9% 147 59%2008 54% 3% 8% 35% 38% 16% 309 55%2014 54% 4% 13% 29% 35% 19% 241 65%5 % % % 9% % 9% %
Student support services (counseling, financial aid, health services, EOPS, etc) make effective contributions to student learning and success. 2008 82% 0% 1% 17% 54% 28% 396 71%
2014 83% 0% 3% 15% 43% 40% 317 85%The college offers a wide variety of special enrichment activities. (ie, cultural events/celebrations,
outside speakers, forums, debates, discussions) for students. 2008 71% 2% 7% 20% 54% 17% 449 80%2014 82% 0% 2% 16% 47% 35% 331 89%
Overall, Chabot provides high quality student support services (eg, counseling, financial aid,health services, EOPS, etc). 2008 78% 1% 2% 19% 55% 23% 453 81%
2014 82% 0% 2% 15% 50% 32% 336 91%
NOTES: * 'Neutral' used in 1995 and 2001; 'Neither disagree nor agree' used in 2008 and 2014 Chabot College Office of Institutional Research Page 14 of 36

Chabot College Faculty/Staff Accreditation Surveys: 1995, 2001, 2008, and 2014 Comparisons
Percent whoA f i
ResponsesAgree Percentage of those responding
Standard II: Learning Programs and Services or Strongly Strongly Number Percent
Strongly Agree Disagree Disagree Neutral* Agree AgreeB. Student Support Programs (continued)
to each question
The mid-term progress reports have been helpful in improving student success in my classroom. 1995 40% 13% 22% 25% 29% 11% 156 56%
2001 48% 12% 18% 23% 38% 9% 172 69%2008 42% 6% 18% 33% 29% 13% 333 60%
Written information about student support services is readily available.1995 59% 4% 14% 22% 48% 11% 209 75%1995 59% 4% 14% 22% 48% 11% 209 75%2001 65% 1% 10% 24% 51% 14% 196 79%
Written information about student support services is readily available to faculty and staff.2008 64% 1% 9% 26% 46% 18% 370 66%
I know where to locate and access written information about student support services. 2014 71% 1% 9% 19% 46% 25% 304 82%2014 71% 1% 9% 19% 46% 25% 304 82%
Admissions and Records 1995 32% 8% 18% 64% 7% 3% 278 100%2001 90% 0% 5% 14% 8% 73% 241 97%2008 94% 2% 7% 15% 4% 72% 539 97%2014 95% 0% 6% 16% 4% 74% 362 98%
Orientation Sessions 2008 92% 10% 28% 23% 3% 35% 532 95%Orientation to Chabot College 2014 90% 12% 29% 21% 4% 34% 362 98%Assessment Testing Center 1995 85% 4% 37% 25% 5% 29% 256 92%
2001 88% 5% 25% 28% 5% 37% 236 95%2008 90% 5% 27% 27% 4% 37% 532 95%2014 91% 2% 26% 22% 5% 45% 362 98%
Counseling 1995 67% 14% 24% 43% 6% 12% 278 100%2001 70% 0% 14% 25% 18% 42% 236 95%2008 85% 3% 14% 24% 9% 50% 534 96%
Counseling Appointments 2014 73% 1% 14% 24% 17% 45% 361 97%Financial Aid Office 1995 87% 1% 33% 31% 5% 31% 252 91%
2001 90% 0% 28% 30% 4% 38% 237 95%2008 86% 2% 26% 27% 6% 38% 533 96%2014 91% 1% 21% 29% 4% 45% 358 96%
NOTES: * 'Neutral' used in 1995 and 2001; 'Neither disagree nor agree' used in 2008 and 2014 Chabot College Office of Institutional Research Page 15 of 36

Chabot College Faculty/Staff Accreditation Surveys: 1995, 2001, 2008, and 2014 Comparisons
Percent who ResponsesAgree Percentage of those responding
Standard II: Learning Programs and Services or Strongly Strongly Number PercentStrongly Agree Disagree Disagree Neutral* Agree Agree
B. Student Support Programs (continued)
pto each question
Student Activities (i.e., Clubs, Intramural, Special Events) 1995 87% 3% 36% 28% 4% 28% 257 92%Office of Student Life (Clubs, Activities, Events, Stu Gov) 2001 93% 3% 33% 26% 3% 35% 238 96%Office of Student Life (Clubs, Activities, Events, Stu Gov) 2008 87% 5% 34% 29% 4% 27% 532 95%Student Government (SSCC, formerly ASCC) 2014 87% 3% 35% 27% 5% 31% 362 98%Office of Student Life (Clubs, Activities, Events) 2014 85% 4% 29% 25% 6% 35% 361 97%Student Health Center 2008 96% 3% 27% 29% 2% 40% 531 95%
2014 96% 1% 25% 23% 2% 49% 361 97%Transfer Center 1995 89% 12% 37% 23% 3% 24% 254 91%Career Center 1995 93% 4% 37% 25% 2% 31% 254 91%Transfer/Career Center 2001 94% 3% 30% 26% 3% 39% 239 96%Transfer, Employment, and Career Services Center (TECS) 2008 89% 5% 32% 27% 4% 32% 534 96%Career and Transfer Center 2014 90% 4% 28% 31% 4% 34% 360 97%Job Information 1995 69% 11% 38% 29% 7% 15% 255 92%Student Employment Services (on-campus jobs) 2001 89% 3% 32% 30% 4% 31% 238 96%Employment & Career Services Center (off-campus jobs/careers) 2001 90% 7% 34% 29% 3% 27% 236 95%Tutorials Center 1995 75% 2% 21% 32% 12% 34% 257 92%
2001 76% 2% 21% 29% 12% 37% 239 96%Peer Academic Tutoring Help or PATH (formerly Tutorials) Bldg 2300 2008 95% 9% 27% 25% 2% 37% 533 96%Learning Connection, formerly Peer Academic Tutoring Help, Bldg 2300 2014 95% 1% 17% 20% 3% 59% 362 98%WRAC Center (Writing, Reading Across Curriculum) 2nd floor of library 2008 94% 6% 27% 21% 3% 43% 531 95%WRAC Center (Writing, Reading Across Curriculum) Library Mezzanine; Rm. 354
2014 97% 5% 23% 23% 2% 47% 362 98%Math Lab Rm 1712 2008 90% 10% 36% 23% 3% 27% 532 95%Math Lab, Rm. 3906B 2014 90% 7% 33% 22% 4% 34% 357 96%Student computer labs in departments 1995 84% 7% 29% 23% 7% 34% 255 92%
2001 83% 9% 17% 28% 8% 38% 237 95%2001 83% 9% 17% 28% 8% 38% 237 95%Student computers in library 2008 95% 4% 23% 25% 3% 46% 531 95%Student computer labs in other departments 2008 93% 9% 27% 25% 3% 35% 530 95%
NOTES: * 'Neutral' used in 1995 and 2001; 'Neither disagree nor agree' used in 2008 and 2014 Chabot College Office of Institutional Research Page 16 of 36

Chabot College Faculty/Staff Accreditation Surveys: 1995, 2001, 2008, and 2014 Comparisons
Of those who referred service to students Percentage of those responding ResponsesOf those who referred service to students Percentage of those respondingand outcome is known, Never Heard of, Referred Students and:
Standard II: Learning Programs and Services percent Heard Never Don't Not Number Percentwho were satisfied with outcome of it Referred KnowSatisfiedSatisfied
B. Student Support Programs (continued)
Responsesto each question
Student Services Computer Center in Bldg. 2300 1995 87% 16% 39% 24% 3% 19% 254 91%Student Online Services Center in Bldg. 100 2001 89% 17% 22% 25% 4% 32% 236 95%Student Online Services in Bldg 100 2008 94% 12% 25% 28% 2% 32% 527 94%Student Online Services in Bldg 700 2014 95% 10% 20% 27% 2% 41% 361 97%Disabled Students Programs and Services (DSPS) 1995 95% 3% 29% 19% 2% 47% 259 93%
2001 94% 3% 22% 17% 3% 54% 234 94%2001 94% 3% 22% 17% 3% 54% 234 94%2008 97% 4% 21% 18% 2% 55% 528 29%2014 92% 2% 17% 14% 5% 62% 363 98%
PACE Program for Working Adults 1995 91% 10% 49% 16% 2% 23% 256 92%2001 93% 6% 42% 24% 2% 26% 238 96%2008 95% 10% 41% 20% 1% 28% 530 95%
PACE Degree and Transfer Program for Working Adults 2014 93% 8% 39% 21% 2% 29% 359 97%Daraja 1995 84% 19% 49% 10% 4% 19% 257 92%
2001 87% 19% 37% 25% 3% 17% 238 96%Puente 1995 90% 14% 52% 9% 2% 22% 256 92%
2001 90% 14% 39% 25% 2% 19% 237 95%Children's Center 2008 96% 4% 37% 25% 1% 33% 526 94%
2014 93% 4% 43% 21% 2% 29% 362 98%Intercollegiate Athletics 1995 90% 5% 57% 14% 2% 22% 256 92%
2001 88% 2% 45% 20% 4% 29% 241 97%2008 93% 6% 41% 21% 2% 30% 530 95%2014 93% 6% 41% 21% 2% 30% 530 143%
College Bookstore 1995 89% 0% 7% 21% 8% 64% 257 92%College Bookstore 1995 89% 0% 7% 21% 8% 64% 257 92%2001 94% 0% 4% 19% 5% 73% 240 96%2008 92% 1% 10% 16% 6% 67% 534 96%2014 88% 1% 8% 20% 9% 62% 363 98%
Security/Safety Services 1995 78% 0% 15% 25% 13% 47% 261 94%Campus Safety and Security 2001 92% 0% 5% 14% 6% 75% 240 96%
2008 97% 1% 12% 16% 2% 69% 537 96%2014 94% 1% 13% 13% 5% 69% 363 98%
NOTES: * 'Neutral' used in 1995 and 2001; 'Neither disagree nor agree' used in 2008 and 2014 Chabot College Office of Institutional Research Page 17 of 36

Chabot College Faculty/Staff Accreditation Surveys: 1995, 2001, 2008, and 2014 Comparisons
Percentage of those respondingOf those who used the service to students Never Heard of, Referred Students and:
Standard II: Learning Programs and Services percent Heard Never Don't Not Number Percentwho were satisfied or very satisfied with outcome of it Referred KnowSatisfiedSatisfied
B St d t S t P ( ti d)
Responses
to each question
B. Student Support Programs (continued)
Admissions and Records 2008 98% 1% 10% 2% 42% 45% 544 97%2014 97% 0% 12% 2% 39% 46% 368 99%
Children's Center 2008 97% 2% 71% 1% 8% 17% 545 98%2014 93% 4% 74% 2% 10% 11% 370 100%2014 93% 4% 74% 2% 10% 11% 370 100%
Student Health Center 2008 97% 2% 50% 2% 25% 21% 542 97%2014 96% 1% 40% 2% 31% 26% 368 99%
Office of Student Life 2008 89% 5% 55% 4% 23% 13% 537 96%2014 88% 4% 58% 5% 22% 12% 363 98%
College Bookstore 2008 94% 1% 8% 6% 47% 38% 543 97%2014 95% 10% 12% 4% 45% 29% 313 84%2014 95% 10% 12% 4% 45% 29% 313 84%
Food Services/Cafeteria 2008 84% 0% 9% 15% 50% 26% 548 98%Food-Cafeteria 2014 86% 0% 10% 12% 51% 27% 370 100%Campus Safety and Security 2008 96% 0% 4% 3% 42% 50% 546 98%
2014 94% 0% 4% 5% 46% 45% 364 98%Instructional Technology Center/HUB 2008 95% 6% 41% 3% 26% 24% 542 97%Instructional Technology Center/HUB 2008 95% 6% 41% 3% 26% 24% 542 97%Online Teaching/Blackboard Faculty Support 2014 96% 2% 36% 3% 27% 32% 368 99%
NOTES: * 'Neutral' used in 1995 and 2001; 'Neither disagree nor agree' used in 2008 and 2014 Chabot College Office of Institutional Research Page 18 of 36

Chabot College Faculty/Staff Accreditation Surveys: 1995, 2001, 2008, and 2014 Comparisons
Percent whogave Percentage of those responding
Standard II: Learning Programs and Services assignments Number of times Number Percent
4 or more times None 1-3 4-6 7-9 10 plus
Responsesto each question
C. Library and Learning Support Programs
Academic learning support services (tutoring, computer labs, instructional assistants) makeeffective contributions to student learning and success. 2008 89% 0% 1% 10% 53% 35% 436 78%
2014 85% 0% 1% 14% 45% 40% 360 97%Please indicate the number of times you have:Please indicate the number of times you have:
1) given assignments in the last year that required use of the Chabot Library/LRC. 1995 21% 51% 28% 9% 5% 7% 228 82%2001 21% 55% 25% 13% 4% 4% 224 90%
• given assignments that required the use of the Chabot library or library web site.2008 28% 43% 29% 15% 6% 7% 259 80%2014 31% 44% 25% 18% 7% 6% 218 59%
2) given research assignments that required use of the Chabot reference staff.1995 11% 65% 25% 6% 2% 3% 223 80%2001 13% 65% 22% 8% 3% 3% 223 90%2008 19% 56% 25% 12% 4% 3% 256 79%2008 19% 56% 25% 12% 4% 3% 256 79%2014 18% 55% 27% 11% 3% 4% 217 58%
NOTES: * 'Neutral' used in 1995 and 2001; 'Neither disagree nor agree' used in 2008 and 2014 Chabot College Office of Institutional Research Page 19 of 36
Chabot College Faculty/Staff Accreditation Surveys: 1995, 2001, 2008, and 2014 Comparisons
Percent whoAgree Percentage of those responding
Standard II: Learning Programs and Services or Strongly Strongly Number PercentStrongly Agree Disagree Disagree Neutral* Agree Agree
Responsesto each question
Strongly Agree Disagree Disagree Neutral* Agree AgreeC. Library and Learning Support Programs (continued)
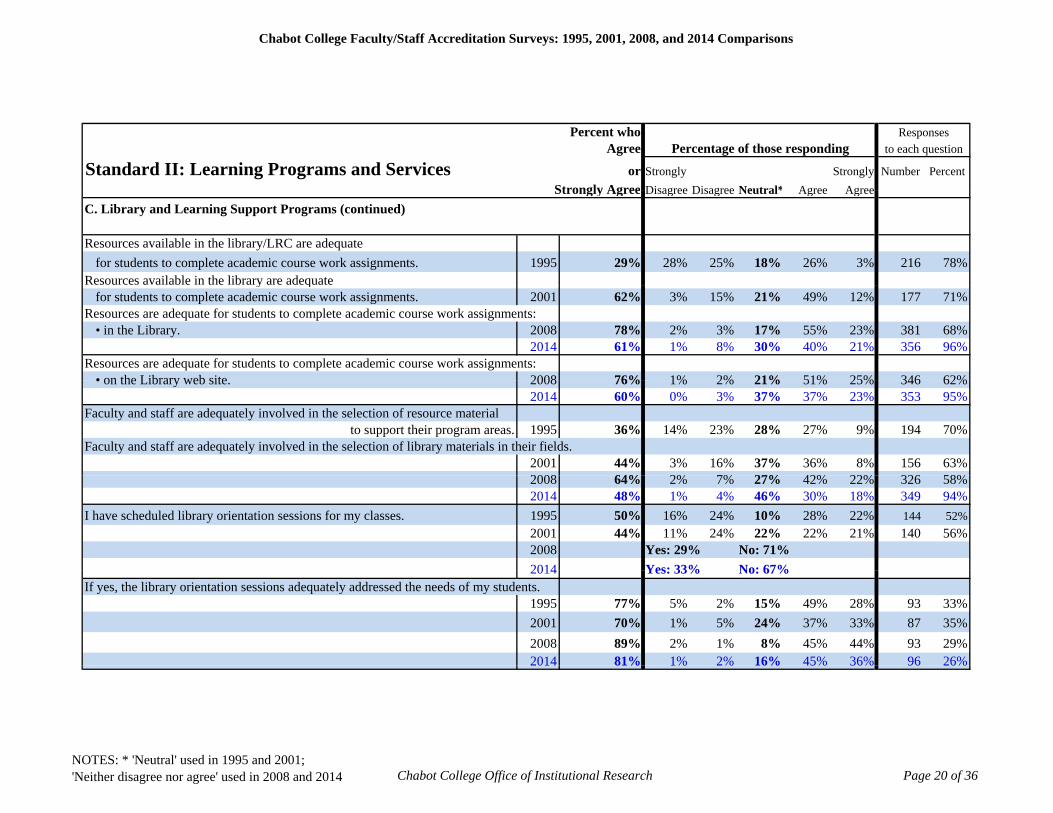
Resources available in the library/LRC are adequate for students to complete academic course work assignments. 1995 29% 28% 25% 18% 26% 3% 216 78%
Resources available in the library are adequate y qfor students to complete academic course work assignments. 2001 62% 3% 15% 21% 49% 12% 177 71%
Resources are adequate for students to complete academic course work assignments:• in the Library. 2008 78% 2% 3% 17% 55% 23% 381 68%
2014 61% 1% 8% 30% 40% 21% 356 96%Resources are adequate for students to complete academic course work assignments:
• on the Library web site 2008 76% 1% 2% 21% 51% 25% 346 62%• on the Library web site. 2008 76% 1% 2% 21% 51% 25% 346 62%2014 60% 0% 3% 37% 37% 23% 353 95%
Faculty and staff are adequately involved in the selection of resource material to support their program areas. 1995 36% 14% 23% 28% 27% 9% 194 70%
Faculty and staff are adequately involved in the selection of library materials in their fields.2001 44% 3% 16% 37% 36% 8% 156 63%2008 64% 2% 7% 27% 42% 22% 326 58%2008 64% 2% 7% 27% 42% 22% 326 58%2014 48% 1% 4% 46% 30% 18% 349 94%
I have scheduled library orientation sessions for my classes. 1995 50% 16% 24% 10% 28% 22% 144 52%2001 44% 11% 24% 22% 22% 21% 140 56%2008 Yes: 29% No: 71%2014 Yes: 33% No: 67%2014 Yes: 33% No: 67%
If yes, the library orientation sessions adequately addressed the needs of my students.1995 77% 5% 2% 15% 49% 28% 93 33%2001 70% 1% 5% 24% 37% 33% 87 35%2008 89% 2% 1% 8% 45% 44% 93 29%2014 81% 1% 2% 16% 45% 36% 96 26%2014 81% 1% 2% 16% 45% 36% 96 26%
NOTES: * 'Neutral' used in 1995 and 2001; 'Neither disagree nor agree' used in 2008 and 2014 Chabot College Office of Institutional Research Page 20 of 36

Chabot College Faculty/Staff Accreditation Surveys: 1995, 2001, 2008, and 2014 Comparisons
Percent who Percentage of those respondingAgree
Responsesto each question
Standard III: Resources or Strongly Strongly Number PercentStrongly Agree Disagree Disagree Neutral* Agree Agree
A. Human Resources Hiring and evaluationChabot links staffing decisions to its institutional planning. 2008 45% 4% 14% 37% 39% 6% 302 54%
2014 50% 7% 13% 30% 43% 7% 248 67%Hiring processes are likely to result in hiring personnel who will effectively advance the mission
of Chabot College. 2008 61% 2% 11% 26% 48% 13% 420 75%2014 57% 5% 12% 25% 46% 10% 297 80%
Hiring processes are fair to all applicants. 2008 62% 7% 9% 22% 45% 17% 435 78%2014 55% 5% 15% 25% 39% 16% 288 78%2014 55% 5% 15% 25% 39% 16% 288 78%
The college climate encourages faculty, staff and administrators to value and strive for cooperative and mutually respectful working conditions. 2008 71% 3% 9% 17% 54% 17% 487 87%
2014 62% 4% 13% 21% 44% 18% 343 92%Current evaluation procedures for non-tenured faculty are effective
in making recommendations for tenure. 1995 61% 6% 15% 18% 43% 18% 143 51%2001 60% 2% 14% 24% 50% 10% 127 51%2001 60% 2% 14% 24% 50% 10% 127 51%2008 57% 7% 9% 27% 42% 15% 268 48%2014 51% 4% 8% 36% 38% 14% 205 55%
Current evaluation procedures for administrators solicit and consider my opinionin assessing administrator effectiveness. 1995 11% 47% 28% 14% 9% 2% 189 68%
2001 27% 28% 23% 22% 20% 7% 169 68%2008 27% 21% 23% 29% 22% 4% 298 53%2014 20% 26% 30% 24% 17% 3% 227 61%
Current student evaluation forms are adequate in helping faculty membersassess teaching effectiveness. 1995 55% 6% 16% 23% 48% 8% 184 66%
2001 58% 10% 14% 17% 49% 10% 173 69%2008 62% 4% 12% 21% 48% 14% 335 60%2008 62% 4% 12% 21% 48% 14% 335 60%2014 57% 5% 15% 23% 44% 13% 284 77%
Teaching effectiveness is the principal criterion used in the selection of instructor 1995 48% 9% 21% 23% 35% 12% 185 67%2001 42% 11% 22% 25% 36% 6% 157 63%2008 60% 3% 13% 23% 45% 16% 341 61%2014 60% 3% 10% 27% 44% 16% 261 70%
Personnel policies and procedures, i.e. workloads, retention, advancement, due process, privacy, and personnel policy development, are clearly stated and equitably applied.
1995 38% 11% 23% 28% 31% 7% 235 85%2001 43% 11% 22% 23% 38% 5% 196 79%
NOTES: * 'Neutral' used in 1995 and 2001; 'Neither disagree nor agree' used in 2008 and 2014 Chabot College Office of Institutional Research Page 21 of 36

Chabot College Faculty/Staff Accreditation Surveys: 1995, 2001, 2008, and 2014 Comparisons
Percent who Percentage of those respondingAgree
Responsesto each question
Standard III: Resources or Strongly Strongly Number PercentStrongly Agree Disagree Disagree Neutral* Agree Agree
A. Human Resources (continued) Hiring and evaluation (continued)Human Resource policies and procedures:
• are clearly stated 2008 63% 5% 11% 21% 50% 13% 451 81%• are clearly stated. 2008 63% 5% 11% 21% 50% 13% 451 81%2014 65% 3% 10% 22% 52% 13% 312 84%
• are equitably applied. 2008 61% 3% 11% 25% 50% 11% 408 73%2014 59% 4% 9% 29% 43% 15% 285 77%
Part-time faculty members are encouraged to participate in decision-making activitiesin their teaching areas. 1995 32% 17% 33% 18% 25% 7% 190 68%
2001 38% 16% 30% 16% 29% 9% 178 71%2008 43% 11% 22% 25% 34% 9% 347 62%2014 51% 10% 15% 24% 37% 13% 279 75%
Percent whoA P t f th di
Responsest h tiAgree Percentage of those responding
Standard III: Resources or Strongly Strongly Number Percent
Strongly Agree Disagree Disagree Neutral* Agree Agree
A. Human Resources Staff Development
to each question
Chabot College provides the support and resources to improve my teaching or job skills.2008 60% 5% 14% 21% 46% 13% 457 82%
2014 45% 8% 21% 26% 33% 12% 338 91%Sufficient training opportunities are offered in:
• the Banner system/Web for Faculty/Web for Finance. 2008 65% 5% 8% 22% 51% 14% 392 70%• the Banner system/CLASS-Web/Web for Finance. 2014 33% 14% 23% 31% 25% 8% 287 77%
• the latest MS Office and other computer applications. 2008 60% 4% 9% 26% 46% 14% 379 68%2014 26% 15% 30% 29% 20% 6% 280 75%
• Blackboard, web pages, or other online instructional tools. 2008 75% 2% 6% 18% 53% 22% 397 71%• Blackboard or other online tools/course development. 2014 53% 8% 13% 27% 36% 17% 295 80%
Faculty are encouraged to experiment with new instructional approachesFaculty are encouraged to experiment with new instructional approaches.1995 52% 10% 12% 26% 41% 11% 204 73%2001 54% 4% 13% 30% 45% 9% 184 74%2008 67% 3% 6% 24% 48% 19% 340 61%2014 66% 1% 7% 26% 45% 20% 275 74%
NOTES: * 'Neutral' used in 1995 and 2001; 'Neither disagree nor agree' used in 2008 and 2014 Chabot College Office of Institutional Research Page 22 of 36

Chabot College Faculty/Staff Accreditation Surveys: 1995, 2001, 2008, and 2014 Comparisons
Percent whoAgree Percentage of those responding
Responsesto each questionAgree Percentage of those responding
Standard III: Resources or Strongly Strongly Number PercentStrongly Agree Disagree Disagree Neutral* Agree Agree
A. Human Resources (continued) Staff Development (continued)Faculty & staff are encouraged to develop new programs & services that will enhance
to each question
y g p p gstudent learning. 2008 70% 3% 5% 21% 51% 19% 403 72%
2014 66% 4% 8% 22% 48% 19% 301 81%Staff Development activities on campus (flex day, other events) have helped improve my
teaching or job skills. 2008 43% 14% 15% 27% 34% 10% 447 80%2014 29% 20% 22% 29% 23% 6% 332 89%
Chabot College acknowledges faculty who practice academic excellence 2008 60% 7% 11% 22% 44% 16% 409 73%Chabot College acknowledges faculty who practice academic excellence. 2008 60% 7% 11% 22% 44% 16% 409 73%2014 59% 5% 10% 26% 48% 11% 301 81%
Chabot College acknowledges classified staff who practice professional excellence.2008 56% 5% 15% 24% 44% 12% 400 72%2014 55% 6% 13% 27% 41% 14% 283 76%
My administrator/supervisor encourages and supports my participation.in professional development activities. 1995 69% 7% 11% 14% 43% 25% 261 94% in professional development activities. 1995 69% 7% 11% 14% 43% 25% 261 94%
2001 68% 7% 11% 15% 41% 27% 229 92%2008 67% 4% 6% 22% 42% 25% 472 85%2014 72% 5% 7% 17% 40% 31% 334 90%
Current evaluation procedures are effective in assessing job performance and providing assistance in improving performance for: • classified staff 1995 34% 18% 25% 23% 31% 4% 157 56%• classified staff 1995 34% 18% 25% 23% 31% 4% 157 56%
2001 39% 17% 16% 28% 28% 11% 154 62%2008 49% 10% 15% 26% 40% 9% 360 65%
and improving the performance of: 2014 42% 7% 15% 36% 35% 7% 223 60%• part-time faculty 1995 42% 20% 19% 19% 37% 5% 172 62%
2001 49% 10% 20% 21% 40% 8% 173 69%2008 51% 6% 18% 25% 40% 11% 356 64%2008 51% 6% 18% 25% 40% 11% 356 64%
and improving the performance of: 2014 52% 7% 15% 25% 39% 13% 285 77%• non-tenured faculty 1995 61% 10% 12% 16% 46% 16% 147 53%
2001 60% 5% 18% 17% 49% 11% 144 58%2008 58% 4% 10% 28% 44% 14% 298 53%
and improving the performance of: 2014 57% 5% 10% 29% 40% 17% 235 63%• tenured faculty 1995 42% 18% 19% 21% 35% 7% 145 52%• tenured faculty 1995 42% 18% 19% 21% 35% 7% 145 52%
2001 48% 9% 21% 22% 40% 8% 141 57%2008 50% 5% 14% 31% 39% 10% 292 52%
and improving the performance of: 2014 52% 6% 14% 28% 41% 10% 223 60%
NOTES: * 'Neutral' used in 1995 and 2001; 'Neither disagree nor agree' used in 2008 and 2014 Chabot College Office of Institutional Research Page 23 of 36

Chabot College Faculty/Staff Accreditation Surveys: 1995, 2001, 2008, and 2014 Comparisons
Percent whoAgree Percentage of those responding
Responsesto each questionAgree Percentage of those responding
Standard III: Resources or Strongly Strongly Number PercentStrongly Agree Disagree Disagree Neutral* Agree Agree
A. Human Resources (continued) Staff Development (continued)I feel respected and appreciated as an employee of Chabot College. 1995 55% 9% 14% 21% 40% 15% 267 96%
to each question
2001 55% 14% 12% 19% 40% 15% 238 96%2008 67% 5% 11% 18% 48% 20% 501 90%2014 62% 5% 11% 22% 43% 19% 357 96%
Percent whoAgree
Responsesto each question
Standard III: Resources (continued) or Number PercentStrongly Agree
B. Physical Resources
My area is: • currently under construction 2008 28% 395 71%• currently under construction 2008 28% 395 71%
My main work area is: • currently under construction or will be in the next several years 2014 5% 259 70%
My area is: • currently under construction 2008 28%• going to be under construction in the next several years 2008 24% 395 71%
My main work area is: • is new or has recently been renovated (in the past 4-5 years) 2014 59% 259 70%• do not know the construction status of my work area 2008 26% 395 71%
2014 6% 259 70%
NOTES: * 'Neutral' used in 1995 and 2001; 'Neither disagree nor agree' used in 2008 and 2014 Chabot College Office of Institutional Research Page 24 of 36

Chabot College Faculty/Staff Accreditation Surveys: 1995, 2001, 2008, and 2014 Comparisons
P t h RPercent whoAgree Percentage of those responding
Standard III: Resources or Strongly Strongly Number PercentStrongly Agree Disagree Disagree Neutral* Agree Agree
B. Physical Resources (continued)
Responsesto each question
I am familiar with the college Facilities Plan as it relates to my discipline/program/service area.2008 60% 6% 14% 19% 49% 12% 429 77%2014 52% 8% 21% 19% 41% 11% 287 77%
I had input into the college Facilities Plan as it relates to my discipline/program/service area.2008 36% 17% 27% 21% 28% 8% 424 76%2014 38% 14% 27% 22% 28% 10% 297 80%
The current college facilities:• provide adequate physical space for my discipline/program/service area. 2008 48% 13% 23% 17% 40% 8% 463 83%
2014 59% 9% 19% 12% 45% 14% 339 91%
• support and ensure the integrity and quality of my discipline/ program/ service area.2008 49% 9% 18% 24% 40% 9% 460 82%2014 58% 10% 14% 18% 47% 12% 333 90%
• support student learning in my discipline/program/service area. 2008 50% 8% 13% 28% 42% 8% 423 76%2014 59% 9% 12% 20% 47% 12% 323 87%
Supplies (e.g., paper, classroom materials) have been readily available for my needs1995 43% 18% 24% 15% 40% 3% 249 90%2001 71% 7% 14% 8% 54% 17% 221 89%
Supplies (eg paper classroom materials) have been readily available to support my job/teachingSupplies (eg paper, classroom materials) have been readily available to support my job/teaching.2008 71% 6% 11% 13% 56% 15% 466 84%2014 67% 5% 15% 13% 49% 18% 337 91%
NOTES: * 'Neutral' used in 1995 and 2001; 'Neither disagree nor agree' used in 2008 and 2014 Chabot College Office of Institutional Research Page 25 of 36

Chabot College Faculty/Staff Accreditation Surveys: 1995, 2001, 2008, and 2014 Comparisons
Percent whoAgree Percentage of those responding
Standard III: Resources or Strongly Strongly Number Percent
Responsesto each question
Standard III: Resources or Strongly Strongly Number PercentStrongly Agree Disagree Disagree Neutral* Agree Agree
B. Physical Resources (continued)
Instructional equipment in labs (science, health, vocational programs etc) has been readily available to support student learning. 2008 59% 7% 9% 24% 46% 13% 293 53%
2014 57% 5% 11% 27% 37% 20% 218 59%2014 57% 5% 11% 27% 37% 20% 218 59%Instructional equipment in labs (science, health, vocational programs etc) is adequately
maintained to support student learning. 2008 54% 10% 9% 26% 44% 11% 285 51%2014 47% 7% 14% 32% 31% 16% 210 57%
The college adequately maintains the facilities that we have. 2008 54% 7% 19% 20% 44% 10% 490 88%2014 47% 8% 25% 20% 36% 11% 340 92%
Available equipment is appropriate and adequate for me to carry out required va ab e equ p e t s app op ate a d adequate o e to ca y out equ ed work responsibilities. 1995 39% 22% 28% 11% 36% 4% 264 95%
Computer-related equipment is adequate for me to carry out my work responsibilities2001 65% 10% 14% 11% 45% 21% 224 90%
The office or work space provided for me is appropriate for my job responsibilities2001 64% 8% 18% 9% 46% 18% 238 96%2008 58% 11% 16% 16% 45% 13% 482 86%2008 58% 11% 16% 16% 45% 13% 482 86%2014 71% 6% 12% 11% 46% 26% 344 93%
The quality of current custodial services on campus is satisfactory and consistent in providing a clean and pleasant environment. 1995 37% 16% 29% 19% 30% 7% 270 97%
Custodial services on campus provide a clean and pleasant environment.2001 59% 6% 16% 19% 47% 13% 232 93%2008 64% 7% 12% 17% 47% 17% 513 92%2008 64% 7% 12% 17% 47% 17% 513 92%2014 52% 12% 19% 17% 38% 14% 348 94%
Requests for maintenance and/or repair of buildings are handled in a timely manner and with satisfactory results. 1995 28% 19% 33% 20% 23% 5% 239 86%
Requests for maintenance and/or repair of buildings are handled: • in a timely manner 2001 48% 12% 21% 19% 38% 10% 198 80%y• with satisfactory results 2001 58% 6% 12% 24% 47% 11% 197 79%
Requests for maintenance and repair of buildings are handled: • in a timely manner 2008 54% 7% 18% 21% 44% 10% 423 76%
2014 50% 5% 18% 28% 38% 11% 294 79%• with adequate results. 2008 61% 6% 12% 21% 48% 13% 416 75%
2014 55% 4% 15% 26% 41% 13% 293 79%2014 55% 4% 15% 26% 41% 13% 293 79%The landscaping on campus is well-maintained. 1995 70% 3% 10% 17% 50% 20% 264 95%The campus landscaping and playing fields are well-maintained. 2001 77% 4% 5% 14% 58% 19% 226 91%
2008 73% 3% 7% 17% 54% 19% 456 82%2014 74% 3% 9% 14% 55% 19% 326 88%
NOTES: * 'Neutral' used in 1995 and 2001; 'Neither disagree nor agree' used in 2008 and 2014 Chabot College Office of Institutional Research Page 26 of 36

Chabot College Faculty/Staff Accreditation Surveys: 1995, 2001, 2008, and 2014 Comparisons
Percent whoAgree Percentage of those responding
Standard III: Resources or Strongly Strongly Number Percent
Responsesto each question
Standard III: Resources or Strongly Strongly Number PercentStrongly Agree Disagree Disagree Neutral* Agree Agree
B. Physical Resources (continued)
There are sufficient personnel and material resources to maintain the buildings and grounds.2008 38% 16% 24% 21% 30% 9% 395 71%2014 31% 26% 28% 15% 21% 10% 277 75%2014 31% 26% 28% 15% 21% 10% 277 75%
The current facilities in my area are adequately constructed and maintained to address safety.2008 62% 7% 11% 20% 52% 10% 483 87%
Facilities in my area are adequately constructed and maintained to address safety.2014 62% 6% 11% 21% 46% 16% 326 88%
I feel safe on campus during daylight hours. 2008 88% 1% 2% 9% 61% 27% 512 92%2014 90% 1% 2% 8% 57% 33% 350 94%
I feel safe on campus during the evening or at night. 2008 56% 8% 17% 20% 43% 13% 487 87%2014 64% 3% 12% 20% 48% 16% 323 87%
Campus Safety and Security staff respond quickly in emergency situations. 2008 81% 2% 4% 13% 49% 32% 456 82%2014 83% 0% 4% 13% 51% 32% 292 79%
In the planning and design phase of new or remodeled facilities:In the planning and design phase of new or remodeled facilities:faculty are adequately involved. 1995 35% 15% 28% 22% 30% 5% 172 62%
In the planning, design, and implementation phase of new or remodeled facilities: the needs of the faculty are adequately considered. 2001 39% 10% 18% 32% 31% 8% 146 59%
In the planning and design phase of new or remodeled facilities:classified staff are adequately involved. 1995 19% 19% 36% 26% 15% 4% 160 58%q y
In the planning, design, and implementation phase of new or remodeled facilities: the needs of the classified staff are adequately considered. 2001 32% 13% 22% 34% 26% 5% 136 55%
In the planning, design, and implementation of new and remodeled facilities the needs of my discipline/program/service area were adequately considered. 2008 47% 11% 19% 23% 37% 11% 364 65%
2014 41% 14% 19% 26% 34% 7% 285 77%
NOTES: * 'Neutral' used in 1995 and 2001; 'Neither disagree nor agree' used in 2008 and 2014 Chabot College Office of Institutional Research Page 27 of 36

Chabot College Faculty/Staff Accreditation Surveys: 1995, 2001, 2008, and 2014 Comparisons
Percent whoAgree Percentage of those responding
Standard III: Resources (continued) or Strongly Strongly Number PercentStrongly Agree Disagree Disagree Neutral* Agree Agree
B Physical Resources (continued)
Responsesto each question
B. Physical Resources (continued)
It is clear what action should be taken on campus in case of: • a personal injury 1995 47% 9% 27% 17% 40% 7% 258 93%
2001 66% 4% 17% 13% 58% 8% 229 92%2008 68% 4% 12% 16% 49% 19% 463 83%2014 67% 3% 13% 17% 47% 20% 325 88%2014 67% 3% 13% 17% 47% 20% 325 88%
• an emergency (e.g., fire, earthquake) 1995 46% 10% 25% 19% 38% 8% 261 94%
2001 60% 8% 17% 14% 50% 10% 229 92%2008 65% 5% 13% 17% 48% 17% 449 80%2014 74% 3% 9% 14% 52% 22% 316 85%
Overall at Chabot College:ll f iliti t t d t l i d i 2008 78% 2% 6% 15% 63% 14% 462 83%• college facilities support student learning programs and services. 2008 78% 2% 6% 15% 63% 14% 462 83%
2014 73% 0% 5% 22% 58% 15% 343 92%• the college assesses the effective use of facilities and equipment. 2008 62% 4% 11% 22% 50% 12% 411 74%
2014 63% 2% 13% 22% 48% 14% 299 81%• the college uses the results of the facilities evaluation as a basis for improvement.
2008 60% 4% 9% 27% 47% 13% 341 61%2014 55% 3% 16% 26% 41% 14% 264 71%2014 55% 3% 16% 26% 41% 14% 264 71%
NOTES: * 'Neutral' used in 1995 and 2001; 'Neither disagree nor agree' used in 2008 and 2014 Chabot College Office of Institutional Research Page 28 of 36

Chabot College Faculty/Staff Accreditation Surveys: 1995, 2001, 2008, and 2014 Comparisons
Percent whoAgree Percentage of those responding
Standard III: Resources or Strongly Strongly Number PercentStrongly Agree Disagree Disagree Neutral* Agree Agree
Responsesto each question
g y g g g g gC. Technology
In my classroom, the equipment, software, and network connections are sufficient to effectively support student learning. 2008 52% 10% 21% 16% 42% 10% 342 61%
2014 69% 5% 11% 14% 48% 21% 272 73%In the computer labs, the software and network configurations provide me with adequate accessp g p q
to the applications I need to support my courses. 2008 66% 3% 5% 25% 54% 13% 267 48%2014 63% 5% 13% 19% 48% 15% 186 50%
Faculty are sufficiently involved in the selection of instructional technology equipment.2008 44% 10% 16% 31% 35% 9% 266 48%2014 43% 5% 24% 28% 32% 12% 206 56%
I receive adequate training in the use of technology:• in my office. 2008 56% 7% 14% 23% 44% 12% 417 75%
2014 42% 8% 23% 26% 34% 8% 325 88%• in the classroom or lab. 2008 53% 8% 12% 27% 42% 11% 323 58%
2014 42% 8% 25% 26% 34% 8% 274 74%Technology hardware and software are kept current to meet my job or teaching needs.
2008 61% 5% 13% 22% 49% 11% 435 78%2014 52% 6% 22% 20% 40% 11% 339 91%
Requests for support services to maintain my computer are handled in a timely manner.2008 71% 4% 7% 18% 49% 22% 399 72%2014 66% 2% 13% 19% 46% 20% 311 84%
Students have adequate access to technological resources on campus to support their learning.2008 68% 4% 9% 19% 55% 13% 361 65%2014 63% 5% 15% 18% 49% 14% 286 77%
In the Graphics/Print Shop, the hours and assistance are sufficient for me.1995 62% 9% 18% 11% 47% 15% 244 88%2001 68% 8% 13% 11% 49% 19% 213 86%2008 81% 2% 5% 12% 57% 24% 385 69%2014 82% 2% 4% 12% 49% 33% 293 79%
NOTES: * 'Neutral' used in 1995 and 2001; 'Neither disagree nor agree' used in 2008 and 2014 Chabot College Office of Institutional Research Page 29 of 36

Chabot College Faculty/Staff Accreditation Surveys: 1995, 2001, 2008, and 2014 Comparisons
Percent whoAgree Percentage of those responding
Standard III: Resources or Strongly Strongly Number PercentStrongly Agree Disagree Disagree Neutral* Agree Agree
C. Technology (continued)
Responsesto each question
In the Media Services department: • the hours and assistance are sufficient for me 1995 74% 3% 8% 15% 57% 17% 237 85%
2001 83% 3% 3% 11% 56% 27% 198 80%2008 75% 4% 7% 15% 54% 21% 389 70%
For Audio Visual Services• the hours and assistance are sufficient to me 2014 69% 1% 7% 23% 45% 24% 241 65%• the hours and assistance are sufficient to me. 2014 69% 1% 7% 23% 45% 24% 241 65%
In the Media Services department: • the equipment provided is properly maintained 1995 77% 3% 7% 13% 57% 20% 215 77%
2001 81% 3% 2% 14% 54% 27% 182 73%2008 76% 3% 4% 17% 54% 21% 356 64%
For Audio Visual Services• classroom equipment is properly maintained 2014 63% 1% 12% 24% 39% 24% 249 67% • classroom equipment is properly maintained. 2014 63% 1% 12% 24% 39% 24% 249 67%
There is adequate technical staff to support the use of technology on campus.2008 51% 10% 16% 24% 39% 12% 388 70%2014 38% 12% 27% 22% 25% 13% 289 78%
Chabot links technology decisions to its institutional planning. 2008 49% 7% 9% 36% 37% 12% 261 47%2014 44% 5% 19% 32% 34% 9% 204 55%
The college replaces and maintains technological equipment to ensure thatThe college replaces and maintains technological equipment to ensure that discipline/program/service area needs are met. 2008 54% 6% 13% 27% 43% 11% 352 63%
2014 49% 5% 15% 30% 39% 10% 278 75%
NOTES: * 'Neutral' used in 1995 and 2001; 'Neither disagree nor agree' used in 2008 and 2014 Chabot College Office of Institutional Research Page 30 of 36

Chabot College Faculty/Staff Accreditation Surveys: 1995, 2001, 2008, and 2014 Comparisons
Percent whoAgree Percentage of those responding
Standard IV: Leadership and Governance or Strongly Strongly Number PercentStrongly Agree Disagree Disagree Neutral* Agree Agree
A Decision making roles and processes
to each questionResponses
A. Decision-making roles and processes
If I have a question about campus policies or procedures, I know where to go for an answer.2008 76% 2% 9% 13% 56% 20% 517 93%2014 66% 3% 14% 17% 50% 15% 345 93%
I have a substantive role in college governance and policy-making that relates to my areasf ibilit d ti 2008 42% 8% 26% 24% 30% 12% 446 80% of responsibility and expertise. 2008 42% 8% 26% 24% 30% 12% 446 80%
2014 39% 10% 25% 26% 28% 12% 297 80%Faculty and/or staff input has:• helped the college better achieve its mission. 2008 72% 2% 4% 22% 54% 18% 417 75%
2014 72% 1% 6% 21% 53% 19% 300 81%• helped improve student learning. 2008 74% 2% 3% 21% 54% 20% 408 73%
2014 74% 0% 4% 21% 55% 19% 298 80%2014 74% 0% 4% 21% 55% 19% 298 80%The current structure of Councils and Committees provides effective college-wide participation
in decision-making for all segments of the college community. 2008 46% 8% 13% 33% 37% 9% 342 61%2014 34% 9% 25% 32% 28% 5% 259 70%
The college evaluates its governance and decision-making structures in order to identifyweaknesses and make needed improvements. 2008 46% 8% 14% 32% 38% 8% 307 55%
2014 43% 8% 16% 34% 35% 8% 238 64%2014 43% 8% 16% 34% 35% 8% 238 64%
NOTES: * 'Neutral' used in 1995 and 2001; 'Neither disagree nor agree' used in 2008 and 2014 Chabot College Office of Institutional Research Page 31 of 36
Chabot College Faculty/Staff Accreditation Surveys: 1995, 2001, 2008, and 2014 Comparisons
Percent whoAgree
Responsesto each question
Standard IV: Leadership and Governance or Number PercentStrongly Agree
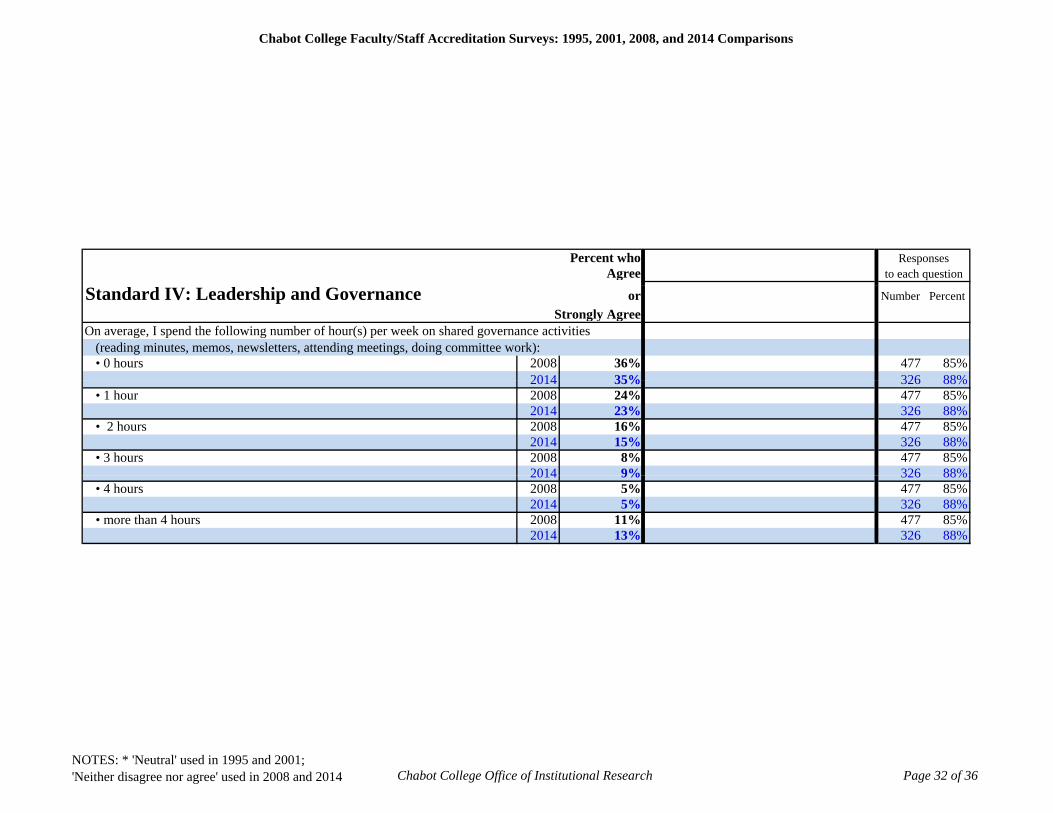
On average, I spend the following number of hour(s) per week on shared governance activities (reading minutes, memos, newsletters, attending meetings, doing committee work):• 0 hours 2008 36% 477 85%
2014 35% 326 88%2014 35% 326 88%• 1 hour 2008 24% 477 85%
2014 23% 326 88%• 2 hours 2008 16% 477 85%
2014 15% 326 88%• 3 hours 2008 8% 477 85%
2014 9% 326 88%2014 9% 326 88%• 4 hours 2008 5% 477 85%
2014 5% 326 88%• more than 4 hours 2008 11% 477 85%
2014 13% 326 88%
NOTES: * 'Neutral' used in 1995 and 2001; 'Neither disagree nor agree' used in 2008 and 2014 Chabot College Office of Institutional Research Page 32 of 36

Chabot College Faculty/Staff Accreditation Surveys: 1995, 2001, 2008, and 2014 Comparisons
Percent who ResponsesAgree Percentage of those responding
Standard IV: Leadership and Governance or Strongly Strongly Number PercentStrongly Agree Disagree Disagree Neutral* Agree Agree
B. Board, District, and College AdministrationThe Board of Trustees:
to each question
• equitably represents the interests of Chabot. 1995 12% 24% 36% 28% 11% 1% 217 78%2001 17% 29% 32% 22% 15% 2% 175 70%2008 43% 9% 15% 33% 36% 7% 324 58%2014 33% 10% 28% 29% 28% 5% 236 64%
• exhibits interest in and understanding of the College's programs, services, and needs. 1995 18% 19% 32% 31% 17% 0% 213 77%1995 18% 19% 32% 31% 17% 0% 213 77%2001 18% 28% 32% 22% 17% 1% 175 70%2008 50% 7% 10% 34% 41% 9% 332 59%2014 42% 8% 17% 34% 34% 7% 238 64%
• makes responsible decisions that support and promote the mission of the college.2008 46% 6% 9% 38% 40% 7% 337 60%2014 40% 7% 18% 34% 34% 6% 229 62%2014 40% 7% 18% 34% 34% 6% 229 62%
• accomplishes its responsibilities in ways that promote a positive learning environment at the college. 2008 49% 5% 9% 37% 42% 7% 327 59%
2014 40% 6% 14% 40% 35% 5% 228 61%College Management/Administration
The practice of shared governance has been adequately promoted and implementedp g q y p pby the college administration. 1995 27% 18% 26% 30% 22% 5% 215 77%
2001 32% 19% 26% 24% 28% 3% 180 72%2008 45% 9% 14% 32% 37% 8% 355 64%2014 46% 4% 15% 35% 35% 11% 265 71%
Important recommendations/decisions are implemented in a timely mannerby the college administration 1995 19% 15% 36% 29% 19% 0% 215 77%by the college administration. 1995 19% 15% 36% 29% 19% 0% 215 77%
2001 14% 23% 28% 34% 13% 2% 183 73%2008 33% 11% 20% 35% 27% 6% 369 66%
Important recommendations/decisions made through shared governance are implemented by the college administration 2014 38% 6% 18% 37% 28% 10% 242 65%
The college climate encourages faculty, staff and administration to value and strive for cooperative and mutually respectful working conditions. 1995 44% 12% 23% 20% 36% 8% 265 95%cooperative and mutually respectful working conditions. 1995 44% 12% 23% 20% 36% 8% 265 95%
2001 46% 13% 19% 22% 38% 8% 239 96%2008 71% 3% 9% 17% 54% 17% 487 87%2014 62% 4% 13% 21% 44% 18% 343 92%
NOTES: * 'Neutral' used in 1995 and 2001; 'Neither disagree nor agree' used in 2008 and 2014 Chabot College Office of Institutional Research Page 33 of 36

Chabot College Faculty/Staff Accreditation Surveys: 1995, 2001, 2008, and 2014 Comparisons
Percent whoAgree Percentage of those responding
Standard IV: Leadership and Governance or Strongly Strongly Number PercentStrongly Agree Disagree Disagree Neutral* Agree Agree
District Management/Administration
Responsesto each question
g
The division between District and College operational responsibilities is written downand clearly communicated. 2008 27% 14% 27% 33% 22% 5% 318 57%
The division between District and College operational responsibilities is clearly communicated.2014 24% 14% 31% 30% 22% 2% 221 60%
MIS/ITS services are administered to meet the needs of the College 1995 43% 9% 20% 29% 39% 5% 200 72%MIS/ITS services are administered to meet the needs of the College. 1995 43% 9% 20% 29% 39% 5% 200 72%2001 39% 15% 21% 25% 34% 5% 181 73%
Information Technology Services (ITS) is administered to meet the needs of the College.2008 59% 6% 9% 26% 49% 11% 395 71%
The District services are administered to meet the needs of Chabot College in • Information Technology Services (ITS) 2014 40% 11% 17% 31% 36% 4% 238 64%
Di t i t d i i t ti i i t th d f th C ll 1995 12% 31% 34% 23% 11% 0% 226 81%District administration is responsive to the needs of the College. 1995 12% 31% 34% 23% 11% 0% 226 81%2001 15% 26% 39% 19% 13% 2% 188 76%
The District:Responsiveness by the District administration to Chabot needs. 2008 25% 11% 22% 42% 19% 6% 288 52%
District services are responsive to Chabot staff/faculty/administrators2014 34% 11% 15% 39% 31% 3% 241 65%
Faculty
Part-time faculty members are encouraged to participate in decision-making activitiesin their teaching areas. 2008 43% 11% 22% 25% 34% 9% 347 62%
2014 51% 10% 15% 24% 37% 13% 279 75%There is adequate classified/professional staff participation in the development of institutional policyThere is adequate classified/professional staff participation in the development of institutional policy.
2008 38% 7% 14% 41% 31% 7% 305 55%There is adequate classified professional voice in the development of institutional policy.
2014 38% 5% 18% 39% 26% 11% 185 50%As a member of the classified staff, I feel respected & valued by the college administration.
2008 50% 7% 13% 30% 38% 12% 255 46%As a classified professional I feel respected & valued by the college administrationAs a classified professional, I feel respected & valued by the college administration.
2014 45% 8% 15% 33% 29% 16% 128 35%
NOTES: * 'Neutral' used in 1995 and 2001; 'Neither disagree nor agree' used in 2008 and 2014 Chabot College Office of Institutional Research Page 34 of 36

Chabot College Faculty/Staff Accreditation Surveys: 1995, 2001, 2008, and 2014 Comparisons
Percent whoAgree Percentage of those responding
Standard IV: Leadership and Governance (continued) or Strongly Strongly Number PercentStrongly Agree Disagree Disagree Neutral* Agree Agree
Faculty
to each questionResponses
There is adequate faculty participation in the development of: institutional policy. 1995 25% 10% 36% 30% 21% 4% 154 55%2001 27% 11% 30% 32% 25% 3% 157 63%
There is adequate faculty participation in the development of institutional policy.2008 44% 7% 10% 39% 36% 7% 295 53%% % % % % % %
There is adequate faculty voice in the development of institutional policy.2014 55% 3% 12% 30% 35% 20% 240 65%
The Academic Senate has been effective in communicating faculty professional concerns to the college administration. 1995 60% 3% 13% 24% 50% 10% 178 64%
2001 45% 8% 14% 33% 38% 7% 143 57%The Academic Senate has been effective in communicating concerns of the faculty toThe Academic Senate has been effective in communicating concerns of the faculty to
the college administration. 2008 56% 4% 6% 33% 47% 9% 284 51%2014 57% 5% 8% 30% 36% 20% 214 58%
As a member of the faculty, I feel respected and valued by the college administration.1995 48% 10% 20% 22% 36% 12% 167 60%2001 40% 20% 21% 19% 34% 6% 160 64%2008 56% 7% 10% 27% 43% 13% 341 61%2008 56% 7% 10% 27% 43% 13% 341 61%2014 63% 6% 7% 23% 42% 22% 260 70%
NOTES: * 'Neutral' used in 1995 and 2001; 'Neither disagree nor agree' used in 2008 and 2014 Chabot College Office of Institutional Research Page 35 of 36

Chabot College Faculty/Staff Accreditation Surveys: 1995, 2001, 2008, and 2014 Comparisons
Percent whoAgree Percentage of those responding
Standard IV: Leadership and Governance (continued) or Strongly Strongly Number PercentStrongly Agree Disagree Disagree Neutral* Agree Agree
Classified Staff
Responsesto each question
The Classified Senate has been effective in communicating concerns of the classifiedstaff to the college administration. 1995 29% 10% 11% 50% 26% 3% 102 37%
2001 46% 4% 18% 31% 41% 6% 125 50%2008 54% 4% 6% 36% 44% 10% 232 42%
The Classified Senate has been effective in communicating concerns of the classifiedThe Classified Senate has been effective in communicating concerns of the classified professionals to the college administration. 2014 59% 2% 2% 37% 36% 23% 141 38%
Students/Student Government/Student ActivitiesStudents are appropriately involved in the governance of the College. 1995 28% 12% 27% 33% 25% 3% 162 58%
2001 43% 4% 19% 34% 40% 3% 140 56%2008 44% 4% 14% 38% 38% 7% 285 51%2008 44% 4% 14% 38% 38% 7% 285 51%
Students are adequately involved in the governance of the College. 2014 53% 5% 13% 29% 41% 12% 217 58%The administration provides adequate means for students to have their desires
and concerns addressed. 1995 38% 8% 20% 35% 33% 5% 164 59%2001 44% 6% 14% 36% 38% 6% 138 55%2008 49% 5% 12% 34% 43% 6% 318 57%2014 57% 4% 8% 31% 38% 19% 221 60%
NOTES: * 'Neutral' used in 1995 and 2001; 'Neither disagree nor agree' used in 2008 and 2014 Chabot College Office of Institutional Research Page 36 of 36