ch6 raman lab feb 10 2009 - college of engineering...
TRANSCRIPT

Raman Spectroscopy
1. Vibrational Raman Spectroscopy 2. Dynamical Light Scattering
3. Resonance Raman Spectroscopy of Cytochrome C
Ch6 Laboratory California Institute of Technology
Rev. 2 February 2009
OVERVIEW Raman Spectroscopy involves the study of transitions between quantum levels of molecules and matter induced by the inelastic scattering of light. The lab has three components:
Vibrational Spectroscopy. In this experiment, you will investigate the vibrational spectrum of simple organic molecules through the Raman spectrum of their liquids. You will analyze the spectrum of an unknown ZXY3 . There is an option to apply group theory methods, if you are familiar.
Dynamical Light Scattering. The Heisenberg Uncertainty Principle tells us that fast dynamical – time-dependent – processes lead to finite linewidths of quantum transitions. The lineshape of a Raman band of benzene will be analyzed to determine the lifetime for
vibrational dephasing and the diffusion of the molecular reorientation (the rotational diffusion constant).
Resonance Raman Spectroscopy. When the incident light is resonant with a strong electronic transition in the molecule, the Raman scattering signal is greatly enhanced. This high sensitivity allows one to detect low concentrations of strong absorbers, e.g. biological molecules with chromophores. Here you will record and interpret the Resonance Raman spectrum of cytochrome C.
LOCATION: BI Laser Resource Center, Room 018B Beckman Institute, Basement Contact: BILRC Laser lab GLA. This is a BI Resource. Authors: Ch6 staff and TAs

SAFETY HAZARDS
1. CLASS IIIB AND CLASS IV VISIBLE/UV RADIATION LASERS
Do not view Class IIIb or Class IV laser beams or their stray reflections directly.
ALWAYS WEAR LASER GOGGLES WHEN
THE LASER BEAM IS ON. The Argon ion laser is a Class IV laser. Class IV lasers are high power lasers. Their radiation poses a significant hazard not only from direct or scattered reflections, but also from diffuse reflection. Such lasers may produce skin burns and are fire hazards. The HeCd laser is a Class IIIB laser. Class IIIB lasers are moderate power lasers. Direct viewing of the Class IIIb laser beam is hazardous to the eye and diffuse reflections of the beam can also be hazardous to the eye. 2. “Unknown” 3. Benzene Read attached Material Safety Data Sheet. 4. Cytochrome C Irritant. Do not ingest. Read attached Material Safety Data Sheet.

Class IV Lasers The Argon Ion laser, which has lines at 514 nm and 488 nm, is a Class IV laser. These are high power (c.w. >500mW or pulsed >10J/cm²) devices; applications of Class IV lasers include, drilling, cutting, welding, and micromachining. The direct beam and diffuse reflections from Class IV lasers are hazardous to the eyes and skin. Class IV laser devices can also be a fire hazard depending on the reaction of the target when struck. Much greater controls are required to ensure the safe operation of this class of laser devices. Whenever occupying a laser controlled area, wear the proper eye protection. Most laser eye injuries occur from reflected beams of class IV laser light, so keep all reflective materials away from the beam. Do not place your hand or any other body part into the class IV laser beam.
Class IIIB Lasers The HeCd laser lases at 325 nm, in the UV. Class IIIB lasers include CW lasers with powers of 5-500 mW, and pulsed lasers with fluences of 10 J cm-2 - or the diffuse reflection limit, which ever is lower. Do not view the Class IIIb laser beam or its stray reflections directly. Do not view a Class IIIb laser beam with telescopic devices; this amplifies the problem. Whenever occupying a laser controlled area, wear the proper eye protection. In general, Class IIIB lasers will not be a fire hazard and are not generally capable of producing a hazardous diffuse reflection except for conditions of intentional staring done at distances close to the diffuser. Specific controls are recommended.

REFERENCES For an introduction to Raman Spectroscopy, consult any of the elementary texts dealing with molecular spectroscopy, for example: Michael Hollas, Modern Spectroscopy, Peter Bernath, Spectra of Atoms and Molecules, For a detailed reference see: D.A. Long, “Raman Spectroscopy” (Recommended) T.R. Gilson, “Laser Raman Spectroscopy” For chemical applications of group theory, see: F.A. Cotton, Chemical Applications of Group Theory Daniel C. Harris, Michael D. Bertolucci, Symmetry and Spectroscopy: An Introduction to
Vibrational and Electronic Spectroscopy, Dover Publications (January 1, 1990) The theory of the Raman lineshape is covered by a number of papers, which are rather detailed: R.G. Gordon, Adv. Mag. Reson. 3, 1 (1963). S. Bratos, J. Rios, V. Guissani, J. Chem. Phys. 52, 439 (1970). F.J. Bartoli, T.A. Litovitz, J. Chem. Phys. 56, 413 (1972). Anisotropic Raman Scattering is thoroughly covered in the text: W. Flygare, “Molecular Structure and Dynamics” Raman linewidth measurements of benzene, and a compilation of literature values of rotational diffusion coefficients, are given by: K. Tanabe, Chem. Phys. Lett. 63, 43 (1979). Resonance Raman of Cytochrome C Brunner H, Biochem Biophy Res Co 51 (4): 888-894 1973 Sprio TG, Strekas TC, P Natl Aca Sci Usa 69 (9): 2622 1972 Strekas TC, Spiro TG, Biochim Biophys Acta 278 (1): 188 1972

INTRODUCTION Raman spectroscopy is the study of matter by the inelastic scattering of monochromatic light. It has become a ubiquitous tool in modern spectroscopy, biophysics, microscopy, geochemistry, and analytical chemistry. In contrast to typical absorption or emission spectroscopy experiments, transitions among quantum levels of atoms or molecules are induced by the absorption or emission of photons (IR, visible, UV). Raman spectroscopy is much less sensitive than absorption or emssion spectroscopies, because of the inherent weakness of the scattering process, but has many intrinsic advantages, including freedom to choose an incident wavelength which is not absorbed by the surrounding media (especially useful for aqueous or mineral samples which have strong IR absorption bands), small volumes probed (the light can be focused to micron-sized spots), and symmetry-based selection rules which allow transitions that are ‘optically forbidden’ in absorption to be detected in scattering. Monochromatic light incident on a transparent substance is transmitted with almost no attenuation. A small fraction of the light is scattered by the substance in all directions (though preferentially in the forward direction). The weakly scattered radiation contains photons at the incident frequency 0 (elastic or Rayleigh scattering), but also contains other frequencies such as 0i, where i is the frequency of a molecular transition (typically rotational or vibrational) of the material. This inelastic light scattering is known as Raman scattering. The effect, discovered by the Indian physicist Chandrasekhara Venkata Raman, has become especially useful to spectroscopists since the advent of lasers, which can provide intense sources of monochromatic light.
Figure 1. Sir C. V. Raman, who won the 1930 Nobel Prize in Physics “for his work on the scattering of light and for the discovery of the effect named after him". His nephew, S. Chandrasekhar, would also win the Nobel Prize for his prediction of Black Holes.
Raman Spectrometer In a typical Raman experiment, a polarized monochromatic light source (usually a laser) is focused into a sample, and the scattered light at 90o to the laser beam is collected and dispersed by a high-resolution monochromator. The incident laser wavelength (chosen such that the sample does not absorb, in ordinary Raman Spectroscopy) is fixed, and the scattered light is dispersed and detected to obtain the frequency spectrum of the scattered light. The scattered light is very weak (<10-7 of the incident power), so that monochromators with excellent stray-light rejection and sensitive detectors are required.

Figure 2. Layout of a typical Raman Spectrometer
argon laser
dispersion prism
aperture
focusing lens
sample vial
polarizer
scrambler low-pass
filter
CCD array
spectrograph
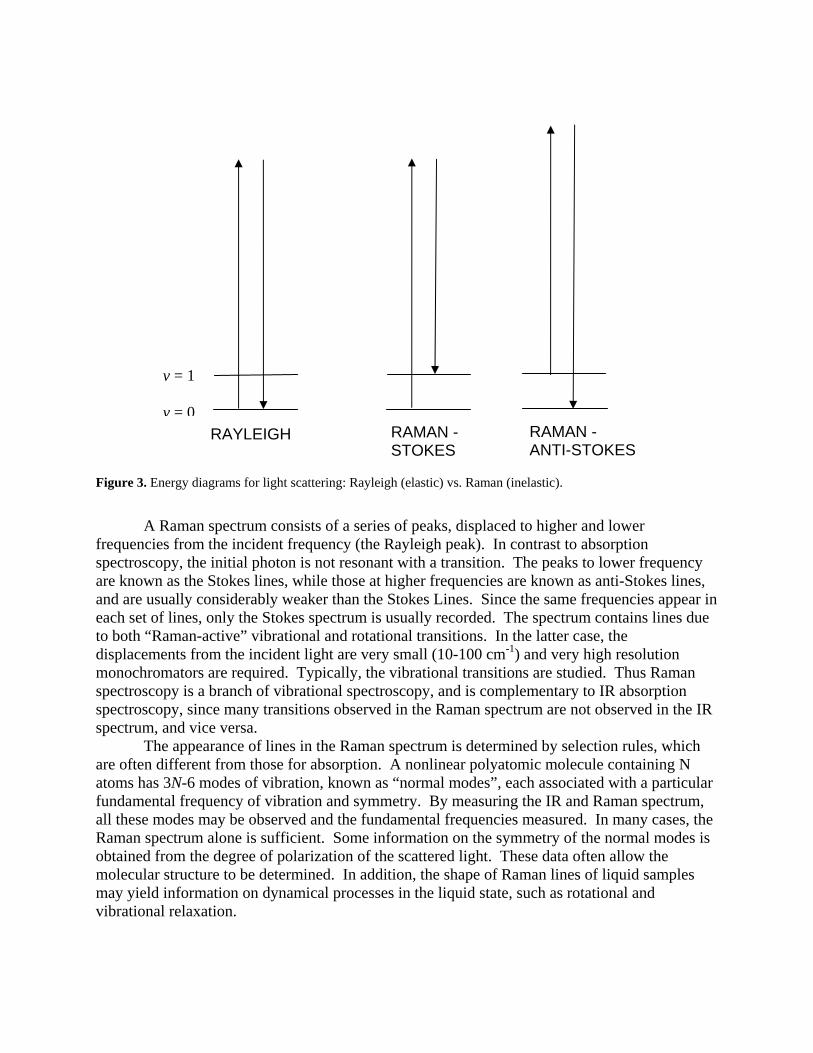
Figure 3. Energy diagrams for light scattering: Rayleigh (elastic) vs. Raman (inelastic).
A Raman spectrum consists of a series of peaks, displaced to higher and lower frequencies from the incident frequency (the Rayleigh peak). In contrast to absorption spectroscopy, the initial photon is not resonant with a transition. The peaks to lower frequency are known as the Stokes lines, while those at higher frequencies are known as anti-Stokes lines, and are usually considerably weaker than the Stokes Lines. Since the same frequencies appear in each set of lines, only the Stokes spectrum is usually recorded. The spectrum contains lines due to both “Raman-active” vibrational and rotational transitions. In the latter case, the displacements from the incident light are very small (10-100 cm-1) and very high resolution monochromators are required. Typically, the vibrational transitions are studied. Thus Raman spectroscopy is a branch of vibrational spectroscopy, and is complementary to IR absorption spectroscopy, since many transitions observed in the Raman spectrum are not observed in the IR spectrum, and vice versa.
The appearance of lines in the Raman spectrum is determined by selection rules, which are often different from those for absorption. A nonlinear polyatomic molecule containing N atoms has 3N-6 modes of vibration, known as “normal modes”, each associated with a particular fundamental frequency of vibration and symmetry. By measuring the IR and Raman spectrum, all these modes may be observed and the fundamental frequencies measured. In many cases, the Raman spectrum alone is sufficient. Some information on the symmetry of the normal modes is obtained from the degree of polarization of the scattered light. These data often allow the molecular structure to be determined. In addition, the shape of Raman lines of liquid samples may yield information on dynamical processes in the liquid state, such as rotational and vibrational relaxation.
RAMAN - STOKES
RAMAN - ANTI-STOKES
v = 1 v = 0
RAYLEIGH

An important observable is the extent of depolarization of the scattered light. When the incident light is polarized, then the scattered light may retain the initial polarization, but it may also become depolarized, with some of the light possessing a polarization perpendicular to the incident light. The depolarization of the scattered light can be expressed by
I
I
where I|| and I are the intensities of the scattered light polarized parallel or perpendicular to the exciting light, respectively.

Background for Raman Spectroscopy Classical Description of Vibrational Raman Scattering When a molecule is in an electric field E, the electron cloud and nuclei become polarized resulting in an induced dipole moment P. The size of the dipole moment induced by a field of magnitude E is given by the polarizability of the molecule: P E (1.1) ( has units of volume). Light consists of oscillating electric and magnetic fields. For light of frequency 0, the magnitude of the electric field may be written: 0 0cos(2 )tE E (1.2)
Thus, the induced dipole moment oscillates in phase with the applied field: 0 0cos(2 )t P E (1.3)
The polarizability will depend upon the geometry of the molecule; as the molecule vibrates, the polarizability will change. If we write the polarizability as a Taylor series expansion in a nuclear coordinate r about its equilibrium position (r0)
0
0 0 ...r
r rr
(1.4)
Alternatively, we can expand in terms of qi, the vibrational displacement coordinate of the i th normal mode. The classical normal mode vibration is 0 cos(2 )i i iq q t (1.5)
where i is the frequency of normal mode i. In this classical picture, we then find that
0 0
0 0 0
00 0 0
0
00 0 0
0
cos(2 ) cos(2 ) cos(2 )
1cos(2 ) cos 2 ( ) cos2 ( )
2
i ii
i i ii
t t q tq
t q t tq
P E E
E E
(1.6)
The intensity of the incident light I0 is proportional to E0
2, while the scattered power is proportional to |P|2. The first term in Eq. (1.6) represents the Rayleigh scattering. The last two terms oscillate at the sum and difference frequencies, and represent the anti-Stokes and Stokes scattering, respectively.

The intensity of the Raman scattering is seen to be proportional to the derivative of the polarizability (squared):
22 2scatt 0 00iI q I P E (1.7)
Thus, the polarizability must change linearly with vibrational motion for vibrational Raman scattering to occur. The greater the change, the more intense the Raman scattering. If is unchanged or at a minimum/maximum, there is no Raman scattering. This is the so-called double harmonic approximation, where we have made two assumptions:
- harmonic motion of the nuclei (normal mode or mechanical harmonic approximation)
- first term in the Taylor series expansion of (electrical harmonic approximation)
Note also that the Raman intensity depends on the square of the incident intensity I0 in (1.7). Raman spectroscopy is an example of a nonlinear optical method, i.e. one that depends nonlinearly on intensity (examples of linear spectroscopies include absorption and emission). The Polarizability Tensor P and E are vector quantities. In the above discussion, we have assumed that is a scalar. However, this is true only for spherical top molecules like methane. In non-isotropic molecules, the application of an electric field in one direction induces a dipole moment in another direction. Thus is a second rank tensor (a matrix). We then write, instead of Eq. (1.1)
x xx xy xz x
y yx yy yz y
z zx zy zz z
P P
P P
P P
(1.8)
xy, for example, is the dipole moment along the x-direction due to a unit electric field polarized along the y-direction. The polarizability tensor, , is defined by these nine coefficients. However, because xy = yx, zx = xz. yz = zy there are only six independent coefficients. The six coefficients may be used to define an ellipsoid: 2 2 2
2 2 2 1xx yy zz xy yz zxa x a y a z a xy a yz a zx (1.9)
The polarizability of a non-isotropic molecule is divided into three orthogonal components, and the values of these components determine the dimensions of the polarizability ellipsoid. The general criterion for a molecule to have an allowed vibrational Raman spectrum is that any of the six components of the polarizability tensor change during a vibration or rotation. In the case of vibrations, this means that one or more of the quantities
0
ab
iq
(1.10)

must be non-zero for a, b = x, y, z. Vibrational modes which satisfy this condition will produce lines in the Raman spectrum, and are said to be Raman-active. These modes cause at least one dimension of the polarizability ellipsoid to change during the vibration. Those modes which cause no net change in the size of the ellipsoid are not observed in the Raman spectrum. In the case of rotational Raman scattering, the polarizability in a given direction must change during the rotation. Thus, all molecules with nonspherical polarizability ellipsoids will show a rotational Raman spectrum. Quantum Mechanical Treatment The correct treatment of Raman Spectroscopy requires the use of quantum electrodynamics. However, one can use the semi-classical approach to arrive at selection rules. The interaction Hamiltonian is given by:
2 2 20
0
1 1 1( )
2 2 2 jj j
H t qq
E E E (1.11)
When we expand in a Taylor series, and look at matrix elements coupling initial and final molecular states vi and vf for normal mode j :
2
0
1
2f i f j ij
v H v v q vq
E (1.12)
the matrix element of qj leads to the vibrational Raman (harmonic oscillator) selection rule 1v (1.13)

EXPERIMENT 1. VIBRATIONAL RAMAN SPECTROSCOPY VIBRATIONS OF AN UNKNOWN ZXY3 MOLECULE Every molecule containing N atoms has 3N degrees of freedom, which are partitioned as
Nonlinear molecule 3 translations 3 rotations 3N6 vibrations Linear molecule 3 translations 2 rotations 3N5 vibrations
Raman spectroscopy and infrared absorption spectroscopy provide complementary ways of measuring the vibrations of molecules. Diatomic Molecules
For diatomic molecules, there is only one vibrational coordinate, the bond stretch, e.g. C=O NN e IR-active Raman-active CO heteronuclear 2169.8 cm-1 yes yes N2 homonuclear 2358.6 cm-1 no yes In the harmonic approximation, the frequency of the vibration is related to the force constant k of the bond by the relation:
k
c
(1.14)
where is the reduced mass and is the wavenumber (cm1). For historical reasons, the harmonic wavenumber is often labeled by the variable e. IR vs. Raman Spectrum
CO is an example of a heteronuclear molecule; such molecules can have a dipole moment along the internuclear axis, and hence a vibrational transition will occur upon absorption of an infrared photon (IR-active). The homonuclear molecule N2, however, cannot have a dipole moment by symmetry, and hence is IR-inactive. The vibrational selection rule for IR absorption is
1v (1.15)
In contrast to their infrared spectra, both types of molecules have vibrational transistions that are Raman active. Both molecules have a polarizability ellipsoid with polarizabilities parallel
(zz) and perpendicular (xx = yy) to the internuclear axis. Note that because is a second rank tensor, it must be symmetric, regardless of whether the molecule is heteronuclear or homonuclear. In the case of of CO, the induced dipole P along z has the same magnitude along the internuclear axis, regardless of whether E0 points along +z or z.
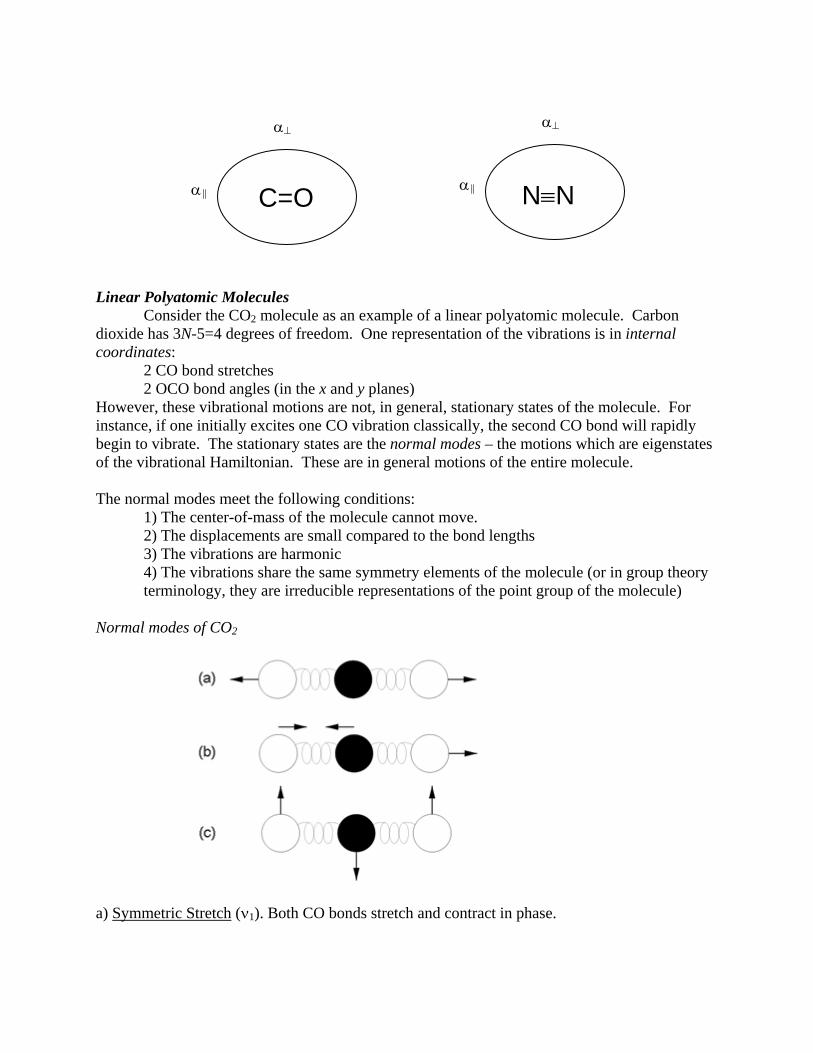
Linear Polyatomic Molecules
Consider the CO2 molecule as an example of a linear polyatomic molecule. Carbon dioxide has 3N-5=4 degrees of freedom. One representation of the vibrations is in internal coordinates: 2 CO bond stretches 2 OCO bond angles (in the x and y planes) However, these vibrational motions are not, in general, stationary states of the molecule. For instance, if one initially excites one CO vibration classically, the second CO bond will rapidly begin to vibrate. The stationary states are the normal modes – the motions which are eigenstates of the vibrational Hamiltonian. These are in general motions of the entire molecule. The normal modes meet the following conditions:
1) The center-of-mass of the molecule cannot move. 2) The displacements are small compared to the bond lengths 3) The vibrations are harmonic 4) The vibrations share the same symmetry elements of the molecule (or in group theory terminology, they are irreducible representations of the point group of the molecule)
Normal modes of CO2
a) Symmetric Stretch (1). Both CO bonds stretch and contract in phase.
C=O NN
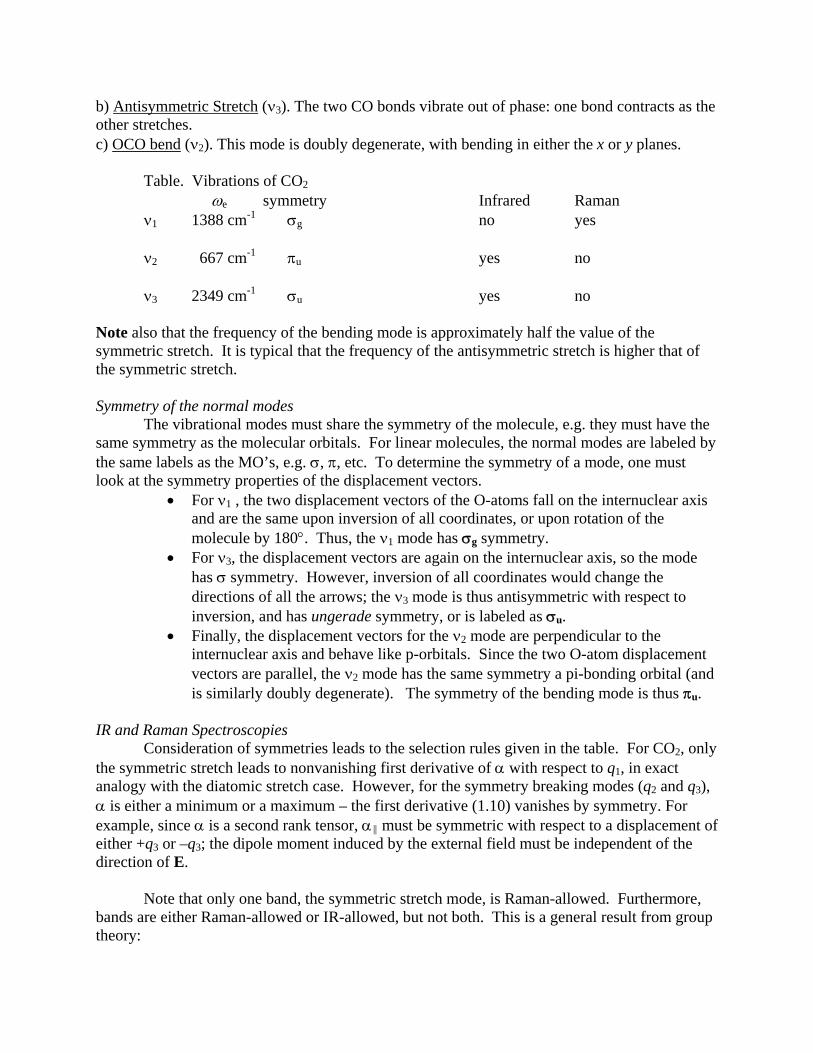
b) Antisymmetric Stretch (3). The two CO bonds vibrate out of phase: one bond contracts as the other stretches. c) OCO bend (2). This mode is doubly degenerate, with bending in either the x or y planes. Table. Vibrations of CO2 e symmetry Infrared Raman 1 1388 cm-1 g no yes
2 667 cm-1 u yes no
3 2349 cm-1 u yes no Note also that the frequency of the bending mode is approximately half the value of the symmetric stretch. It is typical that the frequency of the antisymmetric stretch is higher that of the symmetric stretch. Symmetry of the normal modes
The vibrational modes must share the symmetry of the molecule, e.g. they must have the same symmetry as the molecular orbitals. For linear molecules, the normal modes are labeled by the same labels as the MO’s, e.g. , , etc. To determine the symmetry of a mode, one must look at the symmetry properties of the displacement vectors.
For 1 , the two displacement vectors of the O-atoms fall on the internuclear axis and are the same upon inversion of all coordinates, or upon rotation of the molecule by 180. Thus, the 1 mode has g symmetry.
For 3, the displacement vectors are again on the internuclear axis, so the mode has symmetry. However, inversion of all coordinates would change the directions of all the arrows; the 3 mode is thus antisymmetric with respect to inversion, and has ungerade symmetry, or is labeled as u.
Finally, the displacement vectors for the 2 mode are perpendicular to the internuclear axis and behave like p-orbitals. Since the two O-atom displacement vectors are parallel, the 2 mode has the same symmetry a pi-bonding orbital (and is similarly doubly degenerate). The symmetry of the bending mode is thus u.
IR and Raman Spectroscopies
Consideration of symmetries leads to the selection rules given in the table. For CO2, only the symmetric stretch leads to nonvanishing first derivative of with respect to q1, in exact analogy with the diatomic stretch case. However, for the symmetry breaking modes (q2 and q3), is either a minimum or a maximum – the first derivative (1.10) vanishes by symmetry. For example, since is a second rank tensor, must be symmetric with respect to a displacement of either +q3 or –q3; the dipole moment induced by the external field must be independent of the direction of E.
Note that only one band, the symmetric stretch mode, is Raman-allowed. Furthermore,
bands are either Raman-allowed or IR-allowed, but not both. This is a general result from group theory:

MUTUAL EXCLUSION RULE. For centro-symmetric molecules (those with a center of inversion), transitions are allowed either for Raman scattering or by infrared absorption, but not both. This rule is true for both linear and nonlinear molecules.
Note that these symmetry-based selection rules say nothing about the intensities of the bands; some bands may be allowed but extremely weak, based on the magnitude of the dipole moment or polarizabilities. Asymmetric linear molecules such as OCS lack the center of inversion. Their vibrational states have and symmetries (or , etc for states with multiple quanta of bends excited), but and do not have gerade or ungerade symmetries. Hence, fundamental transitions (v = 1) are allowed in both Raman and IR spectroscopy. Nonlinear Polyatomic Molecules: NH3 We will use ammonia as an example of a symmetric (though not centro-symmetric) molecule. It has a three-fold symmetry axis; the molecules is symmetric with respect to a rotation about this axis by 120.Ammonia has 3N6=6 degrees of freedom. We can subdivide the internal coordinates into 3 NH bond stretches 3 HNH bond angles The normal modes can be envisioned as follows:
1) 1. The symmetric stretch involves all three NH bonds stretching in phase. 2) 2. The umbrella bend 3) 3. The antisymmetric stretch involves out of phase stretching of the NH bonds. There are two possible combinations, which are degenerate in energy 4) 4. The antisymmetric bend involves out of phase bending of the bond angles. Again, there are two possible combinations, which are degenerate.
These modes for ammonia are listed in the table below and shown schematically in the following figure. Table. Vibrations of NH3 e symmetry Infrared Raman 1 1388 cm-1 A1 symmetric stretch yes yes
2 667 cm-1 A1 umbrella bend yes yes
3 2349 cm-1 E antisymmetric stretch yes yes
4 2349 cm-1 E antisymmetric bend yes yes

1. Symmetric 2. Umbrella stretch bend 3. Antisymmetric Stretch 4. Antisymmetric Bend Figure. Displacement vectors for normal modes of an XY3 molecule. From Gerhard Herzberg, Infrared and Raman Spectra, Spectra and Structure of Molecules, Vol. 2, Nostrand-Reinhold, New York, 1945. A 3D animation of the normal modes of ammonia can be seen at: http://www.chemtube3d.com/vibrationsNH3.htm Infrared and Raman Spectroscopy Note in this case that all four modes are detectable by both Raman and Infrared spectroscopies. Raman spectroscopy provides an additional observable: the depolarization ratio. For totally symmetric vibrational modes, the polarization of the light is more likely to be preserved; as a result, there more of the scattered light will remain polarized parallel to the original polarization. The depolarization ratio will thus be
1 totally symmetric modes
1 nonsymmetric modes
(1.16)
Group Theoretical Notation You will not be expected to know group theory for this lab, but it is helpful to know a bit about the nomenclature for molecules with 3-fold symmetry. Ammonia has a three-fold symmetry axis, which is called the C3 axis. In addition, one can draw a vertical mirror plane which includes one NH bond and bisects the other two.

Ammonia is also symmetric with respect to reflection about that vertical plane, and there are three such planes.
Ammonia has the same symmetry elements as a whole class of molecules with three-fold symmetry. These molecules are said to have a symmetry of the ‘C3v’ point group. The vibrational normal modes (or other properties, such as electronic states) behave in one of three ways:
A1 symmetry. Totally symmetric. A2 symmetry. Symmetric with respect to rotation about the C3 axis, but antisymmetric with respect to any reflection across a vertical mirror plane. E symmetry. Nonsymmetric with respect to rotation of 2/3 about the C3 axis.
A general rule for C3v molecules: For molecules with a three-fold symmetry axis like ammonia, each set of vibrations (stretches, bends) generally will form one nondegenerate symmetric A1 mode and a doubly degenerate antisymmetric E mode. Objective In this experiment, you will record the Raman spectrum of a liquid ZXY3 sample. Consider the following:
Number and frequencies of observed bands Relations among possible stretch/bend modes Depolarization ratios

EXPERIMENT 2. DYNAMICAL LIGHT SCATTERING The Raman Lineshape of Benzene In the gas phase, non-spherically symmetric molecules undergo rotational Raman scattering in addition to vibrational scattering, giving rise to a vibrational-rotational spectrum, similar to IR absorption. That is, each vibrational transition has well-defined rotational structure, due to transitions between the rigid rotor quantum states of the molecule. In the liquid state, this free rotation is heavily perturbed by frequent collisions, and intermolecular forces. The rotational motion of the molecules is then best described as a series of random angular jumps of variable duration and amplitude. The time-scale of these angular fluctuations is very fast, ~10-13 seconds. The rotational structure seen in gas phase spectra is not evident in liquid spectra; a smooth, broad envelope of typical width ~10-20 cm-1 is found instead. This width is the result of the rapid angular fluctuations, as well as an intrinsic vibrational linewidth, which results from vibrational energy fluctuations, which occur in the liquid state. The line shape in this case is best described in terms of correlation functions. A number of authors have considered this problem theoretically (see the references). The Raman lineshape may be written as the Fourier transform of the product of two correlation functions:
I( )1
2
dt ei t (t)
where (11)
(t)
q
o
(t) q
o
(0) q (t) q (o)
and the symbols have the same meaning as in Eq. (4). The angular brackets denote that the quantities (which refer to single molecules) are to be averaged over the ensemble of randomly distributed molecules comprising the liquid sample. These ensemble-averaged quantities are called correlation functions of the Taylor-series coefficient of the polarizability, and of the normal mode coordinate, respectively, because the values at time t are correlated with their values at time zero. The time dependence of these functions depends on both the underlying dynamics of the rotation or vibration, and the decay of correlations among individual molecules due to random collisions, etc. These functions contain all that we can know about the rotational and vibrational dynamics of liquids. It is of some interest to extract these functions from experimentally determined line-profiles, to compare with various theoretical models and to gain insight into the nature of the liquid state itself. In the second part of this experiment, these ideas will be illustrated by a relatively simple example, the Raman profile of liquid benzene. In the case of optically non-isotropic molecules, the correlations of the isotropic and non-isotropic components of the polarizability tensor must be considered separately. One can show that the lineshape of the Raman spectrum due to the isotropic component is determined by the vibrational correlation function only, while the anisotropic component involves the product of both rotational and vibrational correlation functions:
IISO () 1 2
dt ei tG (t)
(12)

I AN ( ) 1 2
dt e i t G ( t ) G R ( t )
where G(t) is the vibrational correlation function, and GR(t) is the rotational correlation function. The isotropic and anisotropic scattering intensities are related to the measured parallel and perpendicular polarized spectra, by: IISO () I|| ( ) 4 3 I ( )
IAN ( ) 1
10I () (13)
Thus, in practice, one measures the Raman spectrum for parallel and perpendicular polarization directions of the scattered light, then forms IISO and IAN according to the above formula. These two line-profiles (for a single line) are then inverse-Fourier-transformed, to obtain both G(t) and GR(t). However, this procedure is not without difficulties, and a simpler analysis will be used here. A model form for G(t) and GR(t) will be adopted, and the key parameters estimated from the line widths, rather than by fitting the entire line-profile. We will treat the rotational motion by the Rotational Diffusion Model. This model results in the limit of infinitely many infinitesimally small and uncorrelated angular jumps. The correlation function may be shown to be an exponential decay, with various combinations of rotational diffusion coefficients appearing in the exponents. The exact form of the correlation function depends on the nature of the vibrational mode being measured in the Raman spectrum. Physically, for a given Raman-active mode involving vibrational motions of a specific internal coordinate, only rotations of the polarizability tensor about specific molecular axes will cause a rotational broadening of the Raman line. In the case of the benzene 1 mode, only rotation about an axis lying in the ring-plane causes broadening. The rotational correlation function appropriate to this mode is : GR(t) = e-6Dxt (14) where Dx is the rotational diffusion coefficient for this motion (ring tumbling). Dx is to be found from the measured linewidths of the 1 line (anisotropic component). We will further assume that the vibrational correlation function decays exponentially, with a lifetime . This assumption is supported by recent time-resolved measurements of vibrational relaxation in the picosecond domain. G(t) = e-t/v (15) For this model the lineshapes are Lorentzian functions of frequency (Fourier transforms of exponentials) with linewidths given by: ISO = ( c )-1 in cm-1 AN = ( c ) + ( c)-1 6 Dx (16)

Thus may be obtained directly from the linewidth of the isotropic Raman spectrum (defined in Eq. (13)). Note that has units of cm-1, and c = 3 x 1010 cm.sec-1. The rotational diffusion coefficient may then be found: Dx = 1/6 ( c) (AN - ISO) (17) Measurements of the Raman lineshape for parallel and perpendicular polarizations, allows the determination of both , the vibrational relaxation time, and Dx, the ring-tumbling diffusion coefficient. It is important to remember that the parallel and perpendicular spectra must be combined, according to Eq. (13), to obtain . The perpendicular spectrum alone gives the sum of -1 and 6Dx.
EXPERIMENT 3. RESONANCE RAMAN SPECTROSCOPY
In Resonance Raman Spectroscopy, the frequency of the exciting laser radiation approaches resonance with an allowed electronic transition in the molecule, leading to a new type of spectroscopy. The cross-section for light scattering is dramatically enhanced, as the scattering process ‘borrows’ intensity from the absorption; the intensity of some Raman-active vibrations can increase by a factor of 102-104.
Resonance Raman spectroscopy is now applied widely in many areas of chemistry. For example, metalloporphyrins, carotenoids and several other classes of biologically important molecules have strongly allowed electronic transitions in the visible region. The spectrum of the chromophore is resonance enhanced and that of the surrounding protein matrix is not. This allows the probing of the chromophore (often the active site) without spectral interference from the surrounding protein. Resonance Raman spectroscopy is also a major probe of the chemistry of fullerenes, polydiacetylenes and other molecules which strongly absorb in the visible region.
The vibrations whose Raman bands are resonance enhanced fall into two or three general
classes. The most common case is Franck-Condon enhancement, in which a component of the normal coordinate of the vibration is in a direction in which the molecule expands during an electronic excitation. The more the molecule expands along this axis when it absorbs light, the larger the enhancement factor. The easily visualized ring breathing (in-plane expansion) modes of porphyrins fall into this class. Vibrations which couple two electronic excited states are also resonance enhanced. This mechanism is called vibronic enhancement. In both cases enhancement factors roughly follow the intensities of the absorption spectrum.
Resonance enhancement does not begin at a sharply defined wavelength. In fact, enhancements of 5 to 10 times are commonly observed if the exciting laser is below the electronic transition of a molecule by a few hundred wavenumbers.
In this lab, you will record the Resonance Raman spectrum of two strongly absorbing
species, a laser dye and of cytochrome c. Cytochrome c proteins can be defined as electron-transfer proteins having one or several heme c groups, bound to the protein by one or, more commonly two, thioether bonds involving sulphydryl groups of cysteine residues. A histidine residue always provides the fifth heme iron ligand. Cytochrome c possesses a wide range of properties and function in a large number of different redox processes. Depicted below is the heme group contained within the cytochrome C and its corresponding UV-Vis Spectrum.

II. Prelab Questions. 1. Explain the fact that anti-Stokes lines are usually considerably weaker than Stokes lines. 2. Guess the normal mode vibrations (symmetry labels) of ZXY3 assuming it is C3v. 3. Why does the scattered light need to pass through a low-pass filter before entering the
spectrograph? 4. After the scattered light is polarized by the polarizer it must pass through a scrambler before
hitting the diffraction grating, why? 5. Why is resonant Raman spectroscopy a useful procedure in the examination of a porphyrin
attached to a protein?

III. Experiment The Raman scattering apparatus at Caltech is shown in Figure 4 below.
Sample Cell
Laser Beam
Monochromator CCD Detector HeNe laser
Figure 4. Raman Scattering apparatus located in the Beckman Institute Laser Center. Laser is located to the left.
Figure 5. Ar ion laser, generating 514 nm light (green), 488 nm (blue) among other lines. This laser emits high levels of radiation. Use safety goggles.

The excitation source is an Argon laser, which produces monochromatic radiation of wavelength = 514 nm or 488 nm (there are a number of other emission lines which can be used for laser output, but internal optics allow selection of a single line). The output of the laser is linearly polarized in the vertical plane. The laser is typically operated at ~500 mW power. The laser beam is then transported to the sample area (in the BI, located on a separate optical table). The laser beam in the current set up is directed upwards into the sample cell.
Figure 6. Close up of scattering region.
The sample, most often a liquid, is contained in a small glass vial. The laser is focused into the capillary. A lens collects light scattered at 90o and focuses it into the entrance slit of a monochromator. For normal collection, the light goes through a low-pass filter and then into the spectrograph. For polarized collections, the light passes through a polarizer and then a scrambler before it hits the low-pass filter. The light then passes through the entrance slit of the spectrograph, where the light is dispersed by a high-resolution diffraction grating. The spectrograph used in this experiment is a SPEX 750M, with a focal length of 0.75 m, a range of 0-15000 Å, and a maximum resolution of 0.01 Å. The diffraction grating within the spectrograph has 1200 grooves/mm. The spectrograph is aligned for wavelength by shining a Hg lamp into the entrance slit and measuring the wavelength of the light leaving, which should match the respective spectral line of the lamp. Shining a laser into the entrance slit and then calibrating both mirrors and the diffraction grating so that the beam hits dead center align the positioning.
to mono-chromator
sample collimating optics
Polarizer Scrambler
CCD Detector Housing
The dispersed light is then detected by a LN/CCD array. The CCD array consists of 1100 x 330 pixels with each pixel 24 x 24 microns. The total image zone of the array is 26.4 x 7.9 mm. Your CCD is back illuminated with a peak QE of about 80% at about 550nm. The CCD is operated at –80oC to minimize dark charge within the array, while keeping the spectral response at a maximum. The CCD is also under vacuum (~10 mtorr) to minimize interference, primarily from water which can condense on the CCD at such low temperatures. Corrections must be made so that the diffraction pattern does not change after traversing the air-vacuum interface. The optimum slit-widths are found empirically. Instrumental Start-Up/Shut-Down Procedure. CAUTION: The operation of the Raman spectrometer will always be supervised by the TA. The spectrometer must not be operated without the presence of the TA. There are several areas for potential hazards: laser light must never be viewed directly, as severe eye damage can result. There is also danger from reflected laser light, so caution must be exercised when operating the laser. Always wear safety goggles and operate the laser at minimum power when not recording a spectrum. Start-Up Step 1. Fill the CCD array detector with liquid N2, detector should be allowed to cool for
~2 hours before operation. Step 2. Turn on Ar laser water coolant system. Step 3. Turn on the laser power supply. Step 4. Turn on the laser, set laser on low current, and adjust the current to ~35 A, the
power should be ~ 500 mW. Wait about 20 minutes for laser stabilization. Step 5. Turn on CCD array heater to maintain a constant CCD temperature. Step 6. Use the HeNe laser to align the laser positioning with the slit into the spectrograph,
making adjustments to optics to optimize. Step 7. Align and focus the laser light into the sample holder, the focal point should be as
close to center as possible. Step 8. Set the slit opening on the spectrograph to a 1 x 1 cm square and the slitwidth to
~100 microns. Step 9. Adjust the center point of the spectrograph for an appropriate scan range. Step 10. Go to computer and scan the sample. Adjust the slitwidth of the spectrograph to
optimize the signal-to-noise with minimal peak broadening. Step 11. Take a Raman spectrum of the sample, adjusting the scan time and number of
scans to give a useable spectrum. Step 12. Repeat steps 9-11 for each sample. Shut Down. Step 1. Turn off CCD array heater.

Step 2. Dial down the laser power and turn off. Step 3. Turn off the laser power supply. Step 4. After 10-15 minutes, turn off the laser coolant system. A. Raman Spectrum of Unknown ZXY3 Once the preparations for recording the spectrum of the unknown samples are complete (this must be done by the TA). Set the analyzing polarizer to pass horizontally polarized light (perpendicular to laser polarization direction). The Stokes spectrum should be scanned from 500 cm-1 to 3100 cm-1 wavenumber shift from the laser. Without altering any conditions, rotate the polarizer 90 to pass horizontal polarizations, and repeat the scan.
B. Lineshape of Benzene 1 Mode A sample of liquid benzene will be provided. The Raman spectrum contains a number of lines. We will be concerned only with the 1 mode, at 3064 cm-1 wavenumber shift. The Raman spectrum in this region should be recorded under high resolution (spectral slit width ca. 1 cm-1) for both parallel and perpendicular configurations of the analyzing polarizer. Note the spectral slit-width used.
C. Resonance Raman Spectrum
The resonant spectrum of two samples will be recorded. The first will be of an aqueous solution of cytochrome C, in which the spectrum will be of the heme porphyrin contained within the protein. A background spectrum of pure water will have to be taken in the same region. The second spectrum will be of a fluorescent red dye. Both scans should be made with the center of the spectrum at ~1200 cm-1. D. Resolution vs. Slit Width
Multiple spectrum of cyclohexane will be taken with varying slit-widths. The spectrum should be taken with the center of the spectrum at ~1200 cm-1.
IV. Analysis and Write-up A. Identification of Unknown ZXY3 1. From the low-resolution spectrum, determine the wavenumber shift and depolarization ratios
of each line (use peak height ratios). Report this data in tabular form. 2. In order to identify the unknown, it is necessary to consider all the stable spatial
configurations of molecule ZXY3 (where Z,X,Y are atoms). All configurations are accounted for by 4 point groups. Find these point groups, and for each point group, determine:
a) The symmetry labels of all the normal modes of vibration. b) The number of Raman active modes. c) The expected depolarization ratios of each Raman-active line. d) The nature of each mode (stretching or bending).

3. By comparison of the observed spectrum with the results of (2) above, determine the molecular point group. What is the structure of ZXY3?
4. Assign each line in the Raman spectrum with the appropriate symmetry labels, and identify the type of motion. Tabulate your results. What is the mode at 3000 cm-1? Refer to tables of bond stretching frequencies.
5. What is the unknown? B. Analysis of Benzene Lineshape 1. Determine the full widths at half maximum (FWHM) of the isotropic and anisotropic line
profiles. In the anisotropic case, simply measure the FWHM of the perpendicular spectrum in units of cm-1. For the isotropic case, the parallel and perpendicular spectra must be combined as in Eq. (13). Obviously the two spectra must be recorded under identical conditions, and corrected for background. The spectra should be divided into a number of finely spaced points, and the isotropic spectrum computed and plotted pointwise. Determine the FWHM. This procedure is somewhat tedious, and is usually automated by an on-line computer.
2. Calculate and Dx, in units of picoseconds and (picosecond)-1, respectively. Compare the values of Dx with literature values. Other measurements of for benzene are sparse, but typical values for other polyatomic molecules are in the range of 1 to 10 picosecond.
C. Analysis of the Resonance Raman Spectrum 1. Compare the spectrum from the cytochrome C solution and pure water to determine which
are truly cytochrome C peaks. The vibrational modes observed are of the heme contained within the protein. The modes are not of any specific group on the heme, but of the heme as a whole. Describe these modes and assign them to their respective peaks. Explain why the background of the spectrum seems to grow as the wavenumber increases.
2. The spectrum of the fluorescent red dye does not seem to contain any peaks. Analyze the chemical structure of the dye and determine if it has any Raman active modes. If so, why were no peaks observed?
D. Resolution vs. Slit-Width Analyze the dependence of the resolution of your spectrum on the slit-width of the entrance to the monochromator graphically. There will be mulitple peaks to choose from, so choose a method to include as much of the data as possible. Fit the curve appropriately and determine the optimal slit-width.