ch 7 water and land use
TRANSCRIPT

8/3/2019 Ch 7 Water and Land Use
http://slidepdf.com/reader/full/ch-7-water-and-land-use 1/54
Water & Land Use

8/3/2019 Ch 7 Water and Land Use
http://slidepdf.com/reader/full/ch-7-water-and-land-use 2/54
The Hydrologic Cycle

8/3/2019 Ch 7 Water and Land Use
http://slidepdf.com/reader/full/ch-7-water-and-land-use 3/54
8/3/2019 Ch 7 Water and Land Use
http://slidepdf.com/reader/full/ch-7-water-and-land-use 4/54
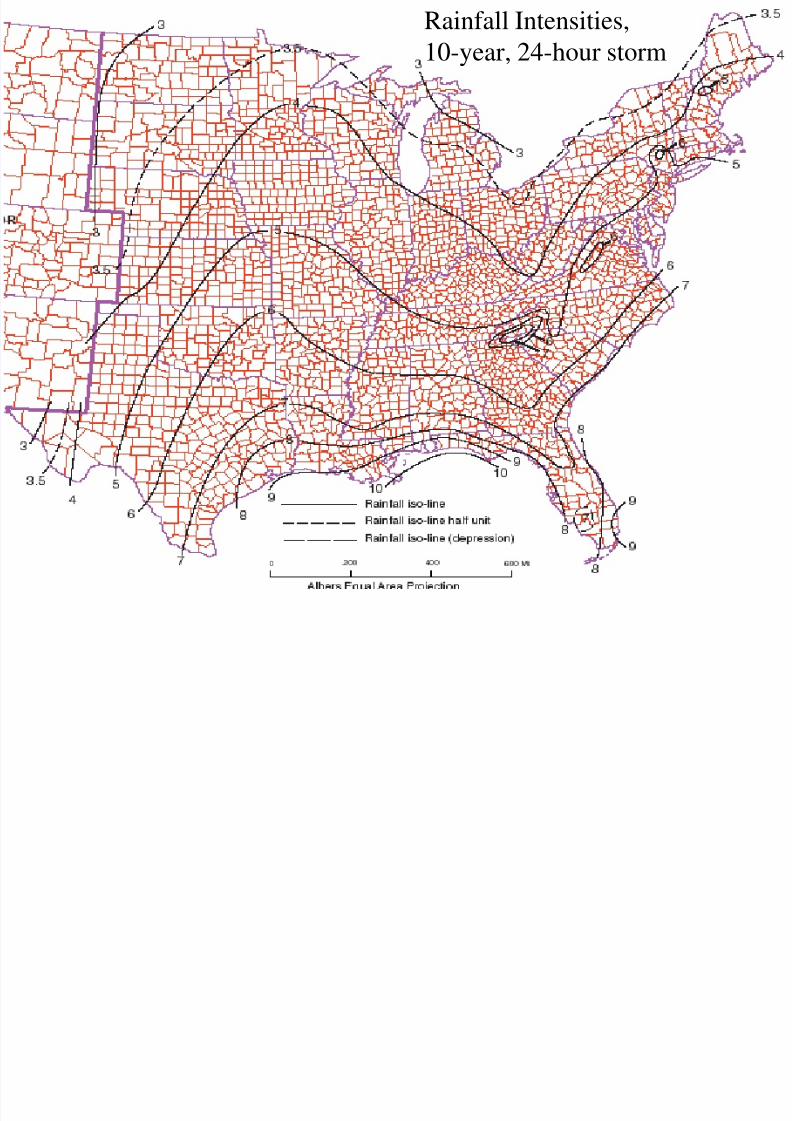
Rainfall Intensities,
10-year, 24-hour storm

8/3/2019 Ch 7 Water and Land Use
http://slidepdf.com/reader/full/ch-7-water-and-land-use 5/54
Intensity-Duration-Frequency Curves for Seattle and Miami,both of which receive about 48 inches of rainfall per year

8/3/2019 Ch 7 Water and Land Use
http://slidepdf.com/reader/full/ch-7-water-and-land-use 6/54
Precipitation rate and infiltration rate determine the runoff rate.
Infiltration rate depends on soil texture, soil moisture, and vegetative cover.
8/3/2019 Ch 7 Water and Land Use
http://slidepdf.com/reader/full/ch-7-water-and-land-use 7/54

8/3/2019 Ch 7 Water and Land Use
http://slidepdf.com/reader/full/ch-7-water-and-land-use 8/54
Stream Order

8/3/2019 Ch 7 Water and Land Use
http://slidepdf.com/reader/full/ch-7-water-and-land-use 9/54
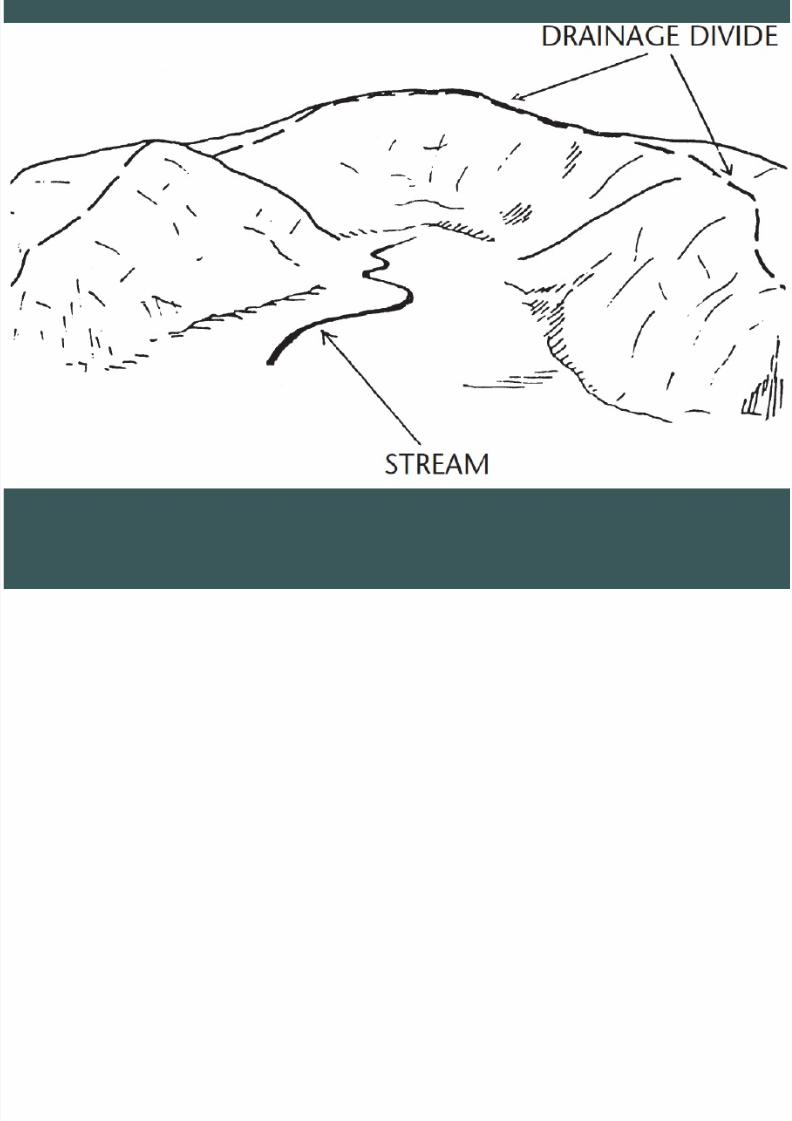
Watershed Characteristics
Boundary or Divide
Watershed area
Basin length: the
distance from thefirst order channelfurthest upstream tothe basin outlet
Drainage density:the length of all thechannels divided bythe basin area
Perennial streamsrun all year long
Intermittent streams
run in wet seasonEphemeral streams run during andimmediately afterstorms

8/3/2019 Ch 7 Water and Land Use
http://slidepdf.com/reader/full/ch-7-water-and-land-use 10/54
Delineating
Watersheds
on topographic
maps:
8 steps

8/3/2019 Ch 7 Water and Land Use
http://slidepdf.com/reader/full/ch-7-water-and-land-use 11/54
Delineating Watershed Boundaries1. Identify the outlet point on a stream or river that defines the watershed
draining to that point.
2. Find and trace drainage channels within the watershed. On color topomap, they are blue lines. “V” shape of elevation contours point upstream.
3. Find and “X” out neighboring channels outside the watershed. Thewatershed boundary will be between the channels in the basin (step 2)and these outside channels.
4. Consider yourself a drop of water and check the direction of drainage byinspecting the slope direction between the “in” and “out” channels.
5. Find and mark the high points (peaks and saddles) between the “in”
and “out” channels. These will be on the watershed boundary.
6. Connect these points with light pencil, intersecting the contour lines atroughly a right angle.
7. Consider yourself a drop of water again and check where you would goif you fell inside or outside the line. Make corrections as necessary.
8. Finalize Map.

8/3/2019 Ch 7 Water and Land Use
http://slidepdf.com/reader/full/ch-7-water-and-land-use 12/54
A
B

8/3/2019 Ch 7 Water and Land Use
http://slidepdf.com/reader/full/ch-7-water-and-land-use 13/54
Delineating watersheds using GIS

8/3/2019 Ch 7 Water and Land Use
http://slidepdf.com/reader/full/ch-7-water-and-land-use 14/54
Stream Meanders
and the Flood Plain

8/3/2019 Ch 7 Water and Land Use
http://slidepdf.com/reader/full/ch-7-water-and-land-use 15/54
Changing centerline of Matapole River, California
over a 30-year period

8/3/2019 Ch 7 Water and Land Use
http://slidepdf.com/reader/full/ch-7-water-and-land-use 16/54
bankfull width
Bankfull and floodplain definitions

8/3/2019 Ch 7 Water and Land Use
http://slidepdf.com/reader/full/ch-7-water-and-land-use 17/54
The Hydrograph
(cubic feetper second)

8/3/2019 Ch 7 Water and Land Use
http://slidepdf.com/reader/full/ch-7-water-and-land-use 18/54
Urbanization,
Impervious
Surface, and
the WaterBalance

8/3/2019 Ch 7 Water and Land Use
http://slidepdf.com/reader/full/ch-7-water-and-land-use 19/54
Change in Hydrograph due to Urbanization
Peak Flow up, Base Flow down

8/3/2019 Ch 7 Water and Land Use
http://slidepdf.com/reader/full/ch-7-water-and-land-use 20/54

8/3/2019 Ch 7 Water and Land Use
http://slidepdf.com/reader/full/ch-7-water-and-land-use 21/54

8/3/2019 Ch 7 Water and Land Use
http://slidepdf.com/reader/full/ch-7-water-and-land-use 22/54
Quantifying change in stream flow due to
land use change
Many methods and modelsRational method and TR-55 in book
We will apply Win TR-55 in assignment and WS next week

8/3/2019 Ch 7 Water and Land Use
http://slidepdf.com/reader/full/ch-7-water-and-land-use 23/54
http://www.wsi.nrcs.usda.gov/products/W2Q/H&H/tools_models/wintr55.html

8/3/2019 Ch 7 Water and Land Use
http://slidepdf.com/reader/full/ch-7-water-and-land-use 24/54
Relationship of % Impervious Surface of Watershed
to Stream Quality

8/3/2019 Ch 7 Water and Land Use
http://slidepdf.com/reader/full/ch-7-water-and-land-use 25/54
Schueler, Fraley-McNeal, Cappiella, 2009
Schueler’s original Impervious Cover Model put another way

8/3/2019 Ch 7 Water and Land Use
http://slidepdf.com/reader/full/ch-7-water-and-land-use 26/54
Reformulated Impervious Cover Model (ICM)
Schueler, Fraley-McNeal, Cappiella, 2009

8/3/2019 Ch 7 Water and Land Use
http://slidepdf.com/reader/full/ch-7-water-and-land-use 27/54
Not just peak and base water flows that
impair streams….it’s water quality, too.Clean Water Act
Pollutants and effects
Water Quality Standards
Impairment of waters
Runoff and non-point sources (NPS)
Best Management Practices (BMPs), SMP, IMPs
Low Impact Development

8/3/2019 Ch 7 Water and Land Use
http://slidepdf.com/reader/full/ch-7-water-and-land-use 28/54
37 Years of the Clean Water ActGoal: ―Fishable & swimable waters‖
Elimination of pollutant discharges
There has been significant improvement in the quality of natural waters from reduction of organic and sediment
discharges
BUT…
Continued impairment of waters
Problem shift from easy clean up of conventional pollution from
discharge pipes to harder clean up of runoff pollution and toxics
Have to move from technology-based effluent permits to TMDLs

8/3/2019 Ch 7 Water and Land Use
http://slidepdf.com/reader/full/ch-7-water-and-land-use 29/54
Water Pollutants, Sources, Effects
8/3/2019 Ch 7 Water and Land Use
http://slidepdf.com/reader/full/ch-7-water-and-land-use 30/54

8/3/2019 Ch 7 Water and Land Use
http://slidepdf.com/reader/full/ch-7-water-and-land-use 31/54
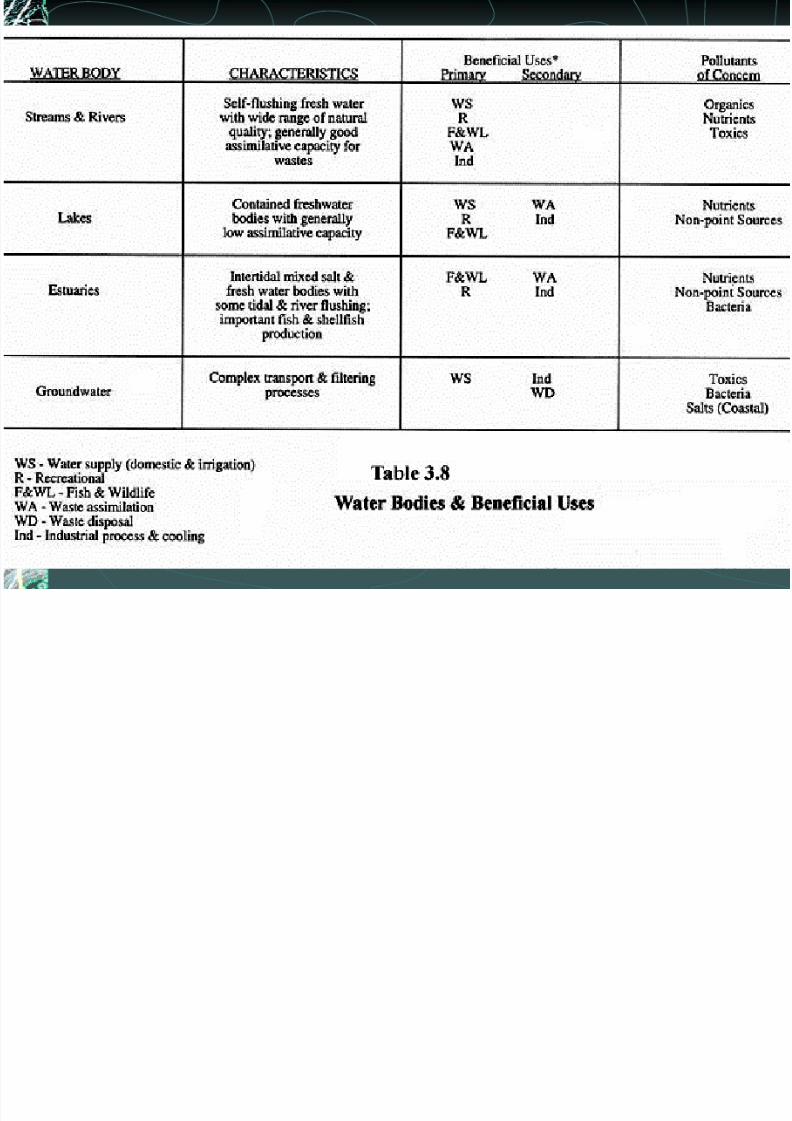
Water Quality Standards:Step 1: assign beneficial uses to each water body/segment

8/3/2019 Ch 7 Water and Land Use
http://slidepdf.com/reader/full/ch-7-water-and-land-use 32/54
WQS:Step 2: Establish standards for each beneficial use

8/3/2019 Ch 7 Water and Land Use
http://slidepdf.com/reader/full/ch-7-water-and-land-use 33/54
States monitor their waters and group assessed
waters into the following categories:
1. Attaining WQS
a. Good/Fully Supporting: meets WQS
b. Good/Threatened: meets WQS but may degrade in near future
2. Impaired, Not Attaining WQS
a. Fair/Partially Supporting: meets WQS most of the time but
occasionally exceed them
b. Poor/Not Supporting: does not meet WQS
3. WQS not attainable
a. Use-attainability analysis shows that one or more designated uses
is not attainable because of specific conditions.

8/3/2019 Ch 7 Water and Land Use
http://slidepdf.com/reader/full/ch-7-water-and-land-use 34/54
Impairment of Streams by Watershed
Impaired waters by watershed, 1998
Q lit f N ti ’ W t 2004

8/3/2019 Ch 7 Water and Land Use
http://slidepdf.com/reader/full/ch-7-water-and-land-use 35/54
Quality of Nation’s Waters, 2004

8/3/2019 Ch 7 Water and Land Use
http://slidepdf.com/reader/full/ch-7-water-and-land-use 36/54
2004
Rivers & Streams
1998: 35% impaired2004: 44% impaired
8/3/2019 Ch 7 Water and Land Use
http://slidepdf.com/reader/full/ch-7-water-and-land-use 37/54
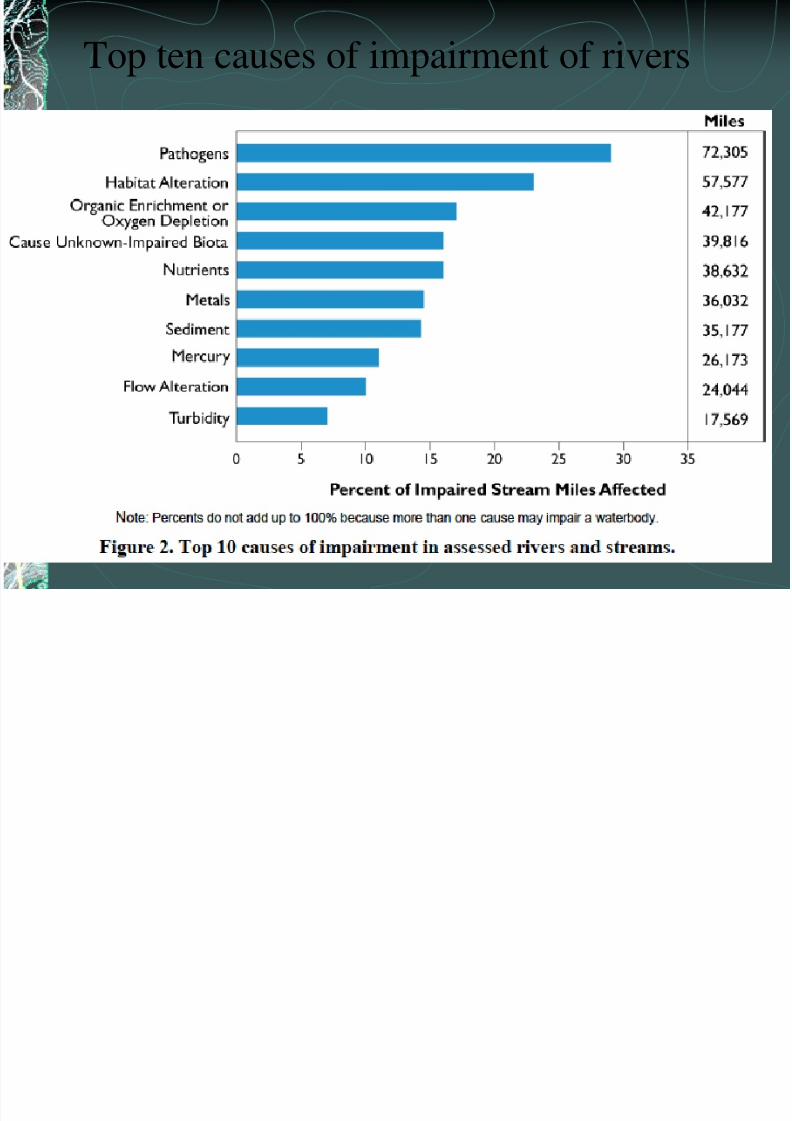
Top ten causes of impairment of rivers

8/3/2019 Ch 7 Water and Land Use
http://slidepdf.com/reader/full/ch-7-water-and-land-use 38/54
Top ten sources of impairment of rivers
2004 Lakes

8/3/2019 Ch 7 Water and Land Use
http://slidepdf.com/reader/full/ch-7-water-and-land-use 39/54
2004 Lakes1998: 22% impaired
2004: 64% impaired

8/3/2019 Ch 7 Water and Land Use
http://slidepdf.com/reader/full/ch-7-water-and-land-use 40/54
Biggest problem now Nonpoint Sources

8/3/2019 Ch 7 Water and Land Use
http://slidepdf.com/reader/full/ch-7-water-and-land-use 41/54

8/3/2019 Ch 7 Water and Land Use
http://slidepdf.com/reader/full/ch-7-water-and-land-use 42/54
2008

8/3/2019 Ch 7 Water and Land Use
http://slidepdf.com/reader/full/ch-7-water-and-land-use 43/54

8/3/2019 Ch 7 Water and Land Use
http://slidepdf.com/reader/full/ch-7-water-and-land-use 44/54

8/3/2019 Ch 7 Water and Land Use
http://slidepdf.com/reader/full/ch-7-water-and-land-use 45/54
Fairfax County Impaired 2004, 2006

8/3/2019 Ch 7 Water and Land Use
http://slidepdf.com/reader/full/ch-7-water-and-land-use 46/54
Fairfax County Impaired 2006, 2008

8/3/2019 Ch 7 Water and Land Use
http://slidepdf.com/reader/full/ch-7-water-and-land-use 47/54
And this despite significant efforts to improveStream Protection Strategy
Stormwater regulations for new development
MS4 program, 10 TMDL plans, extended RPAs
Watershed Management Program: 25-year priorities for improvement
8/3/2019 Ch 7 Water and Land Use
http://slidepdf.com/reader/full/ch-7-water-and-land-use 48/54
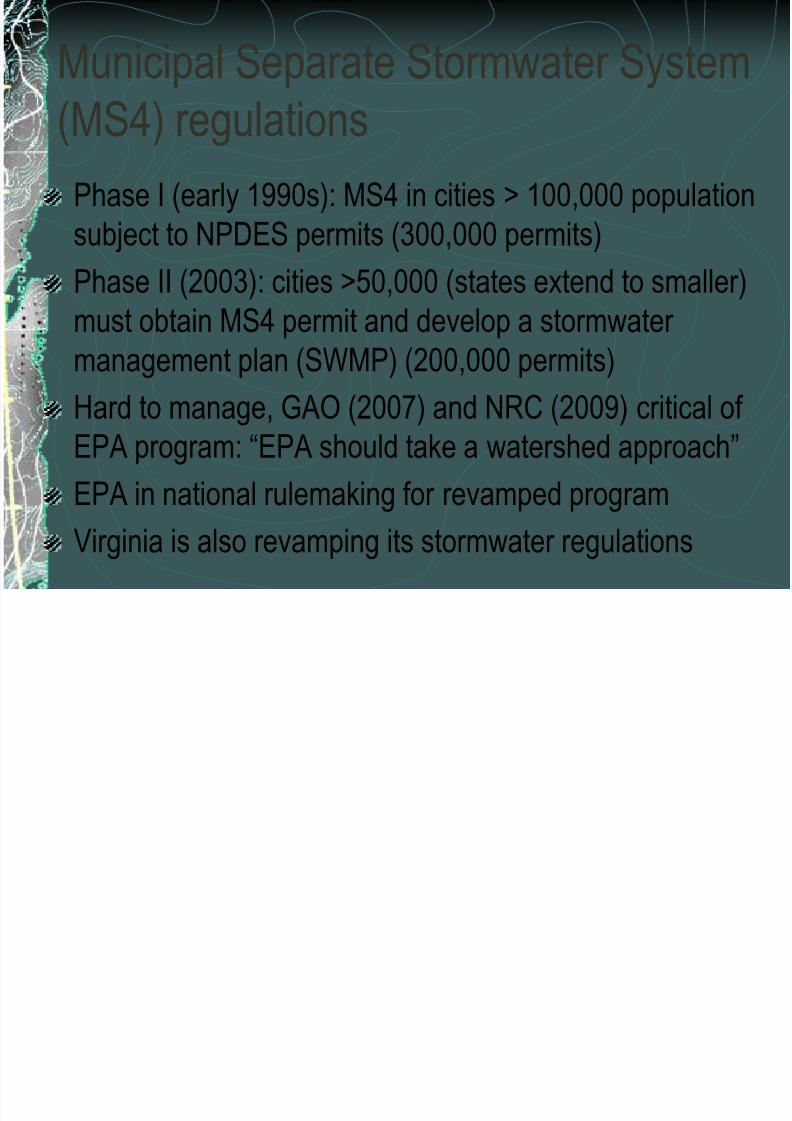
Municipal Separate Stormwater System
(MS4) regulationsPhase I (early 1990s): MS4 in cities > 100,000 population
subject to NPDES permits (300,000 permits)
Phase II (2003): cities >50,000 (states extend to smaller)must obtain MS4 permit and develop a stormwater
management plan (SWMP) (200,000 permits)
Hard to manage, GAO (2007) and NRC (2009) critical of EPA program: ―EPA should take a watershed approach‖
EPA in national rulemaking for revamped program
Virginia is also revamping its stormwater regulations

8/3/2019 Ch 7 Water and Land Use
http://slidepdf.com/reader/full/ch-7-water-and-land-use 49/54
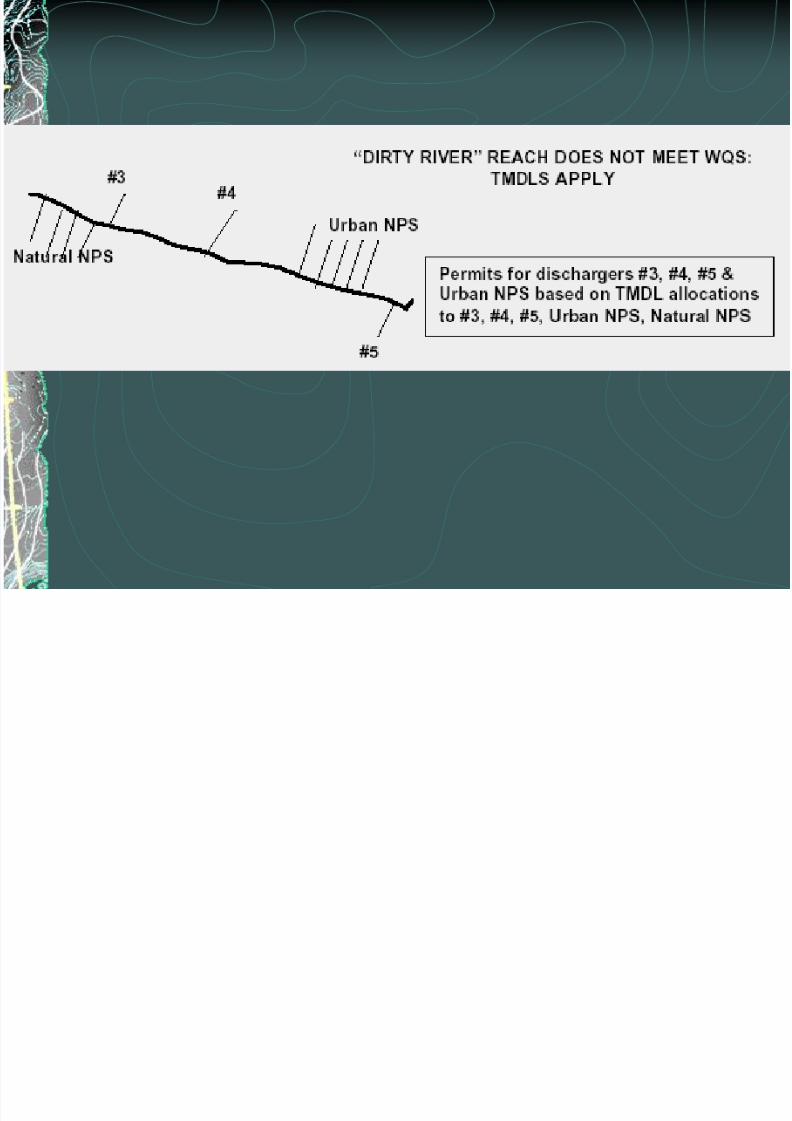
Total Maximum Daily Load (TMDL)
approach for impaired watersDetermining the TMDL to achieve WQS – this often
requires sophisticated monitoring data and modeling of
discharges, receiving waters, and, for NPS, watersheds.
Allocating TMDL to sources— this requires factoring in
equity and economic considerations.
Basing permits of regulated sources on TMDL allocations
Managing unregulated sources to achieve TMDLallocations

8/3/2019 Ch 7 Water and Land Use
http://slidepdf.com/reader/full/ch-7-water-and-land-use 50/54
8/3/2019 Ch 7 Water and Land Use
http://slidepdf.com/reader/full/ch-7-water-and-land-use 51/54

8/3/2019 Ch 7 Water and Land Use
http://slidepdf.com/reader/full/ch-7-water-and-land-use 52/54

8/3/2019 Ch 7 Water and Land Use
http://slidepdf.com/reader/full/ch-7-water-and-land-use 53/54
Water Quality Trading
Use within TMDL plan to achieve WQS at lower cost
Takes a watershed approach to permitting
Coordinates point and non-point source controlsProvides compensation to farmers to control
their runoff pollution
Water Quality Trading

8/3/2019 Ch 7 Water and Land Use
http://slidepdf.com/reader/full/ch-7-water-and-land-use 54/54
Water Quality Trading
Pollutant Suitability: compares
type/form of the pollutant and the timing
and alignment of the discharge within the
watershed, the supply and demand of
pollutant reduction credits, uncertainty of
non-point source controls, and the relative
water quality equivalence of each
discharger’s pollutant reduction. Financial attractiveness based on
relative incremental cost of control and
WQ equivalence.
Market infrastructure to assure
compliance with WQS and executing andmonitoring trades.
Stakeholder readiness and
engagement.