cfrp repair of impact-damaged bridge … reports... · infrared thermography is a non-contact...
TRANSCRIPT

Structures Research Report No. 879 January 2005 Final Project Report UF Project No. 4504-879-12 Contract No. BC-354 RPWO #55
CFRP REPAIR OF IMPACT-DAMAGED
BRIDGE GIRDERS VOLUME II - INSPECTION OF FRP COMPOSITE REPAIRS USING INFRARED THERMOGRAPHY
Principal Investigator: H. R. (Trey) Hamilton, P.E., Ph.D.
Graduate Research Assistant: Jeff R. Brown
Project Manager: Marcus Ansley, P.E.
Department of Civil & Coastal Engineering College of Engineering University of Florida Gainesville, Florida 32611 Engineering and Industrial Experiment Station
E n g i n e e r i n gC i v i l & C o a s t a l

2
Technical Report Documentation Page 1. Report No.
2. Government Accession No. 3. Recipient's Catalog No.
BC354 RPWO #55
4. Title and Subtitle 5. Report Date
January 2005 6. Performing Organization Code
CFRP Repair of Impact-Damaged Bridge Girders Volume II - Inspection of FRP Composite Repairs Using Infrared Thermography
8. Performing Organization Report No. 7. Author(s) J. R. Brown and H. R. Hamilton III
4910 45 04 879
9. Performing Organization Name and Address 10. Work Unit No. (TRAIS)
11. Contract or Grant No.
BC354 RPWO #55
University of Florida Department of Civil & Coastal Engineering P.O. Box 116580 Gainesville, FL 32611-6580
13. Type of Report and Period Covered
12. Sponsoring Agency Name and Address Final Report
14. Sponsoring Agency Code
Florida Department of Transportation Research Management Center 605 Suwannee Street, MS 30 Tallahassee, FL 32301-8064
15. Supplementary Notes
16. Abstract
This report presents IR thermography results from a series of laboratory experiments conducted on full-scale AASHTO concrete bridge girders. Vehicle impact damage was simulated in each girder by cutting four prestressing tendons at midspan. An FRP strengthening system was then applied to restore each girder’s flexural capacity. IR inspections were conducted after each system was installed and also during load testing to evaluate the bond between the FRP and concrete.
Results from the laboratory experiments indicate that IR thermography is a potentially powerful tool for evaluating bond in FRP strengthening systems. Two important findings were that the type of FRP system and the installation procedure used significantly influences IR thermography results. Single-layer carbon fiber systems seem very well suited to the technique; however, the ability the identify defects decreases with FRP system thickness.
This report also includes IR inspection results for in-service bridge girders that had sustained impact damage and were repaired with FRP composites.
17. Key Words 18. Distribution Statement
Infrared Thermography, Non-Destructive Evaluation, FRP Bond No restrictions. This document is available to the public through the National Technical Information Service, Springfield, VA, 22161
19. Security Classif. (of this report) 20. Security Classif. (of this page) 21. No. of Pages 22. Price
Unclassified Unclassified 35 Form DOT F 1700.7 (8-72)
Reproduction of completed page authorized
3
Table of Contents Executive Summary ........................................................................................................................ 4 Acknowledgements and Disclaimer ............................................................................................... 5 Introduction..................................................................................................................................... 6 Research Significance..................................................................................................................... 6 Background and Previous Research................................................................................................ 6 Description of AASHTO Girders and FRP Systems ...................................................................... 7 Infrared Inspection Procedures ..................................................................................................... 10 Initial IR Inspections..................................................................................................................... 11 IR Inspections Performed During Load Testing........................................................................... 15 IR Inspections Performed after Load Testing............................................................................... 15 Summary of IR Inspection Results for Each FRP System............................................................ 19 Field Inspection – I-10 Overpass strengthened with FRP ............................................................ 20 Implementation ............................................................................................................................. 24 Summary and Conclusions ........................................................................................................... 34 References..................................................................................................................................... 35 List of Figures ................................................................................................................................. 4 List of Tables .................................................................................................................................. 4

4
List of Figures
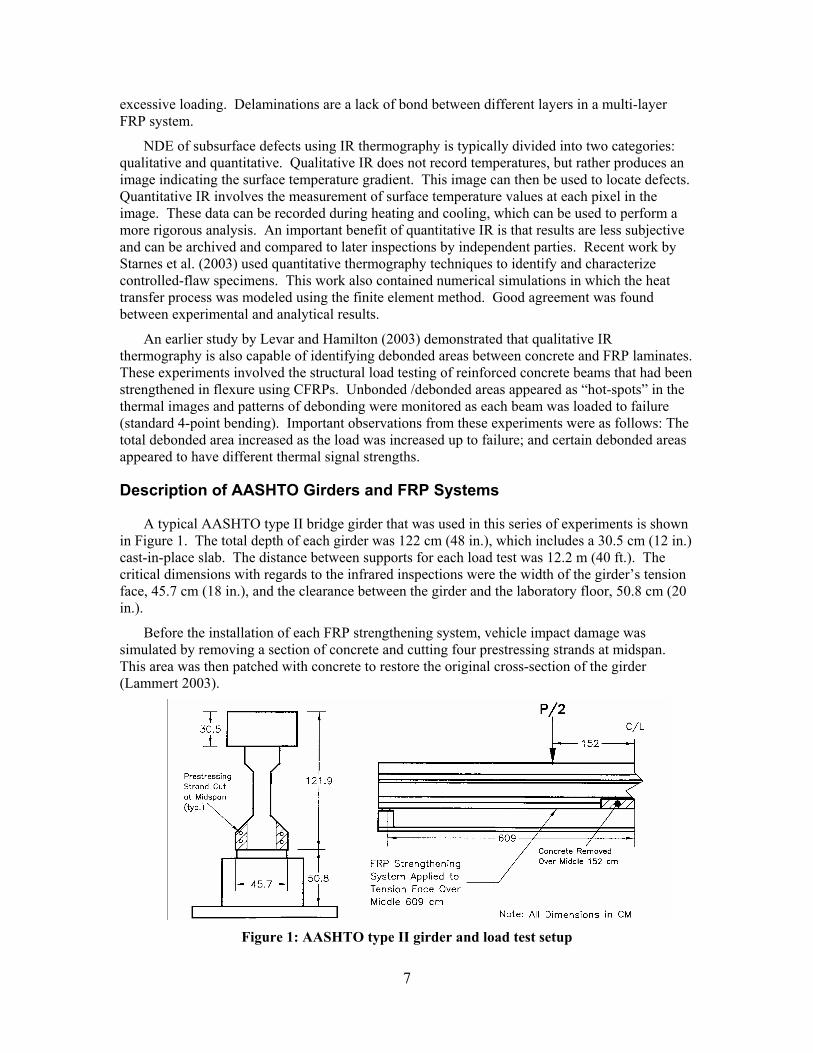
Figure 1: AASHTO type II girder and load test setup ........................................................ 7
Figure 2: Cross-Section of FRP system applied to girder 3 and girder 4 ........................... 9
Figure 3: Scanning cart configurations and typical series of thermal images .................. 11
Figure 4: Subsurface defect found on girder 3.................................................................. 12
Figure 5: Subsurface defects found on girder 3 ................................................................ 12
Figure 6: Non-uniform surface heating of girder 4........................................................... 13
Figure 7: Thermal images from girder 5 and girder 6 ...................................................... 13
Figure 8: ∆Tbackground vs. time for Girder 3 and Girder 6 .................................................. 15
Figure 9: Girder failure modes.......................................................................................... 16
Figure 10: Tdefect vs. time for known debonded area (girder 3) ........................................ 17
Figure 11: Slippage at anchor in girder 6.......................................................................... 18
Figure 12: IR inspection of test patch on girder 6 ............................................................ 19
Figure 13: Polyurethane matrix shown after debonding from concrete (girder 4) .......... 20
Figure 14: Original vehicle impact damage that prompted strengthening with FRP ....... 21
Figure 15: Vehicle impact damage after strengthening with FRP.................................... 21
Figure 16: Thermal image of FRP system affected by vehicle impact (side)................... 22
Figure 17: Thermal image of FRP system affected by vehicle impact (tension face)...... 22
Figure 18: Interior face of west girder .............................................................................. 23
Figure 19: East girder just before new FRP system was applied...................................... 24
List of Tables
Table 1: FRP System Properties ......................................................................................... 8
Table 2: Summary of Scanning Speed and Uniformity of Heating .................................. 14
Table 3: Summary of inspections performed during load tests ........................................ 15

5
Executive Summary
This report presents IR thermography results from a series of laboratory experiments conducted on full-scale AASHTO concrete bridge girders. Vehicle impact damage was simulated in each girder by cutting four prestressing tendons at midspan. An FRP strengthening system was then applied to restore each girder’s flexural capacity. IR inspections were conducted after each system was installed and also during load testing to evaluate the bond between the FRP and concrete.
Results from the laboratory experiments indicate that IR thermography is a potentially powerful tool for evaluating bond in FRP strengthening systems. Two important findings were that the type of FRP system and the installation procedure used significantly influences IR thermography results. Single-layer carbon fiber systems seem very well suited to the technique; however, the ability the identify defects decreases with FRP system thickness.
This report also includes IR inspection results for in-service bridge girders that had sustained impact damage and were repaired with FRP composites.
Acknowledgements and Disclaimer
The authors would like to thank Florida Department of Transportation for their support of this research and the National Science Foundation for the support provided by a Graduate Research Fellowship. In particular, we would like to thank Mr. Marc Ansley and Mr. Tom Beitelman of the FDOT Structural Research Center in Tallahassee, Florida. Additional thanks goes to John Fricot of FLIR Systems for his technical assistance with the thermal imaging system. The opinions expressed in this paper are those of the authors and do not necessarily represent those of the sponsors.
6
Introduction
The use of fiber-reinforced polymers (FRPs) to strengthen existing reinforced concrete structures (RC) is expanding rapidly. While the short-term performance and strengthening capabilities of FRP composites have been well documented, techniques for evaluating long-term performance (durability) and quality control during installation are still needed.
An important requirement for FRP systems applied to RC is that the fibers are properly bonded to the concrete substrate. Strengthening in shear and flexure are considered “bond-critical”, therefore it is important to ensure that these systems are installed properly and the bond between the FRP and concrete is maintained throughout the service life of the repair. Most FRP systems applied to RC are installed using a wet-layup method. The amount of concrete surface preparation performed prior to installation, as well as the experience level of the installers, greatly influences the quality of the finished product. Advanced curing procedures commonly employed in the manufacture of FRP components for the aerospace industry (vacuum assisted, elevated temperature) are usually not practical in civil engineering applications. Quality control is a critical issue because of the high degree of variability encountered in the field. The effect of less-than-perfect installations on the short and long-term performance is also an important issue.
Research Significance
A number of researchers have investigated the use of IR thermography to detect defects in FRP strengthening systems (Hamilton and Levar 2003, Starnes et al. 2003). Experiments conducted on small-scale laboratory specimens (usually involving a single layer of FRP composite) have shown IR thermography to be an effective NDE technique. However, the number of studies involving full-scale specimens and in-field inspections are limited. This research will extend the technique to full-scale systems and identify issues that must be addressed before the method is useful in routine field inspections.
Background and Previous Research
Infrared thermography is a non-contact sensing technique that is used to measure the surface temperature of an object. The fundamental concept behind using IR thermography as a non-destructive evaluation technique is that different materials have different thermal conductivity properties. If a constant heat flux is applied to the surface of a defect-free, homogeneous material, then the increase in surface temperature should be uniform. If the material contains defects below the surface, such as air voids, then “hot-spots” will develop since the flow of heat from the surface to the substrate is interrupted.
The general procedure used to evaluate bond between FRP and concrete is as follows:
1. A thermal imaging system is positioned to monitor the surface temperature of the FRP.
2. Heat is applied to the surface using an external heat source.
3. The temperature on the surface is monitored during heating and while the surface is cooling.
There are three main classifications of defects in FRP systems: unbonded areas, debonded areas, and delaminated areas. The term “unbonded” refers to areas of the FRP system that were not properly bonded when the system first cured. Debonded areas are locations in which bond that previously existed between the concrete and FRP is destroyed. This is usually a result of
7
excessive loading. Delaminations are a lack of bond between different layers in a multi-layer FRP system.
NDE of subsurface defects using IR thermography is typically divided into two categories: qualitative and quantitative. Qualitative IR does not record temperatures, but rather produces an image indicating the surface temperature gradient. This image can then be used to locate defects. Quantitative IR involves the measurement of surface temperature values at each pixel in the image. These data can be recorded during heating and cooling, which can be used to perform a more rigorous analysis. An important benefit of quantitative IR is that results are less subjective and can be archived and compared to later inspections by independent parties. Recent work by Starnes et al. (2003) used quantitative thermography techniques to identify and characterize controlled-flaw specimens. This work also contained numerical simulations in which the heat transfer process was modeled using the finite element method. Good agreement was found between experimental and analytical results.
An earlier study by Levar and Hamilton (2003) demonstrated that qualitative IR thermography is also capable of identifying debonded areas between concrete and FRP laminates. These experiments involved the structural load testing of reinforced concrete beams that had been strengthened in flexure using CFRPs. Unbonded /debonded areas appeared as “hot-spots” in the thermal images and patterns of debonding were monitored as each beam was loaded to failure (standard 4-point bending). Important observations from these experiments were as follows: The total debonded area increased as the load was increased up to failure; and certain debonded areas appeared to have different thermal signal strengths.
Description of AASHTO Girders and FRP Systems
A typical AASHTO type II bridge girder that was used in this series of experiments is shown in Figure 1. The total depth of each girder was 122 cm (48 in.), which includes a 30.5 cm (12 in.) cast-in-place slab. The distance between supports for each load test was 12.2 m (40 ft.). The critical dimensions with regards to the infrared inspections were the width of the girder’s tension face, 45.7 cm (18 in.), and the clearance between the girder and the laboratory floor, 50.8 cm (20 in.).
Before the installation of each FRP strengthening system, vehicle impact damage was simulated by removing a section of concrete and cutting four prestressing strands at midspan. This area was then patched with concrete to restore the original cross-section of the girder (Lammert 2003).
Figure 1: AASHTO type II girder and load test setup

8
Four different FRP strengthening systems were evaluated in this study (applied to girder 3, 4, 5, and 6). The properties of each system are provided in Table 1. Each FRP system was independently designed by the system manufacturer to restore the flexural capacity provided by the cut strands. The FRP system manufacturers also installed each system. During installation, each girder was raised to a height of 122 cm (48 in.) above the laboratory floor. This provided a challenge for the FRP installers by limiting access to the girder’s tension face.
Table 1: FRP System Properties
1.1.1 FRP System Girder Fiber Matrix Layers
Thickness (mm)*
Width of Laminate
(cm) Anchorage
3 Carbon Epoxy 4 4 / 7 40.6 None
4 Carbon Polyurethane 4 3.1 / 6 30.5 2-ply carbon
5 E-Glass Polyester Resin 1 12.7 / 3.5 – 9.8 45.7 12.7 mm
6 Carbon Epoxy 3 1.75 / 4.34 45.7 2-ply carbon * Data Sheet thickness / As-Built thickness NA = not available
1.1.2 Girder 3
The FRP system applied to girder 3 consisted of four layers of unidirectional carbon fiber fabric (with aramid cross-fiber) and an epoxy matrix. Each layer extended over the entire middle 6.1 m (20 ft) of the girder. A tack-coat (epoxy thickened with silica fume) was first applied to the concrete surface followed by the first layer of saturated carbon fiber fabric. During installation, there was a tendency for the saturated carbon sheets to fall from the tension face. This prompted the installers to apply an additional coat of thickened epoxy between each layer of fabric. The final step was the application of an epoxy gel coat to the surface of the system. The thick layer of gel coat combined with the overhead application resulted in drips forming before the matrix cured. These thickened areas affected the infrared inspections. There were also areas where the gel coat was thin, but no exposed unsaturated fibers were observed. Acoustic sounding (coin tap) indicated that the system was well bonded to the concrete substrate and there were no visible abnormalities that would indicate the presence of debonded areas.
The material data sheet (MDS) for this FRP system indicated a 1mm (.04 in.) ply thickness resulting in a total laminate thickness of 4 mm (.16 in.). In order to verify this thickness, a small area of the strengthening system and concrete substrate (2 cm x 7 cm x 1.5 cm thick) was removed from the girder after load testing. The total thickness of the laminate varied between 6 mm and 7 mm (62.5% thicker than the MDS thickness). A 2 mm layer of thickened epoxy was observed between the second and third layers of carbon fiber (see Figure 2(a)).
1.1.3 Girder 4
The FRP system applied to girder 4 consisted of multiple layers of unidirectional carbon fiber fabric that was pre-impregnated with a water-activated polyurethane matrix. Four layers of

9
carbon fiber were applied to the middle 4.9 m (16 ft) of the girder; three layers extended over the middle 7.3 m (24 ft); 2 layers extended over the middle 9.75 m (32 ft); and a single layer was applied over the entire length of 12.2 m (40 ft). A polyurethane tack-coat was first applied to the concrete followed by the two longest layers of the pre-impregnated fabric. These layers were then sprayed with water to initiate curing. Finally, the two remaining layers were applied and sprayed with water. Two FRP stirrups (each was 2 plies oriented at 0 and 90 degrees) located at 12 feet on either side of midspan served as anchorage for the previously placed longitudinal layers.
A coin tap inspection of the installed system did not reveal any debonded areas. The MDS thickness for this system was 0.78 mm (.03 in.) per layer, which resulted in a total theoretical thickness at midspan of 3.1 mm (.12 in.). The measured thickness of the 4-ply laminate varied between 5 and 7 mm (see Figure 2(b)).
(a) (b)
Figure 2: Cross-Section of FRP system applied to girder 3 (a) and girder 4 (b)
1.1.4 Girder 5
The FRP system applied to girder 5 was a sprayed-on mixture of chopped E-glass fibers and polyester resin. This process requires highly specialized equipment and is commonly employed in the fabrication of boat hulls. The application method worked extremely well on vertical surfaces (sides of the beam). It was, however, difficult to apply material to the bottom of the girder. After a thin layer of glass and resin were applied with the spray gun, the material was pressed with a roller to compact the laminate and fully saturate the fibers. If too much glass and resin were sprayed onto the bottom, large sections tended to fall down. Sometimes this material would separate entirely and hit the floor, and other times it would simply cure as small draped areas. This resulted in a large number of visible surface and subsurface defects in the laminate.
The laminate was extended over the middle 6.1 m (20 ft) of the girder and stirrups were also sprayed onto the sides of the girder where the laminate was terminated. The final measured thickness of the FRP system on the girder’s tension face varied between 3.5 mm and 9.8 mm (.14 in. to .39 in.). Additional material was also sprayed on the sides of the girder’s bulb to an average thickness of 12.7 mm (.5 in.).
Concrete
Carbon Epoxy

10
1.1.5 Girder 6
The FRP system applied to girder 6 consisted of three layers of unidirectional carbon fiber fabric and an epoxy matrix. All layers extended over the middle 6.1 m (20 ft) of the girder. The data sheet indicated 0.58 mm (.013 in) ply thickness resulting in a total laminate thickness of 1.75 mm. Two additional plies of unidirectional fabric were used to anchor the FRP system at the termination points. This resulted in a total laminate thickness of 2.9 mm on the tension face at the termination points. The as-built thickness of this FRP system was not verified.
Little or no excess matrix material was present on the surface of the installed system. A coin tap inspection indicated that the system was well bonded to the concrete substrate and there were no visible abnormalities.
Infrared Inspection Procedures
Thermal images were collected using a FLIR ThermaCAM PM 695 infrared camera. This thermal imaging system operates in the 8 – 12 µm wavelength band of the electromagnetic spectrum. An important feature is the ability to save thermal images digitally. Each pixel in the thermal image (320x240) is stored as a temperature value, which allows for easy post-processing of collected images using proprietary software.
Heat sources used in this study included 125 Watt IR heating lamps and a 500 Watt halogen lamp. Limited access to the tension face of each girder along with the need for efficiency in evaluating the relatively large area prompted the development of two novel scanning procedures. In both procedures, the heat source and IR camera were mounted to a rolling cart. The heat source was positioned on the leading edge of the cart and placed a distance of 7.6 cm (3 in.) from the FRP surface. The camera was positioned to view the FRP surface just behind the area being heated. As the cart was pushed along the floor, the IR camera recorded a series of images as the surface cooled.
The cart configuration for the first procedure is shown in Figure 3(a). This resulted in a camera field of view (FOV) of only 22.9 cm x 17.1 cm (9 in. x 6.75 in.). Consequently, two passes were required to inspect the entire 45.7 cm (18 in.) width of the girder’s tension face. This image was also slightly distorted since the angle of incidence for the camera was not 90°. The cart configuration for the second procedure (shown in Figure 3(b)) utilized first-surface mirrors located near the ground to increase the camera’s FOV to 56.7 cm x 42.5 cm (22.3 in. x 16.7 in).
The image save rate for all inspections was set to two frames per second (0.5 Hz). The fastest image save rate to the on-board PCMCIA storage card is approximately 1 Hz. This rate, however, produces an unmanageable amount of data (each thermal image is 158 Kb). An even faster rate of up to seven frames per second is possible, but this requires a direct link to a laptop computer. For the scanning speed used in these inspections, the rate of 0.5 Hz was found to be adequate. A typical series of thermal images containing a subsurface defect is shown in Figure 3(c). This particular series was recorded using the cart configuration shown in Figure 3(a).

11
(a) (b) (c)
Figure 3: Scanning cart configurations and typical series of thermal images
To characterize defects detected during each inspection, the defect signal strength, ∆Tdefect , was calculated as follows:
backgrounddefectdefect TTT −=∆
where Tdefect is the measured temperature above a subsurface defect and Tbackground is the temperature of the adjacent (defect free) area. The procedure used to determine Tdefect was to identify an appropriately sized area above the brightest portion of the defect and use the average temperature measured within that area. The standard deviation of temperature values within each area was typically less than 0.5 °C. A similar technique was used to determine the corresponding Tbackground.
To make a valid comparison between defect signal strengths, the amount of heat applied to the surface should be consistent during each inspection. Heating consistency for each scan was evaluated by monitoring ∆Tbackground along the leading edge (edge closest to the heat source, as shown in Figure 4) of each thermal image in a series:
ambientbackgroundbackground TTT −=∆
where Tambient is the ambient temperature of the girder prior to heating. This quantity was also monitored along the trailing edge (farthest away from the heat source) of each image in a series in order to evaluate the average cooling rate on the surface of the FRP.
Initial IR Inspections
An initial infrared inspection was performed on each girder prior to load testing. The objective was to identify defects that might have formed during installation. Girder 3 was inspected using the cart configuration shown in Figure 3(a). Girders 4-6 were inspected using the configuration shown in Figure 3(b).
The inspection of girder 3 revealed 11 minor subsurface defects ( < 12.9 cm2 ) and three moderate subsurface defects ( > 12.9 cm2 but less than 161 cm2). Thermal images for two of
t = 0 s
t = 12 s t = 8 s
t = 4 s
Eq (2)
Eq (1)

12
these defects are shown in Figure 5. These images were recorded approximately six seconds after the area was heated.
Figure 4: Subsurface defect found on girder 3
Figure 5: Subsurface defects found on girder 3
The computed signal strength for defect 1 and 2 was 7.5 C and 15.1 C, respectively. The difference in signal strengths could be due to several factors: defect depth, amount of heat applied to the surface, and the size of the defect. Stronger signal strengths are expected for defects that are closer to the surface (signal strength is inversely proportional to defect depth). Applying more heat to the surface will also result in higher signal strengths. Finally, a larger surface area will result in higher defect signal strengths since the heat applied above the defect must travel farther before being absorbed by the concrete.
No defects were detected during the initial inspection of girder 4. There were, however, two interesting observations made regarding the polyurethane matrix material and the uniformity of heating perpendicular to the girder’s length. Some areas of the FRP surface were covered with excess polyurethane matrix, which had the visual appearance of a thin layer of foam. The color of this layer was also much lighter than adjacent areas, which appeared black. An example of this occurrence is shown in Figure 6. The resulting ∆Tbackground for the light colored area was 5.4 C while the ∆Tbackground for the dark color was 7.8 C. Another source of non-uniform heating was
Tambient = 19 °CTbackground = 36.8 °C
Tdefect = 53.1 °C∆Tdefect = 16.3 °C
Size = 23 cm2 (3.6 in.2)leading edge
trailing edge
1.1.1.1 Defect 1 ∆Tdefect = 7.5 C ∆Tbackground = 12.7 C Size = 5.8 cm2 (0.9 in2)
Defect 2∆Tdefect = 15.1 C
∆Tbackground = 14.3 CSize = 34.2 cm2 (5.3 in2)

13
streaking due to the narrow beam width of the IR heat lamps (also shown in Figure 3). The resulting ∆Tbackground for the area directly in-line with the heat lamp 9.7 C while the ∆Tbackground in the area between lamps was 7.7 C.
Figure 6: Non-uniform surface heating of girder 4
Following application of the chopped fiber system, it was noted that layers of saturated fibers had pulled loose from the bottom surface before the resin set. This resulted in an extremely rough surface texture along with a large number of debonded areas just below the surface of the composite. In some cases, the defects were caused by lack of fiber saturation. The presence of such a large number of imperfections made the IR inspection difficult. A typical thermal image is shown in Figure 7(a). All of the defects that were visible in the thermal image were also visible to the naked eye.
Only one subsurface defect was detected during the initial scan of girder 6 (shown in Figure 7(b). The recorded defect signal strength was 7.4 °C and ∆Tbackground was 8.5 °C. This defect occurred on the edge of the laminate and was not considered to be significant.
(a) (b) Figure 7: (a) Thermal images from girder 5 and (b) girder 6
∆Tbackground = 5.4 °C
∆Tbackground = 7.8 °C
∆Tbackground = 7.7 °C
∆Tbackground = 9.7 °C
Size = 3.1 in.21.1.1.2 ∆Tdefect = 7.4
C ∆Tbackground = 8.5 C

14
A summary of the scanning speed for the initial inspection of each girder is presented in Table 2. ∆Tbackground was computed along the leading edge (closest to heat source) and trailing edge (farthest from heat source) of the series of thermal images that were collected as the cart was pushed along the beam. The average speed was computed by dividing the total distance scanned by the total time required. These scanning rates are much slower than those reported by Starnes et al (2003). Their basic procedure for identifying subsurface defects involved passing a single 250 Watt IR heat lamp held a distance of 5 cm (2 in.) from the FRP surface at a speed of approximately 15 cm/s. This approach was adequate to detect defects beneath a 1.3 mm thick pre-cured CFRP laminate. It should be noted, however, that pre-cured laminates tend to have more uniform properties and higher fiber volume fractions than the FRP systems that were investigated in the current study.
For the current series of inspections, the average cooling rate (ACR) on the surface of the FRP was computed as follows:
where FOVSD is the camera’s FOV in the direction of scanning and speed is the average speed. This calculation assumes that the surface temperature cooling profile at every point is linear, which is not necessarily the case. The results are reported in this format, however, for ease of comparison among FRP systems.
The cart speed was controlled by hand, which introduced some variability into the heating rate. Figure 8 shows the resulting ∆Tbackground along the leading and trailing edge of each thermal image vs. position for girder 3 and girder 6. The leading edge curve represents ∆Tbackground measured just after an area enters the thermal image. The trailing edge curve represents ∆Tbackground measured just before the same area leaves the image. The average time between these two curves can be calculated as t` in equation 4. The significant fluctuation observed in each curve demonstrates the sensitivity of ∆Tbackground to cart speed. In areas where the cart was pushed slowly, there was an increase in ∆Tbackground while areas in which the cart was moved more quickly experienced a decrease in ∆Tbackground. The standard deviation of ∆Tbackground along the leading edge for girder 3, 4, 5, and 6 was 1.4, 2.4, 1.5, and 1.9 °C, respectively.
Table 2: Summary of Scanning Speed and Uniformity of Heating
Leading Edge* Trailing Edge
Girder Scan
Config.
Avg. Speed (cm/s)
∆Tbackground (°C)
Std. Dev. (°C)
∆Tbackground (°C)
Std. Dev. (°C)
Avg. Cooling (°C/s)
3 Fig. 3(a) 1.2 13 1.4 9.5 1.1 0.25 4 Fig. 3(b) 2.77 11.3 2.4 6.0 1.8 0.35 5 Fig. 3(b) 1.25 7.2 1.5 4.26 0.98 0.09 6 Fig. 3(b) 2.1 10.4 1.9 1.67 0.88 0.44
*Leading Edge of image is closest to heat source
ACR∆Tbackground leading( ) ∆Tbackground trailing( )−
t'
t'FOVSDSpeed
Eq (3)
Eq (4)

15
(a) Girder 6 (b) Girder 3
Figure 8: ∆Tbackground vs. time for (a)Girder 6 and (b) Girder 3
IR Inspections Performed During Load Testing
Additional IR inspections were performed during the load test of each girder. For girder 3, the load was removed during each inspection. Girders 4-6 were inspected while the specimen was under load. Table 3 contains a summary of the load levels at which each IR inspection was performed. The purpose of these inspections was to monitor the subsurface defects detected in the initial scan as well as to detect the presence of any new debonded areas resulting from the applied load.
None of the additional inspections that were performed prior to failure revealed the presence of new defects or subsurface defect growth due to loading.
Table 3: Summary of inspections performed during load tests
Girder # of
scans
Ambient Temp (°C)
Ultimate Load (kips)
Load level (kips)
Load level (% of ultimate)
3 3 19 244 0, 100, 150 0%, 41%, %61 4 3 24 202 0, 100, 150 0%, 50%, %75
5 5 24 255 0, 40, 80, 140, 160
0%, 16%, 32%, 55%, 63%
6 6 31 288 0, 40, 80, 120 160, 200
0%, 14%, 28%, 42%, 56%, 69%
IR Inspections Performed after Load Testing
After each specimen failed, additional IR inspections were performed on parts of the FRP system that remained attached to each girder. The objective of these inspections was to identify
02468
10121416
0 200 400 600Position (cm)
∆Tba
ckgr
ound
(°C
)
02468
1012141618
0 200 400 600Position (cm)
∆Tba
ckgr
ound
(°C
)
16
debonded areas near the location where the FRP system failed. These inspections were also used to validate the IR inspection procedure by investigating areas on the FRP system that debonded when the girder failed. These areas were easily identified with a coin-tap inspection after failure.
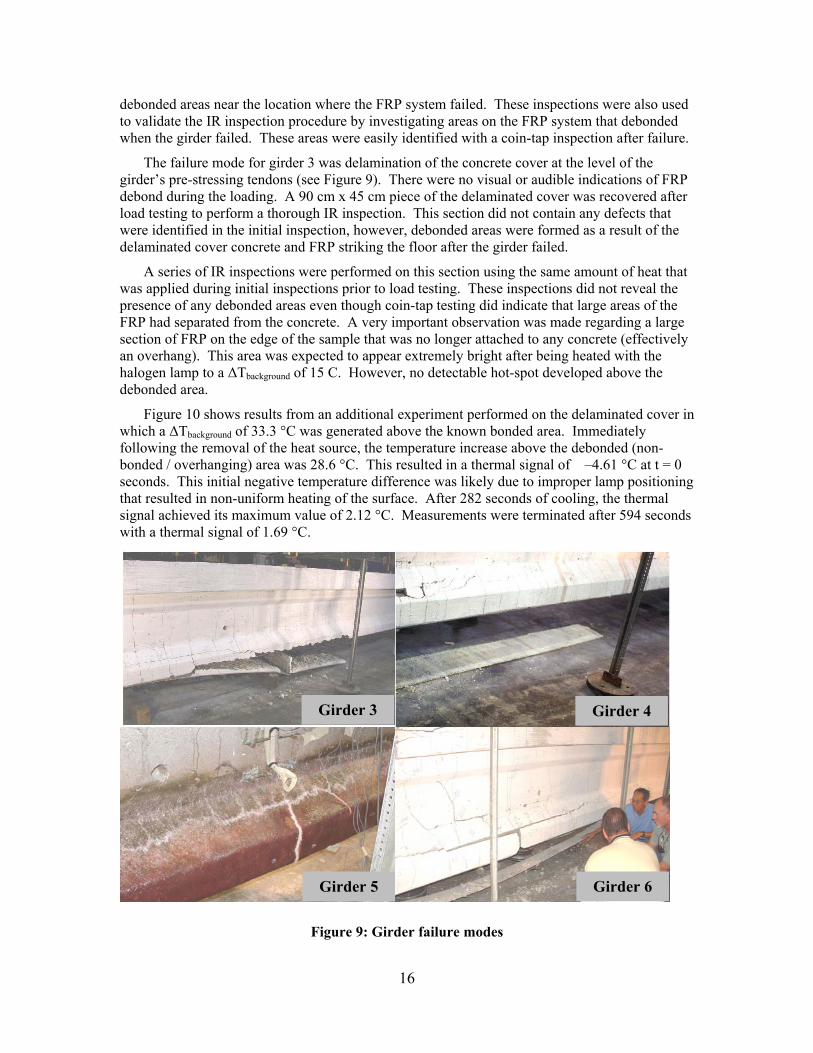
The failure mode for girder 3 was delamination of the concrete cover at the level of the girder’s pre-stressing tendons (see Figure 9). There were no visual or audible indications of FRP debond during the loading. A 90 cm x 45 cm piece of the delaminated cover was recovered after load testing to perform a thorough IR inspection. This section did not contain any defects that were identified in the initial inspection, however, debonded areas were formed as a result of the delaminated cover concrete and FRP striking the floor after the girder failed.
A series of IR inspections were performed on this section using the same amount of heat that was applied during initial inspections prior to load testing. These inspections did not reveal the presence of any debonded areas even though coin-tap testing did indicate that large areas of the FRP had separated from the concrete. A very important observation was made regarding a large section of FRP on the edge of the sample that was no longer attached to any concrete (effectively an overhang). This area was expected to appear extremely bright after being heated with the halogen lamp to a ∆Tbackground of 15 C. However, no detectable hot-spot developed above the debonded area.
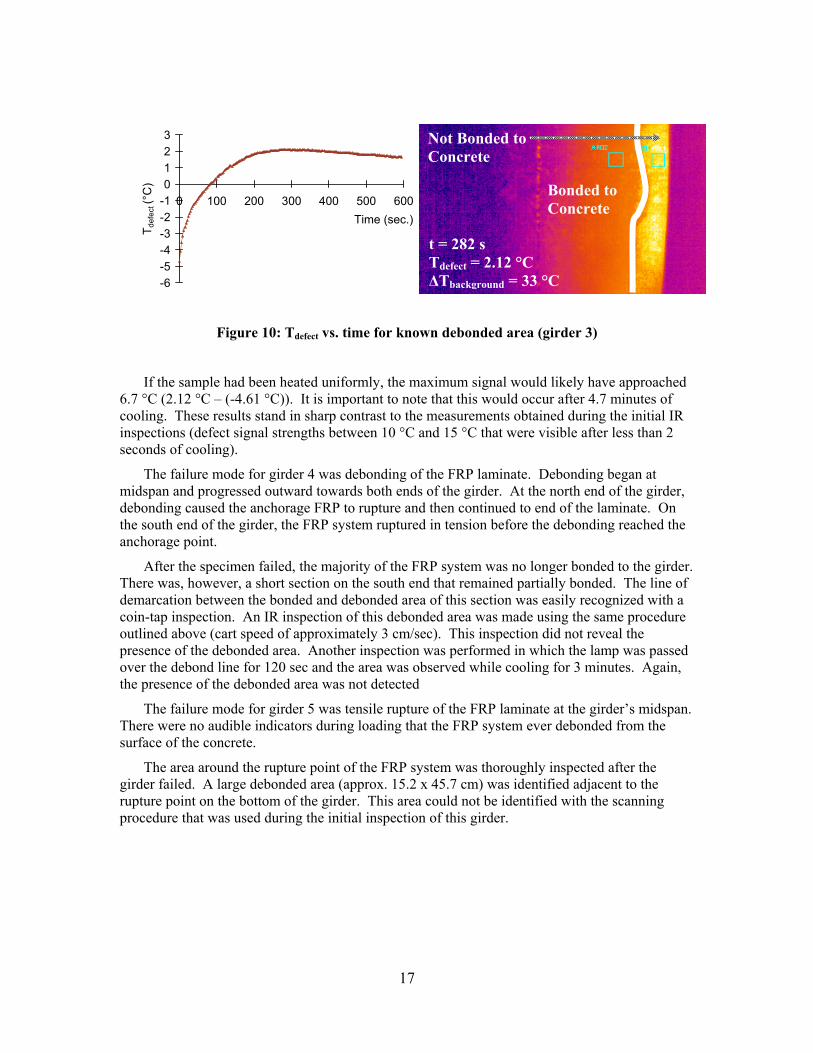
Figure 10 shows results from an additional experiment performed on the delaminated cover in which a ∆Tbackground of 33.3 °C was generated above the known bonded area. Immediately following the removal of the heat source, the temperature increase above the debonded (non-bonded / overhanging) area was 28.6 °C. This resulted in a thermal signal of –4.61 °C at t = 0 seconds. This initial negative temperature difference was likely due to improper lamp positioning that resulted in non-uniform heating of the surface. After 282 seconds of cooling, the thermal signal achieved its maximum value of 2.12 °C. Measurements were terminated after 594 seconds with a thermal signal of 1.69 °C.
Figure 9: Girder failure modes
Girder 3
Girder 5 Girder 6
Girder 4
17
Figure 10: Tdefect vs. time for known debonded area (girder 3)
If the sample had been heated uniformly, the maximum signal would likely have approached 6.7 °C (2.12 °C – (-4.61 °C)). It is important to note that this would occur after 4.7 minutes of cooling. These results stand in sharp contrast to the measurements obtained during the initial IR inspections (defect signal strengths between 10 °C and 15 °C that were visible after less than 2 seconds of cooling).
The failure mode for girder 4 was debonding of the FRP laminate. Debonding began at midspan and progressed outward towards both ends of the girder. At the north end of the girder, debonding caused the anchorage FRP to rupture and then continued to end of the laminate. On the south end of the girder, the FRP system ruptured in tension before the debonding reached the anchorage point.
After the specimen failed, the majority of the FRP system was no longer bonded to the girder. There was, however, a short section on the south end that remained partially bonded. The line of demarcation between the bonded and debonded area of this section was easily recognized with a coin-tap inspection. An IR inspection of this debonded area was made using the same procedure outlined above (cart speed of approximately 3 cm/sec). This inspection did not reveal the presence of the debonded area. Another inspection was performed in which the lamp was passed over the debond line for 120 sec and the area was observed while cooling for 3 minutes. Again, the presence of the debonded area was not detected
The failure mode for girder 5 was tensile rupture of the FRP laminate at the girder’s midspan. There were no audible indicators during loading that the FRP system ever debonded from the surface of the concrete.
The area around the rupture point of the FRP system was thoroughly inspected after the girder failed. A large debonded area (approx. 15.2 x 45.7 cm) was identified adjacent to the rupture point on the bottom of the girder. This area could not be identified with the scanning procedure that was used during the initial inspection of this girder.
-6-5-4-3-2-10123
0 100 200 300 400 500 600Time (sec.)
T def
ect (
°C)
t = 282 s Tdefect = 2.12 °C ∆Tbackground = 33 °C
Bonded to Concrete
Not Bonded to Concrete
18
The failure mode for girder 6 was debonding of the FRP system. This debonding began at midspan and progressed outward towards the anchorage points (very similar to girder 4). Audible indicators of the debonding were also present, however no IR scans were performed between the time they were first heard and failure of the specimen. At the ultimate load, a portion of the FRP slipped at the north anchorage point resulting in failure.
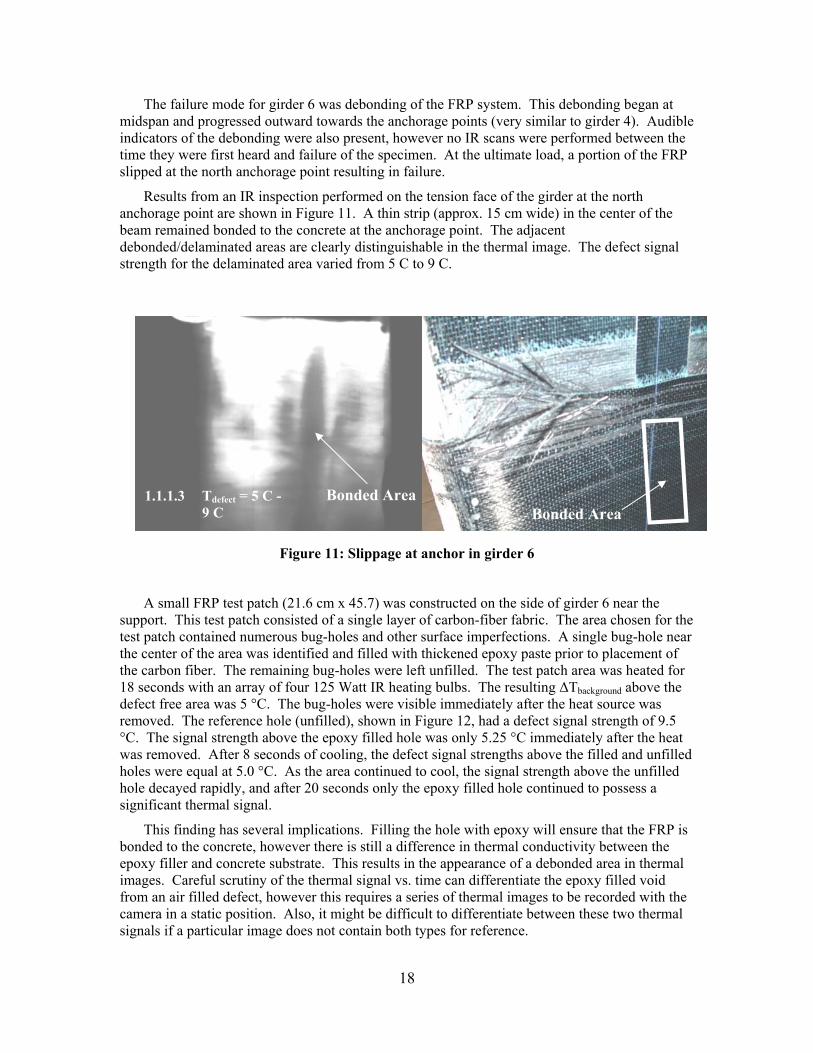
Results from an IR inspection performed on the tension face of the girder at the north anchorage point are shown in Figure 11. A thin strip (approx. 15 cm wide) in the center of the beam remained bonded to the concrete at the anchorage point. The adjacent debonded/delaminated areas are clearly distinguishable in the thermal image. The defect signal strength for the delaminated area varied from 5 C to 9 C.
Figure 11: Slippage at anchor in girder 6
A small FRP test patch (21.6 cm x 45.7) was constructed on the side of girder 6 near the support. This test patch consisted of a single layer of carbon-fiber fabric. The area chosen for the test patch contained numerous bug-holes and other surface imperfections. A single bug-hole near the center of the area was identified and filled with thickened epoxy paste prior to placement of the carbon fiber. The remaining bug-holes were left unfilled. The test patch area was heated for 18 seconds with an array of four 125 Watt IR heating bulbs. The resulting ∆Tbackground above the defect free area was 5 °C. The bug-holes were visible immediately after the heat source was removed. The reference hole (unfilled), shown in Figure 12, had a defect signal strength of 9.5 °C. The signal strength above the epoxy filled hole was only 5.25 °C immediately after the heat was removed. After 8 seconds of cooling, the defect signal strengths above the filled and unfilled holes were equal at 5.0 °C. As the area continued to cool, the signal strength above the unfilled hole decayed rapidly, and after 20 seconds only the epoxy filled hole continued to possess a significant thermal signal.
This finding has several implications. Filling the hole with epoxy will ensure that the FRP is bonded to the concrete, however there is still a difference in thermal conductivity between the epoxy filler and concrete substrate. This results in the appearance of a debonded area in thermal images. Careful scrutiny of the thermal signal vs. time can differentiate the epoxy filled void from an air filled defect, however this requires a series of thermal images to be recorded with the camera in a static position. Also, it might be difficult to differentiate between these two thermal signals if a particular image does not contain both types for reference.
1.1.1.3 Tdefect = 5 C - 9 C Bonded Area
Bonded Area

19
Figure 12: IR inspection of test patch on girder 6
Summary of IR Inspection Results for Each FRP System
The FRP system applied to girder 3 consisted of four layers of unidirectional carbon fiber fabric with an epoxy matrix. Initial IR inspections performed after installation revealed the presence of three subsurface defects having an area greater than 12.9 cm2. Defect signal strengths for these defects were greater than 10 °C and resulted from a ∆Tbackground of approximately 13 °C. These defects were visible immediately after the heat source was removed. Additional IR inspections performed on a section of the FRP system with known debonded areas produced different results. A ∆Tbackground of 33 °C resulted in Tdefect measurements of only 2.1 °C after 282 s of cooling. The defects found during the initial inspection were very close to the surface signifying delaminations rather than debonded areas. The more important finding is that the initial scanning technique would not have detected the presence of debonded areas since the amount of heat applied to the surface was relatively low and the camera was not positioned to record images when the defect’s maximum signal strength was achieved reached.
The FRP system applied to girder 4 consisted of four layers (tapered down to a single layer) of unidirectional carbon fiber fabric pre-impregnated with a polyurethane matrix. No subsurface defects were detected during IR inspections performed after the installation of the FRP system.
t=8 s
Epoxy-filled
Unfilled t=0 s∆Tbackground = 5 C
Epoxy-filled
Unfilled
t=20 s
Epoxy-filled
Unfilled
0
2
4
6
8
10
12
0 10 20 30Time (sec.)
T def
ect (
°C)
Unfilled Epoxy-filled
20
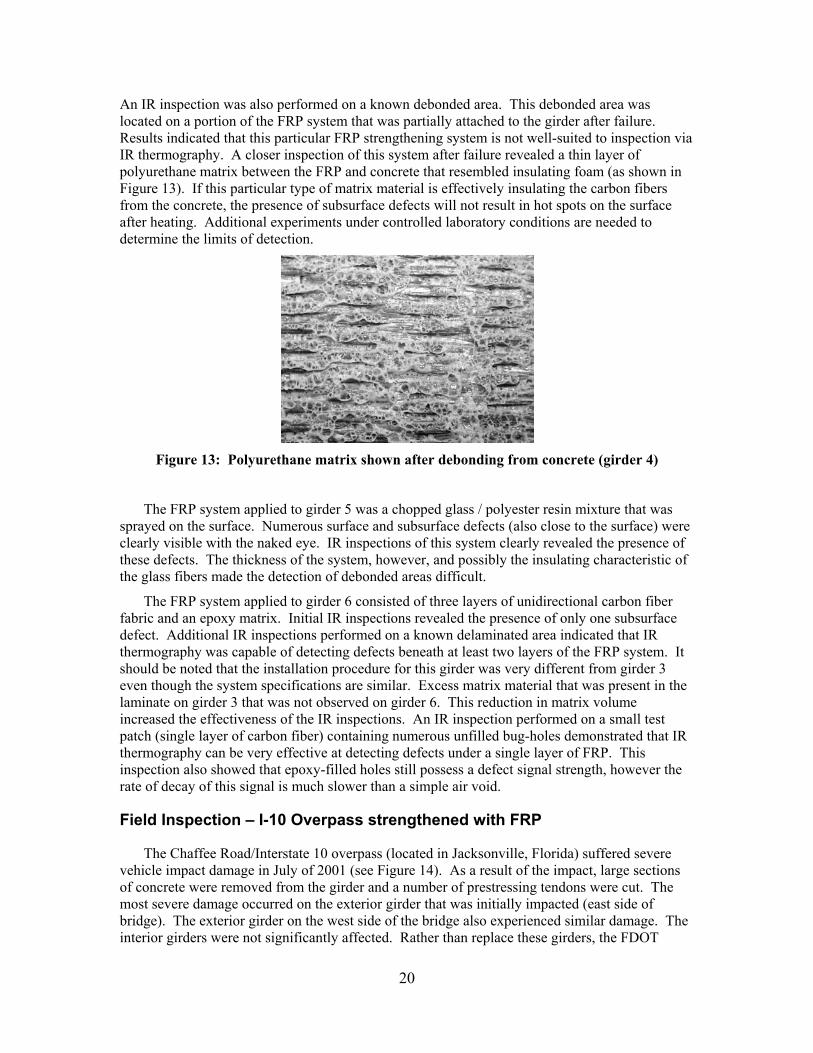
An IR inspection was also performed on a known debonded area. This debonded area was located on a portion of the FRP system that was partially attached to the girder after failure. Results indicated that this particular FRP strengthening system is not well-suited to inspection via IR thermography. A closer inspection of this system after failure revealed a thin layer of polyurethane matrix between the FRP and concrete that resembled insulating foam (as shown in Figure 13). If this particular type of matrix material is effectively insulating the carbon fibers from the concrete, the presence of subsurface defects will not result in hot spots on the surface after heating. Additional experiments under controlled laboratory conditions are needed to determine the limits of detection.
Figure 13: Polyurethane matrix shown after debonding from concrete (girder 4)
The FRP system applied to girder 5 was a chopped glass / polyester resin mixture that was sprayed on the surface. Numerous surface and subsurface defects (also close to the surface) were clearly visible with the naked eye. IR inspections of this system clearly revealed the presence of these defects. The thickness of the system, however, and possibly the insulating characteristic of the glass fibers made the detection of debonded areas difficult.
The FRP system applied to girder 6 consisted of three layers of unidirectional carbon fiber fabric and an epoxy matrix. Initial IR inspections revealed the presence of only one subsurface defect. Additional IR inspections performed on a known delaminated area indicated that IR thermography was capable of detecting defects beneath at least two layers of the FRP system. It should be noted that the installation procedure for this girder was very different from girder 3 even though the system specifications are similar. Excess matrix material that was present in the laminate on girder 3 that was not observed on girder 6. This reduction in matrix volume increased the effectiveness of the IR inspections. An IR inspection performed on a small test patch (single layer of carbon fiber) containing numerous unfilled bug-holes demonstrated that IR thermography can be very effective at detecting defects under a single layer of FRP. This inspection also showed that epoxy-filled holes still possess a defect signal strength, however the rate of decay of this signal is much slower than a simple air void.
Field Inspection – I-10 Overpass strengthened with FRP
The Chaffee Road/Interstate 10 overpass (located in Jacksonville, Florida) suffered severe vehicle impact damage in July of 2001 (see Figure 14). As a result of the impact, large sections of concrete were removed from the girder and a number of prestressing tendons were cut. The most severe damage occurred on the exterior girder that was initially impacted (east side of bridge). The exterior girder on the west side of the bridge also experienced similar damage. The interior girders were not significantly affected. Rather than replace these girders, the FDOT

21
decided to repair the damaged concrete and then apply an externally bonded FRP strengthening system. This system was comprised of multiple layers of 0°/90° carbon fiber fabric and an epoxy matrix that fully encapsulated the middle 9 m (30 ft) of both exterior girders. The exact configuration of the FRP system was not available at the time of this study, however samples removed from the girder contained two layers of the bidirectional fabric. There were no signs of excess epoxy having been applied during the installation of the system.
Chaffee Road has the unfortunate distinction of being the lowest overpass on I-10 westbound out of Jacksonville. As a result, a number of minor vehicle impact events occurred between the time the FRP system was installed and July of 2002. In June of 2003, another serious event of vehicle impact damage occurred (shown in Figure 15). Clearly the FRP system was in need of repair and the strategy adopted by the FDOT was to completely remove the existing FRP and restore the cross-section of the girder with concrete. After this was completed, a new FRP system would be applied to strengthen the girder.
Figure 14: Original vehicle impact damage that prompted strengthening with FRP
Figure 15: Vehicle impact damage after strengthening with FRP
Before the original system was removed, one of the authors was given the opportunity to inspect the system using infrared thermography. The primary goal of this inspection was to assess the affect of the vehicle impact damage on the FRP system (beyond what was clearly destroyed). This was also an excellent opportunity to apply the IR inspection techniques developed during the full-scale AASHTO girder tests in a field situation.
July 2002 June 2003

22
Areas of the FRP system that were damaged by the vehicle impact were heated using four 125 Watt IR heat lamps. The inspection procedure required two people: one to operate the camera and one to heat the surface. The camera operator and the surface heater were lifted up to the girder in a mobile scissor lift positioned directly below the area being inspected. The surface was heated by passing the lamps over the surface at a distance of approximately 10 cm. The rate of motion of the heat lamps varied between scans, but the average ∆Tbackground generated by the heat lamps was 10 °C. As the specimen was heated, the camera operator viewed the surface through the IR camera and directed the heat lamp operator.
A typical thermal image collected during this inspection is shown in Figure 16 along with a visual image for reference. While there was some evidence of debonding, this thermal image indicates that significant damage was limited to the immediate area surrounding the point of impact. Similar results were obtained from an inspection of the damaged area shown in Figure 17. The debonded areas shown in the thermal image were verified with a coin tap inspection. This coin tap inspection also verified that areas appearing bonded in the thermal images actually were.
Figure 16: Thermal image of FRP system affected by vehicle impact (side)
Figure 17: Thermal image of FRP system affected by vehicle impact (tension face)
Area shown in thermal image ∆Tdefect = 10.1 °C
∆Tbackground = 11.0 °C
Area shown in thermal image

23
While work was being done to apply the new FRP system to the east girder, the IR inspection team was able to evaluate the FRP system that was originally applied to the west girder. Access to the girder was achieved with a 2 m x 4 m scissor lift. The scanner cart configuration shown in Figure 3(b) was deployed on the scissor lift in an attempt to duplicate the experiments performed on the full-scale girders in the laboratory. Unfortunately, this met with little success. Unevenness of the scissor lift platform meant that the height of the lamps were in constant need of adjustment as the cart was pushed along the girder. Also the cart was not properly configured to account for the increased distance between the platform and the girder that was mandated by the platform’s railing.
As an alternative to the scanner cart, the camera was placed on a tripod and the camera operator applied heat to the surface as the thermal images were recorded. This was effective at revealing the presence of subsurface defects in the FRP system, however this method required a significant amount of time for setup between shots. A typical thermal image collected during this inspection is shown in Figure 18. A number of small defects were detected throughout the inspected area. One area that was particularly prone to debonding was the re-entrant corner where the bulb intersects the shear face.
The IR inspection technique worked very well in this field inspection. A number of subsurface defects were identified in the original FRP system as well as a portion of the system that suffered additional vehicle impact damage. Overall, the IR inspection indicated that much of the FRP strengthening system was still bonded after the major impact damage. This was verified as the workers attempted to remove the existing FRP system with pneumatic jackhammers and encountered tremendous difficulty. Most of the system was so well bonded that it was left in place and the new system was installed on top (shown in Figure 19). An alternative repair procedure that might be considered is to remove the debonded laminate around the damaged areas and patch the damaged concrete. Once the patch is cured, apply new FRP composite over the repaired area with an appropriate overlap onto the existing FRP system. It is not known, however, how this repair technique would affect the strengthened flexural capacity of the girder.
Figure 18: Interior face of west girder
25 cm
Tdefect = 9.8 °C ∆Tbackground = 4.4°C

24
Figure 19: East girder before new FRP system was applied
Implementation
This section offers guidance for using IR thermography (IRT) to inspect FRP composites bonded to concrete. IR thermography is used to evaluate a wide variety of materials in many different environments. Depending on the objectives of the inspection, the materials under consideration, and the environment in which the IRT inspection system will be deployed, different IR cameras, heating methods and data collection procedures will be appropriate. The information contained below will highlight some of the currently available IR camera options and outline some minimum requirements for conducting inspections on FRP composites. Heating methods will also be described and basic guidelines for surface heating and data collection will be discussed.
1.2 IRT Inspection Objectives
During the planning stages for an IRT inspection of an FRP system, it is important to clearly identify the objectives of the inspection and expected results. Important questions that must be answered are:
• What are the FRP system properties (fiber and matrix type, # of layers)?
• Will the inspection be qualitative (identify defects) or quantitative (identify and characterize defects)?
• What is the size of the smallest defect that should be detected?
• What action will be taken upon discovery of defects?
• How much of the FRP system will be inspected?
• How accessible is the FRP system?
• How will thermal images be stored and processed?
Answers to these questions will significantly influence the equipment selection and IRT inspection procedures. It is also important to have a clear understanding of these issues when planning the logistics of an inspection. Access to the surface being inspected may require heavy
Existing FRP system that could not be removed

25
equipment, such as scissor lifts. Lane closures may also be involved if the strengthened element spans a roadway. Finally, if the FRP system is being inspected in conjunction with the installation or during routine maintenance/repair, it is important that all activities be coordinated with the contractor before the inspection date. This includes provisions for necessary power and on-site maneuvering of equipment to gain access to the surface being inspected.
To assist in the identification of inspection objectives, inspections can be divided into three levels (Table 4). IRT I inspections are intended to be simple and aim to locate defects or anomalies in an FRP system. These inspections do not involve direct temperature measurements and can be performed with relatively low-cost IR camera equipment. IRT II inspections locate defects, but also include direct temperature measurements of the surface being inspected. Defect signal strengths are calculated for each defect as well as the corresponding background temperature increase. The advantage of this inspection procedure is that quantitative measurements can be stored and compared to subsequent inspection results or to other IRT inspections. IRT III inspections can be used to further characterize the defects that were detected during an IRT I or IRT II inspection. Results from an IRT III inspection include plots of defect signal strength vs. time for detected defects as well as detailed descriptions of the heating procedure used to obtain the thermal images. A summary of each method and sample thermal images are presented in Table 4.
Table 4: IRT I, II, and III inspections – Summary and sample thermal image
IRT I
• Thermal images are collected after heat source is removed
• Image does not contain temperature data and level and span are fixed
• Image of record is collected at time of maximum defect signal strength
IRT 2
• Thermal images collected after heat source is removed
• Image contains temperature data for each pixel
• Defect signal strength and background temperature increase are reported
• Image of record is collected at time of maximum defect signal strength
IRT 3
• A series of thermal images are collected during heating and/or cooling
• Images contain temperature data for each
pixel • Defect signal strength vs. time plots are
constructed for defects of interest
∆Tbackground = 5 C
∆Tdefect = 6 C
∆Tdefect = 6 C
A B

26
• Careful records are kept of heat sources used and distance from the heat source to the surface
1.3 IR Camera Requirements
IR camera technology has advanced significantly in recent years offering a wide variety of products suitable for a broad array of applications. Functionality and cost varies significantly between different models, and it is important to select a camera that is compatible with the inspection objectives outlined above.
IR cameras consist of radiometric detectors that are sensitive to electromagnetic radiation in the IR region. All objects emit electromagnetic radiation. The amount of radiation that is emitted is proportional to the temperature of an object as well as the object’s surface emissivity. Figure 20 provides the electromagnetic (EM) radiation emission curves for several common objects at different temperatures. There are two important things to note about these curves: First, the intensity (brightness) of the EM emissions increases with the objects temperature; second, the wavelength containing the peak intensity increases as temperature decreases.
Figure 20: Electromagnetic radiation emission curves for objects at different temperatures
0
2
4
6
8
10
12
0 10 20 30Time (sec.)
T def
ect (
°C)
B
A
2500 °C
5800 °C
37 °C
500 °C
visible Near IR Far IR UV
Inte
nsity
Wavelength
27
For IR cameras, the two primary regions of interest are referred to as mid-wavelength IR (MWIR) and long-wavelength IR (LWIR). MWIR cameras are sensitive to wavelengths between 3 and 5 µm (this range can vary slightly depending on the particular detector and optics used) while LWIR cameras are primarily sensitive to wavelengths between 8 and 13 µm. MWIR cameras are typically more sensitive to smaller changes in temperature. However, both MWIR and LWIR cameras can accurately measure surface temperatures within the range of interest for IR inspections of composites bonded to concrete. A fundamental difference between the two types of cameras is that MWIR detectors often require some type of cryogenic cooling to avoid signal noise due to the EM emissions from the detector and surrounding electronics. This adds to the overall complexity of the thermal imaging system and requires an additional level of maintenance as compared to un-cooled detectors.
Many IR cameras made today operate in the LWIR region and use microbolometer focal plane array (FPA) technology. A bolometer is a type of thermal detector made of a material whose electrical conductivity varies with temperature change due to incident radiation. A microbolometer FPA is simply an array of extremely small bolometers (50 µm x 50 µm) onto which an image is projected (similar to a CCD digital camera). Typical FPA detectors might include a 320x240 array of microbolometers. The electrical signal that is developed by each bolometer is then converted to a single pixel containing temperature data by applying an appropriate calibration factor.
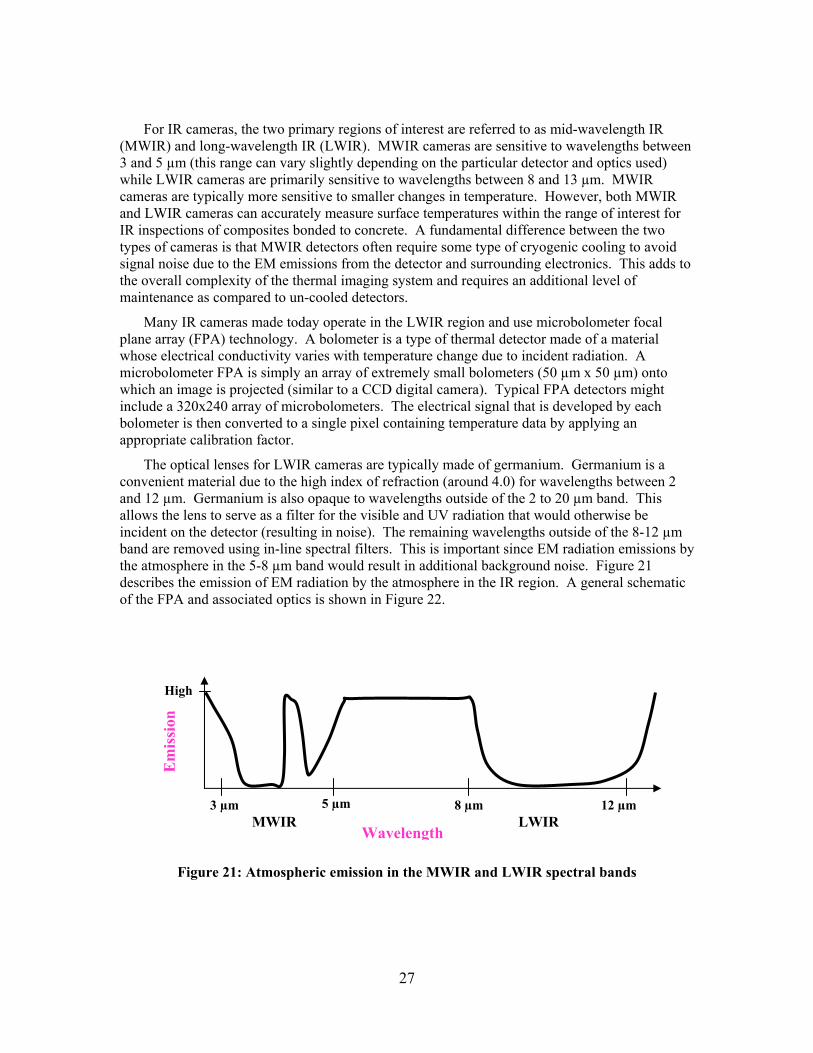
The optical lenses for LWIR cameras are typically made of germanium. Germanium is a convenient material due to the high index of refraction (around 4.0) for wavelengths between 2 and 12 µm. Germanium is also opaque to wavelengths outside of the 2 to 20 µm band. This allows the lens to serve as a filter for the visible and UV radiation that would otherwise be incident on the detector (resulting in noise). The remaining wavelengths outside of the 8-12 µm band are removed using in-line spectral filters. This is important since EM radiation emissions by the atmosphere in the 5-8 µm band would result in additional background noise. Figure 21 describes the emission of EM radiation by the atmosphere in the IR region. A general schematic of the FPA and associated optics is shown in Figure 22.
Figure 21: Atmospheric emission in the MWIR and LWIR spectral bands
3 µm MWIR
12 µm 8 µm5 µmLWIR
Em
issi
on
Wavelength
High

28
Figure 22: Thermal image formation with microbolometer FPA IR camera
1.4 FOV and smallest resolvable defect
Camera field of view (FOV) and minimum focus distance (MFD) are also important parameters to consider when selecting IR camera equipment. FOV for an IR camera is typically designated by two angles: one for the horizontal plane and one for the vertical plane. Typical values for built-in lenses range from 22° - 25° for the horizontal angle and 16° - 19° for the vertical angle. MFD refers to the minimum distance the camera can be placed from the surface being observed and still achieve focus. For stock lenses, a typical value is 30 cm.
Figure 23: Field of view and distance to target
FOV and the distance from the IR camera to the target affect the total area contained in a thermal image (H X V in Figure 23). Additional lenses can be mounted to the camera to either increase or decrease the FOV. 2X lenses reduce the FOV by approximately ½ while 0.5X lenses increase the FOV by a factor of two. Depending on the accessibility of the surface and the
IR Radiation emitted by “subject”
Germanium Lens
Microbolometer Focal Plane Array
Spectral Filter
UV and Visible
IR Radiation emitted by atmosphere
Resulting Thermal Image
FOVvert
distance to target
(d) FOVhor
V
H

29
smallest defect of interest in the inspection, an optimal configuration of lens type and distance to target may be established.
As a general rule of thumb, it is advantageous for the camera to be positioned as far away from the target as possible. This will increase the total area contained in the thermal image and result in fewer instances of having to relocate the camera. The downside to increasing the distance from the camera to the surface being inspected is the decrease in image resolution. The objective is to find the maximum distance the camera can be positioned from the surface while still maintaining an acceptable resolution for the smallest defect being considered. Typical thermal images have a resolution of 320 x 240, or 0.07 Mega Pixels. Figure 24 shows a range of defect sizes (measured in pixels) that might appear in a thermal image. 10 pixels is a reasonable minimum for the smallest defect of interest in the inspection.
Figure 24: Range of defect sizes in 320 X 240 thermal images
Figure 25 can be used to determine the maximum distance the camera can be located from the surface while still maintaining an acceptable resolution for defect sizes between 0.25 in2 and 2.0 in2. Use of these charts is best described with an example: Assume that an IRT inspection is to be conducted on a bridge girder strengthened with FRP and the smallest defect of concern has been identified as 1.0 in2. With a standard lens (24° x 18°), the camera must be placed no more than 7.0 feet from the surface for this size defect to have a diameter of 10 pixels in a thermal image. For this size defect to appear with a diameter of 20 pixels, the maximum distance is reduced to 3.5 feet (see Figure 25(c)). Each chart also contains a similar curve for 2X (12° x 9°) and 0.5X (45° x 34°) lenses.
320 pix
240 pix 20 15
10 8 6 4 21
35 30 25
Note: # below each circle indicates diameter (in pixels)

30
Defect Size = 0.25 in^2
0
5
10
10 15 20 25 30 35
Defect Diameter (Pixels)
Dis
tanc
e fr
om
Surf
ace
(ft.)
12°x9°24°x18°45°x34°
Defect Size = 0.50 in^2
0
5
10
10 15 20 25 30 35
Defect Diameter (Pixels)
Dis
tanc
e fr
om
Surf
ace
(ft.)
12°x9°24°x18°45°x34°
(a) (b)
Defect Size = 1.0 in^2
0
5
10
15
10 15 20 25 30 35
Defect Diameter (Pixels)
Dis
tanc
e fr
om
Surf
ace
(ft.)
12°x9°24°x18°45°x34°
Defect Size = 2.0 in^2
0
5
10
15
20
25
10 15 20 25 30 35
Defect Diameter (Pixels)
Dis
tanc
e fr
om
Surf
ace
(ft.)
12°x9°24°x18°45°x34°
(c) (d)
Figure 25: Maximum distance to surface for defect sizes (a) 0.25 in2 (b) 0.5 in2 (c) 1.0 in2 and (d) 2.0 in2
Two final considerations when selecting IRT camera systems are the image format and image save rate. Lower cost thermal imaging systems often have a standard s-video output that can be recorded using a VCR. These systems require that the level and span of the camera be pre-set by the operator. Difficulties can arise since the amount of heat applied to the surface as well as the defect signal strength can vary depending on the FRP system under consideration. There can also be significant variations in background temperature increases from location to location on the surface being inspected. Also, for thicker composites, the maximum defect signal strength can occur after long periods of cooling. If the span and level are not set to appropriate values before the surface is heated, the resulting thermal images may not reveal the presence of defects. This concept is illustrated in Figure 26. The thermal image shown in Figure 26(a) appears overexposed due to improper level and span settings. The correct level and span settings for revealing defects in the same specimen are shown in Figure 26(b).

31
(a) Level = 15.9 ºC, Span = 10.8 ºC (b) Level = 21.8 ºC, Span = 5.2 ºC
Figure 26: Span and level settings for thermal images
More sophisticated thermal imaging systems digitally record temperature data for each pixel in the thermal image. This allows for easy post-processing of collected images since the level and span can be adjusted after the thermal image is saved. It is also possible to obtain a direct temperature value for each pixel in an image without using an associated color or gray scale. The trade-off for this feature is a reduction in the image save rate. Digital images can be saved to on-board PCMCIA or Flash media devices at approximately one frame per second. This rate can be increased to 5-7 frames per second by connecting the camera to a laptop computer. The newest high-end research grade cameras can achieve real-time (50-60 Hz) data collection using fire-wire technology. The overall cost of the thermal imaging system depends largely on the camera’s image save rate.
For IR inspections of FRP composites bonded to concrete, an image save rate of 1 Hz is acceptable under most circumstances. Figure 27 illustrates the type of inspection that can be performed with an IR camera saving digital images at a rate of 1 Hz. In this experiment, the surface of a specimen containing fabricated defects was heated for 60 sec using a 500 Watt halogen lamp. Images were recorded during heating and cooling and specialized software was used to obtain the defect signal strength vs. time plot for the observed defects.
Level
Span
Level
Span

32
-2
0
2
4
6
8
10
12
0 50 100 150Time (sec)
∆T d
efec
t (°C
)
ABCDEF
Figure 27: Defect signal strength vs. time for specimen with fabricated defects
1.5 Surface Heating
Three heat sources were investigated in the current study:
• Photographer’s Flash (1.6 kJ and 3.2 kJ)
• IR Heat Lamps (125 W and 250 W)
• Halogen Lamps (500 W)
There are two main criteria for heat sources: (1) enough heat is applied to develop a sufficient thermal gradient, and (2) the heat is applied uniformly. Figure 28 demonstrates the surface heating capabilities for the three sources mentioned above. The photographer’s flash lamp provides a uniform heat flux over a 10 in x 10 in square area. The advantage to using the photographer’s flash is the high intensity, short duration heat impulse. Unfortunately, the amount of heat generated by a 3.2 kJ flash is insufficient to reveal defects below a multi-layered composite system. Another disadvantage is the relatively high cost of flash systems and problems associated with field use. The Halogen and IR heating lamps were found to be effective heat sources for IR thermography inspections. Table 5 illustrates how these lamps can be used for the three inspection levels outlined above.
t=10 sec
t=120t=90 sec
t=60 sec
A B C
D E F
sec
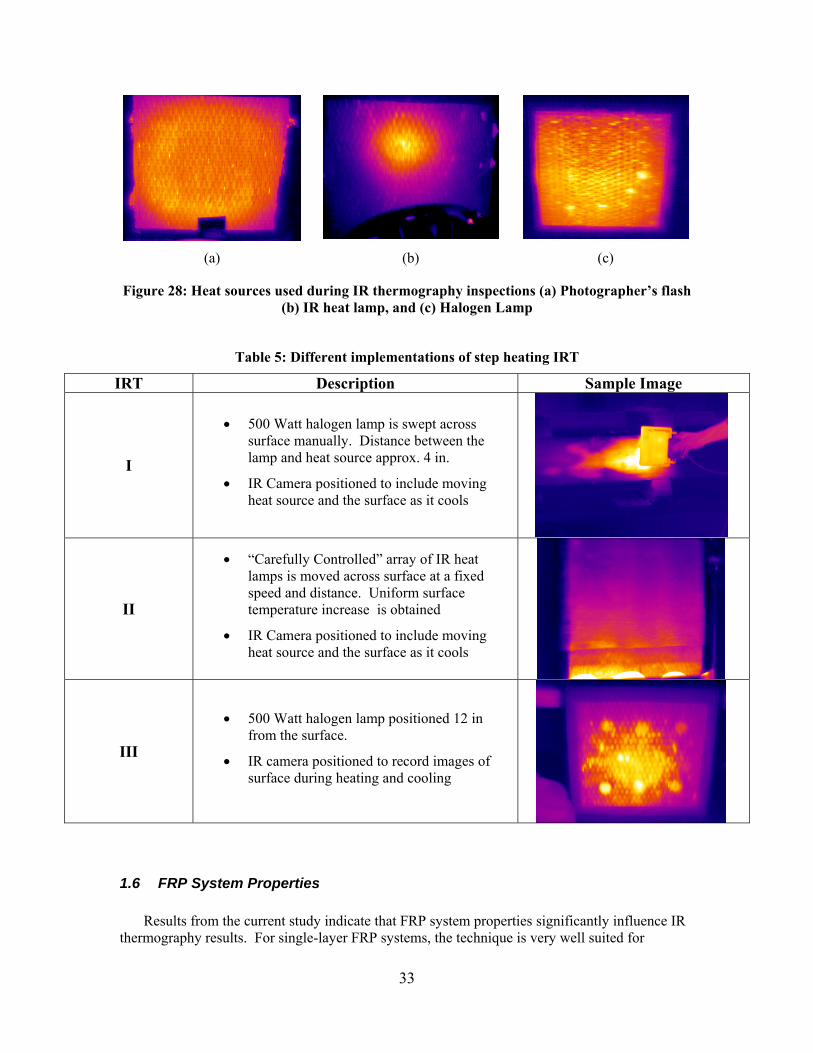
33
(a) (b) (c)
Figure 28: Heat sources used during IR thermography inspections (a) Photographer’s flash (b) IR heat lamp, and (c) Halogen Lamp
Table 5: Different implementations of step heating IRT
IRT Description Sample Image
I
• 500 Watt halogen lamp is swept across surface manually. Distance between the lamp and heat source approx. 4 in.
• IR Camera positioned to include moving heat source and the surface as it cools
II
• “Carefully Controlled” array of IR heat lamps is moved across surface at a fixed speed and distance. Uniform surface temperature increase is obtained
• IR Camera positioned to include moving heat source and the surface as it cools
III
• 500 Watt halogen lamp positioned 12 in from the surface.
• IR camera positioned to record images of surface during heating and cooling
1.6 FRP System Properties
Results from the current study indicate that FRP system properties significantly influence IR thermography results. For single-layer FRP systems, the technique is very well suited for

34
detecting very small defects (< 0.10 in2) between the composite and concrete. For thicker FRP systems, the effectiveness of IR thermography depends largely on the amount of matrix material that was used during the installation of the system. If a large amount of matrix material was incorporated into the composite, the amount of surface heating required to reveal subsurface defects increases significantly. The type of matrix material also affects IR thermography results. For the case of water-activated polyurethane matrix materials, IR thermography is not recommended. Additional research is needed in this area to determine the detection limits of IR thermography for multi-layered FRP systems.
Summary and Conclusions
This paper summarizes the results of Infrared (IR) inspections of impact damaged girders that have been repaired with FRP composites. Four AASHTO Type II prestressed girders were tested in flexure at the FDOT Structures Research Center. A section of concrete was removed and four prestressing strands were cut in a consistent manner at midspan of each girder. After imposing this “damage,” the girders were repaired by patching the missing concrete and applying an FRP composite systems. The girders were then tested in flexure to failure to determine how well the FRP composites restored the flexural strength lost from the cut strands. IR inspections were conducted after application of the FRP composite, at load hold periods during flexural testing, and after testing.
Results from these experiments indicate that IR thermography is a potentially powerful tool for evaluating bond between FRP strengthening systems and concrete. By using a thermal imaging system that captures digital images containing pixel-by-pixel temperature data, quantitative analysis of debonded areas is very convenient. Single-layer carbon-fiber systems seem very well suited to the technique, however, the ability the identify defects decreases as the thickness of the FRP increases. Debonded areas beneath fiberglass systems are also difficult to detect. Finally, IR inspections performed on an FRP system containing a polyurethane matrix were not effective. This research also highlights the need to know important parameters of the FRP system under consideration: fiber and matrix type, number of layers used, and the total thickness of the system (including any thickened epoxy). It should also be noted that information contained on material data sheets for a particular FRP system may not accurately reflect what was installed in the field.

35
References
Lammert, K. (2003). Structural Evaluation of Impact Damaged Prestressed Concrete I Girders Repaired With Fiber Reinforced Polymer (FRP) Materials. Master's Thesis. Civil and Coastal Engineering. Gainesville, Florida, University of Florida.
Levar, J. M. and H. R. Hamilton III (2003). "Nondestructive evaluation of carbon fiber-
reinforced polymer-concrete bond using infrared thermography." ACI Materials Journal v 100(n 1): p 63-72.
Maldague, X. (2001). Theory and Practice of Infrared Technology for Non-Destructive
Testing, John Wiley and Sons. Starnes, M. A., N. J. Carino, et al. (2003). "Preliminary thermography studies for quality
control of concrete structures strengthened with fiber-reinforced polymer composites." Journal of Materials in Civil Engineering v 15(n 3): p 266-273.