cfd analysis of water droplet behavior in axial … · cfd analysis of water droplet behavior in...
TRANSCRIPT
CFD Analysis of Water Droplet Behavior in Axial Flow
Compressor
Makoto Koizumi1, Motoaki Utamura1, Toyohiko Yano1, Susumu Nakano2, Takanori Shibata2, Chihiro Myoren2
1 Research Laboratory for Nuclear Reactors, Tokyo Institute of Technology, Tokyo, Japan
2-12-1, Ookayama, Meguro-ku, Tokyo 152-8550, Japan
E-mail: [email protected] 2 Mitsubishi Hitachi Power Systems, Ltd.
ABSTRACT
A numerical model is developed to characterize erosion
caused by water droplets impinging against rotor blades at the first stage of an axial flow compressor. Analyses assume a gas turbine
operating with an inlet fogging system. The change in the water
droplet size attributable to break-up and evaporation during flight
is considered. Numerical calculations are executed using a commercial code in a two-dimensional computational domain
including an inlet guide vane, rotor, and stator.
The calculated erosion depth shows good agreement with
that obtained from empirical correlation in the case without a break-up model. Results show that the break-up occurs over a
certain rotor speed, leading to marked reduction of the erosion
depth. The choice of the droplet critical Weber number determines
the rotor velocity which maximizes the erosion depth. Secondary droplets discharged from the trailing edge of IGV (Inlet Guide
Vane) affect erosion more than primary droplets, although their
mass flow is smaller.
NOMENCLATURE
a Eq. (2) [mm]
b Eq. (3) [mm/hr]
C constant in Eq. (8)[-] D droplet diameter [mm]
D32 Sauter Mean Diameter [mm]
Est erosion depth [mm]
G mass flow rate of water droplet [kg/s] H Vickers hardness [-]
L number of parcels impacting on blade [1]
l l-th parcel number [-]
M relative Mach number [-] m number of droplets in a parcel [1]
N number density of collisions [1/(mm2hr)]
P number of parcels emitted [1/s]
𝑟 radius of droplet [mm]
t sampling time [hr], break-up time [s]
u droplet velocity relative to air [m/s]
V impact velocity [m/s]
Vn normal component of V [m/s] We Weber number ( /2 Dug ) [-]
We,cr critical Weber number [-]
Greek letters
ν kinematic viscosity of water droplet [m2/s]
density [kg/m3]
σ surface tension [N/m]
τ compressor operation time [hr]
Subscripts d droplet
g humid air (gas)
l liquid, parcel number
INTRODUCTION
Inlet fogging technology, which is widely used for power
augmentation of gas turbines during hot seasons, injects finely
atomized water droplets into intake air and then cools the air by the latent heat of water evaporation. For fogging operations where
injected water exceeds the amount to saturate the incoming air,
some injected droplets enter the compressor. Aircraft engines also
experience ingestion of water droplets into the compressor during flight in rain. Some attach to internal structures such as struts and
inlet guide vanes, where they form films flowing on the surfaces.
The film flow then splashes at the trailing edge and reproduces
secondary water droplets that are often larger than the primary ones entering the compressor. Some primary and secondary
droplets might hit the rotor blade and cause erosion of the
material.
Experimental studies have examined water impingement erosion. Parametric effects have been clarified. Tsubouchi et al.
[1] conducted elaborate experiments simulating erosion by
condensate anticipated in low-pressure steam turbines. Typical
water droplet diameters were 30 μm. Itoh et al. [2] derived an empirical correlation for erosion depth based on a parametric
experiment using larger droplets of 100–270 μm diameter. Hattori
et al. [3] studied effects of water droplet impact angles on erosion,
reporting that the erosion depth is a function of the normal component of impact velocity. Uchida et al. [4] conducted a basic
experiment to assess secondary droplet formation at the trailing
edge of an Inlet guide vane (IGV). Matsuzaki et al. [5] studied
water splash behavior from a plate placed parallel to the air flow, deriving an empirical correlation of the critical Weber number as a
function of the Mach number. Nevertheless, few numerical studies
have been reported. Suzuki et al. [6, 7] reported numerical simulations of water droplet impact against a compressor rotor
blade, assuming nonvolatile, single-diameter droplets, and using
solid particle approximation for water droplets. Therefore, the
study did not consider changing droplet diameter during flight caused by break-up or evaporation.
Using a newly developed algorithm, this study numerically
investigated the effects of the break-up of flying droplets and
droplet size distributions on erosion.
International Journal of Gas Turbine, Propulsion and Power Systems December 2016, Volume 8, Number 3
Manuscript Received on March 18, 2016 Review Completed on November 17, 2016
Copyright © 2016 Gas Turbine Society of Japan
12
NUMERICAL MODEL
Outline
Air flow containing water droplets in an axial flow compressor was solved in two dimensions using commercial CFD
ANSYS Fluent 16.1. An Euler–Lagrange dispersed particle model
was used to compute the two-phase flows: air is the continuous
phase; water droplets are the dispersed phase. Air was approximated to ideal gas. Conservations of mass, momentum and
energy were discretized by control volume method. Advection
terms were solved by second order upwind. Implicit time
integration was applied to discretized equation systems. To
consider turbulence standard k- model with skin friction formula near blade surface was used. The velocity, turbulence, and other
parameters were computed first in an Euler system. Then the
traces of water droplets were obtained by integration in a
Lagrange framework after considering the turbulence diffusion and aerodynamic force from the continuous phase. The particles
were approximated by spherical shape and coefficient of drag
force was calculated as function of Reynolds number. Fluent
adopts parcel approximation, which treats a group of droplets as having identical properties instead of treating them as individual
droplets, thereby obviating the need for huge computation
resources. The accuracy of Fluent built into the evaporation model
was confirmed by Hamdani et al. [8]. For erosion by water droplet impingement, the first stage
rotor is the primary concern. To model a flow field around the
rotor accurately, the computational domain was configured with a
set of IGV, rotor and stator at the first stage of the axial flow compressor. In doing so, the water droplets trapped by IGV and
the rate of secondary droplet generation at the trailing edge of IGV
were evaluated. Then the contributions of primary and secondary
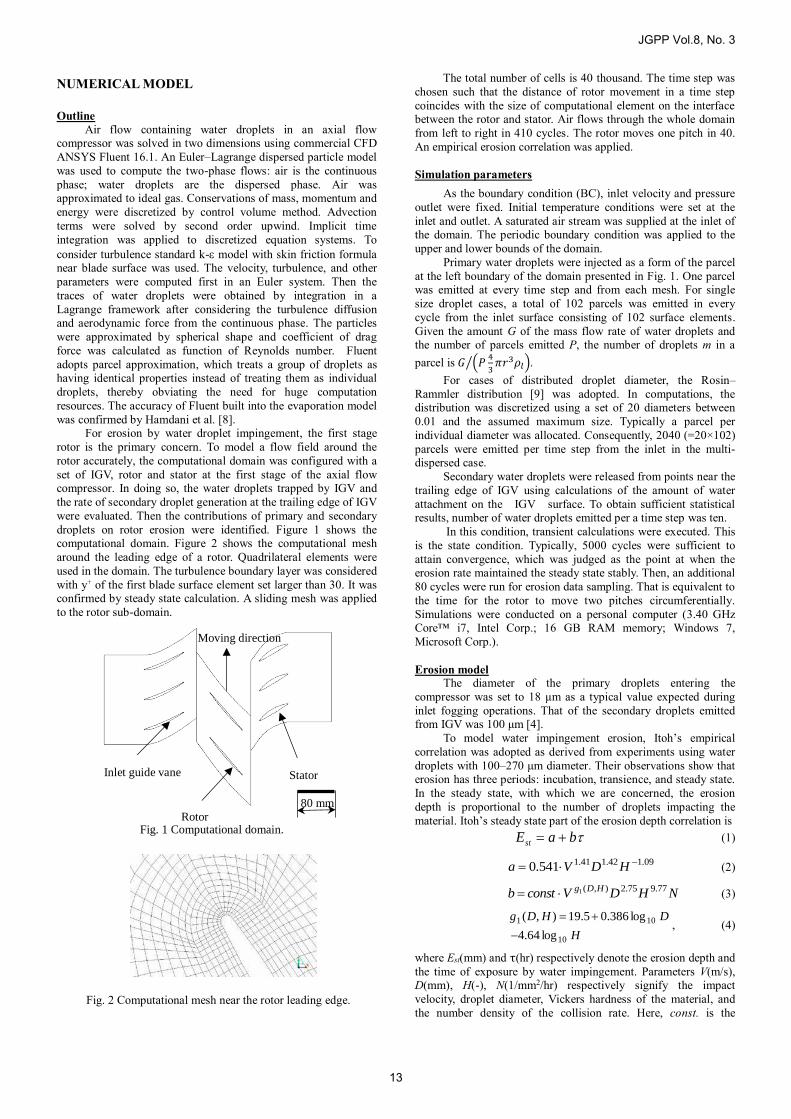
droplets on rotor erosion were identified. Figure 1 shows the computational domain. Figure 2 shows the computational mesh
around the leading edge of a rotor. Quadrilateral elements were
used in the domain. The turbulence boundary layer was considered
with y+ of the first blade surface element set larger than 30. It was confirmed by steady state calculation. A sliding mesh was applied
to the rotor sub-domain.
The total number of cells is 40 thousand. The time step was
chosen such that the distance of rotor movement in a time step
coincides with the size of computational element on the interface between the rotor and stator. Air flows through the whole domain
from left to right in 410 cycles. The rotor moves one pitch in 40.
An empirical erosion correlation was applied.
Simulation parameters
As the boundary condition (BC), inlet velocity and pressure
outlet were fixed. Initial temperature conditions were set at the
inlet and outlet. A saturated air stream was supplied at the inlet of the domain. The periodic boundary condition was applied to the
upper and lower bounds of the domain.
Primary water droplets were injected as a form of the parcel
at the left boundary of the domain presented in Fig. 1. One parcel was emitted at every time step and from each mesh. For single
size droplet cases, a total of 102 parcels was emitted in every
cycle from the inlet surface consisting of 102 surface elements.
Given the amount G of the mass flow rate of water droplets and the number of parcels emitted P, the number of droplets m in a
parcel is 𝐺 (𝑃4
3𝜋𝑟3𝜌𝑙)⁄ .
For cases of distributed droplet diameter, the Rosin–
Rammler distribution [9] was adopted. In computations, the distribution was discretized using a set of 20 diameters between
0.01 and the assumed maximum size. Typically a parcel per
individual diameter was allocated. Consequently, 2040 (=20×102)
parcels were emitted per time step from the inlet in the multi-dispersed case.
Secondary water droplets were released from points near the
trailing edge of IGV using calculations of the amount of water
attachment on the IGV surface. To obtain sufficient statistical results, number of water droplets emitted per a time step was ten.
In this condition, transient calculations were executed. This
is the state condition. Typically, 5000 cycles were sufficient to
attain convergence, which was judged as the point at when the erosion rate maintained the steady state stably. Then, an additional
80 cycles were run for erosion data sampling. That is equivalent to
the time for the rotor to move two pitches circumferentially.
Simulations were conducted on a personal computer (3.40 GHz Core™ i7, Intel Corp.; 16 GB RAM memory; Windows 7,
Microsoft Corp.).
Erosion model The diameter of the primary droplets entering the
compressor was set to 18 μm as a typical value expected during
inlet fogging operations. That of the secondary droplets emitted from IGV was 100 μm [4].
To model water impingement erosion, Itoh’s empirical
correlation was adopted as derived from experiments using water
droplets with 100–270 μm diameter. Their observations show that erosion has three periods: incubation, transience, and steady state.
In the steady state, with which we are concerned, the erosion
depth is proportional to the number of droplets impacting the
material. Itoh’s steady state part of the erosion depth correlation is
baEst (1)
09.142.141.1541.0 HDVa (2)
NHDVconstbHDg 77.975.2),(1 (3)
H
DHDg
10
101
log64.4
log386.05.19),(
, (4)
where Est(mm) and τ(hr) respectively denote the erosion depth and
the time of exposure by water impingement. Parameters V(m/s), D(mm), H(-), N(1/mm2/hr) respectively signify the impact
velocity, droplet diameter, Vickers hardness of the material, and
the number density of the collision rate. Here, const. is the Fig. 2 Computational mesh near the rotor leading edge.
Fig. 1 Computational domain.
Inlet guide vane
Moving direction
Rotor
Stator
80 mm
JGPP Vol.8, No. 3
13
0.1
1
10
0.1 1 10
Tsubouchi’s experimental
Itoh’s experimental
Erosion by experiment
Ero
sio
n b
y c
orr
elat
ion
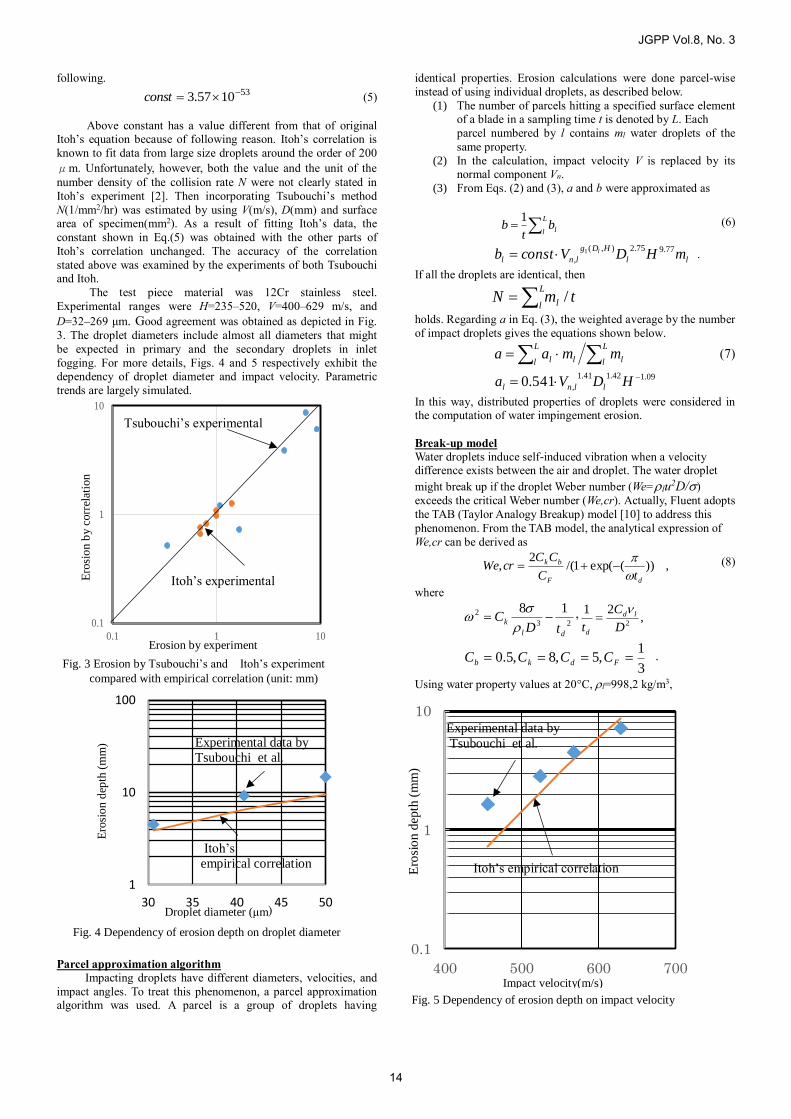
Fig. 3 Erosion by Tsubouchi’s and Itoh’s experiment compared with empirical correlation (unit: mm)
following. 531057.3 const (5)
Above constant has a value different from that of original Itoh’s equation because of following reason. Itoh’s correlation is
known to fit data from large size droplets around the order of 200
μm. Unfortunately, however, both the value and the unit of the
number density of the collision rate N were not clearly stated in
Itoh’s experiment [2]. Then incorporating Tsubouchi’s method
N(1/mm2/hr) was estimated by using V(m/s), D(mm) and surface area of specimen(mm2). As a result of fitting Itoh’s data, the
constant shown in Eq.(5) was obtained with the other parts of
Itoh’s correlation unchanged. The accuracy of the correlation
stated above was examined by the experiments of both Tsubouchi and Itoh.
The test piece material was 12Cr stainless steel.
Experimental ranges were H=235–520, V=400–629 m/s, and
D=32–269 μm. Good agreement was obtained as depicted in Fig.
3. The droplet diameters include almost all diameters that might
be expected in primary and the secondary droplets in inlet
fogging. For more details, Figs. 4 and 5 respectively exhibit the
dependency of droplet diameter and impact velocity. Parametric
trends are largely simulated.
Parcel approximation algorithm
Impacting droplets have different diameters, velocities, and
impact angles. To treat this phenomenon, a parcel approximation algorithm was used. A parcel is a group of droplets having
identical properties. Erosion calculations were done parcel-wise
instead of using individual droplets, as described below.
(1) The number of parcels hitting a specified surface element of a blade in a sampling time t is denoted by L. Each
parcel numbered by l contains ml water droplets of the
same property.
(2) In the calculation, impact velocity V is replaced by its normal component Vn.
(3) From Eqs. (2) and (3), a and b were approximated as
L
l lbt
b1 (6)
ll
HDg
lnl mHDVconstb l 77.975.2),(
,1 .
If all the droplets are identical, then
tmNL
l l /
holds. Regarding a in Eq. (3), the weighted average by the number
of impact droplets gives the equations shown below.
L
l l
L
l ll mmaa (7)
09.142.141.1
,541.0 HDVa llnl
In this way, distributed properties of droplets were considered in the computation of water impingement erosion.
Break-up model
Water droplets induce self-induced vibration when a velocity difference exists between the air and droplet. The water droplet
might break up if the droplet Weber number (We=lu2D/)
exceeds the critical Weber number (We,cr). Actually, Fluent adopts
the TAB (Taylor Analogy Breakup) model [10] to address this
phenomenon. From the TAB model, the analytical expression of
We,cr can be derived as
,))(exp(1/(2
,dF
bk
tC
CCcrWe
(8)
where
23
2 18
dl
ktD
C
, ,
212D
C
t
ld
d
3
1,5,8,5.0 Fdkb CCCC .
Using water property values at 20°C, l=998,2 kg/m3,
1
10
100
30 35 40 45 50Droplet diameter (μm)
Experimental data by Tsubouchi et al.
Itoh’s empirical correlation
Ero
sio
n d
epth
(m
m)
Fig. 4 Dependency of erosion depth on droplet diameter
0.1
1
10
400 500 600 700
Experimental data by
Tsubouchi et al.
Itoh’s empirical correlation
Impact velocity(m/s)
Ero
sio
n d
epth
(m
m)
Fig. 5 Dependency of erosion depth on impact velocity
JGPP Vol.8, No. 3
14

Fig. 7 Static pressure distribution (relative value)
0.037MPa -0.084MPa Fig. 9 Erosion along the rotor surface by single size primary droplets in the case of inert and without break-up
Leading edge Trailing edge 0 1.0 0.5
Position (-)
Ero
sio
n d
epth
(-)
1.0
0.5
0.0
(b) Erosion depth on the rotor surface
0 1 (a) Erosion depth distribution around leading edge
0.5
l=1.004×10⁻⁶m2/s, ×10-3N/m and droplet diameter D of 18×10-6m, We,cr will become 12.6. This value is less than the
value of 30 that Tsubouchi [1] reported for a steam turbine blade,
but it is close to Flock’s observation [13]. Using the Weber number definition, the range of break-up of a
droplet was derived as a function of diameter D and relative
velocity u. Figure 6 presents the result. For example, given a
droplet with D=18 μm, velocity greater than 210 m/s is needed for break-up to occur.
RESULTS
Flow around blade lines To calculate air flow the following boundary conditions
were set. Inlet total pressure, outlet static pressure and moving
velocity of rotor were 100126 Pa, 92762 Pa and 392.7 m/s respectively. In advance one dimensional axial flow model
equivalent to the present two dimensional model was calculated
[11]. Above boundary conditions were referred to the results.
The velocities of air and water droplet parcels at the inlet were set to the same velocity of inlet air. The droplet diameter was
18 μm, with water to air mass ratio of 0.63% referring to reference
[11]. Figure 7 shows the static pressure contour as a function of
the deviation from atmospheric pressure. Pressure becomes negative at the rotor blade bottom surface and positive at the
leading edge and upper surface. Velocity distributions are shown
in Fig. 8(a) and (b). Figure 8(b) depicts the sudden change in the
velocity vector near the leading edge and thin boundary layer was made near leading edge. Calculated inlet velocity became
152.8m/s which was approximately equal to predicted value
143m/s by one dimensional axial flow model. Therefore these
results are reasonable.
0
5
10
15
20
25
30
35
40
100 200 300 400 500
Dro
ple
t d
iam
ete
r
(μm)
18μm
210m/s
Velocity difference (m/s)
We=12.6
Break-up
Fig. 6 Break-up area of droplet
0.45m/s 428m/s Fig. 8 Velocity distribution
(a) Whole computation domain
(b) Around leading edge of rotor
JGPP Vol.8, No. 3
15
Mas
s fl
ow
rat
e (k
g/s
)
Droplet diameter (μm)
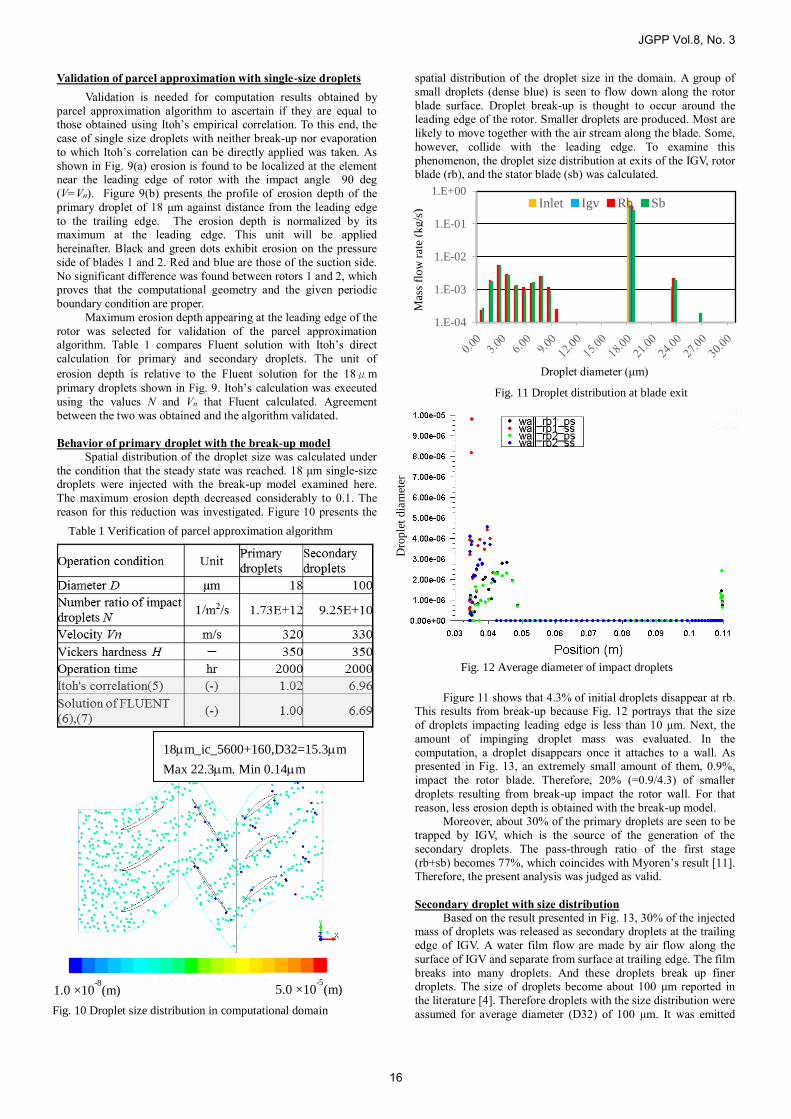
Fig. 11 Droplet distribution at blade exit
1.E-04
1.E-03
1.E-02
1.E-01
1.E+00Inlet Igv Rb Sb
Dro
ple
t d
iam
eter
(m)
Fig. 12 Average diameter of impact droplets
Validation of parcel approximation with single-size droplets
Validation is needed for computation results obtained by
parcel approximation algorithm to ascertain if they are equal to those obtained using Itoh’s empirical correlation. To this end, the
case of single size droplets with neither break-up nor evaporation
to which Itoh’s correlation can be directly applied was taken. As
shown in Fig. 9(a) erosion is found to be localized at the element near the leading edge of rotor with the impact angle 90 deg
(V=Vn). Figure 9(b) presents the profile of erosion depth of the
primary droplet of 18 μm against distance from the leading edge
to the trailing edge. The erosion depth is normalized by its maximum at the leading edge. This unit will be applied
hereinafter. Black and green dots exhibit erosion on the pressure
side of blades 1 and 2. Red and blue are those of the suction side.
No significant difference was found between rotors 1 and 2, which proves that the computational geometry and the given periodic
boundary condition are proper.
Maximum erosion depth appearing at the leading edge of the
rotor was selected for validation of the parcel approximation algorithm. Table 1 compares Fluent solution with Itoh’s direct
calculation for primary and secondary droplets. The unit of
erosion depth is relative to the Fluent solution for the 18μm
primary droplets shown in Fig. 9. Itoh’s calculation was executed
using the values N and Vn that Fluent calculated. Agreement
between the two was obtained and the algorithm validated.
Behavior of primary droplet with the break-up model
Spatial distribution of the droplet size was calculated under
the condition that the steady state was reached. 18 μm single-size droplets were injected with the break-up model examined here.
The maximum erosion depth decreased considerably to 0.1. The
reason for this reduction was investigated. Figure 10 presents the
spatial distribution of the droplet size in the domain. A group of
small droplets (dense blue) is seen to flow down along the rotor
blade surface. Droplet break-up is thought to occur around the leading edge of the rotor. Smaller droplets are produced. Most are
likely to move together with the air stream along the blade. Some,
however, collide with the leading edge. To examine this
phenomenon, the droplet size distribution at exits of the IGV, rotor blade (rb), and the stator blade (sb) was calculated.
Figure 11 shows that 4.3% of initial droplets disappear at rb.
This results from break-up because Fig. 12 portrays that the size
of droplets impacting leading edge is less than 10 μm. Next, the
amount of impinging droplet mass was evaluated. In the
computation, a droplet disappears once it attaches to a wall. As presented in Fig. 13, an extremely small amount of them, 0.9%,
impact the rotor blade. Therefore, 20% (=0.9/4.3) of smaller
droplets resulting from break-up impact the rotor wall. For that
reason, less erosion depth is obtained with the break-up model. Moreover, about 30% of the primary droplets are seen to be
trapped by IGV, which is the source of the generation of the
secondary droplets. The pass-through ratio of the first stage
(rb+sb) becomes 77%, which coincides with Myoren’s result [11]. Therefore, the present analysis was judged as valid.
Secondary droplet with size distribution
Based on the result presented in Fig. 13, 30% of the injected mass of droplets was released as secondary droplets at the trailing
edge of IGV. A water film flow are made by air flow along the
surface of IGV and separate from surface at trailing edge. The film
breaks into many droplets. And these droplets break up finer droplets. The size of droplets become about 100 μm reported in
the literature [4]. Therefore droplets with the size distribution were
assumed for average diameter (D32) of 100 μm. It was emitted
Table 1 Verification of parcel approximation algorithm
Fig. 10 Droplet size distribution in computational domain
18m_ic_5600+160,D32=15.3m Max 22.3m. Min 0.14m
1.0 ×10⁻⁸
(m) 5.0 ×10⁻⁵
(m)
JGPP Vol.8, No. 3
16
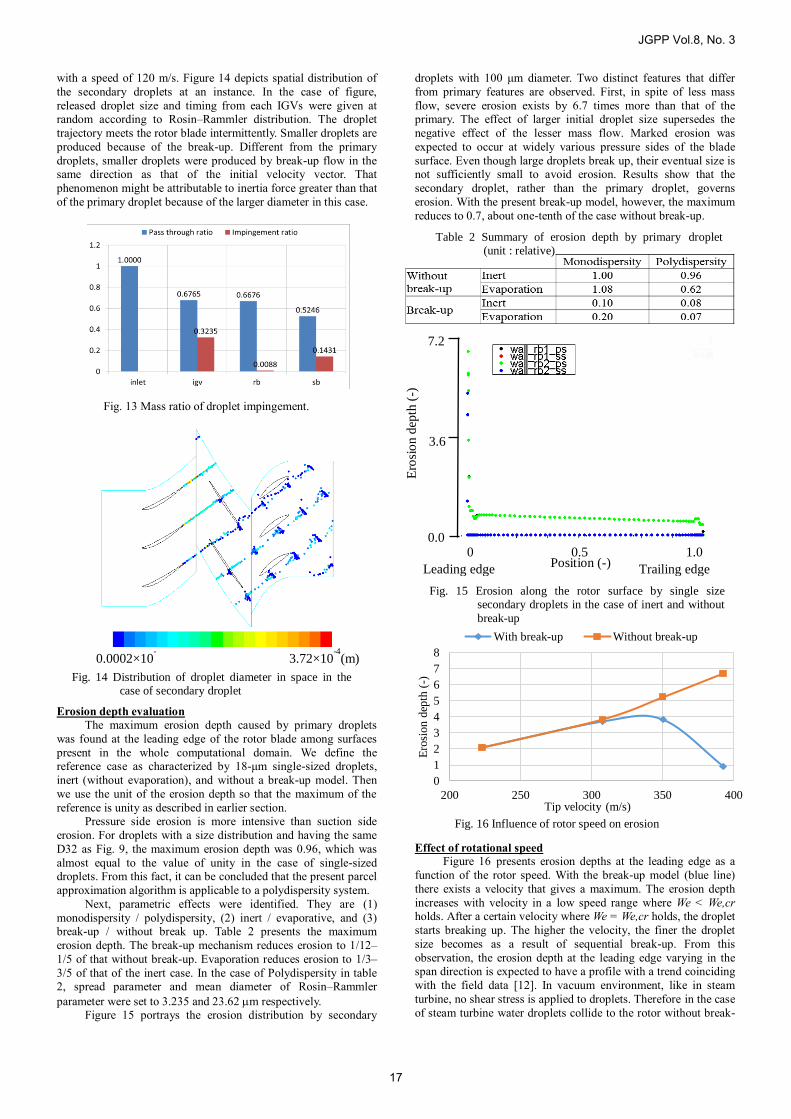
Fig. 13 Mass ratio of droplet impingement.
0.0002×10-
4
3.72×10⁻⁴
(m) Fig. 14 Distribution of droplet diameter in space in the
case of secondary droplet
Leading edge Trailing edge 0 1.0 0.5
Position (-)
Fig. 15 Erosion along the rotor surface by single size secondary droplets in the case of inert and without
break-up
7.2
3.6
0.0
Ero
sio
n d
epth
(-)
with a speed of 120 m/s. Figure 14 depicts spatial distribution of
the secondary droplets at an instance. In the case of figure,
released droplet size and timing from each IGVs were given at random according to Rosin–Rammler distribution. The droplet
trajectory meets the rotor blade intermittently. Smaller droplets are
produced because of the break-up. Different from the primary
droplets, smaller droplets were produced by break-up flow in the same direction as that of the initial velocity vector. That
phenomenon might be attributable to inertia force greater than that
of the primary droplet because of the larger diameter in this case.
Erosion depth evaluation
The maximum erosion depth caused by primary droplets
was found at the leading edge of the rotor blade among surfaces
present in the whole computational domain. We define the reference case as characterized by 18-μm single-sized droplets,
inert (without evaporation), and without a break-up model. Then
we use the unit of the erosion depth so that the maximum of the
reference is unity as described in earlier section. Pressure side erosion is more intensive than suction side
erosion. For droplets with a size distribution and having the same
D32 as Fig. 9, the maximum erosion depth was 0.96, which was
almost equal to the value of unity in the case of single-sized droplets. From this fact, it can be concluded that the present parcel
approximation algorithm is applicable to a polydispersity system. Next, parametric effects were identified. They are (1)
monodispersity / polydispersity, (2) inert / evaporative, and (3) break-up / without break up. Table 2 presents the maximum
erosion depth. The break-up mechanism reduces erosion to 1/12–
1/5 of that without break-up. Evaporation reduces erosion to 1/3–
3/5 of that of the inert case. In the case of Polydispersity in table 2, spread parameter and mean diameter of Rosin–Rammler
parameter were set to 3.235 and 23.62 m respectively. Figure 15 portrays the erosion distribution by secondary
droplets with 100 μm diameter. Two distinct features that differ
from primary features are observed. First, in spite of less mass
flow, severe erosion exists by 6.7 times more than that of the primary. The effect of larger initial droplet size supersedes the
negative effect of the lesser mass flow. Marked erosion was
expected to occur at widely various pressure sides of the blade
surface. Even though large droplets break up, their eventual size is not sufficiently small to avoid erosion. Results show that the
secondary droplet, rather than the primary droplet, governs
erosion. With the present break-up model, however, the maximum
reduces to 0.7, about one-tenth of the case without break-up.
Effect of rotational speed Figure 16 presents erosion depths at the leading edge as a
function of the rotor speed. With the break-up model (blue line)
there exists a velocity that gives a maximum. The erosion depth
increases with velocity in a low speed range where We < We,cr holds. After a certain velocity where We = We,cr holds, the droplet
starts breaking up. The higher the velocity, the finer the droplet
size becomes as a result of sequential break-up. From this
observation, the erosion depth at the leading edge varying in the
span direction is expected to have a profile with a trend coinciding
with the field data [12]. In vacuum environment, like in steam
turbine, no shear stress is applied to droplets. Therefore in the case
of steam turbine water droplets collide to the rotor without break-
Fig. 16 Influence of rotor speed on erosion
0
1
2
3
4
5
6
7
8
200 250 300 350 400
Ero
sion d
epth
(-)
Tip velocity (m/s)
With break-up Without break-up
Table 2 Summary of erosion depth by primary droplet (unit : relative)
JGPP Vol.8, No. 3
17
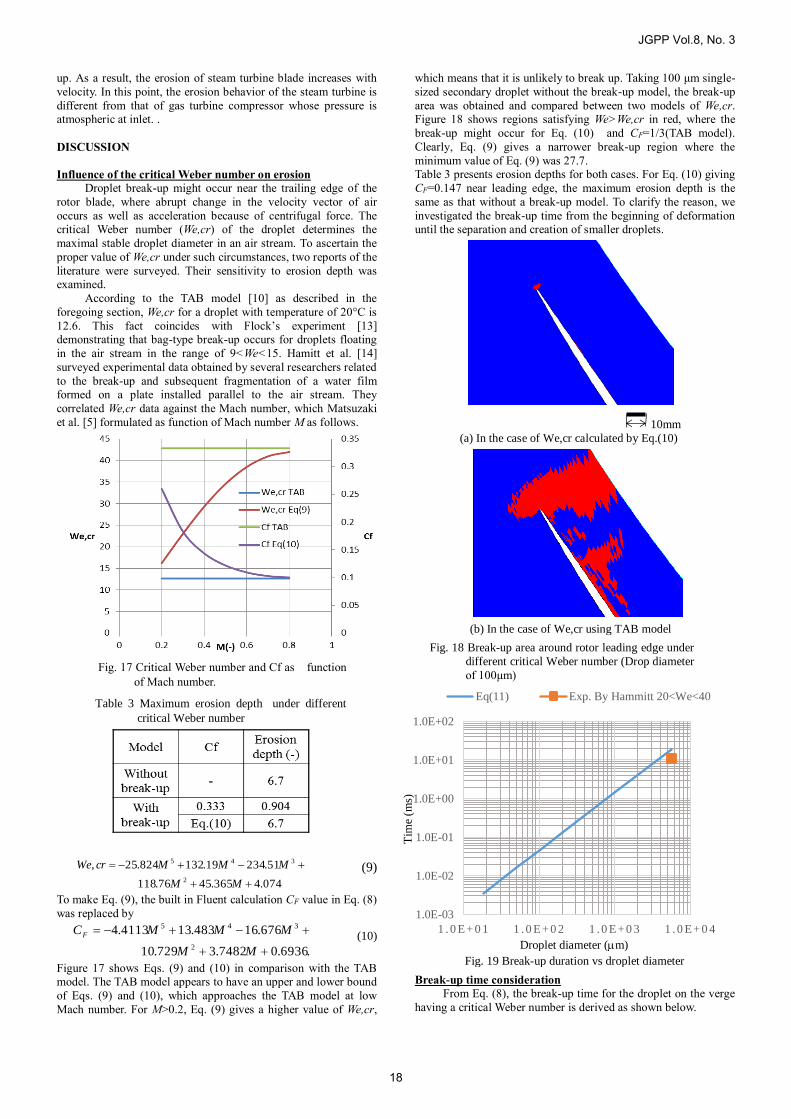
Fig. 17 Critical Weber number and Cf as function
of Mach number.
10mm (a) In the case of We,cr calculated by Eq.(10)
(b) In the case of We,cr using TAB model Fig. 18 Break-up area around rotor leading edge under
different critical Weber number (Drop diameter
of 100μm)
Table 3 Maximum erosion depth under different
critical Weber number
up. As a result, the erosion of steam turbine blade increases with
velocity. In this point, the erosion behavior of the steam turbine is
different from that of gas turbine compressor whose pressure is atmospheric at inlet. .
DISCUSSION
Influence of the critical Weber number on erosion
Droplet break-up might occur near the trailing edge of the
rotor blade, where abrupt change in the velocity vector of air
occurs as well as acceleration because of centrifugal force. The critical Weber number (We,cr) of the droplet determines the
maximal stable droplet diameter in an air stream. To ascertain the
proper value of We,cr under such circumstances, two reports of the
literature were surveyed. Their sensitivity to erosion depth was examined.
According to the TAB model [10] as described in the
foregoing section, We,cr for a droplet with temperature of 20°C is
12.6. This fact coincides with Flock’s experiment [13] demonstrating that bag-type break-up occurs for droplets floating
in the air stream in the range of 9<We<15. Hamitt et al. [14]
surveyed experimental data obtained by several researchers related
to the break-up and subsequent fragmentation of a water film formed on a plate installed parallel to the air stream. They
correlated We,cr data against the Mach number, which Matsuzaki
et al. [5] formulated as function of Mach number M as follows.
074.4365.4576.118
51.23419.132824.25,
2
345
MM
MMMcrWe (9)
To make Eq. (9), the built in Fluent calculation CF value in Eq. (8)
was replaced by
.6936.07482.3729.10
676.16483.134113.4
2
345
MM
MMMCF (10)
Figure 17 shows Eqs. (9) and (10) in comparison with the TAB model. The TAB model appears to have an upper and lower bound
of Eqs. (9) and (10), which approaches the TAB model at low
Mach number. For M>0.2, Eq. (9) gives a higher value of We,cr,
which means that it is unlikely to break up. Taking 100 μm single-
sized secondary droplet without the break-up model, the break-up
area was obtained and compared between two models of We,cr. Figure 18 shows regions satisfying We>We,cr in red, where the
break-up might occur for Eq. (10) and CF=1/3(TAB model).
Clearly, Eq. (9) gives a narrower break-up region where the
minimum value of Eq. (9) was 27.7. Table 3 presents erosion depths for both cases. For Eq. (10) giving
CF=0.147 near leading edge, the maximum erosion depth is the
same as that without a break-up model. To clarify the reason, we
investigated the break-up time from the beginning of deformation until the separation and creation of smaller droplets.
Break-up time consideration
From Eq. (8), the break-up time for the droplet on the verge
having a critical Weber number is derived as shown below.
1.0E-03
1.0E-02
1.0E-01
1.0E+00
1.0E+01
1.0E+02
1 . 0 E+0 1 1 . 0 E+0 2 1 . 0 E+0 3 1 . 0 E+0 4
Eq(11) Exp. By Hammitt 20<We<40
Tim
e (m
s)
Droplet diameter (m) Fig. 19 Break-up duration vs droplet diameter
JGPP Vol.8, No. 3
18

2
2
2
3 4
r
C
rCt ld
l
k
(11)
Figure 19 presents the break-up time by Eq. (11) against the
droplet diameter. The experiment examined an average of data executed at 20<We<40. Good agreement was found for droplets of
5.6 mm diameter. Extrapolation of this to 100 μm gives 50 μs.
Assuming impact velocity of 300 m/s, then the length of flight
becomes 15 mm (=3 ∙ 105 × 5 ∙ 10−5), which is greater than the greatest distance in the red area from the leading edge in the upper
panel of Fig. 18. This fact implies that break-up does not finish at
the time of impingement, even though it has started. For that reason, the erosion depth is the same as the case of the non-break-
up model. Figure 20 shows that the impact droplets maintain the
initial diameter at the leading edge
CONCLUSIONS
Water droplet behavior during inlet fogging operations in an
axial flow compressor of a gas turbine was investigated numerically. The geometry configuration included Inlet guide
vane (IGV) and the first stage rotor and stator. Special emphasis
was placed upon evaluation of the secondary droplet mass flow,
multi-disperse droplet characteristics, and droplet break-up events. Simulation was executed using ANSYS Fluent® v.16.1. The
following results were obtained.
(1) Numerical calculations using representative diameter D32 are
appropriate under the condition that no diameter change occurs during flight. A new algorithm was developed to
accommodate droplets of various diameters attributable to
break-up or evaporation in erosion evaluation.
(2) Erosion depth by the impingement of the secondary droplets emitted from the trailing edge of IGV is much greater than
that by the primary droplet, although the mass is less in the
secondary droplets.
(3) Break-up of droplets might occur near the leading edge of the rotor due to shear force from ambient air, producing smaller
droplets, which suppresses blade erosion if the rotor blade
rotational speed is sufficiently high. Therefore, certain speed
exists that gives rise to maximum erosion depth. This erosion mechanism is unique in compressor and is different from that
of steam turbine installed in vacuum environment where the
break up is hard to occur.
(4) The speed above depends greatly on the choice of the value of the critical Weber number.
To date, knowledge related to the critical Weber number has
been obtained experimentally in a simple steady state flow field.
However, the flow field near the rotor leading edge is a spatially accelerating flow field that is complex where a hidden parameter
might exist for the break-up. Therefore, further experimental and
theoretical study is strongly recommended as future work.
ACKNOWLEDGMENTS
This research was supported financially by the Ministry of
Economy, Trade and Industry of Japan, Agency for Natural
Resources and Energy. The authors wish to express their deep
gratitude. They are also indebted to Dr. Kuniyoshi Tsubouchi for valuable discussions.
REFERENCES
[1] K. Tsubouchi, N. Yasugahira, S.Yoshida, R.Kaneko, T. Sato,
1990, An Evaluation of Water Droplet Erosion for Advanced
Large Steam Turbine, Advances in Steam Turbine
Technology for Power Generation, PWR-Vol. 10,ASME,
Book No. G00518
[2] Itoh, H., Okabe, N., 1993, Evaluation of erosion by liquid droplet impingement for metallic materials (in Japanese),
Transactions of JSME (a), Vol. 59, No. 567, pp. 2736-2741.
[3] Hattori, S., Kakuichi, M., 2012, Effect of impact angle on
liquid impingement erosion (in Japanese), Transactions of JSME (a), Vol. 78, No. 791(-7), pp. 1023-1032.
[4] Uchida, T., Ootomo, F., Fukutake, H., Itoh, M., Kanome, H.,
Okuno, K., 2014, Behavior of droplets atomized from the air
cooled-gas turbine inlet guide vane trailing edge and erosion evaluation of compressor blades (in Japanese), GTSJ
Journal, Vol. 42, No. 3, pp. 214-219.
[5] Matsuzaki, Y., Nakano, S., Toriyama, H., Takeda, Y., Satou,
K., 2015, A study of disruption patterns of water film splashed into air flow (in Japanese), GTSJ Journal, Vol. 43,
No. 6 (.11), pp. 451-457.
[6] Suzuki, M., Yamamoto, M., 2014, Numerical simulation of
liquid droplet impingement erosion (in Japanese), Proceeding 42nd Meeting of GTSJ, A-20.
[7] Suzuki, M., Yamamoto, M., 2015, Numerical analysis of
liquid droplet impingement erosion on compressor cascade
(in Japanese), Proceeding 43rd Meeting of GTSJ, C-15.
[8] Hamdani, A., Utamura, M., Shibata, T., Myoren, C., 2015,
Numerical simulations of droplet coalescence in an L-
shaped duct for inlet fogging of gas turbine engines,
International Journal of Gas Turbine, Propulsion and Power
Systems, Vol. 7, No. 1.
[9] Lefebvre, A. H., 1989, Atomization and sprays, Hemisphere
Publishing Corporation.
[10] P. J. O’Rourke, A. Amsden, 1987, The TAB Method for
Numerical Calculation of Spray Drop Breakup, SAE Paper,
No. 872089.
[11] C. Myoren, Y. Takahashi et al., 2013, Evaluation of Axial
Compressor Characteristics under Overspray Condition,
Proceedings, ASME Turbo Expo 2013: Turbine Technical
Conference and Exposition GT2013.
[12] Gajjar, H., Chaker, M., Dighe, A., Homji, C. M., 2003, Inlet
fogging for a 655 MW combined cycle power plant-design,
implementation and operating experience, Proceedings
ASME Turbo Expo 2003, GT2003-38757.
[13] Flock, A.K., Guildenbecher, D.R., Chen, J., Sojka, P.E.,
Bauer, H.J., 2012, Experimental statistics of droplet
trajectory and air flow during aerodynamic fragmentation of
liquid drops, International Journal of Multiphase Flow, Vol.
47, pp. 377-49.
[14] Hammitt, F. G. Kreczkowski, S. and Krzyzanowki, J., 1981,
Liquid film and droplet stability consideration as applied to
wet stream flow, Forschung. Ing-Wes, 47.
Dro
ple
t d
iam
eter
(m
)
Fig. 20 Average diameter of impact droplets
JGPP Vol.8, No. 3
19