cfa institute compensation study–executive summary
TRANSCRIPT
CFA INSTITUTE COMPENSATION STUDY–EXECUTIVE SUMMARYSEPTEMBER 2019
2
CFA Institute Compensation Study – Executive Summary September 2019
Table of ContentsForeword: 2019 CFA Institute Compensation Study 3
Summary of Findings 4
Respondent Profile Findings and Insights 6 Functions Profile 7
Experience Profile 8
Firm Size Profile 9
Industry Type Profile 10
Seniority Level Profile 11
Education Level Profile 12
Compensation Findings and Insights 13 Total Compensation 14
Incentive Opportunity 22
Salary 25
Appendix: About the Study 31 Methodology and Sampling 32
Glossary of Compensation Terms 34
Compensation Analysis: Compensation Tables 40

Foreword: 2019 CFA Institute Compensation StudyIntroductory Statement
In response to member/charterholder requests and to support
career planning, CFA Institute partnered with an expert third-party
firm to conduct an online compensation survey of all members/
charterholders globally. Using data from more than 15,000
respondents across 129 markets, we developed a summary
report and interactive dashboard that highlight key respondent
profile and compensation themes and trends. From the report and
dashboard, members/charterholders can see how compensation
for investment professionals is structured globally and gain
insights into compensation benchmarks.
We thank our members/charterholders who participated in the
May 2019 survey and enabled us to compile and share this
information with you.
We welcome your comments about this study and whether
you would like us to conduct future compensation studies.
Please leave feedback within the dashboard or contact us at:
Note: All compensation figures in this report are denoted in US dollars (USD).
Interactive Dashboard
The dashboard — available exclusively to CFA Institute members/
charterholders — organizes the compensation survey results by
region, country/markets, select metropolitan areas, organization
type, occupation, and select demographic elements, where sample
size permits.
Log in to the dashboard to select relevant fields and to customize
your analysis: www.cfainstitute.org/compensationstudy
This data and report are for the personal use of CFA Institute members/charterholders only. The data and report
may not be reproduced in whole or in part without the prior written permission of CFA Institute.
©2019 CFA Institute. All rights reserved.
3
CFA Institute Compensation Study – Executive Summary September 2019
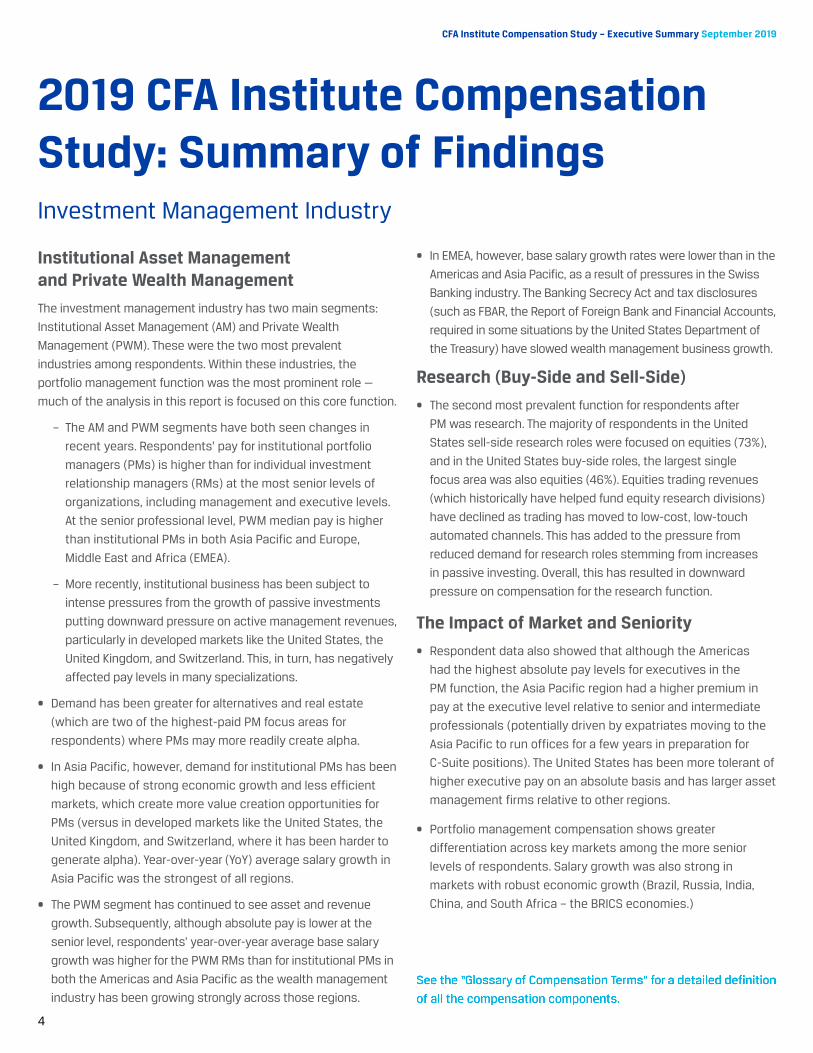
2019 CFA Institute Compensation Study: Summary of FindingsInvestment Management Industry
Institutional Asset Management and Private Wealth Management
The investment management industry has two main segments:
Institutional Asset Management (AM) and Private Wealth
Management (PWM). These were the two most prevalent
industries among respondents. Within these industries, the
portfolio management function was the most prominent role —
much of the analysis in this report is focused on this core function.
– The AM and PWM segments have both seen changes in
recent years. Respondents’ pay for institutional portfolio
managers (PMs) is higher than for individual investment
relationship managers (RMs) at the most senior levels of
organizations, including management and executive levels.
At the senior professional level, PWM median pay is higher
than institutional PMs in both Asia Pacific and Europe,
Middle East and Africa (EMEA).
– More recently, institutional business has been subject to
intense pressures from the growth of passive investments
putting downward pressure on active management revenues,
particularly in developed markets like the United States, the
United Kingdom, and Switzerland. This, in turn, has negatively
affected pay levels in many specializations.
• Demand has been greater for alternatives and real estate
(which are two of the highest-paid PM focus areas for
respondents) where PMs may more readily create alpha.
• In Asia Pacific, however, demand for institutional PMs has been
high because of strong economic growth and less efficient
markets, which create more value creation opportunities for
PMs (versus in developed markets like the United States, the
United Kingdom, and Switzerland, where it has been harder to
generate alpha). Year-over-year (YoY) average salary growth in
Asia Pacific was the strongest of all regions.
• The PWM segment has continued to see asset and revenue
growth. Subsequently, although absolute pay is lower at the
senior level, respondents’ year-over-year average base salary
growth was higher for the PWM RMs than for institutional PMs in
both the Americas and Asia Pacific as the wealth management
industry has been growing strongly across those regions.
• In EMEA, however, base salary growth rates were lower than in the
Americas and Asia Pacific, as a result of pressures in the Swiss
Banking industry. The Banking Secrecy Act and tax disclosures
(such as FBAR, the Report of Foreign Bank and Financial Accounts,
required in some situations by the United States Department of
the Treasury) have slowed wealth management business growth.
Research (Buy-Side and Sell-Side)
• The second most prevalent function for respondents after
PM was research. The majority of respondents in the United
States sell-side research roles were focused on equities (73%),
and in the United States buy-side roles, the largest single
focus area was also equities (46%). Equities trading revenues
(which historically have helped fund equity research divisions)
have declined as trading has moved to low-cost, low-touch
automated channels. This has added to the pressure from
reduced demand for research roles stemming from increases
in passive investing. Overall, this has resulted in downward
pressure on compensation for the research function.
The Impact of Market and Seniority
• Respondent data also showed that although the Americas
had the highest absolute pay levels for executives in the
PM function, the Asia Pacific region had a higher premium in
pay at the executive level relative to senior and intermediate
professionals (potentially driven by expatriates moving to the
Asia Pacific to run offices for a few years in preparation for
C-Suite positions). The United States has been more tolerant of
higher executive pay on an absolute basis and has larger asset
management firms relative to other regions.
• Portfolio management compensation shows greater
differentiation across key markets among the more senior
levels of respondents. Salary growth was also strong in
markets with robust economic growth (Brazil, Russia, India,
China, and South Africa – the BRICS economies.)
4
CFA Institute Compensation Study – Executive Summary September 2019

Respondent Profile Findings and Insights
• The 2019 CFA Institute Compensation Survey received a
proportionally comparable response rate relative to the full CFA
Institute member/charterholder profile.
• Respondent profile was generally concentrated in a few
markets: the top five markets (the United States, Canada,
United Kingdom, China, and Switzerland) accounted for more
than 70% of respondents.
• Portfolio management and research roles are the most
ubiquitous roles across regions; however, there is a diverse
range of respondent roles.
• The majority of respondents receive a salary and cash
bonus, at a minimum. In the majority of cases, the highest
level of education achieved (in addition to the CFA®
designation) was a bachelor’s degree. 97% of respondents
hold the CFA designation.
33% of respondents work in large firms (5,000+ employees)
Portfolio Management and Research Roles
Portfolio Management Research
Employer Size (Headcount)
Americas
Asia Pacific
EMEA
Global Markets by Respondent Percentage (n=4,556)
24%
61%15%
0
10%
20%
30%
40%
Americas Asia Pacific EMEA
3%2%
7%
16%
6%
3%
0
10%
20%
30%
40%
5,000or more
2,500to 4,999
500to 2,499
250to 499
50to 249
Fewerthan 50
8%7%
33%
15% 15%
22%
5
CFA Institute Compensation Study – Executive Summary September 2019

Respondent Profile Findings and Insights
• Functions Profile
• Experience Profile
• Firm Size Profile
• Industry Type Profile
• Seniority Level Profile
• Education Level Profile
6
CFA Institute Compensation Study – Executive Summary September 2019

Functions ProfileThe most prevalent function across the regions was portfolio management, and buy-side research roles was the most prevalent focus area.
Asia Pacific has a more balanced weighting between portfolio management (PM) and research roles.
The Americas and EMEA, however, both exhibit a higher proportion of roles in PM versus the research function.
Equities and fixed income were the two most prevalent areas within the portfolio management function. Within the
research function, the most prevalent focus area was buy-side research (76%) versus sell-side research (24%).
Job Functions by Region (n=15,006)
Americas Asia Pacific EMEA
Portfolio Management Function by Focus Area (n=3,688)
Equities Fixed Income Multi-Asset Class
Individual and Trust Accounts Manager of Managers
Private Equity Other
Research Function by Focus Area (n=1,870)
Buy-Side Research Sell-Side Research
Portfolio Management
Research
Consulting
Risk Analysis / Management
Investment Strategy
Relationship Management -Wealth Management
Credit Analysis
Chief Investment Officer (CIO)
Trading
Accounting / Audit
Financial Planner
Chief Financial Officer (CFO)
Investment PerformanceAnalysis
Chief Executive Officer (CEO)
Information Technology
Research Sales
Compliance
Professor / Academic
Economist
Regulator
Financial Examiner
0 500 1000 1500 2000 2500 3000 3500 4000
25%
12%
10%
7%
7%
5%
5%
4%
4%
4%
3%
3%
3%
2%
2%
2%
1%
1%
25%
1%
0%
25%
20%
19%
11%
7%
6%
12%
76%
24%
7
CFA Institute Compensation Study – Executive Summary September 2019

Experience ProfileThe most prevalent job experience range globally was 10 to less than 20 years, with the exception of Asia Pacific, which had a less experienced respondent profile.
The Americas region has the highest number of the most tenured
respondents (2,175), in part because CFA Institute was initially
established in the United States before expanding into other
global regions.
Asia Pacific varied from EMEA and the Americas in that there
were fewer tenured respondents (“20 years or more”) and a
greater amount of less experienced respondents (“0 to less than
5 years”). This shows a generally less experienced respondent
profile across the Asia Pacific region.
Years of Experience by Region and Respondent Percentage
Americas Asia Pacific EMEA
Respondents’ Years of Experience by Region
Americas Asia Pacific EMEA
0 to less than5 years
5 years to lessthan 10 years
10 years to lessthan 20 years
20 yearsor more
10%
33%
38%
19%
0 to less than5 years
5 years to lessthan 10 years
10 years to lessthan 20 years
20 yearsor more
0
20
40
60
80
10027% 17%26%25%
60%
76%
55%54%
13%
7%
19%21%
8
CFA Institute Compensation Study – Executive Summary September 2019
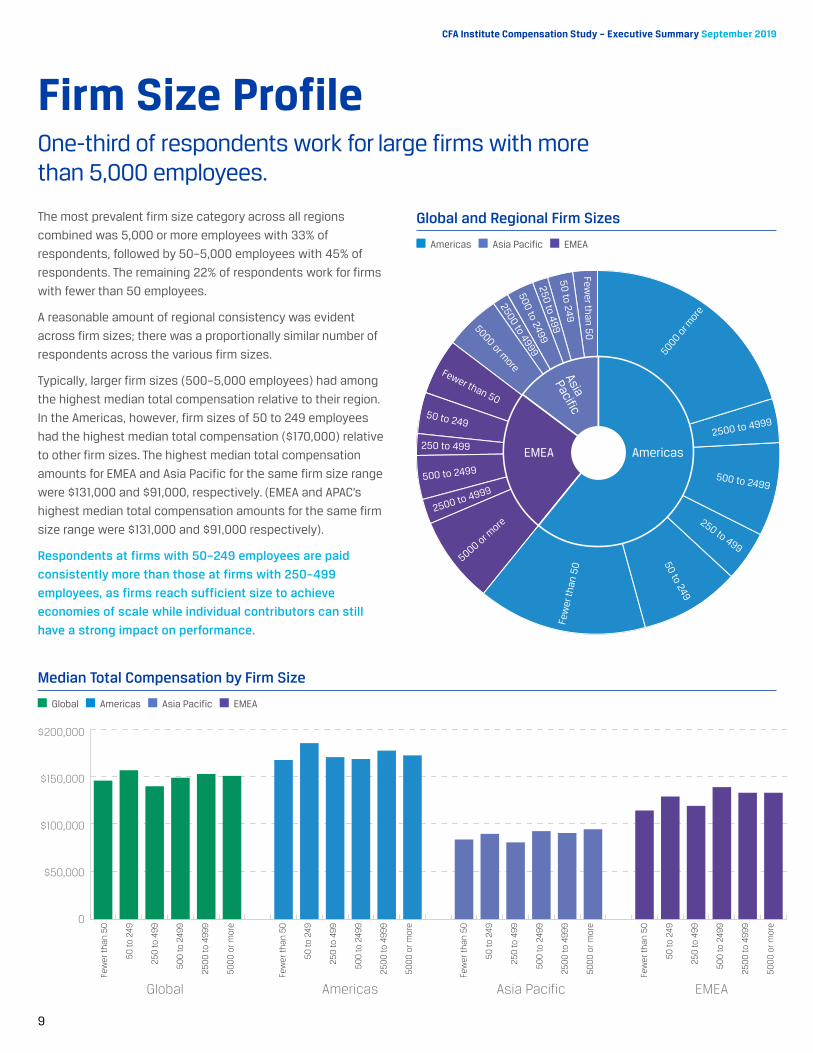
Firm Size ProfileOne-third of respondents work for large firms with more than 5,000 employees.
The most prevalent firm size category across all regions
combined was 5,000 or more employees with 33% of
respondents, followed by 50–5,000 employees with 45% of
respondents. The remaining 22% of respondents work for firms
with fewer than 50 employees.
A reasonable amount of regional consistency was evident
across firm sizes; there was a proportionally similar number of
respondents across the various firm sizes.
Typically, larger firm sizes (500–5,000 employees) had among
the highest median total compensation relative to their region.
In the Americas, however, firm sizes of 50 to 249 employees
had the highest median total compensation ($170,000) relative
to other firm sizes. The highest median total compensation
amounts for EMEA and Asia Pacific for the same firm size range
were $131,000 and $91,000, respectively. (EMEA and APAC’s
highest median total compensation amounts for the same firm
size range were $131,000 and $91,000 respectively).
Respondents at firms with 50–249 employees are paid
consistently more than those at firms with 250–499
employees, as firms reach sufficient size to achieve
economies of scale while individual contributors can still
have a strong impact on performance.
Global and Regional Firm Sizes
Americas Asia Pacific EMEA
Median Total Compensation by Firm Size
Global Americas Asia Pacific EMEA
AmericasEMEA
Asia
Pacific
5000 or m
ore
2500 to 4999
500 to 2499
250 to 499
50 to 249
Few
er t
han
50
5000 or more
2500 to 4999
500 to 2499
250 to 499
50 to 249
Fewer than 50
5000 or more
2500 to 4999500 to 2499
250 to 4995
0 to 24
9
Fewer th
an 50
AmericasGlobal Asia Pacific EMEA
0
$50,000
$100,000
$150,000
$200,000
Few
er t
han
50
50
to 2
49
250
to 4
99
50
0 to
24
99
250
0 to
49
99
50
00
or
mor
e
Few
er t
han
50
50
to 2
49
250
to 4
99
50
0 to
24
99
250
0 to
49
99
50
00
or
mor
e
Few
er t
han
50
50
to 2
49
250
to 4
99
50
0 to
24
99
250
0 to
49
99
50
00
or
mor
e
Few
er t
han
50
50
to 2
49
250
to 4
99
50
0 to
24
99
250
0 to
49
99
50
00
or
mor
e
9
CFA Institute Compensation Study – Executive Summary September 2019

Industry Type ProfileThe asset management industry is the most common industry for respondents followed by wealth management and commercial banking.
More than two-thirds (66%) of respondents work in one of four
industries — asset management, private wealth management,
commercial banking, and investment banking.
35% of all respondents currently work full time in an asset
management organization in one of the following subfunctions:
mutual fund, hedge fund, private equity, venture capital,
investment firm, or real estate investment firm.
Firms with more than $100 billion in assets under management
(AUM), the largest category included in the study, employ about
30% of respondents in the asset management industry.
In the asset management industry globally, the median firm’s
AUM is $75 billion and the average firm’s AUM is $300 billion.
Only 20 firms have AUMs of more than $1 trillion. The median
AUM for respondents’ firms falls above the median for the
global asset management industry, but the median AUM for
respondents’ firms falls below the average for the global asset
management industry.
Industry Type by Respondent Count
Top 4 IndustriesAccount for ~66%of Respondents
Breakdown ofAsset Management
Industry Respondentsby AUMs
0
5
10
15
20
25
30
35
Less
tha
n $5
00
M
$50
0M
to le
ss t
han
$2B
N
$2B
N to
less
tha
n $1
0B
N
$10
BN
to le
ss t
han
$50
BN
$50
BN
to le
ss t
han
$10
0B
N
$10
0B
N o
r m
ore
N/A
Asse
t M
anag
emen
t
Priv
ate
Wea
lth M
anag
emen
t
Com
mer
cial
Ban
k
Inve
stm
ent
Ban
k
Con
sulti
ng F
irm
Insu
ranc
e
Asse
t O
wne
r
Bro
kera
ge
Info
rmat
ion
Tech
nolo
gy
or S
oftw
are
Util
ities
(e.g
., O
il &
Gas
, Ene
rgy)
Acco
untin
g F
irm
Gov
ernm
ent
or R
egul
ator
Oth
er
14% 14%
17% 16%
7%
30%
35%
13%11%
7%5% 5% 4% 4%
2% 2% 2% 2%
7%
2%
10
CFA Institute Compensation Study – Executive Summary September 2019

Seniority Level ProfileMore than half of the respondents in the Americas are now at management levels and above.
The respondent profile in Asia Pacific skews toward lower seniority levels, with 53% at the entry or intermediate levels.
In the Americas, however, where CFA Institute was first established, more than half of respondents (54%) were at management
levels and above.
In EMEA, the respondent profile was in between these two regions.
Seniority by Region
Americas Asia Pacific EMEA
Americas Asia Pacific EMEA
0
5%
10%
15%
20%
25%
30%
Entr
y /
Sup
por
t
Inte
rmed
iate
Pro
fess
iona
l
Sen
ior
Pro
fess
iona
l
Man
agem
ent
Sen
ior
Man
agem
ent
Exec
utiv
e
Sen
ior
Exec
utiv
e
Entr
y /
Sup
por
t
Inte
rmed
iate
Pro
fess
iona
l
Sen
ior
Pro
fess
iona
l
Man
agem
ent
Sen
ior
Man
agem
ent
Exec
utiv
e
Sen
ior
Exec
utiv
e
Entr
y /
Sup
por
t
Inte
rmed
iate
Pro
fess
iona
l
Sen
ior
Pro
fess
iona
l
Man
agem
ent
Sen
ior
Man
agem
ent
Exec
utiv
e
Sen
ior
Exec
utiv
e
11
CFA Institute Compensation Study – Executive Summary September 2019

Education Level ProfileMost respondents have only a bachelor’s degree; however, we found little correlation between education level and total compensation.
Those respondents with an MBA had the highest median
total compensation ($195,000) followed by those with a
doctorate ($164,000).
Most respondents had only a bachelor’s degree; however,
counterintuitively, this population had a higher median and average
total compensation than those who also have a master’s degree.
Female respondents had an 8% higher relative instance of
master’s degree attainment versus male respondents. This is
consistent with other research that a PM who is a woman is more
likely to have a CFA charter than a man.
Almost half (49%) of all professors and academics held
doctorates (the most common role for respondents with doctoral
degrees). About 24% of CIOs held MBAs and about 40% of all
economists and regulators held master’s degrees.
Highest Level of Education by Respondent Count and Median Total Compensation (n=15,006)
Median Total Compensation (bottom) Count (top)
Highest Education Level by Gender
Bachelor's Master's MBA PhD
Female (n=2,026)
Male (n=8,093)
Bachelor’s
Master’s
MBA
PhD
0 $60k $120k $180k $240k $300k
2000 4000 6000 8000 10000
54%
29%
15%2%
62%
21%
15%2%
12
CFA Institute Compensation Study – Executive Summary September 2019

Compensation Findings and Insights
• Total Compensation
• Incentive Opportunity
• Salary
13
CFA Institute Compensation Study – Executive Summary September 2019

Senior Portfolio Managers - Total Compensation Quartiles by Region (n=900)
High / Low Quartile Median
Portfolio Management - Total Compensation Quartiles by Region - All Seniorities (n=3,688)
High / Low Quartile Median
Total CompensationAmericas senior PM pay is 4% higher than EMEA and 12% higher than Asia Pacific pay levels.
The Americas markets exhibit higher quartile and median total
compensation relative to both EMEA and Asia Pacific.
The high to low quartile pay differential is greatest in the Asia
Pacific region at 133%, versus 29% in the Americas and 35%
for EMEA. This range differential indicates a tighter, more
established pay range for both the Americas and EMEA.
Across all combined seniority levels, a similar trend was
apparent in pay levels across regions; however, the high to
low quartile ranges increased in all regions because of the
inclusion of junior- and executive-level respondents combined
in the sample.
Americas Asia Pacific EMEA0
$70,000
$140,000
$210,000
$280,000
$350,000
Americas Asia Pacific EMEA0
$70,000
$140,000
$210,000
$280,000
$350,000
14
CFA Institute Compensation Study – Executive Summary September 2019

Median Total Compensation for Management Level Roles by Regions
Individual Investment Relationship Management Portfolio Management
Institutional portfolio managers at the management and executive levels have higher pay than retail portfolio managers.
Pay for institutional PMs is higher than individual investment RMs
at the management and executive levels (although this was not
always apparent at more junior and intermediate levels).
Salary growth was higher, however, for the “retail” wealth
management PMs in both the Americas and Asia Pacific, which
is indicative of the fact that the wealth management industry
has been growing strongly in the United States and Asia Pacific.
Institutional PM Roles
As previously alluded to, the institutional business has been
subject to pressures in the United States and EMEA. The rise of
index funds and the outflows from active to passive strategies
have reduced firms’ revenues and put pressure on pay.
In Asia Pacific, however, institutional PMs have been able to add
strong value because of less efficient markets, strong economic
growth, and less transparent flow of information, which allows
analysts to add value through robust research.
Respondents’ median total compensation at management levels
are highest in Asia Pacific versus in the Americas and EMEA. They
also exhibit the highest premium over individual investment RM
pay relative to other regions.
0
$100,000
$200,000
$300,000
$400,000
Americas Asia Pacific EMEA
900
245
350
900
+33%
+57%
+19%
700150
500
2813
3448
1500
2200
15
CFA Institute Compensation Study – Executive Summary September 2019
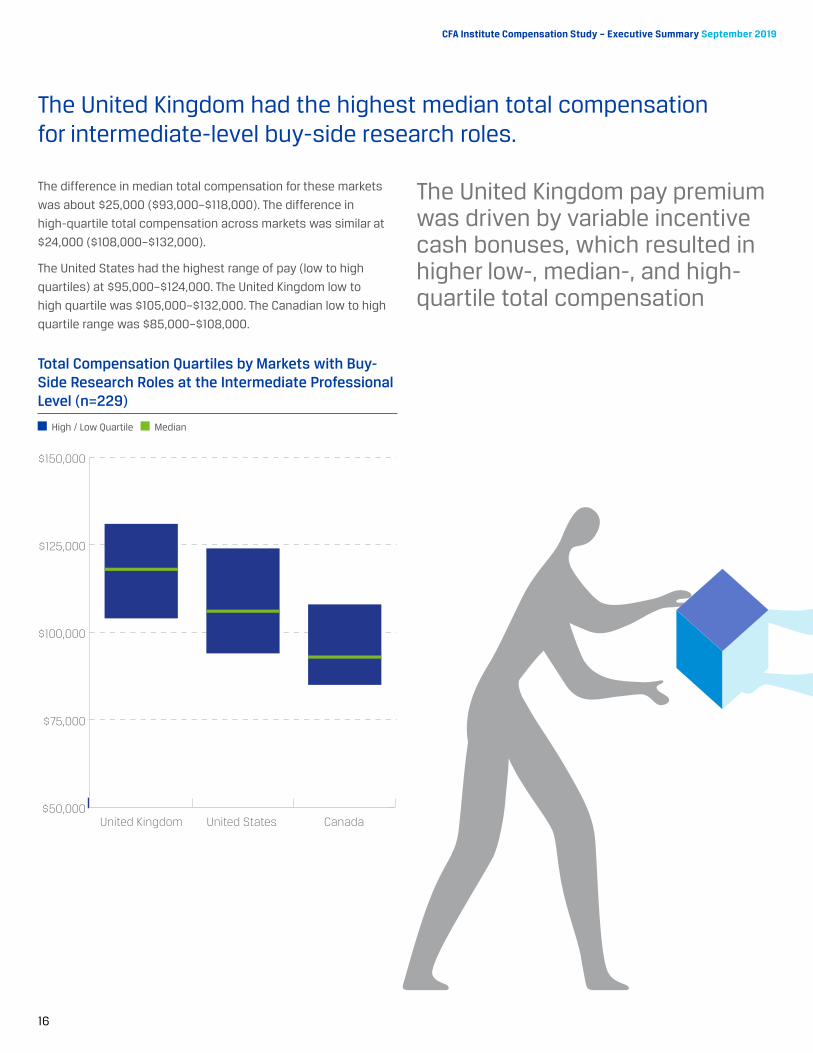
Total Compensation Quartiles by Markets with Buy-Side Research Roles at the Intermediate Professional Level (n=229)
High / Low Quartile Median
The United Kingdom had the highest median total compensation for intermediate-level buy-side research roles.
The difference in median total compensation for these markets
was about $25,000 ($93,000–$118,000). The difference in
high-quartile total compensation across markets was similar at
$24,000 ($108,000–$132,000).
The United States had the highest range of pay (low to high
quartiles) at $95,000–$124,000. The United Kingdom low to
high quartile was $105,000–$132,000. The Canadian low to high
quartile range was $85,000–$108,000.
The United Kingdom pay premium was driven by variable incentive cash bonuses, which resulted in higher low-, median-, and high-quartile total compensation
United Kingdom United States Canada$50,000
$75,000
$100,000
$125,000
$150,000
16
CFA Institute Compensation Study – Executive Summary September 2019

*About 20% of respondents within HF and PE focus areas had profit-sharing or partnership agreements, which were not included in the total compensation calculation (as per our methodology). The sample size of this population was insufficient to draw conclusions on the impact of including these additional components of pay.
Senior real estate and hedge fund PMs have the highest median total compensation versus other PM focus areas.
There was sufficient data available for the United States portfolio
management market and function to compare roles across a single
seniority level, the senior professionals level.
Senior real estate (RE) and hedge fund (HF) PMs have the highest
median pay relative to other focus areas at this seniority level in
the United States. Private equity (PE) pay was also comparable,
exhibiting higher top-quartile pay versus HFs.*
HF pay tends to be more formulaic and based on annual returns,
unlike PE and RE for which funds are locked up for 5–10 years
in long-term plays. HFs also have been somewhat hindered by
strong equity markets, and they typically outperform with higher
levels of volatility in the markets.
US Portfolio Management - Senior Professionals Median Total Compensation by Focus Areas (n=414)
High / low quartile Median
RealEstate
HedgeFunds
OtherPrivateEquity
FixedIncome
Individual &Trust Account
Equities Manager ofManagers
Multi-AssetClass
Passive /Indexed
Quantitative
$125,000
$150,000
$175,000
$200,000
$225,000
17
CFA Institute Compensation Study – Executive Summary September 2019

US Research Function (All Seniorities) Total Compensation by Focus Areas (n=835)
High / Low Quartile Median
Buy-side fixed-income research has a higher median total compensation than sell-side roles (~19%), but equity research roles were similarly compensated.
Across the United States, the fixed income focus area within the
research function had the highest median total compensation of
all focus areas in the function ($208,000).
Buy-side fixed-income research roles had higher median and
top-quartile pay as well as a greater range of pay versus sell-side
fixed-income roles.
Buy-side equity research roles had similar pay to the sell-side
roles, but the range of pay on the buy-side was wider with a
larger sample size.
Equities business’s profitability on both the buy and sell-side
has been hindered more recently because of technological
capabilities in which equities trading (which historically has
funded equity research divisions) is moving to low-cost, low-
touch automated channels.
This shift could be indicative of future trends in pay as
the majority of respondents on the United States sell-side
currently were focused on equities (73%). On the the United
States buy-side, the largest single focus area was also
equities (46%).
Fixed Income
Equities Hedge Quantitative Multi-Asset RealEstate
PrivateEquity
Other Equities FixedIncome
Multi-Asset
Buy-Side Research Sell-Side Research
$100,000
$150,000
$200,000
$250,000
$300,000
$350,000
18
CFA Institute Compensation Study – Executive Summary September 2019
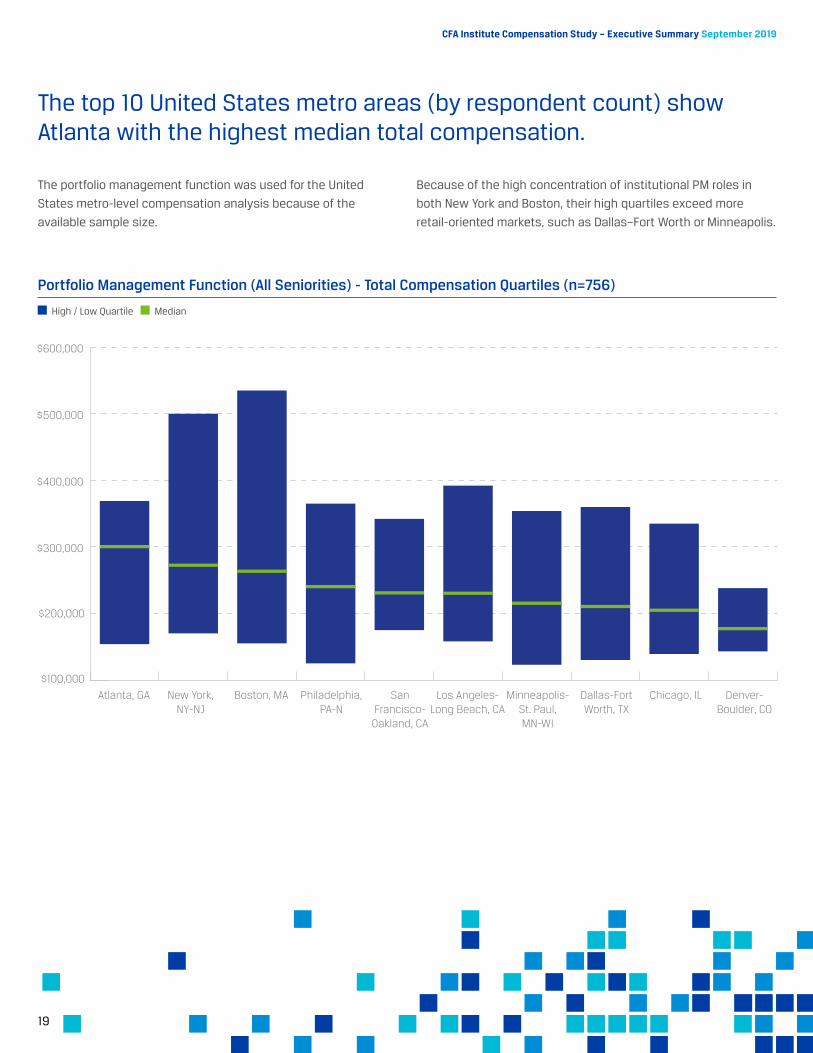
Portfolio Management Function (All Seniorities) - Total Compensation Quartiles (n=756)
High / Low Quartile Median
The top 10 United States metro areas (by respondent count) show Atlanta with the highest median total compensation.
The portfolio management function was used for the United
States metro-level compensation analysis because of the
available sample size.
Because of the high concentration of institutional PM roles in
both New York and Boston, their high quartiles exceed more
retail-oriented markets, such as Dallas–Fort Worth or Minneapolis.
Atlanta, GA New York,NY-NJ
Boston, MA Philadelphia,PA-N
SanFrancisco-
Oakland, CA
Los Angeles-Long Beach, CA
Minneapolis-St. Paul,MN-WI
Dallas-FortWorth, TX
Chicago, IL Denver-Boulder, CO
$100,000
$200,000
$300,000
$400,000
$500,000
$600,000
19
CFA Institute Compensation Study – Executive Summary September 2019
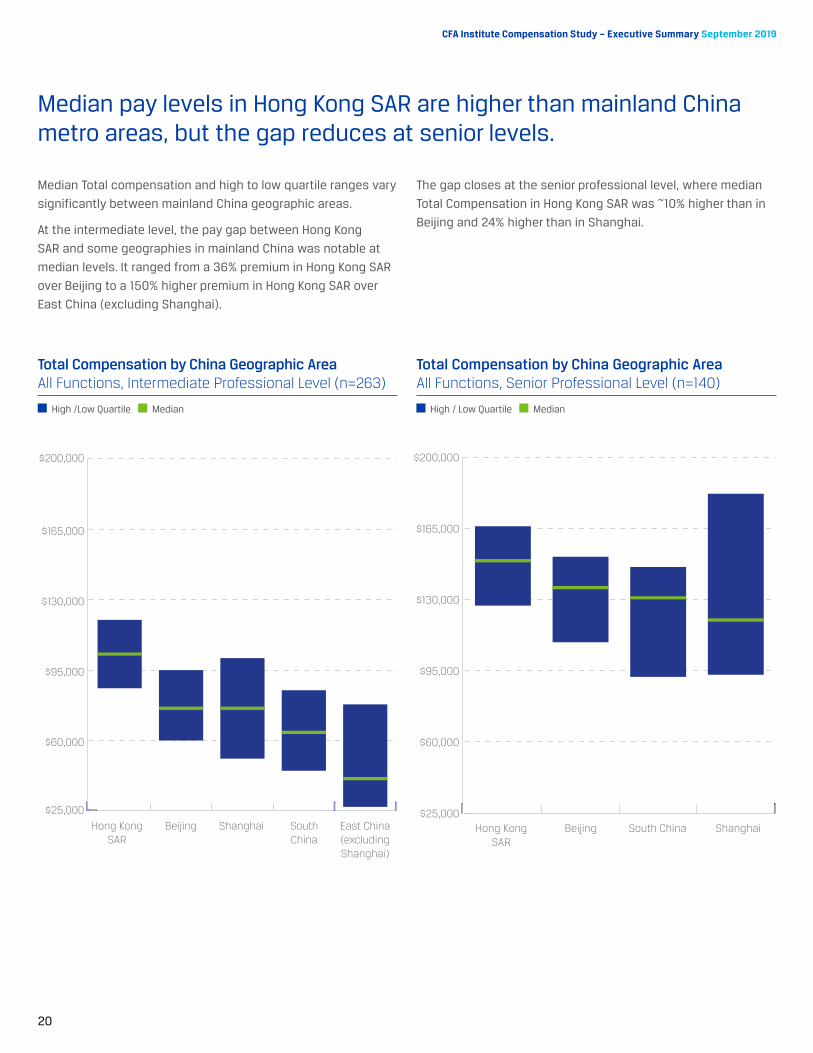
Total Compensation by China Geographic Area All Functions, Intermediate Professional Level (n=263)
High /Low Quartile Median
Total Compensation by China Geographic Area All Functions, Senior Professional Level (n=140)
High / Low Quartile Median
Median pay levels in Hong Kong SAR are higher than mainland China metro areas, but the gap reduces at senior levels.
Median Total compensation and high to low quartile ranges vary
significantly between mainland China geographic areas.
At the intermediate level, the pay gap between Hong Kong
SAR and some geographies in mainland China was notable at
median levels. It ranged from a 36% premium in Hong Kong SAR
over Beijing to a 150% higher premium in Hong Kong SAR over
East China (excluding Shanghai).
The gap closes at the senior professional level, where median
Total Compensation in Hong Kong SAR was ~10% higher than in
Beijing and 24% higher than in Shanghai.
Hong KongSAR
Beijing Shanghai East China(excludingShanghai)
SouthChina
$25,000
$60,000
$95,000
$130,000
$165,000
$200,000
Hong KongSAR
Beijing South China Shanghai$25,000
$60,000
$95,000
$130,000
$165,000
$200,000
20
CFA Institute Compensation Study – Executive Summary September 2019

Intermediate Professional Level PM Median Total Compensation Analysis for the Portfolio Management Function (n=855)
Male Median Total Compensation Female Median Total Compensation
Management Level PM Median Total Compensation Analysis for the Portfolio Management Function (n=970)
Male Median Total Compensation Female Median Total Compensation
The apparent portfolio manager pay disparity across gender appears to normalize with seniority.
In EMEA at the intermediate professional level of seniority,
women exhibit a premium in total compensation (4%) for the
PM role; however, this normalizes at the management level to a
2% premium.
In Asia Pacific, women are paid less than men (~10%) at the
intermediate level for PMs. The sample size was insufficient at
the management level in the Asia Pacific region for comparison.
Conclusions on gender pay comparison are directional given the
limited sample size, which did not allow for other factors—for
example, PM specialization, qualifications, years of experience,
and others—to be taken into consideration.
0
$100,000
$200,000
$300,000
Americas Asia Pacific EMEA
-9% +4%
-10%
0
$100,000
$200,000
$300,000
Americas Asia Pacific EMEA
Insufficientsample
size
+0%+2%
21
CFA Institute Compensation Study – Executive Summary September 2019

Compensation Findings and Insights
• Total Compensation
• Incentive Opportunity
• Salary
22
CFA Institute Compensation Study – Executive Summary September 2019

Long-Term Incentive Prevalence by Seniorities
Type of Compensation by Respondent Prevalence - Global All Roles Versus Senior Management Roles
All Roles Senior Management Roles
Incentive OpportunityAlthough 17% of respondents did not receive a cash bonus, the majority without a cash bonus had profit-sharing or investment partnership awards.
Across regions, the vast majority of respondents (98%) receive at
least a salary, and 83% receive a cash bonus.
About 23% of respondents receive some form of a long-term
incentive; however, this rises to about 43% when evaluating only
the senior management population across combined regions and
functions, which is typical in the general financial services market.
Long-term incentives are not always standard forms of
compensation and depend on firmwide practices related to add-on
awards or mandatory deferral (postponement) of compensation.
Long-term incentive and mandatory deferral plans are continuing
to evolve because of the changing regulatory and economic
landscape. Typically, in the general market, total incentive is the
most prevalent practice for determining eligibility for long-term
incentives followed by title, level, and job grade.
0 10% 20% 30% 40% 50%
Entry / Support
IntermediateProfessional
Senior Professional
Management
Executive
Senior Executive
Senior Management
6%
9%
16%
32%
34%
42%
43%
0
10%
20%
30%
40%
50%
60%
70%
80%
90%
100%
Base Salary Cash Bonus Long-TermIncentives
Profit Sharingor InvestmentPartnership
Other Compensation(Allowances)
88%
98% 97%
23%
43%
15%
83%
13%
6% 5%
23
CFA Institute Compensation Study – Executive Summary September 2019

Average Variable Compensation % of Salary
Americas Asia Pacific EMEA
Intermediate-level respondents in Asia Pacific had higher average variable pay relative to EMEA and the Americas, which was driven by lower salaries.
Pay structure analysis shows differences across key functions
and seniorities. Relative to EMEA and Asia Pacific, the Americas
tend to have higher pay, driven by incentives, for management
and executive-level roles.
Absolute pay levels in Asia Pacific are typically lower relative
to other regions for a given role, especially at lower levels of
seniority. Variable pay (e.g., cash incentives) is often used
to improve pay differentiation and reward top-performing
individuals through employee incentive plans.
This practice is apparent in both the portfolio management and
research functions at the intermediate levels, for which base
salaries were lower in Asia Pacific relative to counterparts in
other regions.
Portfolio Management Research
0
20%
40%
60%
80%
100%
Intermediate Professional
Senior Professional Management Intermediate Professional
Senior Professional Management
26%
46%
21%
44%
54%
46%
88%81%
77%
31%
64%
34%
53%57%
69%
78%
64%69%
24
CFA Institute Compensation Study – Executive Summary September 2019

Compensation Findings and Insights
• Total Compensation
• Incentive Opportunity
• Salary
25
CFA Institute Compensation Study – Executive Summary September 2019

*Source: AON 2018 Salary Increase Survey
YoY (2018–2019) Average Change in Base Salary
Americas Asia Pacific EMEA
YoY (2018–2019) Average Change in Salary by Regions and Gender
Male Median Total Compensation Female Median Total Compensation
SalaryRespondents’ average base salaries increased at a greater rate (YoY) than the general market’s rate of increase.
YoY average change in base salary showed some variance
across regions, from 4.9% (across the Americas) to 6.8% (across
Asia Pacific).
Respondent results in the United States (4.8%), Canada (4.9%),
and the United Kingdom (6.2%) are notably higher than the 2018–
19 annual salary growth rate of 3%, 2.8%, and 2.9% observed in
the general market* across the same countries. Respondents
may be more successful and earn higher salary increases than the
general market, or this result may indicate a bias in the respondent
profile (whereby those who recently experienced a strong rise
in salary responded in greater proportions to those with lower
increases, in anticipation of comparing their new salary alignment
and positioning against others).
Women in Asia Pacific had the highest average YoY salary
increase (7.6%) from any region. This was particularly apparent
at the entry and support levels of seniority, where average YoY
salary increases were about 10%.
0 2% 4% 6% 8%
Americas
EMEA
Asia Pacific
Change in Base Salary %
4.9%
5.6%
6.8%
0
2
4
6
8
Americas Asia Pacific EMEA
4.8%4.9%
5.6%
5%
6.6%
7.6%
Ch
ange
in S
alar
y %
26
CFA Institute Compensation Study – Executive Summary September 2019

*Source: Institute for New Economic Thinking: https://www.ineteconomics.org/perspectives/blog/brics-to-play-a-leading-role-in-driving-future-global-economic-growth
YoY (2018-2019) % Change in Average Salary (n=13,031) Displaying Markets with >100 Respondents
Average Value (5.7%)
For markets with greater than 100 respondents, Switzerland had the lowest YoY average change in base salary (3.3%) and India had the highest (9.8%).
When selecting markets with more than 100 respondents each, the range is from 3.3% to 9.8% for YoY average changes in
base salary from 2018 to 2019.
Growth is particularly strong in India, South Africa, Brazil, and China relative to other markets with more than 100 respondents.
This is consistent with economists’ view that the economies in BRICS (Brazil, Russia, India, China, and South Africa) continue
to be a key driver of global per capita growth and currently account for 30.4% of the world’s gross national product.*
(Russia had fewer than 100 respondents so is not represented in this exhibit. Their average YoY change in salary was 7.9%,
which was comparable to the general market, for which salaries were up about 7% in 2018.)
0%
3%
6%
9%
12%
Ind
ia
Sou
th A
fric
a
Bra
zil
Mai
nlan
d C
hina
Hon
g K
ong
SAR
Gre
at B
ritai
n
Sin
gap
ore
Net
herla
nds
Can
ada
Aust
ralia
Uni
ted
Sta
tes
Fran
ce
Sp
ain
Ger
man
y
Uni
ted
Ara
b E
mira
tes
Switz
erla
nd
Strong BRICS EconomyYoY Wage Growth
Cha
nge
in S
alar
y %
27
CFA Institute Compensation Study – Executive Summary September 2019
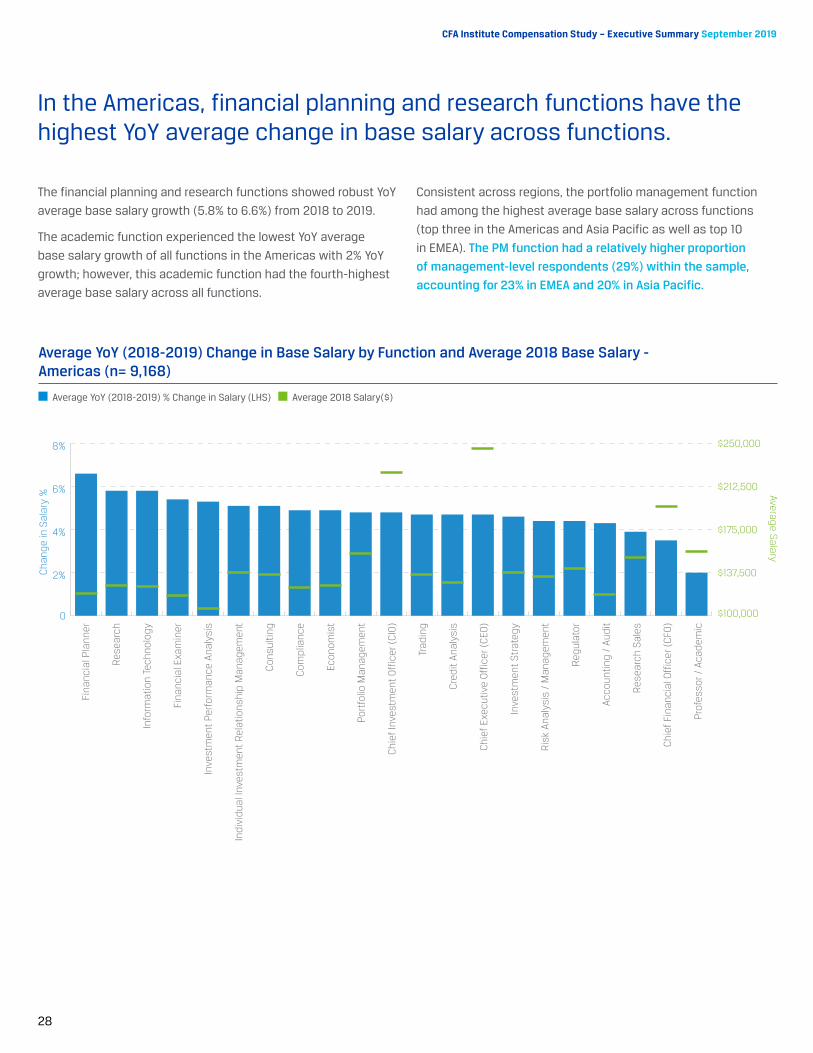
Average YoY (2018-2019) Change in Base Salary by Function and Average 2018 Base Salary - Americas (n= 9,168)
Average YoY (2018-2019) % Change in Salary (LHS) Average 2018 Salary($)
In the Americas, financial planning and research functions have the highest YoY average change in base salary across functions.
The financial planning and research functions showed robust YoY
average base salary growth (5.8% to 6.6%) from 2018 to 2019.
The academic function experienced the lowest YoY average
base salary growth of all functions in the Americas with 2% YoY
growth; however, this academic function had the fourth-highest
average base salary across all functions.
Consistent across regions, the portfolio management function
had among the highest average base salary across functions
(top three in the Americas and Asia Pacific as well as top 10
in EMEA). The PM function had a relatively higher proportion
of management-level respondents (29%) within the sample,
accounting for 23% in EMEA and 20% in Asia Pacific.
0
2%
4%
6%
8%
Fina
ncia
l Pla
nner
Res
earc
h
Info
rmat
ion
Tech
nolo
gy
Fina
ncia
l Exa
min
er
Inve
stm
ent
Perf
orm
ance
Ana
lysi
s
Ind
ivid
ual I
nves
tmen
t R
elat
ions
hip
Man
agem
ent
Con
sulti
ng
Com
plia
nce
Econ
omis
t
Por
tfol
io M
anag
emen
t
Chi
ef In
vest
men
t O
ffic
er (
CIO
)
Trad
ing
Cre
dit
Anal
ysis
Chi
ef E
xecu
tive
Off
icer
(C
EO)
Inve
stm
ent
Str
ateg
y
Ris
k An
alys
is /
Man
agem
ent
Reg
ulat
or
Acco
untin
g /
Aud
it
Res
earc
h S
ales
Chi
ef F
inan
cial
Off
icer
(C
FO)
Pro
fess
or /
Aca
dem
ic
$100,000
$137,500
$175,000
$212,500
$250,000
Cha
nge
in S
alar
y % Averag
e Salary
28
CFA Institute Compensation Study – Executive Summary September 2019
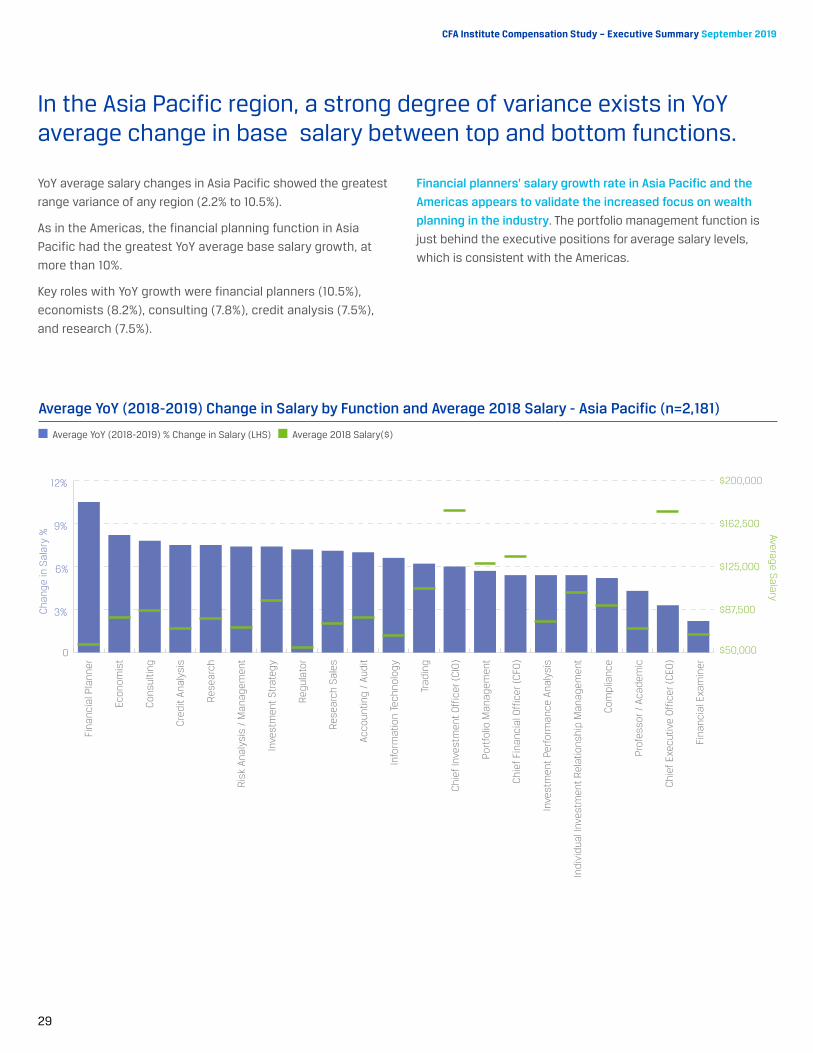
In the Asia Pacific region, a strong degree of variance exists in YoY average change in base salary between top and bottom functions.
YoY average salary changes in Asia Pacific showed the greatest
range variance of any region (2.2% to 10.5%).
As in the Americas, the financial planning function in Asia
Pacific had the greatest YoY average base salary growth, at
more than 10%.
Key roles with YoY growth were financial planners (10.5%),
economists (8.2%), consulting (7.8%), credit analysis (7.5%),
and research (7.5%).
Financial planners’ salary growth rate in Asia Pacific and the
Americas appears to validate the increased focus on wealth
planning in the industry. The portfolio management function is
just behind the executive positions for average salary levels,
which is consistent with the Americas.
Average YoY (2018-2019) Change in Salary by Function and Average 2018 Salary - Asia Pacific (n=2,181)
Average YoY (2018-2019) % Change in Salary (LHS) Average 2018 Salary($)
0
3%
6%
9%
12%
Fina
ncia
l Pla
nner
Econ
omis
t
Con
sulti
ng
Cre
dit
Anal
ysis
Res
earc
h
Ris
k An
alys
is /
Man
agem
ent
Inve
stm
ent
Str
ateg
y
Reg
ulat
or
Res
earc
h S
ales
Acco
untin
g /
Aud
it
Info
rmat
ion
Tech
nolo
gy
Trad
ing
Chi
ef In
vest
men
t O
ffic
er (
CIO
)
Por
tfol
io M
anag
emen
t
Chi
ef F
inan
cial
Off
icer
(C
FO)
Inve
stm
ent
Perf
orm
ance
Ana
lysi
s
Ind
ivid
ual I
nves
tmen
t R
elat
ions
hip
Man
agem
ent
Com
plia
nce
Pro
fess
or /
Aca
dem
ic
Chi
ef E
xecu
tive
Off
icer
(C
EO)
Fina
ncia
l Exa
min
er
$50,000
$87,500
$125,000
$162,500
$200,000
Cha
nge
in S
alar
y % Averag
e Salary
29
CFA Institute Compensation Study – Executive Summary September 2019

In the EMEA region, strong variance exists in YoY average change in base salary across functions.
The research sales and trading functions both showed strong
YoY average change in salary growth (≥8%) from 2018 to 2019.
The financial planning function was also the highest function in
Asia Pacific in terms of YoY average base salary growth — this
function had more than 10% growth.
Research sales salaries in EMEA appear to be increasingly driven
by the Markets in Financial Instruments Directive (MiFID) demand
for research sales roles in the region.
The research function (position five in EMEA) was also
positioned within the top five functions across both Asia Pacific
and in the Americas.
In EMEA, the individual investment relationship management
function had a higher average salary than the portfolio
management function. EMEA had a larger proportion of
intermediate respondents within the portfolio management
function, which may have brought down average salary levels.
Average YoY (2018-2019) Change in Salary by Function and Average 2018 Salary - EMEA (n=3,657)
Average YoY (2018-2019) % Change in Salary (LHS) Average 2018 Salary($)
0
2%
4%
6%
8%
10%
Res
earc
h S
ales
Trad
ing
Con
sulti
ng
Cre
dit
Anal
ysis
Res
earc
h
Econ
omis
t
Inve
stm
ent
Perf
orm
ance
Ana
lysi
s
Acco
untin
g /
Aud
it
Fina
ncia
l Pla
nner
Por
tfol
io M
anag
emen
t
Chi
ef F
inan
cial
Off
icer
(C
FO)
Inve
stm
ent
Str
ateg
y
Chi
ef E
xecu
tive
Off
icer
(C
EO)
Ris
k An
alys
is /
Man
agem
ent
Pro
fess
or /
Aca
dem
ic
Reg
ulat
or
Chi
ef In
vest
men
t O
ffic
er (
CIO
)
Com
plia
nce
Ind
ivid
ual I
nves
tmen
t R
elat
ions
hip
Man
agem
ent
Info
rmat
ion
Tech
nolo
gy
Fina
ncia
l Exa
min
er
$50,000
$90,000
$130,000
$170,000
$210,000
$250,000
Cha
nge
in S
alar
y % Averag
e Salary
30
CFA Institute Compensation Study – Executive Summary September 2019

Appendix: About the Study
• Methodology and Sampling
• Glossary of Compensation Terms
• Compensation Analysis: Compensation Tables
31
CFA Institute Compensation Study – Executive Summary September 2019

1Qualified responses were those in full-time employment in the same position and firm for the full year (2018). 2Allowance is defined in the section “Glossary of Compensation Terms” 3 Profit-sharing is defined in the section “Glossary of Compensation Terms”
Methodology and SamplingMethodology
An online survey was conducted among all CFA Insitute members/
charterholders globally.
15,006 qualified1 responses were analyzed (representing a 9.5%
participation rate) and were then analyzed to create the 2019 CFA
Institute Compensation Study; this resulted in a margin of error of
±0.74% for a 95% confidence percentage.
• The survey requested data on numerous aspects of
compensation. In addition to covering base salary and total
compensation, the survey addressed the respondent’s level of
education and occupation. Information on the type and size of
the firm as well as the amount of assets under management
were included in the survey. The survey also captured annual
salary change data.
• Actual market pay levels may differ from those reported here
because a significant portion of the incumbents in the overall
market for some roles may not be CFA Institute members/
charterholders. In addition, this study is based on self-reported
data, which may differ from actual pay levels as a result of
respondents erroneously recalling actual pay levels.
• Compensation benchmarks have been created through the
analysis and aggregation of the survey submissions received
across geographies, functions, roles, seniorities, and various
scoping factors (e.g., years of experience, gender) where data
availability allows.
• The occupations, functions, roles, and seniority levels to be
tracked were defined precisely to provide greater consistency
of results.
Data Standardization
• The data were standardized to the extent possible, including
excluding data points that might distort the quality and
robustness of the results. This was accomplished by
including only
- individuals who were employed on a full-time basis
throughout 2018, and
- individuals who were in the same position at the same
company for the whole of 2018.
• Allowance2 amounts have been excluded from the total
compensation calculation given the small percentage of
participants who submitted values and the high degree of
variability across allowance types.
• Profit-sharing or investment partnership bonuses3 are excluded
from the total compensation calculation because of the high
variability in approaches from respondents, but they are
included as a separate compensation element for reference.
• All compensation elements and submissions have been
reviewed to confirm validity for inclusion in the compensation
calculation. Given the self-reported nature of the survey,
outlying data points and anomalies were evaluated and
assessed for reliability or exclusion (e.g., CEO or similar roles
with entry-level seniority, or individuals assumed to be covered
under expatriate pay arrangements).
32
CFA Institute Compensation Study – Executive Summary September 2019

Data Suppression and Anonymity
• The following sample size suppression rules have been applied
to the reported data, such that
- at a market level, suppression rules require a minimum of 30
respondents per market for data to be displayed for a given
function per level of seniority; and
- for additional scoped data slices within a market and
function (e.g., years of experience, gender) data are
presented for sample sizes of 10 respondents or more.
• These thresholds were set to provide participants with
the greatest amount of information while still protecting
the confidentiality of individual responses. Subsequently,
individual-level responses will remain anonymous.
• The sample sizes for some of the reported data are limited.
Consideration should be taken when interpreting the
data based on limited and smaller sample sizes, as the
results may not be representative of the total member/
charterholder population.
Data Interpretation
• Compensation components are calculated as median values
unless labeled otherwise.
• Compensation components are calculated independent
of each other (e.g., base salary and total compensation).
Therefore, total compensation may not always equal the sum
of total cash plus long-term incentives.
Defining the Terms
Allowance Amounts
Other compensation categories included in respondents’
submission included allowance amounts for the following:
- retirement contribution,
- transportation,
- health and welfare,
- education,
- other, and
- profit sharing or investment partnership.
Profit Sharing/Investment Partnership
The expected cash equivalent value of other incentives
(excluding stock options or restricted stock awards) granted for
2018 performance included the individual values of the following:
- profit-sharing agreements, and/or,
- share of practice profit if the participant is a sole owner or
partner, and/or
- investment partnership payments.
33
CFA Institute Compensation Study – Executive Summary September 2019
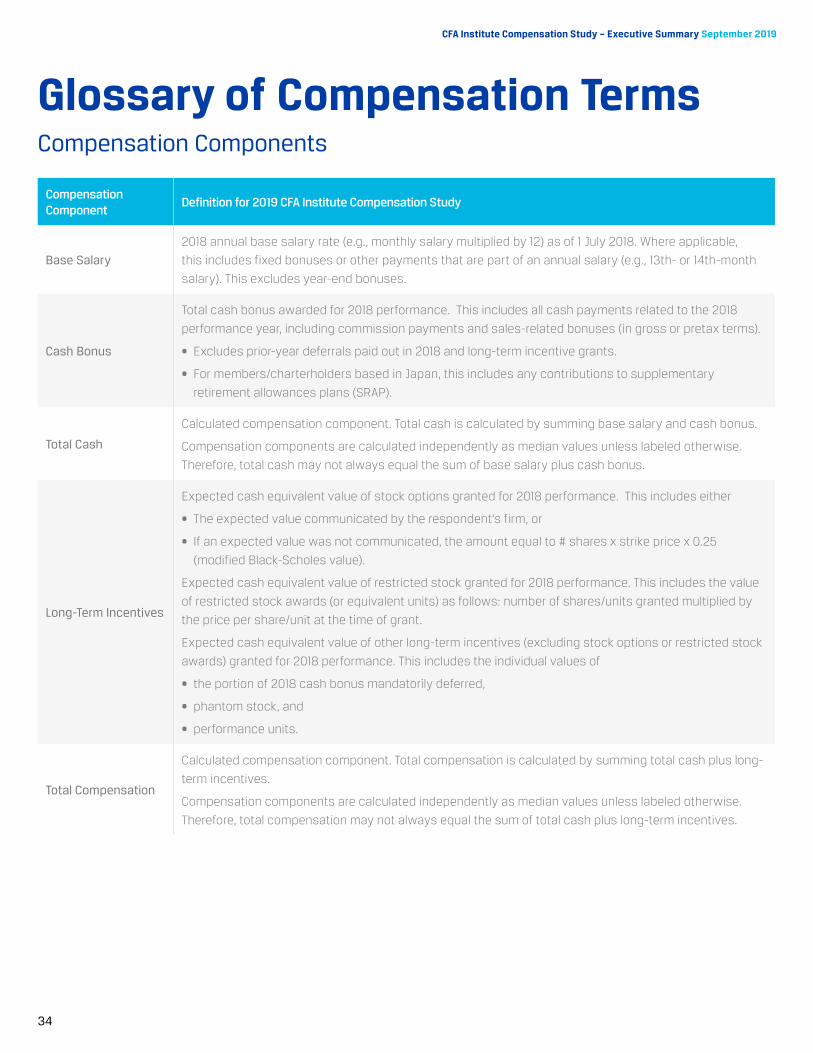
Glossary of Compensation TermsCompensation Components
Compensation Component
Definition for 2019 CFA Institute Compensation Study
Base Salary
2018 annual base salary rate (e.g., monthly salary multiplied by 12) as of 1 July 2018. Where applicable,
this includes fixed bonuses or other payments that are part of an annual salary (e.g., 13th- or 14th-month
salary). This excludes year-end bonuses.
Cash Bonus
Total cash bonus awarded for 2018 performance. This includes all cash payments related to the 2018
performance year, including commission payments and sales-related bonuses (in gross or pretax terms).
• Excludes prior-year deferrals paid out in 2018 and long-term incentive grants.
• For members/charterholders based in Japan, this includes any contributions to supplementary
retirement allowances plans (SRAP).
Total Cash
Calculated compensation component. Total cash is calculated by summing base salary and cash bonus.
Compensation components are calculated independently as median values unless labeled otherwise.
Therefore, total cash may not always equal the sum of base salary plus cash bonus.
Long-Term Incentives
Expected cash equivalent value of stock options granted for 2018 performance. This includes either
• The expected value communicated by the respondent’s firm, or
• If an expected value was not communicated, the amount equal to # shares x strike price x 0.25
(modified Black-Scholes value).
Expected cash equivalent value of restricted stock granted for 2018 performance. This includes the value
of restricted stock awards (or equivalent units) as follows: number of shares/units granted multiplied by
the price per share/unit at the time of grant.
Expected cash equivalent value of other long-term incentives (excluding stock options or restricted stock
awards) granted for 2018 performance. This includes the individual values of
• the portion of 2018 cash bonus mandatorily deferred,
• phantom stock, and
• performance units.
Total Compensation
Calculated compensation component. Total compensation is calculated by summing total cash plus long-
term incentives.
Compensation components are calculated independently as median values unless labeled otherwise.
Therefore, total compensation may not always equal the sum of total cash plus long-term incentives.
34
CFA Institute Compensation Study – Executive Summary September 2019

Compensation Component
Definition for 2019 CFA Institute Compensation Study
Allowances
Other compensation categories included in respondent’s submission, which included allowance amounts
for the following categories:
• retirement contribution,
• transportation,
• health and welfare,
• education,
• other.
Profit Sharing/
Investment
Partnership
Expected cash equivalent value of other incentives (excluding stock options or restricted stock awards)
granted for 2018 performance. This includes the individual values of:
• profit-sharing agreements, or
• share of practice profit for a sole owner or partner, or
• investment partnership payments.
Change in Salary
2018–2019
YoY change in base salary (2018–2019).
2019 annual base salary rate (e.g., monthly salary multiplied by 12) as of the most recent salary review
(typically March or April 2019). Where applicable, this includes fixed bonuses and/or other payments that
are part of an annual salary (e.g., 13th- or 14th-month salary). This excludes year-end bonuses.
Compensation Components (continued)
35
CFA Institute Compensation Study – Executive Summary September 2019

Seniority Level Definition
Senior Executive
• Firm leadership. Ultimate accountability for the firm, major functional area (e.g., portfolio
management, research), or line of business (e.g., asset management, wealth management) to the
board, owners, or shareholders.
• Drives strategic initiatives that have a material impact on firm results.
• Directs short- and long-term development of people across the firm.
• Typical titles include president, managing director, senior vice president, executive vice president,
and head of area.
• Experience for 15 or more years.
Executive
• Functional leadership. Accountable for a function or division within a firm.
• Covers the largest, most important. or most complex clients, territories, accounts, or internal
relationships, while also accountable for the function or division, including budget management.
• Directs short- and long-term department staffing needs and development at the overall function.
• Typical titles include managing director, senior vice president, head of area, and executive director.
• Experience for 15 or more years.
Senior Management
• Department manager with multiple layers. May also be the senior-most individual contributor.
• Accountable for multiple complex processes or programs, creates annual budget based on department
needs and strategy.
• Viewed as an advisor to functional leadership, negotiates change across direct area of responsibility
and others within the function.
• Directs short- and long-term department staffing needs and development.
• Typical titles include managing director, executive director, senior portfolio manager,
and senior private banker.
• Experience for 12–15 years.
Management
• Team manager of a small department or large team. May also be a senior individual contributor.
• Accountable for multiple processes or programs and may have input on the department’s budget.
• Influences timelines, expectations, and proactively negotiates across departments and sometimes
functional management.
• Develops staff for current and long-term department needs and opportunities.
• Typical titles include director, senior portfolio manager, and senior private banker.
• Experience for 8–12 years.
Seniority Levels
36
CFA Institute Compensation Study – Executive Summary September 2019
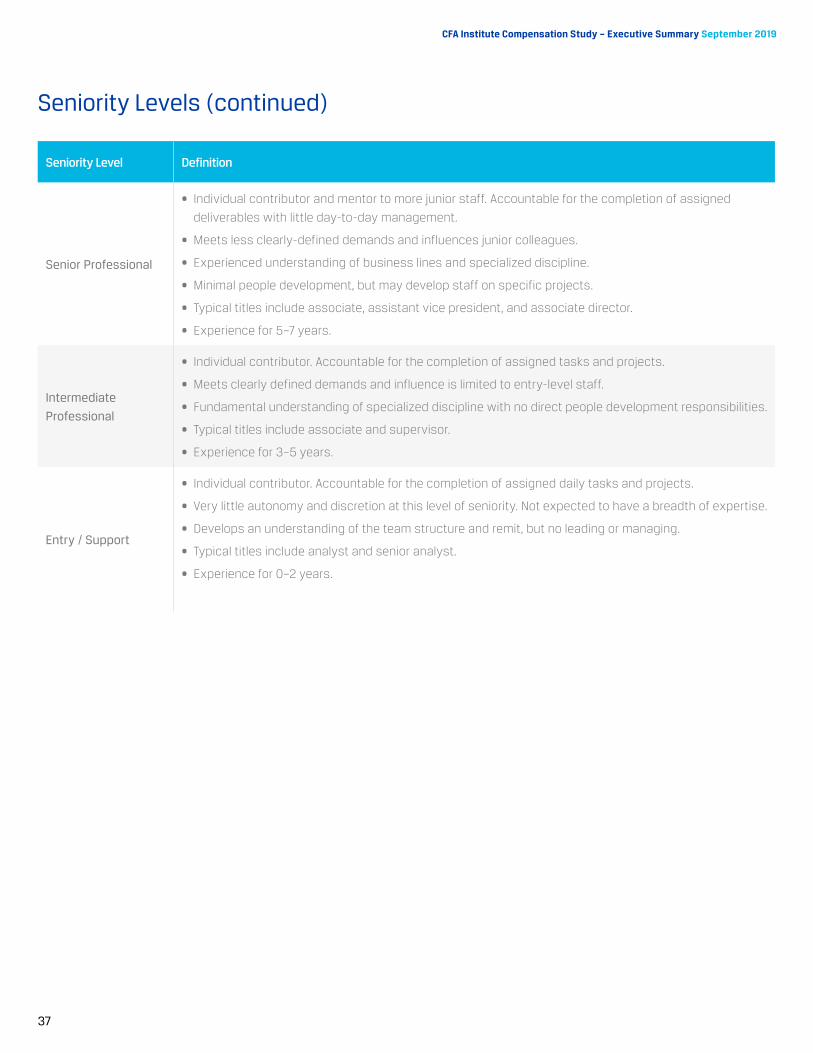
Seniority Level Definition
Senior Professional
• Individual contributor and mentor to more junior staff. Accountable for the completion of assigned
deliverables with little day-to-day management.
• Meets less clearly-defined demands and influences junior colleagues.
• Experienced understanding of business lines and specialized discipline.
• Minimal people development, but may develop staff on specific projects.
• Typical titles include associate, assistant vice president, and associate director.
• Experience for 5–7 years.
Intermediate
Professional
• Individual contributor. Accountable for the completion of assigned tasks and projects.
• Meets clearly defined demands and influence is limited to entry-level staff.
• Fundamental understanding of specialized discipline with no direct people development responsibilities.
• Typical titles include associate and supervisor.
• Experience for 3–5 years.
Entry / Support
• Individual contributor. Accountable for the completion of assigned daily tasks and projects.
• Very little autonomy and discretion at this level of seniority. Not expected to have a breadth of expertise.
• Develops an understanding of the team structure and remit, but no leading or managing.
• Typical titles include analyst and senior analyst.
• Experience for 0–2 years.
Seniority Levels (continued)
37
CFA Institute Compensation Study – Executive Summary September 2019

Function Title Function Description
Accounting / Audit
Provides accounting, process control, or tax advice to corporations, governments, or individuals.
Roles also examine data and provide actionable information on profitability, solvency, stability,
and liquidity.
Chief Executive Officer (CEO)The highest-ranking officer in an organization. The position having ultimate responsibility for the
organization’s financial and strategic success.
Chief Financial Officer (CFO)Executive responsible for managing the organization’s financial affairs, including accounting, tax,
budgeting, and treasury. Typically reports to the CEO.
Chief Investment Officer (CIO)Executive responsible for the organization’s investment results. Oversees and directs all portfolio
management, research, trading, and related investment functions. Typically reports to the CEO.
Compliance
Ensures company compliance with the rules and regulations of regulatory agencies, company
policies, and procedures are being followed and that behavior in the organization meets the
company's Standards of Conduct.
Consulting
Responsible for activities related to traditional client-facing activities at professional services firms,
including audit, financial advisory, management consulting, risk, and tax services. In addition,
consulting services includes coverage for dedicated sales functions and operational roles.
Credit Analysis
Primarily focuses on analyzing the overall financial strength and repayment ability of individual
debt issuers, and on the specific features and covenants of individual bonds. Independently
conducts fixed-income research studies. Analyses may focus on individual securities or classes
of securities. Makes buy, sell, and hold recommendations.
Economist
Responsible for studying the structure, performance, and behavior of the economy; evaluating
data on economic conditions; identifying and evaluating economic trends and their impact on the
market; and formulating forecasts of economic developments.
Financial Examiner
Establishes, monitors, reforms, or enforces industry regulations to ensure that financial institutions
are operating legally and safely, in accordance with the regulations imposed on these institutions
by the chartering level of government or agency or industry association.
Financial Planner
Responsible for developing long-term financial plans for individuals and their families. Activities
include customizing wealth plans to reflect individual client investment objectives, tax constraints,
and trust and estate considerations.
Individual Investment
Relationship Management
Serves as a relationship manager, primarily providing investment management and other
wealth-related services (e.g., trust, deposit, credit), as appropriate to individual investors and
their families. May be referred to as investment consultant, financial adviser, private banker,
relationship manager.
Function Descriptions
38
CFA Institute Compensation Study – Executive Summary September 2019

Function Title Function Description
Information Technology Responsible for activities related to the control of all information systems and technology
capabilities, both internally and externally.
Investment Performance
Analysis
Responsible for gathering and evaluating internal investment performance data against
appropriate benchmarks. Also responsible for communicating investment performance results
internally and externally.
Investment Strategy
Responsible for developing investment ideas, investment themes, and asset allocation
recommendations that are used by other investment areas within the firm. This function is
responsible for generating ideas but is not responsible for managing actual funds or portfolios.
Professor / Academic Conducts lectures and seminars and performs research in a specific field of study.
RegulatorEstablishes, monitors, reforms, or enforces industry regulations on behalf of an industry
association or government body/agency.
Research / Investment /
Quantitative Analysis
Covers activities related to the research of securities, including the publication of written reports,
buying and selling recommendations, and industry coverage expertise.
Risk Analysis / ManagementFocuses on monitoring and assessing the firm’s risk exposures (e.g., market risk, credit risk,
operational risk) and on developing strategies to mitigate potential losses.
Research SalesResponsible for the sale of competitive product and pricing research, analysis, and monitoring of
market trends.
TradingResponsible for buying and selling securities, for a specific sector or a defined group of sectors.
Manages risk, profit and loss, limits, and trading books.
Function Descriptions (continued)
39
CFA Institute Compensation Study – Executive Summary September 2019
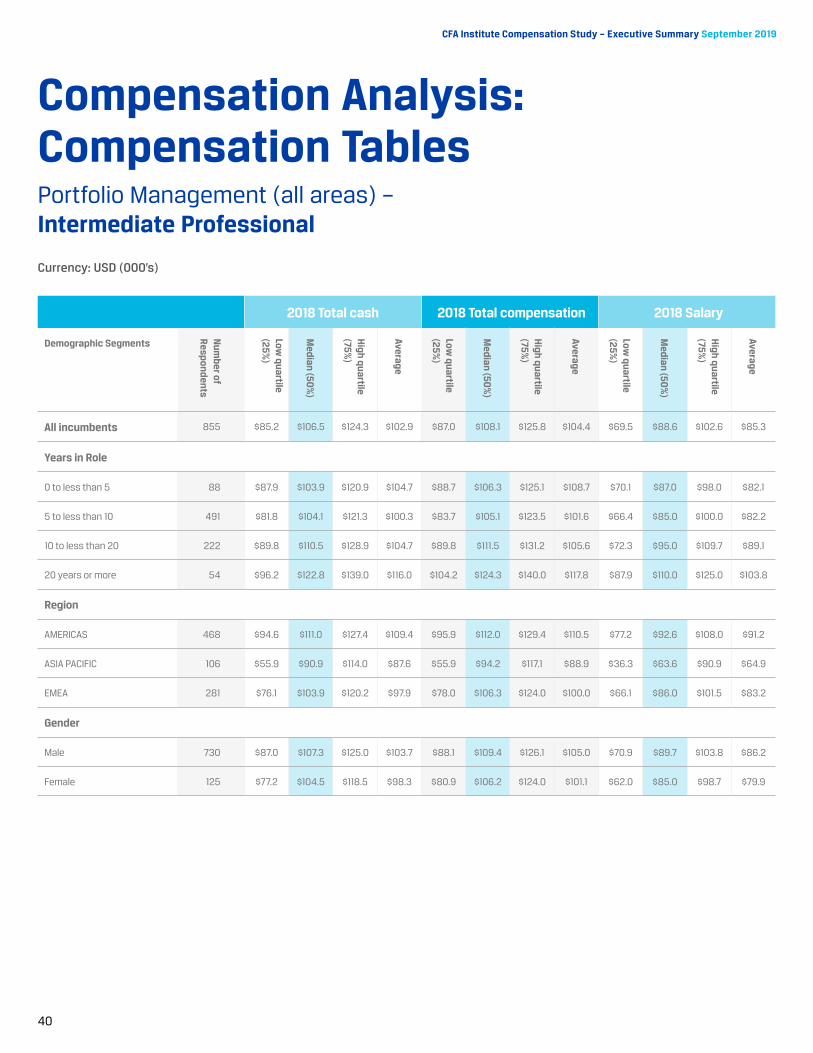
Currency: USD (000’s)
2018 Total cash 2018 Total compensation 2018 Salary
Demographic Segments
Num
ber of R
espondents
Low quartile
(25%)
Median (50
%)
High quartile
(75%)
Average
Low quartile
(25%)
Median (50
%)
High quartile
(75%)
Average
Low quartile
(25%)
Median (50
%)
High quartile
(75%)
Average
All incumbents 855 $85.2 $106.5 $124.3 $102.9 $87.0 $108.1 $125.8 $104.4 $69.5 $88.6 $102.6 $85.3
Years in Role
0 to less than 5 88 $87.9 $103.9 $120.9 $104.7 $88.7 $106.3 $125.1 $108.7 $70.1 $87.0 $98.0 $82.1
5 to less than 10 491 $81.8 $104.1 $121.3 $100.3 $83.7 $105.1 $123.5 $101.6 $66.4 $85.0 $100.0 $82.2
10 to less than 20 222 $89.8 $110.5 $128.9 $104.7 $89.8 $111.5 $131.2 $105.6 $72.3 $95.0 $109.7 $89.1
20 years or more 54 $96.2 $122.8 $139.0 $116.0 $104.2 $124.3 $140.0 $117.8 $87.9 $110.0 $125.0 $103.8
Region
AMERICAS 468 $94.6 $111.0 $127.4 $109.4 $95.9 $112.0 $129.4 $110.5 $77.2 $92.6 $108.0 $91.2
ASIA PACIFIC 106 $55.9 $90.9 $114.0 $87.6 $55.9 $94.2 $117.1 $88.9 $36.3 $63.6 $90.9 $64.9
EMEA 281 $76.1 $103.9 $120.2 $97.9 $78.0 $106.3 $124.0 $100.0 $66.1 $86.0 $101.5 $83.2
Gender
Male 730 $87.0 $107.3 $125.0 $103.7 $88.1 $109.4 $126.1 $105.0 $70.9 $89.7 $103.8 $86.2
Female 125 $77.2 $104.5 $118.5 $98.3 $80.9 $106.2 $124.0 $101.1 $62.0 $85.0 $98.7 $79.9
Compensation Analysis:Compensation TablesPortfolio Management (all areas) – Intermediate Professional
40
CFA Institute Compensation Study – Executive Summary September 2019

Currency: USD (000’s)
2018 Total cash 2018 Total compensation 2018 Salary
Demographic Segments
Num
ber of R
espondents
Low quartile
(25%)
Median (50
%)
High quartile
(75%)
Average
Low quartile
(25%)
Median (50
%)
High quartile
(75%)
Average
Low quartile
(25%)
Median (50
%)
High quartile
(75%)
Average
All incumbents 900 $136.8 $164.1 $185.0 $158.4 $140.4 $167.7 $190.0 $162.7 $96.1 $120.0 $141.2 $118.2
Years in Role
0 to less than 5 32 $145.0 $159.4 $181.7 $177.2 $152.8 $164.3 $181.7 $183.5 $95.5 $113.6 $125.2 $121.1
5 to less than 10 305 $153.4 $171.4 $200.0 $158.5 $155.9 $174.5 $205.0 $162.7 $100.1 $119.8 $140.0 $110.7
10 to less than 20 450 $118.0 $156.3 $181.0 $147.0 $118.1 $160.0 $184.8 $150.1 $92.0 $120.0 $140.0 $115.2
20 years or more 113 $131.3 $166.8 $185.3 $153.1 $139.0 $172.2 $190.0 $156.5 $100.2 $133.9 $153.1 $125.1
Region
AMERICAS 573 $145.0 $167.0 $190.0 $165.2 $150.0 $170.0 $193.0 $169.3 $102.5 $125.0 $147.1 $124.3
ASIA PACIFIC 76 $76.0 $152.4 $185.8 $135.6 $79.9 $152.4 $187.0 $138.4 $64.1 $88.7 $134.6 $97.7
EMEA 251 $129.9 $157.7 $179.0 $149.8 $136.0 $163.6 $183.1 $155.0 $92.1 $116.2 $133.5 $110.8
Gender
Male 779 $139.6 $165.0 $187.0 $160.0 $144.0 $168.1 $191.0 $164.1 $98.8 $121.7 $141.9 $120.0
Female 121 $118.1 $160.0 $177.0 $148.6 $121.7 $163.7 $182.5 $153.7 $88.6 $110.0 $130.0 $107.0
Portfolio Management (all areas) – Senior Professional
41
CFA Institute Compensation Study – Executive Summary September 2019
Currency: USD (000’s)
2018 Total cash 2018 Total compensation 2018 Salary
Demographic Segments
Num
ber of R
espondents
Low quartile
(25%)
Median (50
%)
High quartile
(75%)
Average
Low quartile
(25%)
Median (50
%)
High quartile
(75%)
Average
Low quartile
(25%)
Median (50
%)
High quartile
(75%)
Average
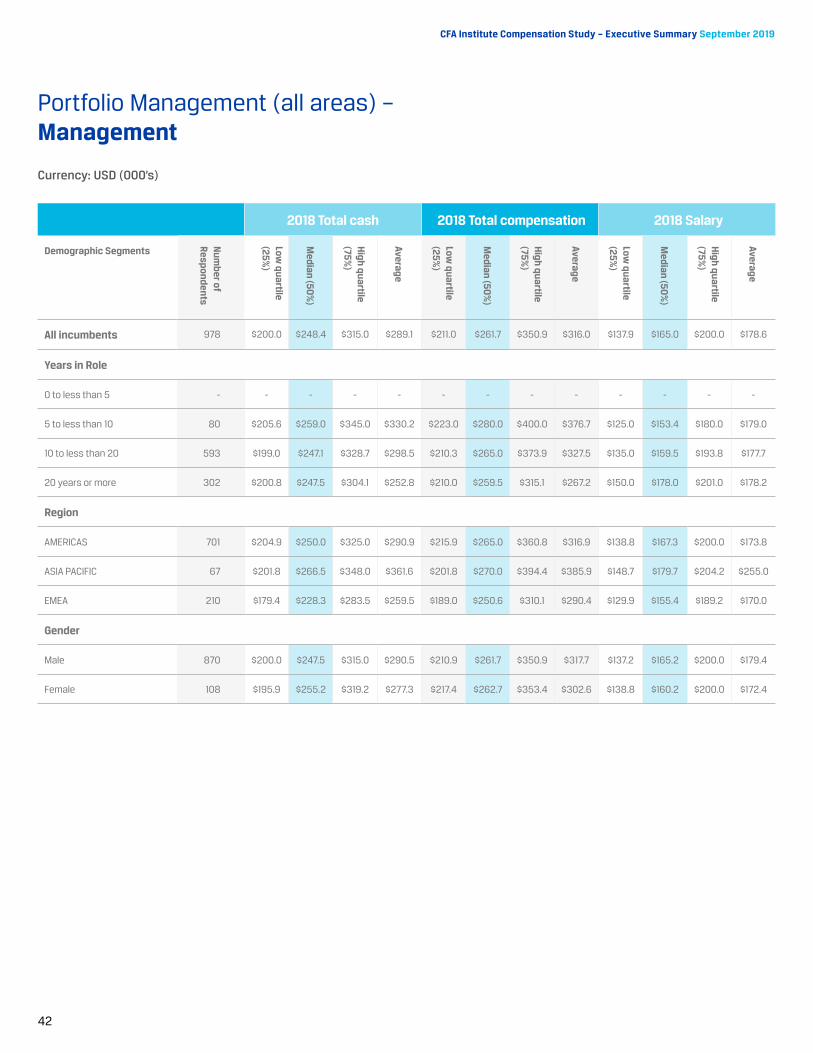
All incumbents 978 $200.0 $248.4 $315.0 $289.1 $211.0 $261.7 $350.9 $316.0 $137.9 $165.0 $200.0 $178.6
Years in Role
0 to less than 5 - - - - - - - - - - - - -
5 to less than 10 80 $205.6 $259.0 $345.0 $330.2 $223.0 $280.0 $400.0 $376.7 $125.0 $153.4 $180.0 $179.0
10 to less than 20 593 $199.0 $247.1 $328.7 $298.5 $210.3 $265.0 $373.9 $327.5 $135.0 $159.5 $193.8 $177.7
20 years or more 302 $200.8 $247.5 $304.1 $252.8 $210.0 $259.5 $315.1 $267.2 $150.0 $178.0 $201.0 $178.2
Region
AMERICAS 701 $204.9 $250.0 $325.0 $290.9 $215.9 $265.0 $360.8 $316.9 $138.8 $167.3 $200.0 $173.8
ASIA PACIFIC 67 $201.8 $266.5 $348.0 $361.6 $201.8 $270.0 $394.4 $385.9 $148.7 $179.7 $204.2 $255.0
EMEA 210 $179.4 $228.3 $283.5 $259.5 $189.0 $250.6 $310.1 $290.4 $129.9 $155.4 $189.2 $170.0
Gender
Male 870 $200.0 $247.5 $315.0 $290.5 $210.9 $261.7 $350.9 $317.7 $137.2 $165.2 $200.0 $179.4
Female 108 $195.9 $255.2 $319.2 $277.3 $217.4 $262.7 $353.4 $302.6 $138.8 $160.2 $200.0 $172.4
Portfolio Management (all areas) – Management
42
CFA Institute Compensation Study – Executive Summary September 2019