national cfa® charterholder compensation study 2015 charterholder... · •the 2015 national cfa®...
TRANSCRIPT

National CFA® Charterholder
Compensation Study 2015
11 August 2015

2 CFA Societies Canada
Contents
Executive Summary 3
Methodology & Sampling 8
Respondent Profile 10
Compensation Measures 18
Benefits 55
Detailed Employment Profile 58
2

3
Executive Summary

4 CFA Societies Canada
Key Demographics: • The 2015 National CFA® Charterholder Compensation Survey is based on input from 2,606
CFA charterholders who responded to an online survey invitation. With a response rate of 19.3%, a sample of this size produces results considered accurate to within +/-1.7 percentage points, 19 times out of 20. In 2012, the survey was conducted with 2,135 members.
• The respondent profile for 2015 is very similar to that of 2012, with 83% being men (vs. 84% in 2012) and 17% women. The average age is 39.7 years, unchanged from 39.9 years in 2012. The proportion that are charterholders has grown from 92% to 96%, with 3% being candidates and 1% being neither. They have been in their current position for 5.6 years, up from 5.0 years on average, and with their current employer for 7.0 years, up from 6.5 years. Total average career tenure to date is unchanged at 15.1 years.
• CFA charterholders work for a wide range of employers, including asset/fund management firms (27%), investment counselling (11%), sell-side brokerages (7%), pension management (6%), investment banking (5%), insurance (5%), financial services consulting (5%) and commercial banking (5%).
• A quarter (26%) work for one of the six largest banks, 4% for one of the three largest insurance firms, and 6% for one of the 10 largest pension plans – the remaining 64% work for other organizations. These are unchanged from 2012. The average employee count is 2,834, up from 2,765 in 2012.
Executive summary
4

5 CFA Societies Canada
Summary of Key Findings: • CFA charterholders hold a wide range of positions, including Investment
Counsellor/Private Client (7%), Corporate Finance/Underwriter/M&A (7%), Risk Management (6%), Portfolio Manager (Equity) (6%), Portfolio Manager (Other) (6%), Sell-side Securities Analyst (5%) and CEO/CAO/COO/CIO/President (4%).
• Top responsibilities include financial analysis (65%), client relationship management (52%), portfolio management/stock selection (45%), strategy development and planning (40%), general management/admin. (37%), performance management (34%), and internal control and risk management (31%). Most of these roles have declined slightly as lower incidence roles have become more prevalent, including trading (26% vs. 20%), compliance/regulatory oversight (24% vs. 14%), corporate finance (22% vs. 14%), senior management (20% vs. 12%) and HR (15% vs. 9%).
• More than half (53%) of CFA charterholders say they personally manage assets for their employers, managing an average of $4.2 billion, up from $3.5 billion in 2012.
• Top designations held in addition to the CFA charter include MBA (22%, down slightly from 26%), other Master's degrees (17%), CIM (7%), CA (6%), CFP (5%), FRM (5%) and FCSI (4%). One-third (34%) hold no other designations.
5
Executive summary

6 CFA Societies Canada
Summary of Findings: • Top forms of compensation include base salaries (93%) and performance bonuses (77%), with fewer
receiving stock awards/phantom shares (15%), commissions/sales bonuses (15%), dividends from employer company shares (12%), profit sharing (11%) and deferred/multi-year incentive compensation (11%).
• The table below shows the mean amounts received for each category of compensation, both among those receiving each type, and in aggregate across all CFA charterholders, whether received or not. Mean total compensation rose by 15% between 2011 and 2014, from $239,215 to $274,731.
• Thus, across all members, including those who receive each type or not, base salaries account for 45 percent of total compensation, down from 49%. Performance bonuses have declined as a proportion of total compensation from 25% to 21%. Other forms of compensation account for small portions of total compensation, but for much larger nominal values among those receiving.
Aggregate Avg. Compensation across all CFA charterholders
Avg. compensation
As % of Compensation
2014 2011 2014 2011 Base Salary $128K $119k 45% 49% Commissions/Sales Bonuses $33K $18k 12% 7% Performance Bonuses $59K $61k 21% 25% Profit Sharing $17K $21k 6% 9% Stock Awards $9K $15k 3% 6% Stock Options $2K $9k 1% 4% Deferred/multi-year incentive compensation $9K - 3% - Dividends from employer company shares held $19K - 7% - Compensation as Board Director $<0.5K - <0.5% - Consulting Fees $2K - 1% -
Total Compensation $280k $239k - -
Aggregate Avg. Compensation Among Recipients
Proportion Receiving each
Avg. comp. among receiving
2014 2011 2014 2011 94% 95% $138k $126k
14% 14% $219k $139k
77% 77% $77k $80k
13% 15% $150k $145k
15% 16% $60k $118k
7% 8% $41k $100k
12% - $84k -
7% - $187k -
<0.5% - $25k -
1% - $104k -
- - $280k $240k
6
Executive summary

7 CFA Societies Canada
Summary of Key Findings: • Across most compensation components, mean values are significantly higher than median
values, indicating a small proportion of CFA charterholders receive very high compensation. In terms of total compensation, the mean value of $274,731 is considerably higher than the median of $147,550. The top 25% of income earners start with incomes of $275,000, rising to over $10 million.
• Total compensation varies by region, sector and position held. These details are provided in the full report. A few highlights include higher compensation in Calgary ($387,987), Winnipeg ($357,667) and Okanagan ($370,440) than in Montréal ($177,329), Atlantic Canada ($177,559), and Ottawa ($212,900). Unfortunately, several from the Québec chapter entered $0 values, resulting in a mean compensation of $49,997 across all, rising to $132,599 among those who provided more complete information.
• By position, total compensation is highest for equity PMs ($612,005), CEO/CAO/COOs/CIOs ($516,024), and multi-asset PMs ($488,942); and is lower for portfolio analysts ($98,906), buy-side risk analysts ($143,977), compliance/regulatory ($147,713), and those in marketing and product development ($153,286).
• Those with longer tenure/more senior positions derive a larger proportion of their compensation from commissions and sales bonuses, as well as performance bonuses and profit sharing, than from base salaries.
• Top benefits received include CFA Professional Membership Dues (97% – higher than the 48% who receive coverage for other professional associations) and various forms of insurance, including health (95%), dental (94%), long-term disability (92%), life (91%), short-term disability (90%) and vision (88%). Sixty-nine percent receive pension benefits. Just under half (45%) say their employer pays for 100% of CE credits, while 12% say it pays for some but not all, and 8% pay only for mandatory credits; 43% do not pay for any.
7
Executive summary

8
Methodology & Sampling
9 CFA Societies Canada
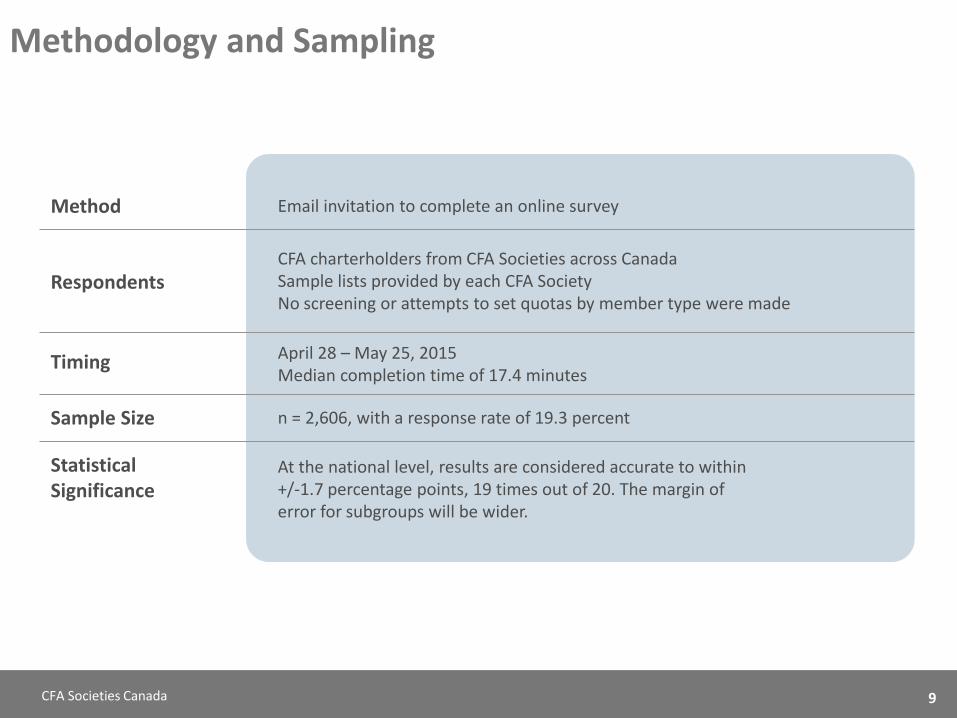
Methodology and Sampling
CFA charterholders from CFA Societies across Canada Sample lists provided by each CFA Society No screening or attempts to set quotas by member type were made
April 28 – May 25, 2015 Median completion time of 17.4 minutes
n = 2,606, with a response rate of 19.3 percent
Respondents
Timing
Sample Size
Email invitation to complete an online survey Method
At the national level, results are considered accurate to within +/-1.7 percentage points, 19 times out of 20. The margin of error for subgroups will be wider.
Statistical Significance
9
10
Respondent Profile
11 CFA Societies Canada
83%
17%
10%
25%
20%
17%
13%
15%
96%
3%
1%
84%
16%
9%
20%
23%
21%
12%
14%
92%
6%
2%
Male
Female
<30
30-34
35-39
40-44
45-49
50+
Charterholder
Candidate
Neither
2015
2012
Gender:
CFA Charter Status:
Age:
Mean: 2015: 39.7 years 2012: 39.9 years
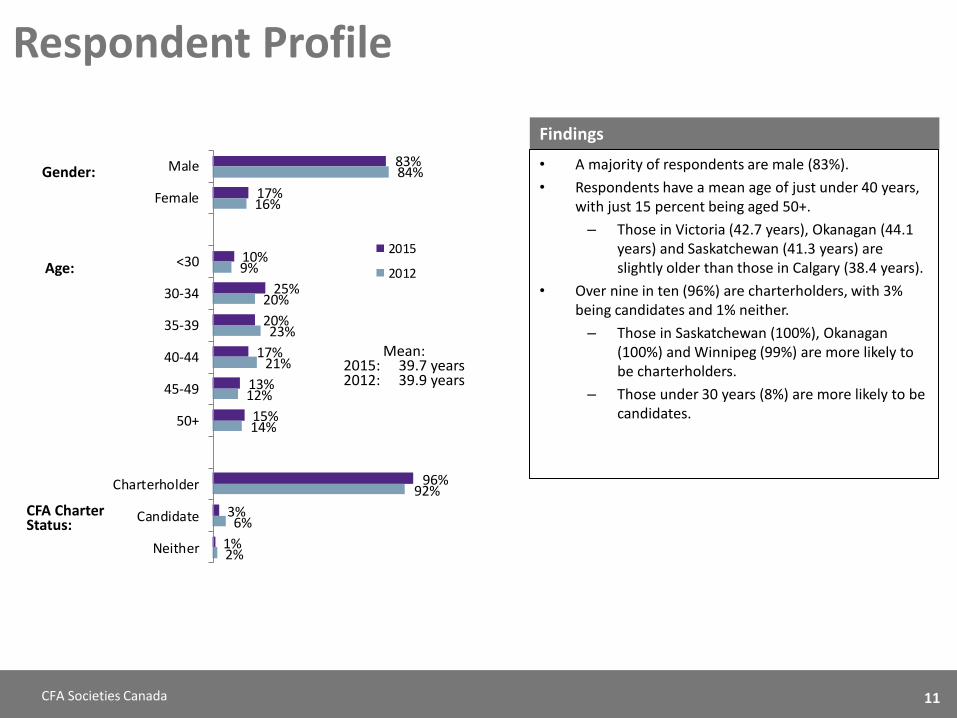
Respondent Profile
Findings
• A majority of respondents are male (83%).
• Respondents have a mean age of just under 40 years, with just 15 percent being aged 50+.
– Those in Victoria (42.7 years), Okanagan (44.1 years) and Saskatchewan (41.3 years) are slightly older than those in Calgary (38.4 years).
• Over nine in ten (96%) are charterholders, with 3% being candidates and 1% neither.
– Those in Saskatchewan (100%), Okanagan (100%) and Winnipeg (99%) are more likely to be charterholders.
– Those under 30 years (8%) are more likely to be candidates.
11

12 CFA Societies Canada
Respondent Profile
CFA Society
Total Victoria Van-
couver Okan-agan
Calgary Edmon-
ton Saskat-chewan
Winni-peg
Toronto Ottawa Mont-
réal Québec Atlantic
Unweighted n= 2606 28 240 15 270 79 44 90 1239 69 421 61 50
Male 83% 82% 83% 87% 83% 85% 84% 86% 82% 91% 82% 93% 90%
Female 17% 18% 18% 13% 17% 15% 16% 14% 18% 9% 18% 7% 10%
<30 years 10% 7% 9% - 13% 8% 7% 3% 11% 9% 7% 5% 8%
30 – 34 years 25% 11% 24% 7% 28% 29% 23% 30% 25% 25% 24% 30% 26%
35 – 39 years 20% 29% 18% 20% 22% 19% 18% 17% 19% 17% 27% 26% 20%
40 – 44 years 17% 11% 18% 27% 13% 23% 18% 14% 17% 19% 19% 16% 16%
45 – 49 years 13% 21% 14% 27% 12% 10% 14% 17% 13% 10% 13% 7% 8%
50+ years 15% 21% 17% 20% 12% 11% 21% 19% 15% 20% 11% 16% 22%
Mean: 39.7 42.7 40.4 44.1 38.4 38.9 41.3 40.9 39.6 40.2 39.4 39.3 40.4
Median: 38.0 42.0 39.0 43.0 36.0 38.0 40.5 39.5 38.0 39.0 38.0 38.0 37.0
Charterholder 96% 96% 96% 100% 98% 96% 100% 99% 96% 97% 97% 95% 98%
Candidate 3% 4% 3% - 2% 3% - 1% 3% 1% 3% 5% -
Neither 1% - 1% - <0.5% 1% - - 1% 1% <0.5% - 2%
12

13 CFA Societies Canada
Respondent Profile
Current Position (1 of 2)
Total
Finan. Or Invest. Adv./
Broker
Invest. Counsel. / Private
Client
Portfolio Man.
(Equity)
Portfolio Man. (Fixed
Income)
Portfolio Man. (Multi -asset)
Portfolio Man.
(Other)
Manager of
Managers
Portfolio Analyst
Risk Manage-
ment
Buy-Side R.A.
(Equity)
Buy-Side R.A.
(Other)
Invest. Strateg./ Econo-
mist
Market. and
Product Develop.
Unweighted n= 2606 163 193 157 83 74 137 57 46 153 87 60 65 57
Male 83% 85% 87% 85% 86% 85% 86% 77% 70% 82% 86% 87% 80% 81%
Female 17% 15% 13% 15% 14% 15% 14% 23% 30% 18% 14% 13% 20% 19%
<30 years 10% 8% 1% 3% 4% 7% 9% 4% 17% 7% 20% 27% 6% 7%
30 – 34 years 25% 23% 15% 14% 25% 23% 28% 14% 35% 25% 32% 40% 32% 23%
35 – 39 years 20% 17% 18% 22% 18% 12% 24% 26% 17% 24% 28% 15% 23% 19%
40 – 44 years 17% 18% 16% 26% 20% 18% 15% 28% 15% 14% 13% 12% 17% 28%
45 – 49 years 13% 13% 22% 22% 10% 16% 8% 12% 11% 17% 7% 3% 8% 14%
50+ years 15% 20% 29% 14% 22% 24% 16% 16% 4% 14% 1% 3% 14% 9%
Mean: 39.7 41.2 44.7 42.2 41.3 42.0 39.0 41.1 36.0 39.9 35.1 33.4 38.6 39.6
Median: 38.0 40.0 45.0 42.0 40.0 42.0 37.0 41.0 34.0 38.0 34.0 32.0 36.0 40.0
Charterholder 96% 98% 95% 98% 99% 96% 98% 93% 96% 98% 95% 93% 97% 95%
Candidate 3% 2% 3% 1% 1% 3% 2% 4% 4% 1% 5% 7% 2% 4%
Neither 1% - 3% 1% - 1% - 4% - 1% - - 2% 2%
13

14 CFA Societies Canada
Respondent Profile Current Position (2 of 2)
Total Relation-
ship Manage.
Complia-nce/
Regula-tory
Sell-Side Securities
Analyst
Trading & Sales
Corp.Fin./ Under-writer/ M&A
Accoun-tant/
Auditor/ Other
Consultant / Invest. Consult.
CFO CEO/CAO/
COO/ CIO/Pres.
Corp./ Comm. Banking
Treasury Other
Unweighted n= 2606 106 51 133 87 185 96 107 57 105 65 75 207
Male 83% 78% 76% 87% 92% 86% 79% 81% 91% 88% 85% 79% 90%
Female 17% 22% 24% 13% 8% 14% 21% 19% 9% 12% 15% 21% 10%
<30 years 10% 10% 12% 18% 11% 21% 8% 9% 5% 2% 17% 8% 8%
30 – 34 years 25% 25% 18% 38% 32% 37% 26% 26% 7% 8% 32% 27% 25%
35 – 39 years 20% 18% 14% 16% 23% 20% 22% 21% 23% 18% 26% 27% 23%
40 – 44 years 17% 17% 31% 14% 18% 12% 17% 13% 19% 16% 15% 17% 19%
45 – 49 years 13% 15% 12% 7% 11% 6% 11% 13% 21% 26% 5% 12% 10%
50+ years 15% 15% 14% 7% 3% 5% 15% 17% 24% 30% 5% 9% 16%
Mean: 39.7 39.8 40.6 35.8 36.9 35.3 39.9 40.0 43.5 45.4 36.0 38.8 39.7
Median: 38.0 39.0 41.0 34.0 36.0 34.0 38.0 37.0 44.0 46.0 35.0 37.0 38.0
Charterholder 96% 97% 96% 90% 100% 96% 94% 95% 98% 97% 98% 99% 98%
Candidate 3% 3% 4% 10% - 4% 5% 3% 2% 1% 2% 1% 2%
Neither 1% - - - - - 1% 2% - 2% - - -
14

15 CFA Societies Canada C2. Which one of the following job categories do you fit into?
Current Position
6%7%
6%3%3%
5%2%2%
6%3%
2%2%2%
4%2%
5%2%
7%4%4%
2%4%
2%3%
9%
Finan. Adv./Broker/Invest. Adv.
Invest. Counsellor/Private Client
Portfolio Man. (Equity)
Portfolio Man. (Fixed Income)
Portfolio Man.(Multi-asset)
Portfolio Man. (Other)
Manager of Managers
Portfolio Analyst
Risk Management
Buy-Side R.A. (Equity)
Buy-Side R.A. (Other)
Invest. Strategist/ Economist
Marketing and Product Develop.
Relationship Management
Compliance/ Regulatory
Sell-Side Securities Analyst
Trading & Sales
Corporate Fin./ Underwriter/ M&A
Accountant/ Auditor/ Other
Consultant/Invest. Consult.
CFO
CEO / CAO / COO / CIO / Pres.
Corp./Comm. Banking
Treasury
Other
Credit Analyst Derivatives Analyst Quantitative/Risk Analyst Security/Investment Analyst Sell-Side Research Analyst (Fixed Income) Credit Analyst Derivatives Analyst Security/Investment Analyst Credit Analyst (Rating Agency) Sell-Side Research Analyst (Equity)
PM (Indexed/Quantitative) PM (Real Estate) PM (Currency) PM (Hedge Funds) PM (Derivatives) PM (Principal) - Infrastructure PM(Principal) – Private Equity PM(Other) Head of Portfolio Management
Private Banker Investment Counsellor/Private Client
Buy-Side RA (Fixed Income) Buy-Side RA (Indexed/Quantitative) Buy-Side RA (Real Estate) Buy-Side RA (Hedge Funds) Buy-Side RA (Private Equity/Infrastructure) Buy-Side RA (Other)
Portfolio Administrator Portfolio Measurement Performance Measurement Analyst
RM/Client Service Relationship Management Investor Relations
Sell-Side Sales (Equity) Sell-Side Sales (Fixed Income) Sell-Side Sales (Currency) Sell-Side Trader (Equity) Buy-Side Trader Sell-Side Trader (Fixed Income)
Accountant Auditor Actuary Business Valuator
15

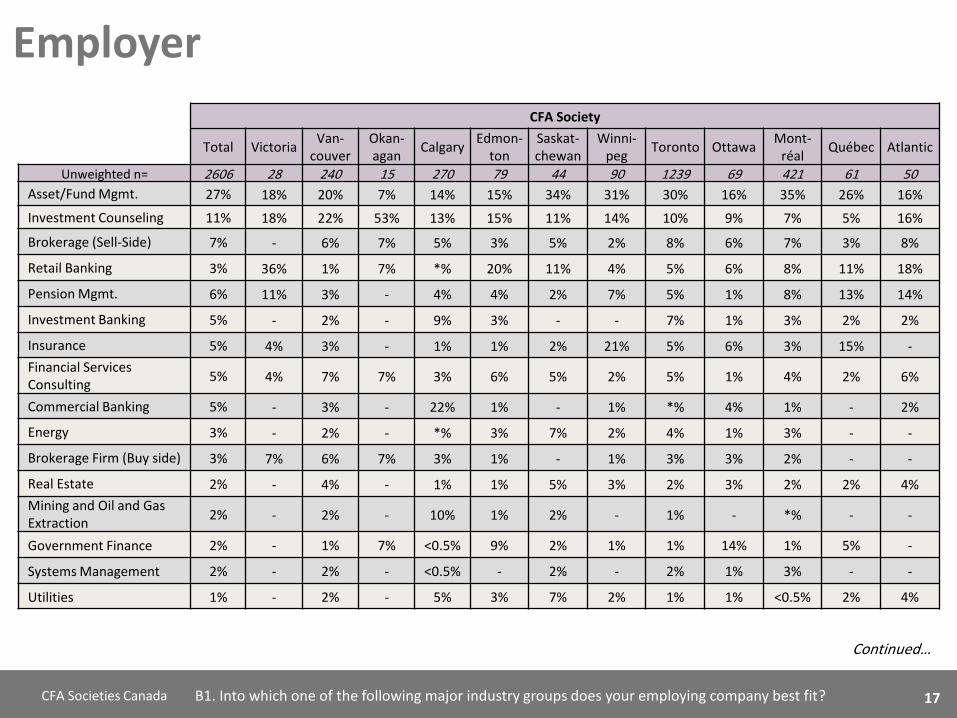
16 CFA Societies Canada B1. Into which one of the following major industry groups does your employing company best fit?
Employer
Key Differences
• Those in Toronto (30%) and Montréal (35%) are more likely to work in asset/fund management, as are French speakers (36%), those working for one of the 10 largest pension plans (37%), and those with fewer than 100 (40%) or 100-499 (37%) employees.
• Those in Vancouver (22%) and Okanagan (53%) are more likely to work in investment counselling, as are those ages 45-49 (17%), 50-54 (18%) and 55+ (29%), those working for one of the largest six banks (15%) and those with fewer than 100 employees (20%).
• Men are more likely than women to work in sell-side brokerage firms (7% vs. 5%), financial services consulting (6% vs. 4%) and investment banking (6% vs. 3%), while women are more likely to work in insurance (8% vs. 4%).
• Those with 5,000+ employees are more likely to work in sell-side brokerage firms (11%), investment banking (9%), insurance (7%), commercial banking (9%) or retail banking (6%).
• Those working 40 hours or less a week are more likely to work in government finance (3%), utilities (3%) or regulator (3%), while those working 51+ hours a week are more likely to work in brokerage firm (sell-side) (14%) or investment banking (13%).
Findings
• One-quarter (27%) work for an asset or fund management firms.
• Investment counselling (11%), sell-side brokerages (7%), pension management (6%), investment banking (5%), insurance (5%), financial services consulting (5%) and commercial banking (5%) are other top employers.
27%
11%
7%
6%
5%
5%
5%
5%
3%
3%
3%
2%
2%
2%
2%
1%
1%
1%
1%
1%
5%
34%
8%
7%
5%
5%
5%
8%
3%
2%
2%
1%
1%
1%
1%
1%
6%
Asset/Fund Mgmt.
Investment Counselling
Brokerage (Sell-side)
Pension Mgmt.
Investment Banking
Insurance
Financial Services Consulting
Commercial Banking
Retail Banking
Energy
Brokerage Firm (Buy-side)
Real Estate
Mining and Oil and Gas Extraction
Government Finance
Systems Management
Utilities
Accounting
Regulator
Educational Services/Academia
Manufacturing
Other sector
2015
2012
16
17 CFA Societies Canada
CFA Society
Total Victoria Van-
couver Okan-agan
Calgary Edmon-
ton Saskat-chewan
Winni-peg
Toronto Ottawa Mont-
réal Québec Atlantic
Unweighted n= 2606 28 240 15 270 79 44 90 1239 69 421 61 50
Asset/Fund Mgmt. 27% 18% 20% 7% 14% 15% 34% 31% 30% 16% 35% 26% 16%
Investment Counseling 11% 18% 22% 53% 13% 15% 11% 14% 10% 9% 7% 5% 16%
Brokerage (Sell-Side) 7% - 6% 7% 5% 3% 5% 2% 8% 6% 7% 3% 8%
Retail Banking 3% 36% 1% 7% *% 20% 11% 4% 5% 6% 8% 11% 18%
Pension Mgmt. 6% 11% 3% - 4% 4% 2% 7% 5% 1% 8% 13% 14%
Investment Banking 5% - 2% - 9% 3% - - 7% 1% 3% 2% 2%
Insurance 5% 4% 3% - 1% 1% 2% 21% 5% 6% 3% 15% -
Financial Services Consulting
5% 4% 7% 7% 3% 6% 5% 2% 5% 1% 4% 2% 6%
Commercial Banking 5% - 3% - 22% 1% - 1% *% 4% 1% - 2%
Energy 3% - 2% - *% 3% 7% 2% 4% 1% 3% - -
Brokerage Firm (Buy side) 3% 7% 6% 7% 3% 1% - 1% 3% 3% 2% - -
Real Estate 2% - 4% - 1% 1% 5% 3% 2% 3% 2% 2% 4%
Mining and Oil and Gas Extraction
2% - 2% - 10% 1% 2% - 1% - *% - -
Government Finance 2% - 1% 7% <0.5% 9% 2% 1% 1% 14% 1% 5% -
Systems Management 2% - 2% - <0.5% - 2% - 2% 1% 3% - -
Utilities 1% - 2% - 5% 3% 7% 2% 1% 1% <0.5% 2% 4%
Continued…
B1. Into which one of the following major industry groups does your employing company best fit?
Employer
17

18
Compensation Measures
19 CFA Societies Canada
93%
77%
15%
15%
12%
11%
11%
6%
2%
1%
1%
95%
77%
16%
14%
15%
14%
8%
3%
Base salary
Performance bonus
Restricted Stock Award orphantom shares
Commission/sales bonus
Dividends from employercompany shares held
Profit sharing
Deferred/multi-year incentivecompensation
Stock options
Consulting Fees
Benefits
Other
2015
2012
D1. Which of the following types of compensation did you receive in 2014?
Compensation
Key Differences
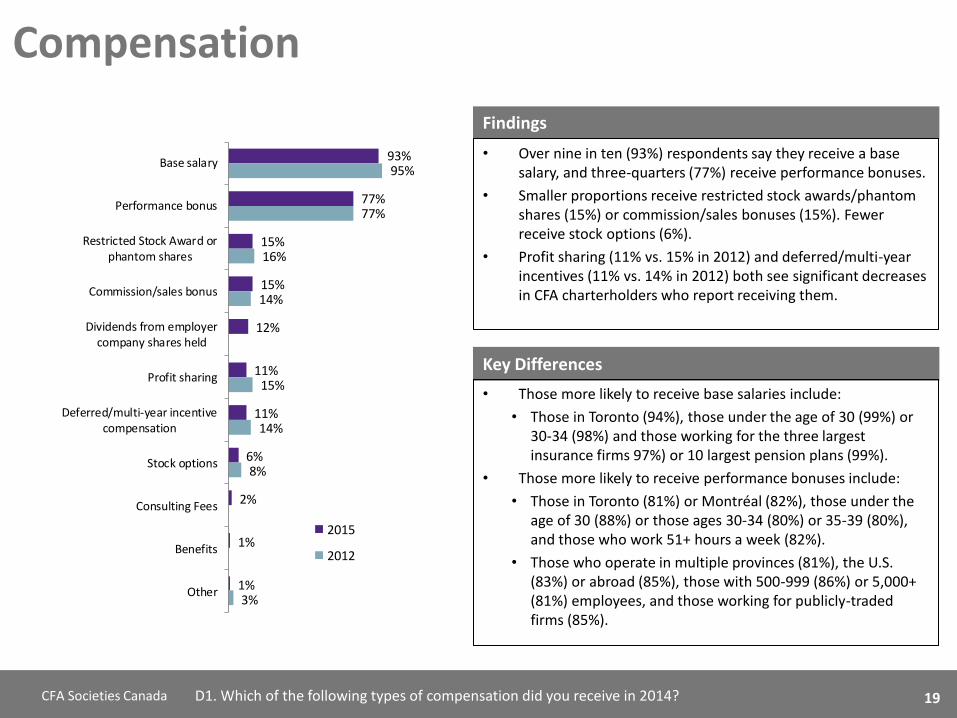
• Those more likely to receive base salaries include:
• Those in Toronto (94%), those under the age of 30 (99%) or 30-34 (98%) and those working for the three largest insurance firms 97%) or 10 largest pension plans (99%).
• Those more likely to receive performance bonuses include:
• Those in Toronto (81%) or Montréal (82%), those under the age of 30 (88%) or those ages 30-34 (80%) or 35-39 (80%), and those who work 51+ hours a week (82%).
• Those who operate in multiple provinces (81%), the U.S. (83%) or abroad (85%), those with 500-999 (86%) or 5,000+ (81%) employees, and those working for publicly-traded firms (85%).
Findings
• Over nine in ten (93%) respondents say they receive a base salary, and three-quarters (77%) receive performance bonuses.
• Smaller proportions receive restricted stock awards/phantom shares (15%) or commission/sales bonuses (15%). Fewer receive stock options (6%).
• Profit sharing (11% vs. 15% in 2012) and deferred/multi-year incentives (11% vs. 14% in 2012) both see significant decreases in CFA charterholders who report receiving them.
19

20 CFA Societies Canada D1. Which of the following types of compensation did you receive in 2014?
Compensation Key Differences
• Those more likely to receive profit sharing include:
• Those working for Canadian-owned firms (14%), those with fewer than 100 employees (15%) and those who work 51+ hours a week (15%).
• Those more likely to receive stock options include:
• Those in Calgary (12%), those ages 40-44 (9%), those working for Canadian-owned firms (8%), those with 1,000-4,999 employees (9%) and those who work 51+ hours a week (19%).
• Compensation varies by firm type:
• Those in asset/fund management are more likely to receive base salaries (97%), performance bonuses (85%) and dividends (16%).
• Those in retail banking are more likely to receive performance bonuses (89%).
• Those in buy-side (49%) and sell-side (49%) brokerages are more likely to receive commissions/sales bonuses, and are less likely to receive base salaries (70%/87%).
• Those in insurance (99%) and government finance (100%) are more likely to receive base salaries.
• Those in pension management are more likely to receive base salaries (100%), performance bonuses (88%) and deferred/multi-year incentive compensation (24%).
• Those in oil & gas extraction are more likely to receive commission/sales bonuses (40%) and stock options (40%).
• Those in financial services consulting are more likely to receive commission/sales bonuses (31%).
Key Differences (continued)
• Those more likely to receive commission/sales bonuses include:
• Those in Vancouver (26%) or Okanagan (60%), men (16%), those ages 45-40 (21%), 50-54 (20%) or 55+ (26%), those working for the six chartered banks (28%), those operating in multiple provinces (18%) and those with 5,000+ employees (20%).
• Those more likely to receive phantom stocks include:
• Those in Calgary (26%), men (16%), those ages 40-44 (19%) or 45-49 (23%), those working for the six chartered banks (25%), those operating in multiple provinces (19%), in the U.S. (24%) or abroad (20%), and those with 5,000+ employees (22%).
• Those more likely to receive dividends include:
• Those in Calgary (19%) or Saskatchewan (27%), those ages 45-49 (17%) or 55+ (18%), and those working for the six chartered banks (15%).
• Those working for Canadian-owned firms (15%), those with fewer than 100 employees (16%) and those working 51+ hours a week (15%).
• Those more likely to receive deferred incentive compensation include:
• Those ages 45-49(15%) or 50-54 (23%), those working for one of the six chartered banks (14%) or 10 largest pension funds (29%), those with 500-999 employees (18%), and those working 46-50 (15%) or 51+ (16%) hours a week.
20
21 CFA Societies Canada D1. Which of the following types of compensation did you receive in 2014?
Compensation
Key Differences
• Those in Corporate/Commercial Banking roles are more likely to receive base salaries (100%) and performance bonuses (97%).
• Those in Corporate Finance/M&A/Underwriting are more likely to receive base salaries (96%), as are those in Trading & Sales (99%).
• Those in Relationship Management are more likely to receive base salaries (99%) and dividends (24%).
• Those working as Sell-side Securities Analysts are more likely to receive base salaries (100%) and performance bonuses (85%).
Key Differences (continued)
• Compensation varies by position held:
• Those in CEO/CAO/COO/CIO/President roles are more likely to receive base salaries (97%), deferred incentive compensation (22%) and stock options (18%); CFOs are also more likely to receive stock options (19%).
• Equity Portfolio Managers are more likely to receive dividends (25%) and profit sharing (17%), while Fixed Income Portfolio Managers are more likely to receive base salaries (99%), performance bonuses (87%) and deferred/multi-year incentive compensation (19%).
• Managers of Managers (100%) and Portfolio Analysts (98%) are more likely to receive base salaries, as are those in roles of Compliance/Regulatory (98%).
• Financial Advisors/Brokers/Investment Advisors (67%) and Investment Counsellors/Private Client (60%) are more likely to receive commission/sales bonuses.
• Those in Risk Management are more likely to receive base salaries (97%) and performance bonuses (88%) as are Buy-Side Equity Research Analysts (99%/92%) and those in Marketing and Product Development (98%/95%).
21

22 CFA Societies Canada D1. Which of the following types of compensation did you receive in 2014?
Compensation
Current Position (1 of 2)
Total
Finan. Or Invest. Adv./
Broker
Invest. Counsel. / Private
Client
Portfolio Man.
(Equity)
Portfolio Man. (Fixed
Income)
Portfolio Man. (Multi -asset)
Portfolio Man.
(Other)
Manager of
Managers
Portfolio Analyst
Risk Manage
ment
Buy-Side R.A.
(Equity)
Buy-Side R.A.
(Other)
Invest. Strateg./ Econo-
mist
Market. and
Product Develop.
Unweighted n= 2606 163 193 157 83 74 137 57 46 153 87 60 65 57
Base salary 93% 56% 83% 92% 99% 92% 96% 100% 98% 97% 99% 100% 97% 98%
Performance bonus 77% 41% 56% 74% 87% 69% 80% 70% 78% 88% 92% 92% 74% 95%
Commission/sales bonus 15% 67% 60% 11% 1% 22% 7% 11% - 3% 1% - 6% 5%
Restricted Stock Award or phantom shares
15% 18% 19% 11% 16% 18% 12% 14% 7% 16% 13% 7% 11% 18%
Dividends from employer company shares held
12% 12% 17% 25% 8% 15% 15% 7% 7% 8% 11% 7% 5% 21%
Profit sharing 11% 13% 15% 17% 11% 12% 12% 7% 13% 9% 11% 13% 9% 11%
Deferred/multi-year incentive compensation
11% 7% 8% 11% 19% 12% 25% 9% 2% 10% 14% 12% 15% 11%
Stock options 6% - 3% 6% 4% 1% 4% 5% - 7% 1% 5% - 9%
Consulting Fees 2% 2% 2% 1% - 1% 2% - - 1% - 2% 3% -
Benefits 1% 1% 1% - - - 1% - 2% 1% 2% 2% 2% 2%
Other 1% 1% 2% 3% 1% 1% 2% 2% - 2% 2% 2% - 2%
22
23 CFA Societies Canada D1. Which of the following types of compensation did you receive in 2014?
Compensation
Current Position (2 of 2)
Total Relation-
ship Manage.
Complia-nce/
Regula-tory
Sell-Side Securities
Analyst
Trading & Sales
Corp.Fin./ Under-writer/ M&A
Accoun-tant/
Auditor/ Other
Consultant / Invest. Consult.
CFO CEO/CAO/
COO/ CIO/Pres.
Corp./ Comm. Banking
Treasury Other
Unweighted n= 2606 106 51 133 87 185 96 107 57 105 65 75 207
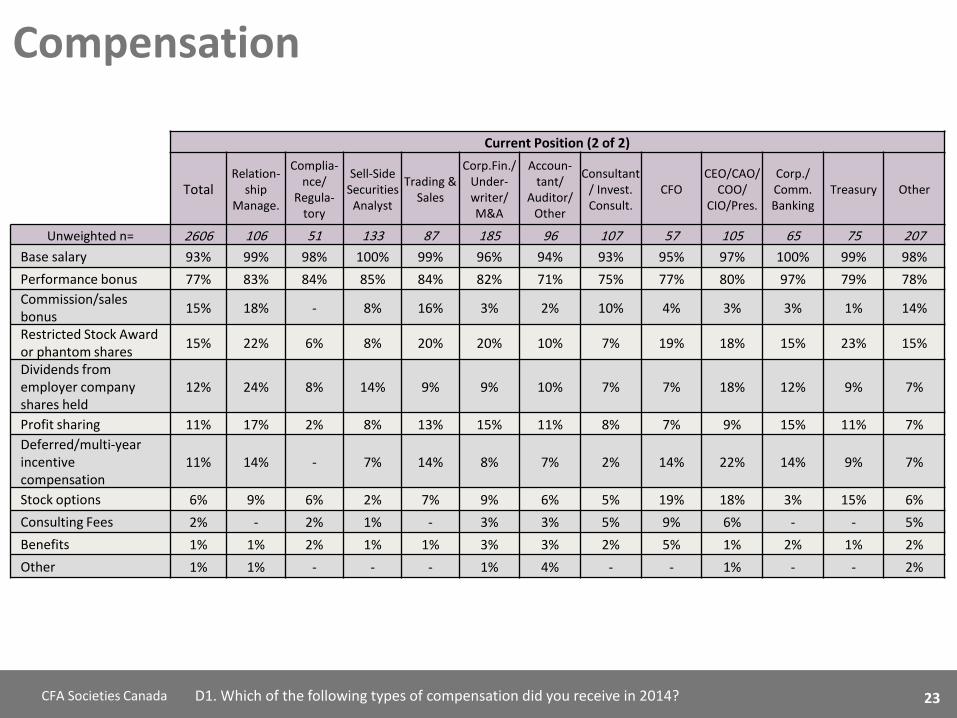
Base salary 93% 99% 98% 100% 99% 96% 94% 93% 95% 97% 100% 99% 98%
Performance bonus 77% 83% 84% 85% 84% 82% 71% 75% 77% 80% 97% 79% 78%
Commission/sales bonus
15% 18% - 8% 16% 3% 2% 10% 4% 3% 3% 1% 14%
Restricted Stock Award or phantom shares
15% 22% 6% 8% 20% 20% 10% 7% 19% 18% 15% 23% 15%
Dividends from employer company shares held
12% 24% 8% 14% 9% 9% 10% 7% 7% 18% 12% 9% 7%
Profit sharing 11% 17% 2% 8% 13% 15% 11% 8% 7% 9% 15% 11% 7%
Deferred/multi-year incentive compensation
11% 14% - 7% 14% 8% 7% 2% 14% 22% 14% 9% 7%
Stock options 6% 9% 6% 2% 7% 9% 6% 5% 19% 18% 3% 15% 6%
Consulting Fees 2% - 2% 1% - 3% 3% 5% 9% 6% - - 5%
Benefits 1% 1% 2% 1% 1% 3% 3% 2% 5% 1% 2% 1% 2%
Other 1% 1% - - - 1% 4% - - 1% - - 2%
23

24 CFA Societies Canada D2A/B. What was your total annual base salary (in Cdn dollars) as of year end 2013/2014? Base: Receive salary compensation (n=2,432)
Base Salary
Findings
• Those receiving base salaries report a mean salary of $137,658, compared to $125,999 in 2011 and $127,252 in 2013.
• The bottom quartile of base salaries is below $79,750, while the top quartile begins at $150,000.
• Only 21 percent of respondents have base salaries of less
than $75k, while 12 percent have salaries over $200k.
2015 Survey 2012 Survey
2014 2013 2011 2010
Mean $137,658 $127,252 $125,999 $115,517
Median $105,000 $100,000 $110,000 $100,000
4%
8%
13%
13%
20%
21%
13%
8%
3%
7%
12%
11%
21%
23%
18%
5%
3%
9%
16%
13%
23%
24%
13%
1%
2%
8%
13%
12%
20%
26%
17%
2%
$300k+
$200k-
$299k
$150-$199k
$125-$149k
$100-$124k
$75-$99k
<$75k
$0 - none
2014
2013
2011
2010
24

25 CFA Societies Canada
$10,000
$50,000
$250,000
$1,250,000
I I I
2014 2011
Base Salary
25% $79,750
50% $105,000
75% $150,000
Mean: $137,658
D2A/B. What was your total annual base salary (in Cdn dollars) as of year end 2013/2014? Base: Receive salary compensation (n=2,432) 25
26 CFA Societies Canada
Base Salary
Key Differences
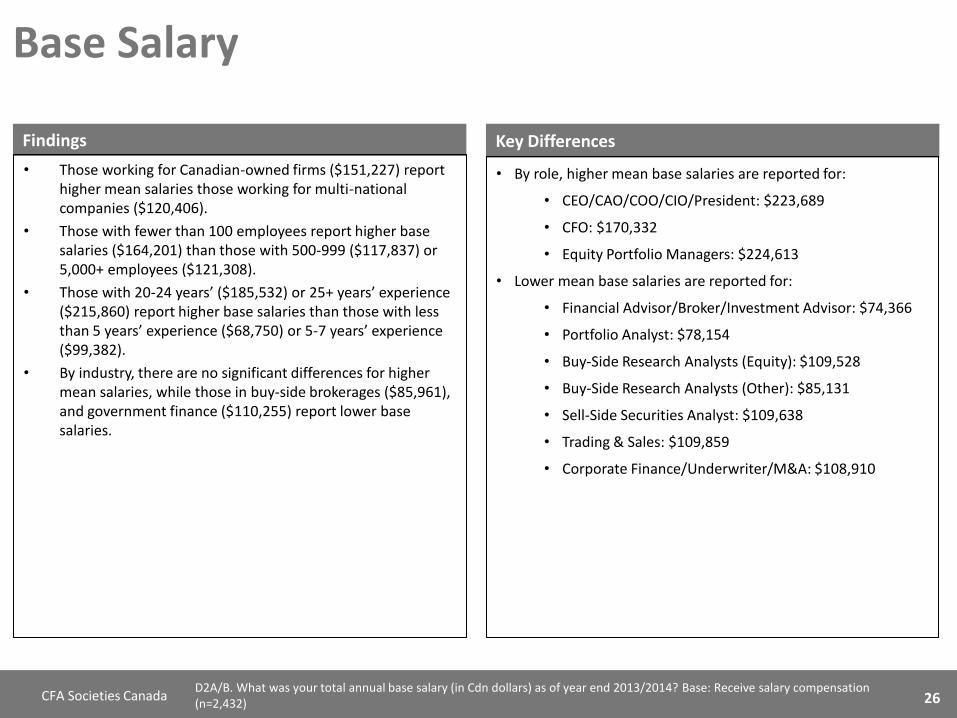
• By role, higher mean base salaries are reported for:
• CEO/CAO/COO/CIO/President: $223,689
• CFO: $170,332
• Equity Portfolio Managers: $224,613
• Lower mean base salaries are reported for:
• Financial Advisor/Broker/Investment Advisor: $74,366
• Portfolio Analyst: $78,154
• Buy-Side Research Analysts (Equity): $109,528
• Buy-Side Research Analysts (Other): $85,131
• Sell-Side Securities Analyst: $109,638
• Trading & Sales: $109,859
• Corporate Finance/Underwriter/M&A: $108,910
Findings
• Those working for Canadian-owned firms ($151,227) report higher mean salaries those working for multi-national companies ($120,406).
• Those with fewer than 100 employees report higher base salaries ($164,201) than those with 500-999 ($117,837) or 5,000+ employees ($121,308).
• Those with 20-24 years’ ($185,532) or 25+ years’ experience ($215,860) report higher base salaries than those with less than 5 years’ experience ($68,750) or 5-7 years’ experience ($99,382).
• By industry, there are no significant differences for higher mean salaries, while those in buy-side brokerages ($85,961), and government finance ($110,255) report lower base salaries.
D2A/B. What was your total annual base salary (in Cdn dollars) as of year end 2013/2014? Base: Receive salary compensation (n=2,432) 26

27 CFA Societies Canada
Base Salary
2014 Base Salary Total
Finan. Or Invest. Adv./
Broker
Invest. Counsel. / Private
Client
Portfolio Man.
(Equity)
Portfolio Man. (Fixed
Income)
Portfolio Man. (Multi -asset)
Portfolio Man.
(Other)
Manager of
Managers
Portfolio Analyst
Risk Manage-
ment
Buy-Side R.A.
(Equity)
Buy-Side R.A.
(Other)
Invest. Strateg./
Economist
Market. and
Product Develop.
Unweighted n= 2,432 92 161 144 82 68 131 57 45 149 86 60 63 56
$0 – None 8% 12% 7% 2% 10% 1% 8% 5% 9% 3% 6% 12% 10% 13%
<$75k 13% 47% 13% 3% 2% 15% 11% 9% 42% 15% 10% 25% 6% 25%
$75-$99k 21% 20% 20% 7% 16% 13% 18% 26% 27% 21% 30% 27% 24% 20%
$100-$124k 20% 9% 20% 17% 20% 19% 18% 21% 13% 29% 19% 20% 30% 13%
$125-$149k 13% 1% 12% 12% 17% 15% 11% 12% 4% 14% 22% 10% 10% 11%
$150-$199k 13% 10% 16% 22% 22% 19% 18% 11% 2% 10% 12% 5% 13% 16%
$200-$299K 8% 1% 7% 24% 7% 12% 11% 9% 2% 2% - 2% 5% 4% $300K+ 4% 1% 5% 13% 6% 6% 3% 7% - 5% 1% - 3% -
Mean ($000s) $138 $74 $131 $225 $133 $201 $144 $164 $78 $181 $110 $85 $126 $93
Median ($000s) $105 $62 $102 $160 $125 $125 $113 $106 $74 $109 $100 $81 $101 $94
D2A/B. What was your total annual base salary (in Cdn dollars) as of year end 2013/2014? Base: Receive salary compensation (n=2,432) 27

28 CFA Societies Canada
Base Salary
2014 Base Salary Total Relation-
ship Manage.
Complia-nce/
Regula-tory
Sell-Side Securities
Analyst
Trading & Sales
Corp.Fin./ Under-writer/ M&A
Accoun-tant/
Auditor/ Other
Consultant / Invest. Consult.
CFO CEO/CAO/C
OO/ CIO/Pres.
Corp./ Comm. Banking
Treasury Other
Unweighted n= 2,432 105 50 133 86 178 90 99 54 102 65 74 202
$0 – None 8% 9% 2% 8% 7% 6% 10% 11% 7% 17% 9% 4% 7%
<$75k 13% 10% 18% 16% 9% 17% 10% 10% - 5% 8% 9% 13%
$75-$99k 21% 21% 14% 32% 16% 24% 19% 21% 6% 6% 42% 23% 28%
$100-$124k 20% 16% 38% 23% 30% 24% 23% 29% 11% 5% 17% 22% 20%
$125-$149k 13% 17% 22% 7% 14% 15% 19% 8% 15% 8% 9% 15% 13%
$150-$199k 13% 17% 4% 8% 16% 7% 10% 10% 28% 18% 11% 15% 13%
$200-$299K 8% 9% - 3% 7% 4% 7% 6% 22% 29% 2% 9% 4% $300K+ 4% 2% 2% 2% - 2% 2% 4% 11% 13% 3% 3% 1%
Mean ($000s) $138 $127 $125 $110 $110 $109 $132 $148 $170 $224 $126 $146 $113
Median ($000s) $105 $120 $102 $95 $105 $100 $112 $100 $156 $173 $93 $112 $100
D2A/B. What was your total annual base salary (in Cdn dollars) as of year end 2013/2014? Base: Receive salary compensation (n=2,432) 28

29 CFA Societies Canada D8A/B. Approximately what was your total compensation in 2013/2014?
Total Compensation
Findings
• Mean total compensation received in 2014 is $280,454 –
up from $233,780 in 2013, $239,215 in 2011 and $214,885 in 2010.
• The bottom quartile of base salaries is below $96,000, while the top quartile begins at $275,000.
• Only 16% of respondents have base salaries of less than $75k, while 35% have salaries of $200k+.
22%
13%
14%
10%
14%
11%
8%
8%
19%
13%
13%
10%
15%
14%
11%
5%
21%
18%
16%
11%
14%
13%
7%
1%
17%
16%
14%
9%
16%
15%
10%
2%
$300k+
$200k-
$299k
$150-$199k
$125-$149k
$100-$124k
$75-$99k
<$75k
$0 - none
2014
2013
2011
2010
2015 Survey 2012 Survey
2014 2013 2011 2010
Mean $280,454 $233,780 $239,215 $214,885
Median $147,550 $135,000 $157,500 $140,000
29

30 CFA Societies Canada
$10,000
$100,000
$1,000,000
$10,000,000
$100,000,000
l l l
2014 2011
D8A/B. Approximately what was your total compensation in 2013/2014?
Total Compensation
25% $96,000
50% $147,550
75% $275,000
Mean: $280,454
30
31 CFA Societies Canada D8A/B. Approximately what was your total compensation in 2013/2014?
Total Compensation
Key Differences
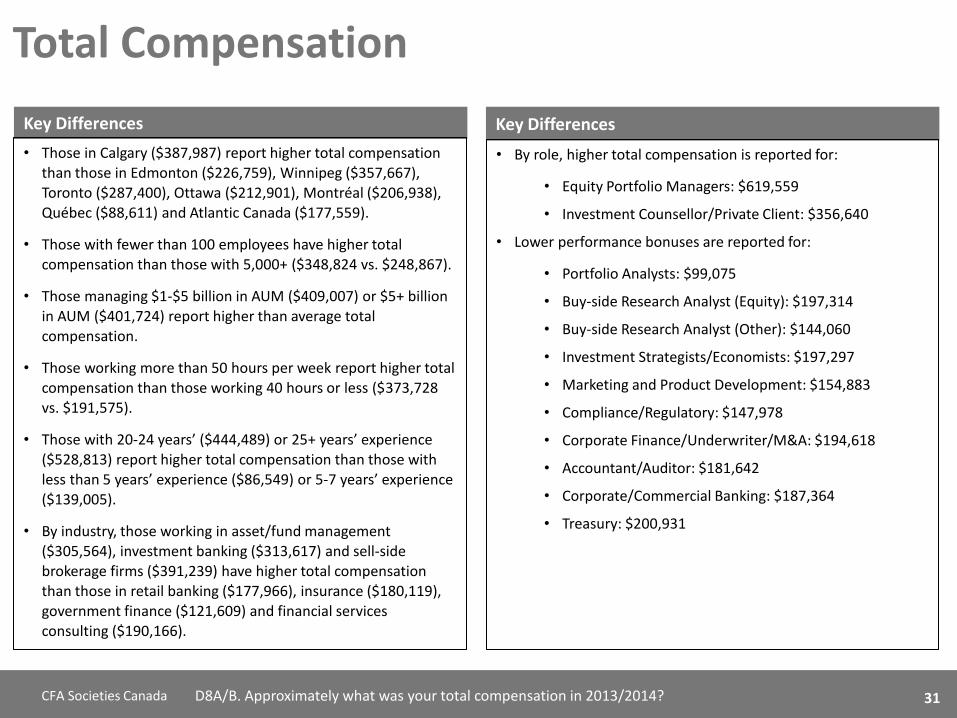
• By role, higher total compensation is reported for:
• Equity Portfolio Managers: $619,559
• Investment Counsellor/Private Client: $356,640
• Lower performance bonuses are reported for:
• Portfolio Analysts: $99,075
• Buy-side Research Analyst (Equity): $197,314
• Buy-side Research Analyst (Other): $144,060
• Investment Strategists/Economists: $197,297
• Marketing and Product Development: $154,883
• Compliance/Regulatory: $147,978
• Corporate Finance/Underwriter/M&A: $194,618
• Accountant/Auditor: $181,642
• Corporate/Commercial Banking: $187,364
• Treasury: $200,931
Key Differences
• Those in Calgary ($387,987) report higher total compensation than those in Edmonton ($226,759), Winnipeg ($357,667), Toronto ($287,400), Ottawa ($212,901), Montréal ($206,938), Québec ($88,611) and Atlantic Canada ($177,559).
• Those with fewer than 100 employees have higher total compensation than those with 5,000+ ($348,824 vs. $248,867).
• Those managing $1-$5 billion in AUM ($409,007) or $5+ billion
in AUM ($401,724) report higher than average total compensation.
• Those working more than 50 hours per week report higher total compensation than those working 40 hours or less ($373,728 vs. $191,575).
• Those with 20-24 years’ ($444,489) or 25+ years’ experience
($528,813) report higher total compensation than those with less than 5 years’ experience ($86,549) or 5-7 years’ experience ($139,005).
• By industry, those working in asset/fund management ($305,564), investment banking ($313,617) and sell-side brokerage firms ($391,239) have higher total compensation
than those in retail banking ($177,966), insurance ($180,119),
government finance ($121,609) and financial services consulting ($190,166).
31

32 CFA Societies Canada D8A/B. Approximately what was your total compensation in 2013/2014?
Total Compensation
2014 Total Compensation CFA Society
Total Victoria Van-
couver Okan-agan
Calgary Edmon-
ton Saskat-chewan
Winni-peg
Toronto Ottawa Mont-
réal Québec Atlantic
Unweighted n= 2606 28 240 15 270 79 44 90 1239 69 421 61 50
$0 – None 8% - 2% - 1% - 2% 2% 2% 4% 32% 49% -
<$75k 8% 11% 9% 7% 4% 4% - 17% 9% 6% 4% 7% 16%
$75-$99k 11% 11% 13% - 6% 20% 16% 17% 11% 14% 10% 7% 18%
$100-$124k 14% 14% 17% 13% 11% 20% 16% 12% 15% 23% 10% 15% 12%
$125-$149k 10% 4% 11% - 14% 8% 5% 11% 10% 10% 8% 5% 10%
$150-$199k 14% 14% 15% 40% 16% 16% 14% 12% 14% 16% 11% 11% 16%
$200-$299K 13% 18% 13% 13% 18% 9% 20% 4% 14% 12% 12% 2% 14% $300K+ 22% 29% 20% 27% 31% 23% 27% 24% 25% 14% 14% 5% 14%
Mean ($000s) $280 $300 $326 $370 $388 $227 $261 $358 $287 $213 $207 $89 $178
Median ($000s) $148 $169 $145 $168 $190 $130 $191 $129 $159 $132 $112 $7 $130
2013 Total Compensation CFA Society
Total Victoria Van-
couver Okan-agan
Calgary Edmon-
ton Saskat-chewan
Winni-peg
Toronto Ottawa Mont-
réal Québec Atlantic
Unweighted n= 2606 28 240 15 270 79 44 90 1239 69 421 61 50
$0 – None 5% 4% 5% 7% 3% - 5% 4% 5% 4% 6% 5% 4%
<$75k 11% 7% 12% 7% 7% 10% 5% 22% 12% 13% 9% 11% 18%
$75-$99k 14% 11% 16% 7% 11% 24% 9% 17% 14% 17% 13% 25% 14%
$100-$124k 15% 14% 15% 20% 13% 19% 20% 13% 15% 17% 16% 20% 10%
$125-$149k 10% 4% 11% - 11% 5% 2% 9% 10% 13% 10% 13% 18%
$150-$199k 13% 21% 14% 20% 14% 8% 16% 10% 12% 14% 15% 15% 12%
$200-$299K 13% 11% 10% 13% 16% 18% 30% 8% 13% 7% 15% 5% 14% $300K+ 19% 29% 16% 27% 25% 16% 14% 17% 20% 13% 16% 7% 10%
Mean ($000s) $234 $269 $233 $202 $281 $203 $230 $236 $236 $188 $228 $145 $178
Median ($000s) $135 $168 $125 $170 $165 $117 $177 $112 $134 $121 $140 $111 $132
32

33 CFA Societies Canada D8A/B. Approximately what was your total compensation in 2013/2014?
Total Compensation
2013 Total Compensation
Current Position (1 of 2)
Total
Finan. Or Invest. Adv./
Broker
Invest. Counsel. / Private
Client
Portfolio Man.
(Equity)
Portfolio Man. (Fixed
Income)
Portfolio Man. (Multi -asset)
Portfolio Man.
(Other)
Manager of
Managers
Portfolio Analyst
Risk Manage-
ment
Buy-Side R.A.
(Equity)
Buy-Side R.A.
(Other)
Invest. Strateg./
Economist
Market. and
Product Develop.
Unweighted n= 2606 163 193 157 83 74 137 57 46 153 87 60 65 57
$0 – None 5% 6% 3% 3% 2% 1% 2% 2% 9% 7% 6% 7% 6% 2%
<$75k 11% 21% 10% 2% 5% 8% 7% 7% 28% 13% 11% 27% 11% 18%
$75-$99k 14% 12% 9% 6% 6% 12% 12% 25% 22% 18% 8% 18% 20% 21%
$100-$124k 15% 14% 9% 6% 17% 7% 13% 21% 24% 17% 21% 10% 22% 9%
$125-$149k 10% 6% 7% 4% 10% 11% 12% 7% 9% 14% 20% 8% 8% 11%
$150-$199k 13% 13% 11% 17% 11% 19% 15% 9% - 12% 11% 18% 12% 16%
$200-$299K 13% 11% 16% 18% 19% 11% 15% 18% 7% 13% 11% 5% 14% 16% $300K+ 19% 17% 35% 43% 30% 31% 24% 12% 2% 7% 11% 7% 8% 9%
Mean ($000s) $234 $226 $336 $414 $316 $365 $277 $195 $94 $153 $158 $125 $162 $169
Median ($000s) $135 $120 $200 $260 $198 $175 $157 $120 $83 $118 $125 $96 $120 $127
2014 Total Compensation
Total
Finan. Or Invest. Adv./
Broker
Invest. Counsel. / Private
Client
Portfolio Man.
(Equity)
Portfolio Man. (Fixed
Income)
Portfolio Man. (Multi -asset)
Portfolio Man.
(Other)
Manager of
Managers
Portfolio Analyst
Risk Manage-
ment
Buy-Side R.A.
(Equity)
Buy-Side R.A.
(Other)
Invest. Strateg./
Economist
Market. and
Product Develop.
Unweighted n= 2606 163 193 157 83 74 137 57 46 153 87 60 65 57
$0 – None 8% 10% 6% 3% 11% 1% 9% 5% 11% 5% 7% 12% 9% 12%
<$75k 8% 15% 6% 2% 1% 8% 6% 4% 30% 11% 8% 8% 6% 9%
$75-$99k 11% 10% 5% 4% 7% 8% 10% 16% 20% 12% 8% 18% 17% 18%
$100-$124k 14% 12% 10% 4% 13% 8% 9% 23% 20% 20% 8% 17% 17% 18%
$125-$149k 10% 7% 5% 6% 10% 3% 7% 14% 9% 15% 20% 8% 12% 7%
$150-$199k 14% 10% 14% 13% 12% 19% 19% 9% 2% 14% 18% 17% 14% 12%
$200-$299K 13% 13% 15% 20% 16% 23% 11% 14% 4% 14% 13% 12% 9% 12% $300K+ 22% 21% 39% 48% 30% 30% 29% 16% 4% 10% 18% 8% 15% 12%
Mean ($000s) $280 $275 $357 $620 $376 $496 $314 $236 $99 $243 $197 $144 $197 $155
Median ($000s) $148 $136 $215 $295 $172 $206 $167 $128 $89 $129 $149 $113 $125 $111
33
34 CFA Societies Canada D8A/B. Approximately what was your total compensation in 2013/2014?
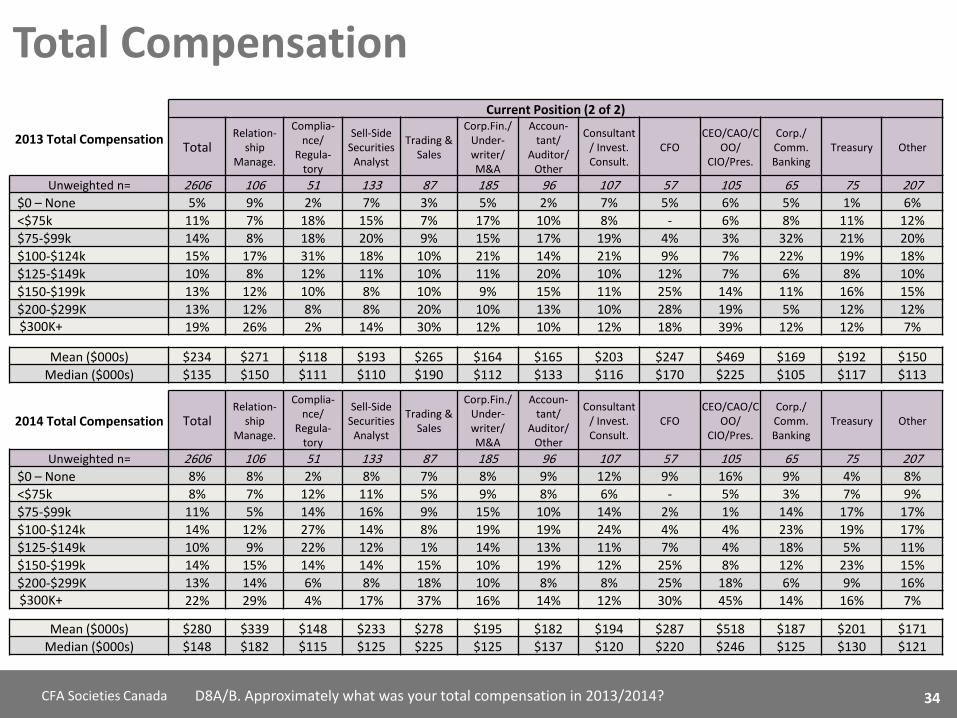
Total Compensation Current Position (2 of 2)
2013 Total Compensation
Total Relation-
ship Manage.
Complia-nce/
Regula-tory
Sell-Side Securities
Analyst
Trading & Sales
Corp.Fin./ Under-writer/ M&A
Accoun-tant/
Auditor/ Other
Consultant / Invest. Consult.
CFO CEO/CAO/C
OO/ CIO/Pres.
Corp./ Comm. Banking
Treasury Other
Unweighted n= 2606 106 51 133 87 185 96 107 57 105 65 75 207
$0 – None 5% 9% 2% 7% 3% 5% 2% 7% 5% 6% 5% 1% 6%
<$75k 11% 7% 18% 15% 7% 17% 10% 8% - 6% 8% 11% 12%
$75-$99k 14% 8% 18% 20% 9% 15% 17% 19% 4% 3% 32% 21% 20%
$100-$124k 15% 17% 31% 18% 10% 21% 14% 21% 9% 7% 22% 19% 18%
$125-$149k 10% 8% 12% 11% 10% 11% 20% 10% 12% 7% 6% 8% 10%
$150-$199k 13% 12% 10% 8% 10% 9% 15% 11% 25% 14% 11% 16% 15%
$200-$299K 13% 12% 8% 8% 20% 10% 13% 10% 28% 19% 5% 12% 12% $300K+ 19% 26% 2% 14% 30% 12% 10% 12% 18% 39% 12% 12% 7%
Mean ($000s) $234 $271 $118 $193 $265 $164 $165 $203 $247 $469 $169 $192 $150
Median ($000s) $135 $150 $111 $110 $190 $112 $133 $116 $170 $225 $105 $117 $113
2014 Total Compensation Total Relation-
ship Manage.
Complia-nce/
Regula-tory
Sell-Side Securities
Analyst
Trading & Sales
Corp.Fin./ Under-writer/ M&A
Accoun-tant/
Auditor/ Other
Consultant / Invest. Consult.
CFO CEO/CAO/C
OO/ CIO/Pres.
Corp./ Comm. Banking
Treasury Other
Unweighted n= 2606 106 51 133 87 185 96 107 57 105 65 75 207
$0 – None 8% 8% 2% 8% 7% 8% 9% 12% 9% 16% 9% 4% 8%
<$75k 8% 7% 12% 11% 5% 9% 8% 6% - 5% 3% 7% 9%
$75-$99k 11% 5% 14% 16% 9% 15% 10% 14% 2% 1% 14% 17% 17%
$100-$124k 14% 12% 27% 14% 8% 19% 19% 24% 4% 4% 23% 19% 17%
$125-$149k 10% 9% 22% 12% 1% 14% 13% 11% 7% 4% 18% 5% 11%
$150-$199k 14% 15% 14% 14% 15% 10% 19% 12% 25% 8% 12% 23% 15%
$200-$299K 13% 14% 6% 8% 18% 10% 8% 8% 25% 18% 6% 9% 16% $300K+ 22% 29% 4% 17% 37% 16% 14% 12% 30% 45% 14% 16% 7%
Mean ($000s) $280 $339 $148 $233 $278 $195 $182 $194 $287 $518 $187 $201 $171
Median ($000s) $148 $182 $115 $125 $225 $125 $137 $120 $220 $246 $125 $130 $121
34

35 CFA Societies Canada Summary
2014 Aggregate Compensation
Findings
• To create a picture of the
aggregate, average compensation
structure, the adjacent tables
show the average compensation
by category for all CFA
charterholders. Thus, across all
members, including those who
receive each type or not, base
salaries account for 45 percent of
total compensation, while
performance bonuses account for
21 percent.
• While stock awards/phantom
shares and stock options represent
a smaller percentage of total
compensation across all members
together, among the small
proportion who receive them,
they represent much higher
average values.
• The slides that follow show
breakdowns of total aggregate
average compensation structures
by total professional tenure, CFA
Society and occupational role.
Aggregate Average Compensation across all CFA Charterholders Avg. compensation among all
members As Percentage of
Sum of Compensation
2014 2013 2011 2010 2014 2013 2011 2010 Base Salary $128K $119K $119k $109k 45% 51% 49% 50% Commissions/Sales Bonuses $33K $26K $18k $15k 12% 11% 7% 7% Performance Bonuses $59K $47K $61k $55k 21% 20% 25% 25% Profit Sharing $17K $13K $21k $18k 6% 5% 9% 8% Stock Awards $9K $6K $15k $13k 3% 3% 6% 6% Stock Options $2K $1K $9k $7k 1% 1% 4% 3% Deferred/multi-year incentive compensation $9K $7K - - 3% 3% - - Dividends from employer company shares held $19K $10K - - 7% 4% - - Compensation as Board Director $<0.5K $<0.5K - - <0.5% <0.5% - - Consulting Fees $2K $2K - - 1% 1% - -
Total Compensation $280k $234k $239k $215k - - - -
Aggregate Average Compensation Among Recipients
Avg. compensation among those receiving each type
Avg. compensation among those receiving each type
2014 2011 2014 2011 Base Salary 94% 95% $138k $126k Commissions/Sales Bonuses 14% 14% $219k $139k Performance Bonuses 77% 77% $77k $80k Profit Sharing 13% 15% $150k $145k Stock Awards 15% 16% $60k $118k Stock Options 7% 8% $41k $100k
Deferred/multi-year incentive compensation 12% - $84k -
Dividends from employer company shares held 7% - $187k -
Compensation as Board Director <0.5% - $25k -
Consulting Fees 1% - $104k -
Total Compensation - - $280k $240k
35

36 CFA Societies Canada
$128,467 $68,750 $94,806 $113,320 $132,314
$170,204 $165,112 $204,967 $187,282
$32,647
$4,623 $15,787
$27,352
$55,695 $42,606
$136,830 $218,338
$58,935
$14,680 $32,293
$52,389 $62,978
$86,693 $113,437
$70,851
$73,787
$17,175 $18,311
$32,310 $51,548
$27,887
$85,522
$8,915 $8,985
$19,202 $21,119
$15,495
$11,277
$21,650 $20,762
$21,895
$19,038
$53,612 $52,332
$23,382
$54,193
$29,736
$0
$100,000
$200,000
$300,000
$400,000
$500,000
$600,000
Total <5 years 5-9 years 10-14 years 15-19 years 20-24 years 25-29 years 30-34 years 35+
Other Consulting FeesCompensation as Board Director Dividends from employer company shares heldDeferred/multi-year incentive compensation Stock OptionsStock Awards Profit SharingPerformance Bonuses Commissions/Sales BonusesBase Salary
2014 Aggregate Compensation
Aggregate Average Compensation across all CFA Charterholders by Total Professional Experience
Professional Experience (years)
Summary
$280,454
$86,549
$149,738
$204,831
$269,383
$444,489 $488,683
$515,136
$672,451
36

37 CFA Societies Canada
2014 Aggregate Compensation
Findings
• Those with more experience receive larger total compensation than those with less experience.
• There are been increases in total aggregate average compensation for those with 20 or more years of experience, while those with fewer than 20 years’ experience have seen a decrease in total compensation.
Aggregate Compensation across all CFA
Charterholders by Professional Experience
Mean Median
Total $280,454 $147,550
<5 years $86,549 $86,875
5-9 years $149,738 $106,199
10-14 years $204,831 $140,000
15-19 years $269,383 $178,000
20-24 years $444,489 $229,000
25-29 years $488,683 $250,000
30-34 years $515,136 $290,472
35+ $672,451 $252,000
37

38 CFA Societies Canada
79%
63% 55%
49% 38% 34%
40% 28%
3%
3% 8%
10%
13% 9%
27%
32%
17%
22% 26% 23%
20% 23%
14%
11%
2% 2% 7%
7% 11%
5% 13%
3% 3%
4% 4%
3% 2% 5% 4%
4% 7%
12% 11% 5%
8% 4%
0%
10%
20%
30%
40%
50%
60%
70%
80%
90%
100%
<5 5-9 10-14 15-19 20-24 25-29 30-34 35-39
Other Consulting Fees
Compensation as Board Director Dividends from employer company shares held
Deferred/multi-year incentive compensation Stock Options
Stock Awards Profit Sharing
Performance Bonuses Commissions/Sales Bonuses
Base Salary
2014 Aggregate Compensation Aggregate Average Compensation across all
CFA Charterholders by Total Professional Experience
Professional Experience (years)
Summary
Findings: • Those with more experience
receive a larger portion of their compensation from non-base salary sources.
• Those mid-career receive relatively more from performance bonuses.
38

39 CFA Societies Canada
Aggregate Average Compensation across all CFA Charterholders by CFA Society
$128,467 $129,210 $137,091
$91,600
$134,865 $105,757
$126,297
$170,340 $130,866 $131,201 $119,207
$69,775
$111,926
$32,647
$89,982 $80,916
$87,267 $35,650
$44,137 $14,493
$97,272
$25,028 $34,899
$10,779 $18,634
$58,935
$50,588 $30,315
$167,733
$64,093
$39,729 $42,463
$41,264
$72,252 $26,211
$53,394 $40,179
$17,175
$16,190
$15,400
$37,839
$14,352
$21,402
$8,065 $5,561
$8,915
$16,512
$11,357
$21,732
$11,192 $19,038
$17,964 $47,830
$77,523
$43,864
$35,463
$0
$50,000
$100,000
$150,000
$200,000
$250,000
$300,000
$350,000
$400,000
Other Consulting Fees Compensation as Board Director
Dividends from employer company shares held Deferred/multi-year incentive compensation Stock Options
Stock Awards Profit Sharing Performance Bonuses
Commissions/Sales Bonuses Base Salary
2014 Aggregate Compensation
Summary
$280,454
$300,280 $326,480
$370,440 $387,987
$226,759
$261,370
$357,667
Victoria Van- couver
Okan- agan
Calgary Edmon-ton
Sask-atchewan
Winni-peg
Toronto Ottawa Montréal Québec Total Atlantic
$287,400
$212,901 $206,938
$88,611
$177,559
39
40 CFA Societies Canada Summary
2014 Aggregate Compensation
Findings
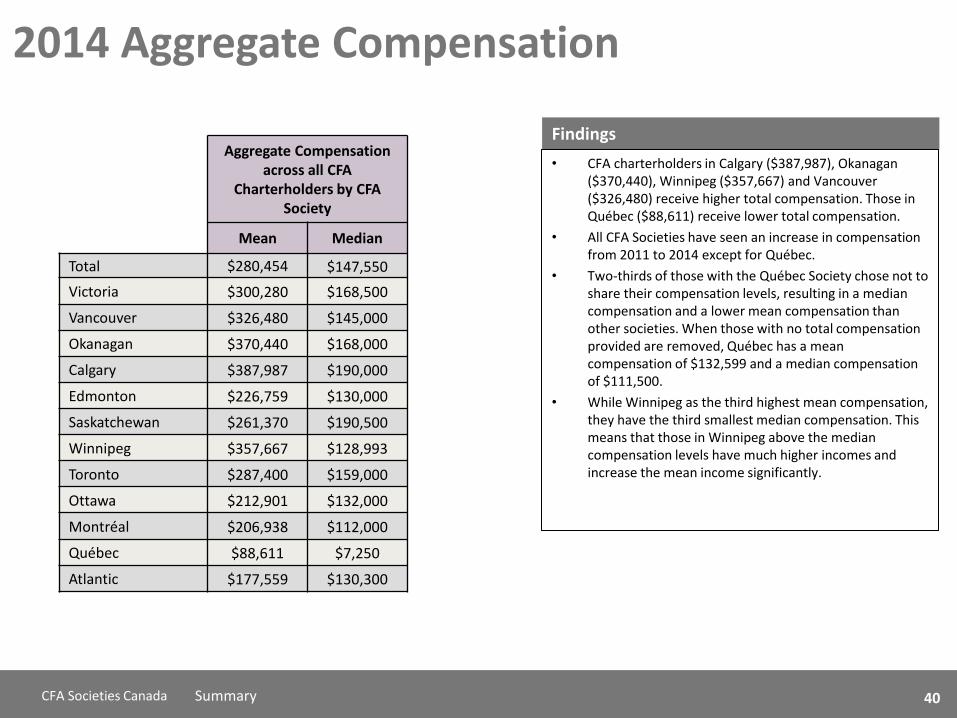
• CFA charterholders in Calgary ($387,987), Okanagan ($370,440), Winnipeg ($357,667) and Vancouver ($326,480) receive higher total compensation. Those in Québec ($88,611) receive lower total compensation.
• All CFA Societies have seen an increase in compensation from 2011 to 2014 except for Québec.
• Two-thirds of those with the Québec Society chose not to share their compensation levels, resulting in a median compensation and a lower mean compensation than other societies. When those with no total compensation provided are removed, Québec has a mean compensation of $132,599 and a median compensation of $111,500.
• While Winnipeg as the third highest mean compensation, they have the third smallest median compensation. This means that those in Winnipeg above the median compensation levels have much higher incomes and increase the mean income significantly.
Aggregate Compensation across all CFA
Charterholders by CFA Society
Mean Median
Total $280,454 $147,550
Victoria $300,280 $168,500
Vancouver $326,480 $145,000
Okanagan $370,440 $168,000
Calgary $387,987 $190,000
Edmonton $226,759 $130,000
Saskatchewan $261,370 $190,500
Winnipeg $357,667 $128,993
Toronto $287,400 $159,000
Ottawa $212,901 $132,000
Montréal $206,938 $112,000
Québec $88,611 $7,250
Atlantic $177,559 $130,300
40

41 CFA Societies Canada
46% 43% 42%
25% 35%
47% 48% 48% 46%
62% 58%
79%
63%
12%
30% 25%
24% 9%
19% 6%
27%
9%
16%
5%
8%
10% 21%
17%
9% 45%
17%
18%
16%
12%
25%
12%
26%
10%
23% 6%
5%
4%
10%
5%
7%
3% 3%
4%
2% 4%
3%
3%
3% 3% 10% 4% 4% 7% 6% 15%
20% 17% 10%
3%
0%
10%
20%
30%
40%
50%
60%
70%
80%
90%
100%
Other Consulting Fees
Compensation as Board Director Dividends from employer company shares held
Deferred/multi-year incentive compensation Stock Options
Stock Awards Profit Sharing
Performance Bonuses Commissions/Sales Bonuses
Base Salary
Summary
2014 Aggregate Compensation
Victoria Van- couver
Okan- agan
Calgary Edmon-ton
Sask-atchewan
Winni-peg
Toronto Ottawa Montréal Québec Total Atlantic
Aggregate Average Compensation across all CFA Charterholders by CFA Society
Findings:
• Those in Okanagan and Calgary receive a smaller
proportion of their total compensation from salaries.
• Stock options/stock awards are most prevalent in
Calgary and Toronto. Performance bonuses are most
significant in Montréal and Toronto
41

42 CFA Societies Canada
$128,467
$41,974 $109,065
$206,014
$131,863 $185,107
$138,080 $164,340
$76,455
$176,242 $108,269 $85,131
$121,657 $91,523
$32,647 $161,394
$136,286
$29,874
$0
$186,300
$11,409
$58,935 $24,920
$32,015
$147,503
$131,640
$69,850
$99,702 $40,846
$18,729
$43,411
$59,789 $47,936
$32,397 $36,221
$17,175
$27,419
$112,432
$22,931
$15,385
$33,533 $19,038 $26,171
$35,212
$103,668
$66,693
$0
$100,000
$200,000
$300,000
$400,000
$500,000
$600,000
$700,000
Total Finan. orInvest. Adv./
Broker
Invest.Counsel./
Private Client
PortfolioMan.
(Equity)
PortfolioMan.(Fixed
Income)
PortfolioMan.
(Multi-asset)
PortfolioMan.
(Other)
Manager ofManagers
PortfolioAnalyst
RiskManagement
Buy-SideR.A.
(Equity)
Buy-SideR.A.
(Other)
Invest.Strateg./
Economist
Market. andProductDevelop.
Other Consulting Fees
Compensation as Board Director Dividends from employer company shares held
Deferred/multi-year incentive compensation Stock options
Stock awards/phantom shares Profit sharing bonuses
Performance bonuses Commissions/sales bonuses
Base salary
Summary
2014 Aggregate Compensation
Aggregate Average Compensation across all CFA Charterholders by Job Category
$280,454 $275,290
$356,640
$619,559
$376,222
$314,170
$496,374
$99,075
$243,238 $235,542
$197,314
$144,060
$197,297
$154,883
Findings:
• In the asset management world, Equity PMs earn more than fixed income or multi-asset.
• Portfolio Analysts are lowest in total
compensation.
42
43 CFA Societies Canada
$128,467 $125,757 $122,996 $109,638 $108,587 $104,789 $123,957 $136,891 $161,367 $217,297
$126,483 $144,214 $110,490
$32,647 $38,517
$58,935 $81,474
$23,367 $90,762
$100,926
$43,617 $26,350 $28,860
$54,426
$96,515
$44,612 $32,807 $26,031
$17,175 $9,758 $9,517
$24,821 $13,258
$75,867
$18,227 $13,534
$18,717
$16,474
$20,286
$25,307
$19,764
$19,038
$68,396
$59,563
$0
$100,000
$200,000
$300,000
$400,000
$500,000
$600,000
Total RelationshipManagement
Compliance/Regulatory
Sell-SideSecurities
Analyst
Trading& Sales
Corp. Fin./Underwriter/
M&A
Accountant/Auditor/
Other
Consultant/Invest.
Consult.
CFO CEO/ CAO/COO/ CIO/
Pres.
Corp./Comm.Banking
Treasury Other
Other Consulting Fees
Compensation as Board Director Dividends from employer company shares held
Deferred/multi-year incentive compensation Stock options
Stock awards/phantom shares Profit sharing bonuses
Performance bonuses Commissions/sales bonuses
Base salary
Summary
2014 Aggregate Compensation
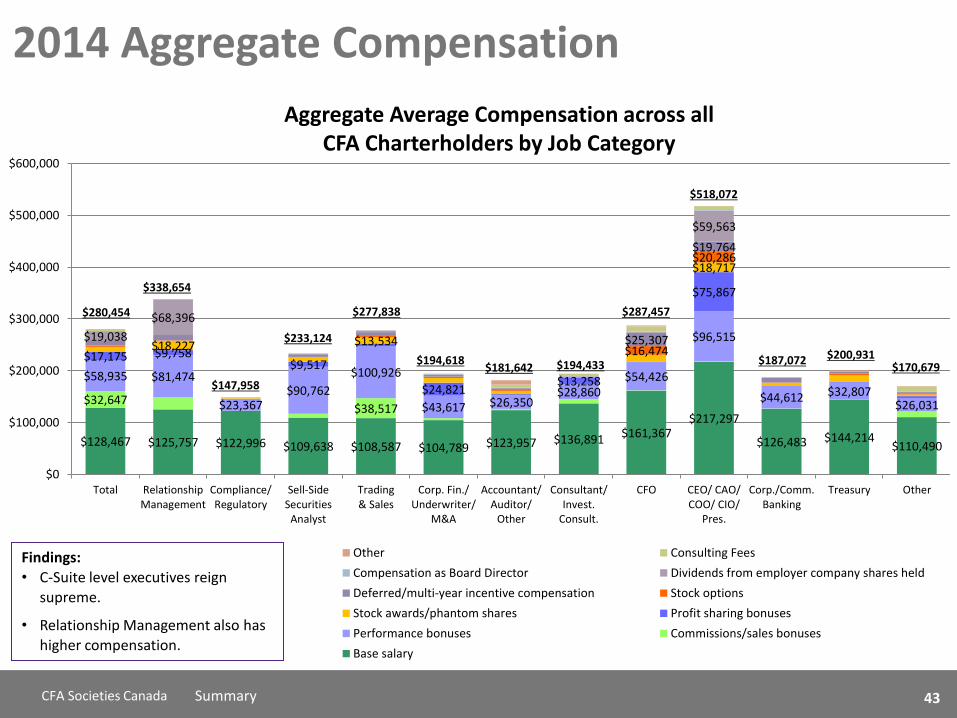
Aggregate Average Compensation across all CFA Charterholders by Job Category
$280,454
$338,654
$147,958
$233,124
$277,838
$194,618 $181,642 $194,433
$287,457
$518,072
$187,072 $200,931 $170,679
Findings: • C-Suite level executives reign
supreme.
• Relationship Management also has higher compensation.
43

44 CFA Societies Canada Summary
2014 Aggregate Compensation
Findings
• Due to the necessity of changing position groupings, there are no comparisons to 2011 data available.
• C-Suite Executives and Portfolio Managers receive higher total compensation, while Portfolio Analysts ($99,075), Compliance/Regulation ($147,958), Marketing and Product Development ($154,883), and Buy-side Research Analysts (Other) ($144,060) receive lower compensation.
Aggregate Compensation across all CFA Charterholders by position
Mean Median
Total $280,454 $147,550 Finan. Or Invest. Adv./ Broker $275,290 $136,000
Invest. Counsel./Private Client $356,640 $215,000
Portfolio Man. (Equity) $619,559 $295,000
Portfolio Man. (Fixed Income) $376,222 $172,000
Portfolio Man.(Multi-asset) $496,374 $205,500
Portfolio Man. (Other) $314,170 $167,000
Manager of Managers $235,542 $127,770 Portfolio Analyst $99,075 $88,500 Risk Management $243,238 $129,000 Buy-Side R.A. (Equity) $197,314 $149,000 Buy-Side R.A. (Other) $144,060 $112,850
Invest. Strateg./ Economist $197,297 $125,000
Market. and Product Develop. $154,883 $111,475
Relationship Management $338,654 $181,500
Compliance/ Regulatory $147,958 $114,670
Sell-Side Securities Analyst $233,124 $125,000
Trading & Sales $277,838 $225,000
Corp. Fin./ Underwriter/ M&A $194,618 $124,545
Accountant/ Auditor/ Other $181,642 $137,200
Consultant/Invest. Consult. $194,433 $120,000
CFO $287,457 $220,000
CEO/ CAO/ COO/ CIO/ Pres. $518,072 $245,584
Corp./Comm. Banking $187,364 $125,000 Treasury $200,931 $130,000 Other $170,679 $121,000
44
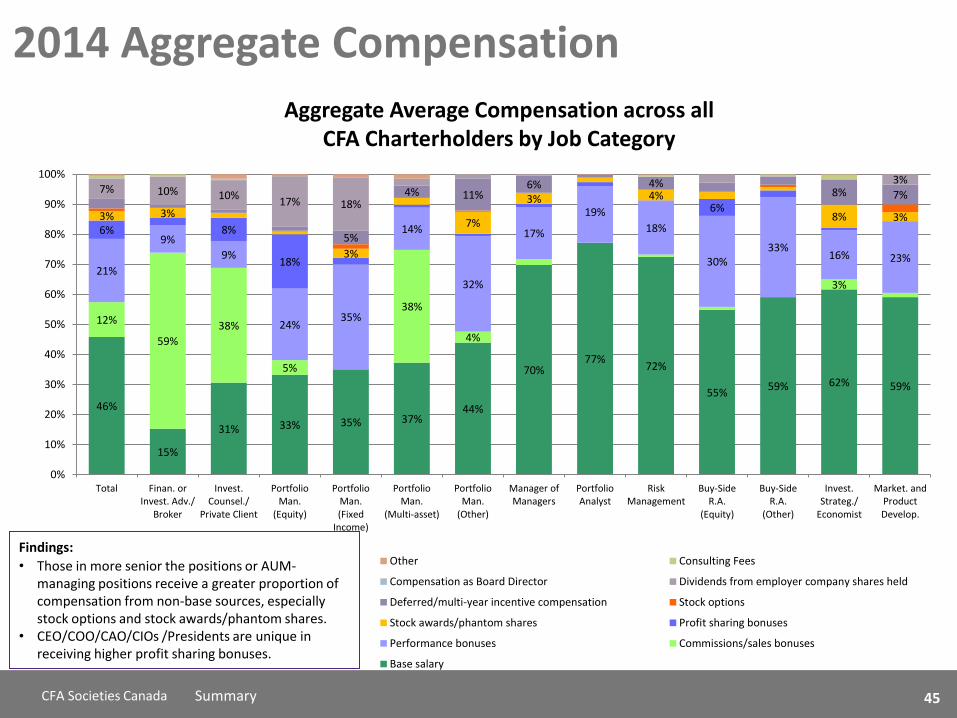
45 CFA Societies Canada
46%
15%
31% 33% 35% 37% 44%
70% 77%
72%
55% 59% 62% 59%
12%
59%
38%
5%
38%
4%
3% 21%
9%
9%
24% 35%
14%
32%
17%
19%
18%
30% 33%
16% 23%
6% 8%
18%
6% 3% 3%
3%
7%
3% 4%
8% 3%
5%
4% 11% 6% 4%
8% 7% 7% 10% 10% 17% 18%
3%
0%
10%
20%
30%
40%
50%
60%
70%
80%
90%
100%
Total Finan. orInvest. Adv./
Broker
Invest.Counsel./
Private Client
PortfolioMan.
(Equity)
PortfolioMan.(Fixed
Income)
PortfolioMan.
(Multi-asset)
PortfolioMan.
(Other)
Manager ofManagers
PortfolioAnalyst
RiskManagement
Buy-SideR.A.
(Equity)
Buy-SideR.A.
(Other)
Invest.Strateg./
Economist
Market. andProductDevelop.
Other Consulting Fees
Compensation as Board Director Dividends from employer company shares held
Deferred/multi-year incentive compensation Stock options
Stock awards/phantom shares Profit sharing bonuses
Performance bonuses Commissions/sales bonuses
Base salary
Summary
2014 Aggregate Compensation
Aggregate Average Compensation across all CFA Charterholders by Job Category
Findings:
• Those in more senior the positions or AUM-managing positions receive a greater proportion of compensation from non-base sources, especially stock options and stock awards/phantom shares.
• CEO/COO/CAO/CIOs /Presidents are unique in receiving higher profit sharing bonuses.
45
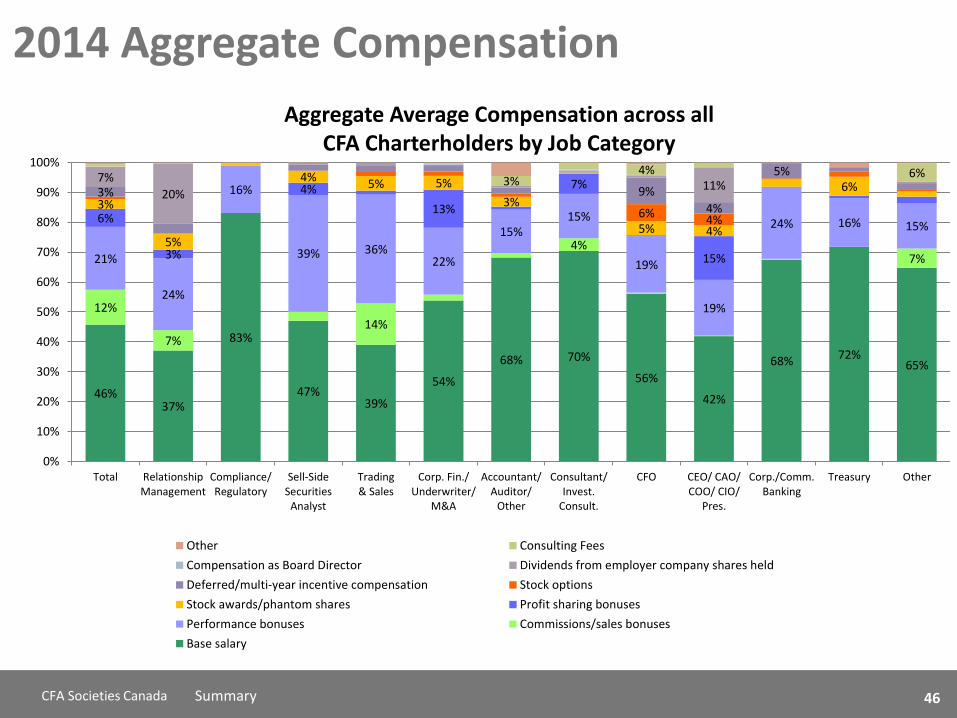
46 CFA Societies Canada Summary
2014 Aggregate Compensation
Aggregate Average Compensation across all CFA Charterholders by Job Category
46% 37%
83%
47% 39%
54%
68% 70%
56%
42%
68% 72% 65%
12%
7% 14%
4% 7% 21%
24%
16%
39% 36% 22%
15% 15%
19%
19%
24% 16% 15% 6%
3%
4%
13%
7%
15%
3%
5%
4% 5% 5%
3%
5% 4%
6%
6% 4%
3% 9%
4%
5% 7%
20% 11% 3%
4% 6%
0%
10%
20%
30%
40%
50%
60%
70%
80%
90%
100%
Total RelationshipManagement
Compliance/Regulatory
Sell-SideSecurities
Analyst
Trading& Sales
Corp. Fin./Underwriter/
M&A
Accountant/Auditor/
Other
Consultant/Invest.
Consult.
CFO CEO/ CAO/COO/ CIO/
Pres.
Corp./Comm.Banking
Treasury Other
Other Consulting Fees
Compensation as Board Director Dividends from employer company shares held
Deferred/multi-year incentive compensation Stock options
Stock awards/phantom shares Profit sharing bonuses
Performance bonuses Commissions/sales bonuses
Base salary
46
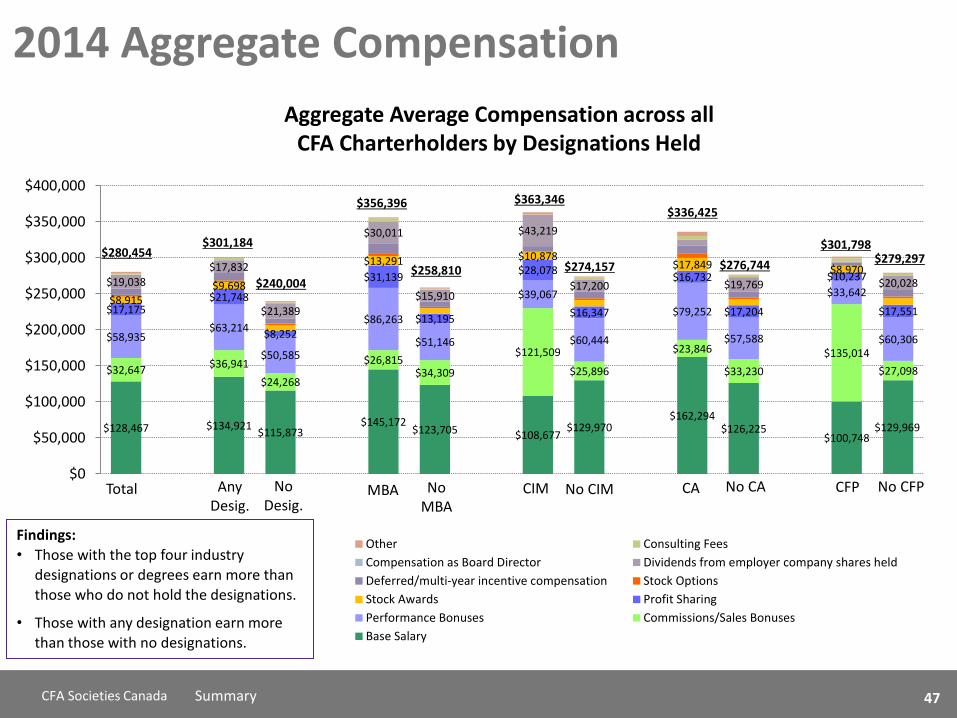
47 CFA Societies Canada
Aggregate Average Compensation across all CFA Charterholders by Designations Held
$128,467 $134,921 $115,873
$145,172 $123,705 $108,677
$129,970 $162,294
$126,225 $100,748
$129,969
$32,647 $36,941
$24,268
$26,815 $34,309
$121,509
$25,896
$23,846
$33,230
$135,014
$27,098
$58,935 $63,214
$50,585
$86,263
$51,146
$39,067
$60,444
$79,252
$57,588
$33,642
$60,306
$17,175 $21,748
$8,252
$31,139
$13,195
$28,078
$16,347
$16,732
$17,204
$10,237
$17,551 $8,915
$9,698
$13,291 $10,878 $17,849 $8,970
$19,038 $17,832
$21,389
$30,011
$15,910
$43,219
$17,200 $19,769 $20,028
$0
$50,000
$100,000
$150,000
$200,000
$250,000
$300,000
$350,000
$400,000
Other Consulting Fees
Compensation as Board Director Dividends from employer company shares held
Deferred/multi-year incentive compensation Stock Options
Stock Awards Profit Sharing
Performance Bonuses Commissions/Sales Bonuses
Base Salary
2014 Aggregate Compensation
Summary
$280,454 $301,184
$240,004
$356,396
$258,810
$363,346
$274,157
MBA Total
$301,798
$336,425
$276,744 $279,297
No MBA
CA No CA CFP No CFP Any Desig.
No Desig.
CIM No CIM
Findings: • Those with the top four industry
designations or degrees earn more than
those who do not hold the designations.
• Those with any designation earn more than those with no designations.
47

48 CFA Societies Canada Summary
2014 Aggregate Compensation
Findings
• Those with leading industry designations or degrees have higher mean and median values than those who do not hold the industry designation or degree.
• Those hold ANY industry designation or degree have a higher median and mean income than those who have no degrees.
Aggregate Compensation across all CFA
Charterholders by designations held
Mean Median
Total $280,454 $147,550
Any Designation $301,184 $156,500
No Designations $240,004 $135,000
MBA $356,396 $175,000
No MBA $258,810 $140,000
CIM $363,346 $180,000
No CIM $274,157 $145,000
CA $336,425 $182,700
No CA $276,744 $145,000
CFP $301,798 $191,000
No CFP $279,297 $145,000
48
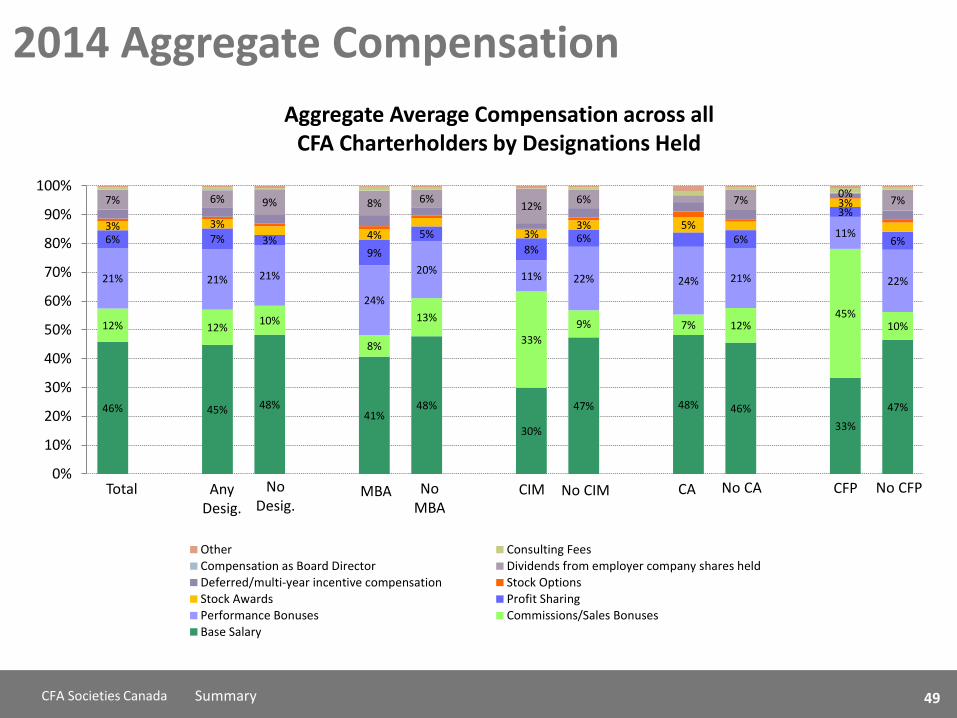
49 CFA Societies Canada
Aggregate Average Compensation across all CFA Charterholders by Designations Held
46% 45% 48% 41%
48%
30%
47% 48% 46%
33%
47%
12% 12% 10%
8%
13%
33%
9% 7% 12% 45%
10%
21% 21% 21%
24%
20% 11% 22% 24% 21%
11%
22%
6% 7% 3% 9%
5%
8% 6% 6%
3%
6%
3% 3% 4% 3%
3% 5%
3% 7% 6% 9% 8% 6% 12%
6% 7% 0%
7%
0%
10%
20%
30%
40%
50%
60%
70%
80%
90%
100%
Other Consulting FeesCompensation as Board Director Dividends from employer company shares heldDeferred/multi-year incentive compensation Stock OptionsStock Awards Profit SharingPerformance Bonuses Commissions/Sales BonusesBase Salary
2014 Aggregate Compensation
Summary
MBA Total No MBA
CA No CA CFP No CFP Any Desig.
No Desig.
CIM No CIM
49

50 CFA Societies Canada
52%
34%
28%
24%
23%
18%
11%
2%
1%
7%
51%
35%
23%
19%
30%
1%
11%
A formal evaluation process
A formal pay scale or grid
Market-based surveys/review2
Specific performance targets
Cost of living increase
Fully discretionary
Base salary is fixed or capped –not reviewed
Collective/union bargaining
Other
Don't know
2015
2012
D14. Which of the following does your employer use to calculate your base salary level adjustments?
Base: Receive base salary (n=2,432)
Salary Adjustment
Key Differences
• Those more likely to mention a formal evaluation process include: • Those in Ottawa (69%) or Montréal (62%), those under the age of
30 (58%) or 30-34 (57%), and those with 500-999 (62%), 1,000-4,999 (65%) or 5,000+ (57%) employees.
• Those working in retail banking (69%) or insurance (69%), and those in the role of Risk Management (66%), Investment Strategists/Economist (70%), Marketing and Product Development (64%), Accountant/Auditor (62%) or Commercial/Corporate Banking (66%).
• Those more likely to mention a formal pay scale or grid include: • Those in Edmonton (58%), Ottawa (49%), Montréal (42%) or
Québec (62%), women (39%), those ages 30-34 (39%), and those with 500-999 (44%), 1,000-4,999 (44%) or 5,000+ (42%) employees.
• Those working in retail banking (49%), government finance (70%) or insurance (51%), and those in the role of Risk Management (52%), Compliance/Regulatory (48%), Corporate Finance/Underwriter/M&A (42%), Treasury (73%) or Commercial/Corporate Banking (57%).
Findings
• Half (52%) say their base salary is adjusted through a formal evaluation process, while one-third (34%) say they follow a formal pay scale or grid.
• Three in ten (28%) say it’s adjusted using market-based surveys/reviews, while one-quarter say it is based on meeting specific performance targets (24%) or a cost of living increase (23%).
• Two in ten (18%) say it is fully discretionary.
Continued…
50
51 CFA Societies Canada
Salary Adjustment
Key Differences
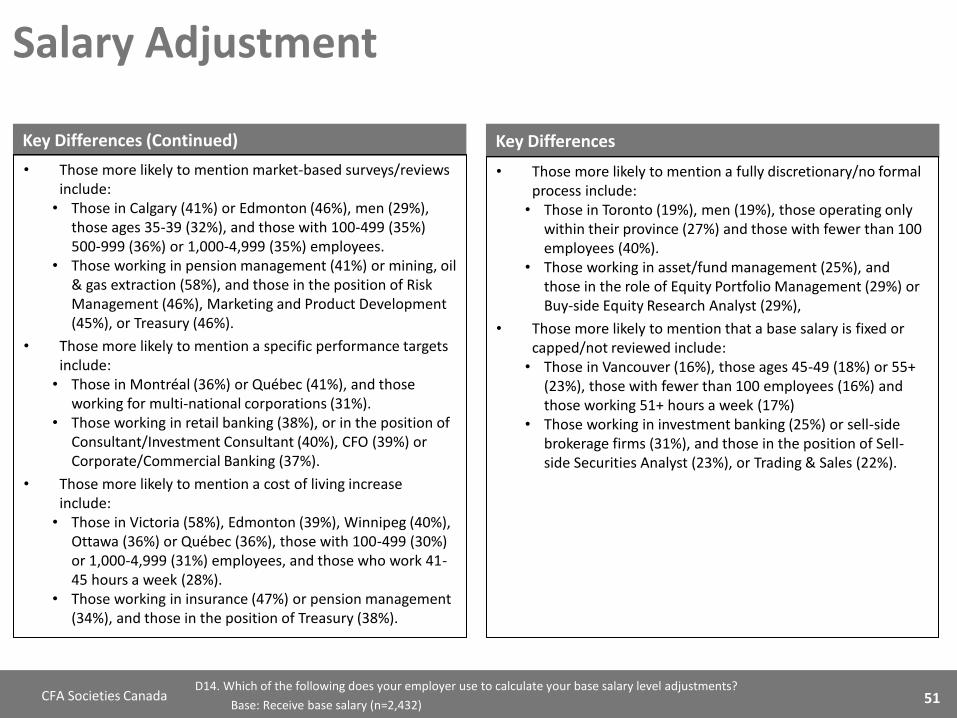
• Those more likely to mention a fully discretionary/no formal process include: • Those in Toronto (19%), men (19%), those operating only
within their province (27%) and those with fewer than 100 employees (40%).
• Those working in asset/fund management (25%), and those in the role of Equity Portfolio Management (29%) or Buy-side Equity Research Analyst (29%),
• Those more likely to mention that a base salary is fixed or capped/not reviewed include: • Those in Vancouver (16%), those ages 45-49 (18%) or 55+
(23%), those with fewer than 100 employees (16%) and those working 51+ hours a week (17%)
• Those working in investment banking (25%) or sell-side brokerage firms (31%), and those in the position of Sell-side Securities Analyst (23%), or Trading & Sales (22%).
Key Differences (Continued)
• Those more likely to mention market-based surveys/reviews include: • Those in Calgary (41%) or Edmonton (46%), men (29%),
those ages 35-39 (32%), and those with 100-499 (35%) 500-999 (36%) or 1,000-4,999 (35%) employees.
• Those working in pension management (41%) or mining, oil & gas extraction (58%), and those in the position of Risk Management (46%), Marketing and Product Development (45%), or Treasury (46%).
• Those more likely to mention a specific performance targets include: • Those in Montréal (36%) or Québec (41%), and those
working for multi-national corporations (31%). • Those working in retail banking (38%), or in the position of
Consultant/Investment Consultant (40%), CFO (39%) or Corporate/Commercial Banking (37%).
• Those more likely to mention a cost of living increase include: • Those in Victoria (58%), Edmonton (39%), Winnipeg (40%),
Ottawa (36%) or Québec (36%), those with 100-499 (30%) or 1,000-4,999 (31%) employees, and those who work 41-45 hours a week (28%).
• Those working in insurance (47%) or pension management (34%), and those in the position of Treasury (38%).
D14. Which of the following does your employer use to calculate your base salary level adjustments?
Base: Receive base salary (n=2,432) 51
52 CFA Societies Canada
64%
47%
47%
36%
26%
20%
11%
6%
4%
3%
5%
70%
57%
54%
40%
28%
30%
1%
4%
Overall firm performance
Business unit/divisionperformance
Other factors related toindividual performance
Discretionary
Individual investmentperformance
Individual financialcontribution
Percentage of revenue
Percentage of fees
Percentage of AUM
Other
Don't Know
2015
2012
D15. Which of the following does your employer use to calculate your commissions/sales bonuses, performance bonuses, or stock options?
Base: Receive commissions/sales bonuses, performance bonuses, or stock options (n=2,254)
Bonus Determination
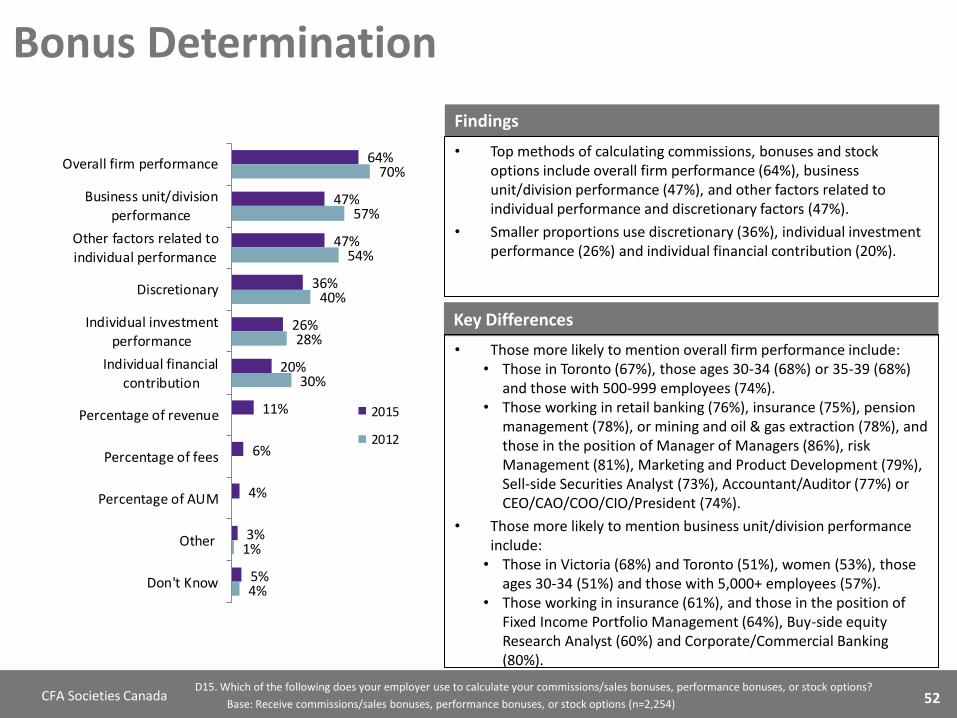
Key Differences
• Those more likely to mention overall firm performance include: • Those in Toronto (67%), those ages 30-34 (68%) or 35-39 (68%)
and those with 500-999 employees (74%). • Those working in retail banking (76%), insurance (75%), pension
management (78%), or mining and oil & gas extraction (78%), and those in the position of Manager of Managers (86%), risk Management (81%), Marketing and Product Development (79%), Sell-side Securities Analyst (73%), Accountant/Auditor (77%) or CEO/CAO/COO/CIO/President (74%).
• Those more likely to mention business unit/division performance include: • Those in Victoria (68%) and Toronto (51%), women (53%), those
ages 30-34 (51%) and those with 5,000+ employees (57%). • Those working in insurance (61%), and those in the position of
Fixed Income Portfolio Management (64%), Buy-side equity Research Analyst (60%) and Corporate/Commercial Banking (80%).
Findings
• Top methods of calculating commissions, bonuses and stock options include overall firm performance (64%), business unit/division performance (47%), and other factors related to individual performance and discretionary factors (47%).
• Smaller proportions use discretionary (36%), individual investment performance (26%) and individual financial contribution (20%).
52
53 CFA Societies Canada
Bonus Determination Key Differences
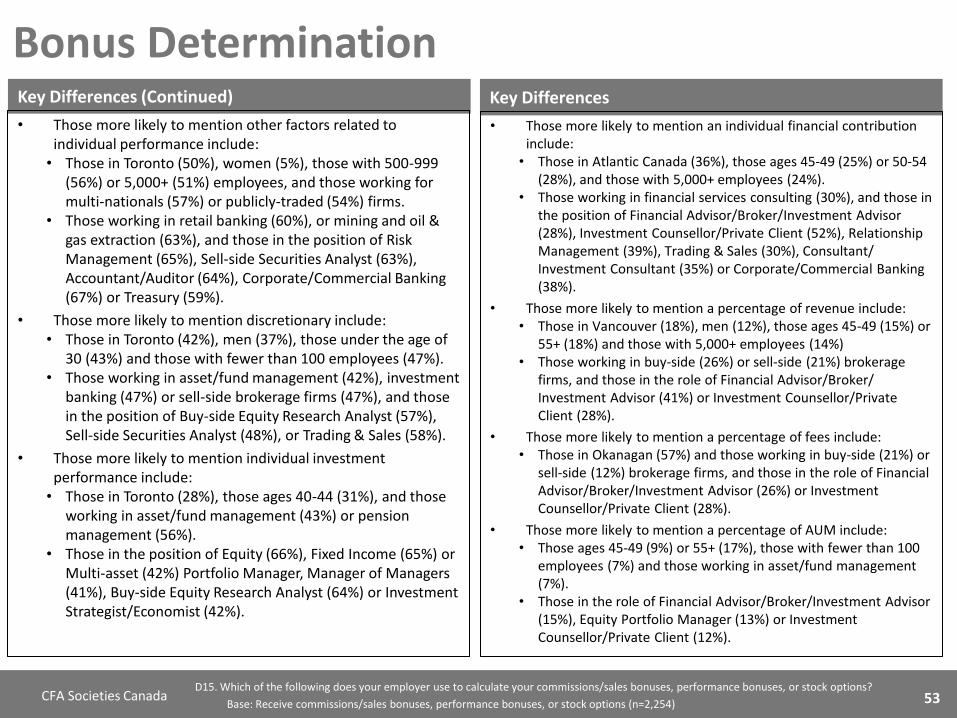
• Those more likely to mention an individual financial contribution include: • Those in Atlantic Canada (36%), those ages 45-49 (25%) or 50-54
(28%), and those with 5,000+ employees (24%). • Those working in financial services consulting (30%), and those in
the position of Financial Advisor/Broker/Investment Advisor (28%), Investment Counsellor/Private Client (52%), Relationship Management (39%), Trading & Sales (30%), Consultant/ Investment Consultant (35%) or Corporate/Commercial Banking (38%).
• Those more likely to mention a percentage of revenue include: • Those in Vancouver (18%), men (12%), those ages 45-49 (15%) or
55+ (18%) and those with 5,000+ employees (14%) • Those working in buy-side (26%) or sell-side (21%) brokerage
firms, and those in the role of Financial Advisor/Broker/ Investment Advisor (41%) or Investment Counsellor/Private Client (28%).
• Those more likely to mention a percentage of fees include: • Those in Okanagan (57%) and those working in buy-side (21%) or
sell-side (12%) brokerage firms, and those in the role of Financial Advisor/Broker/Investment Advisor (26%) or Investment Counsellor/Private Client (28%).
• Those more likely to mention a percentage of AUM include: • Those ages 45-49 (9%) or 55+ (17%), those with fewer than 100
employees (7%) and those working in asset/fund management (7%).
• Those in the role of Financial Advisor/Broker/Investment Advisor (15%), Equity Portfolio Manager (13%) or Investment Counsellor/Private Client (12%).
Key Differences (Continued)
• Those more likely to mention other factors related to individual performance include: • Those in Toronto (50%), women (5%), those with 500-999
(56%) or 5,000+ (51%) employees, and those working for multi-nationals (57%) or publicly-traded (54%) firms.
• Those working in retail banking (60%), or mining and oil & gas extraction (63%), and those in the position of Risk Management (65%), Sell-side Securities Analyst (63%), Accountant/Auditor (64%), Corporate/Commercial Banking (67%) or Treasury (59%).
• Those more likely to mention discretionary include: • Those in Toronto (42%), men (37%), those under the age of
30 (43%) and those with fewer than 100 employees (47%). • Those working in asset/fund management (42%), investment
banking (47%) or sell-side brokerage firms (47%), and those in the position of Buy-side Equity Research Analyst (57%), Sell-side Securities Analyst (48%), or Trading & Sales (58%).
• Those more likely to mention individual investment performance include: • Those in Toronto (28%), those ages 40-44 (31%), and those
working in asset/fund management (43%) or pension management (56%).
• Those in the position of Equity (66%), Fixed Income (65%) or Multi-asset (42%) Portfolio Manager, Manager of Managers (41%), Buy-side Equity Research Analyst (64%) or Investment Strategist/Economist (42%).
D15. Which of the following does your employer use to calculate your commissions/sales bonuses, performance bonuses, or stock options?
Base: Receive commissions/sales bonuses, performance bonuses, or stock options (n=2,254) 53
54 CFA Societies Canada
60%
24%
5%
11%
Increase
Stay the same
Decrease
Don't Know
D16. Do you believe your total compensation for 2015 will...?
2015 Compensation
Key Differences
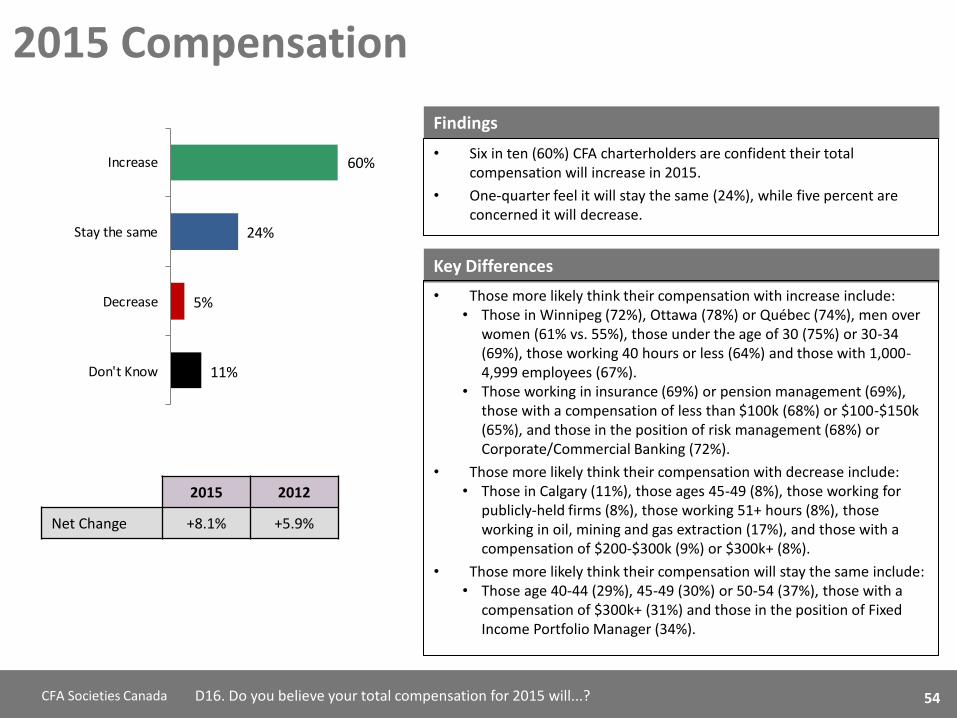
• Those more likely think their compensation with increase include: • Those in Winnipeg (72%), Ottawa (78%) or Québec (74%), men over
women (61% vs. 55%), those under the age of 30 (75%) or 30-34 (69%), those working 40 hours or less (64%) and those with 1,000-4,999 employees (67%).
• Those working in insurance (69%) or pension management (69%), those with a compensation of less than $100k (68%) or $100-$150k (65%), and those in the position of risk management (68%) or Corporate/Commercial Banking (72%).
• Those more likely think their compensation with decrease include: • Those in Calgary (11%), those ages 45-49 (8%), those working for
publicly-held firms (8%), those working 51+ hours (8%), those working in oil, mining and gas extraction (17%), and those with a compensation of $200-$300k (9%) or $300k+ (8%).
• Those more likely think their compensation will stay the same include: • Those age 40-44 (29%), 45-49 (30%) or 50-54 (37%), those with a
compensation of $300k+ (31%) and those in the position of Fixed Income Portfolio Manager (34%).
Findings
• Six in ten (60%) CFA charterholders are confident their total compensation will increase in 2015.
• One-quarter feel it will stay the same (24%), while five percent are concerned it will decrease.
2015 2012
Net Change +8.1% +5.9%
54

55
Benefits

56 CFA Societies Canada
82
37
34
29
35
38
27
17
48
45
47
7
37
17
6
4
6
9
11
24
7
2
5
0
2
54
56
48
46
45
55
48
14
12
4
26
3
6
28
31
4
16
6
1
11
6
2
4
13
4
4
15
10
7
6
4
6
8
7
25
8
22
9
5
25
10
16
5
10
2
3
2
97
95
94
92
91
90
88
69
68
65
58
58
48
45
43
40
35
35
33
30
28
10
10
6
CFA Professional Membership dues
Health insurance
Dental insurance
Long Term Disability Insurance
Life insurance
Short-Term Disability Insurance
Vision insurance
Pension Benefits
Tuition/work related training
Continuing Education credit
Out of Country Travel
Health/Fitness/Club Memberships
Other Professional Memberships
Employer provided parking
Group RRSP
Stock/Stock Options Program
Car or housing
Parental/Caregiver Leave Top Ups
Annual medical exam
Accounting Designa. Dues (not CFA)
Loan/credit card interest rates/fees
Supplemental pension arrang. (RPA)
Other significant benefits
PPRPs/VRSPs (Québec)
By Employer
By Both
By Employee
E1. Which of the following benefits do you receive in full or in part from your workplace?
Benefits
Key Differences
• Regionally, those in Toronto are more likely to have vision insurance (90%), group RRSP (49%), and stock or stock options (46%), while those in Montréal are more likely to receive RPA (15%), other designation dues (38%), out of country travel (67%), health memberships (64%), parental/caregiver leave top-ups (43%) and annual medical exams (40%). Those in Victoria (89%), Edmonton (78%), Saskatchewan (86%) and Québec (74%) are more likely to receive pension benefits.
• Those more likely to receive CFA charter dues include:
– Those in Saskatchewan (100%) and Winnipeg (100%), those under the age of 30 (99%) or 30-34 (99%), those working in pension management (99%) and those working for the six chartered banks (99%).
– Those in the position of Equity Portfolio Manager (100%), Buy-side Research Analyst (100%), Marketing and Product Development (100%) and Corporate/ Commercial Banking (100%).
Findings
• The top benefits include CFA Professional Membership dues (97%), and various forms of insurance, including health (95%), dental (94%), long-term disability (92%), life (91%), short-term disability (90%) and vision (88%). Many of these are jointly funded by the employer and the employee.
Continued on next page…
56

57 CFA Societies Canada E1. Which of the following benefits do you receive in full or in part from your workplace?
Benefits
Key Differences
• Benefits received varies by position type:
• Equity Portfolio Managers: out of country travel (69%).
• Fixed-Income Portfolio Managers: health (100%), dental (99%) and long-term disability (98%) insurance and health/fitness club memberships (69%).
• Risk Management: health (98%), short-term disability (96%) and long-term disability (95%) insurance, as well as pension benefits (86%), stocks or stock options (52%), and supplemental pensions (18%).
• Accountant/Auditor: accounting designation dues other than CFA designation (69%), other professional membership dues (65%), CE credit reimbursement (77%) and tuition/work-related training dues (78%)
• CFO: accounting designation dues other than CFA designation (74%).
• CEO/CAO/CO/CIO/President: out of country travel (69%) and employer-provided parking (55%).
• Commercial/corporate banking: health (98%), dental (98%), vision (95%), and short-term disability (98%) and long-term disability (97%) insurance, as well as pension benefits (91%), stocks or stock options (68%), car or housing (49%), health/fitness club memberships (71%), parental/caregiver leave top-ups (49%) and credit card fees (65%).
Key Differences (Continued)
• Benefits received varies by firm type:
• Retail banking: life (96%), health (100%), dental (99%) or vision (95%) insurance, short-term disability insurance (98%), long-term disability insurance (96%), pension benefits (90%) and stock/stock options (68%).
• Investment banking: short-term disability insurance (95%), stock options purchase programs (59%) and credit card fees (53%).
• Insurance: health insurance (99%), pension benefits (84%), employer-provided parking (57%), and health/fitness and club memberships (72%).
• Pension management: life (97%), health (98%), vision (93%), and long-term disability (97%) and short-term disability (98%) insurance, as well as pension benefits (89%), accounting designation dues other than CFA designation (39%) and tuition/work-related training reimbursement (75%).
• Government finance: life (98%), and short-term disability (97%) or long-term disability (100%) insurance, as well as pension benefits (96%) and parental/caregiver leave top-ups (57%).
• Sell-side brokerages: life (95%), health (98%), dental (97%), vision (97%), long-term disability insurance (95%) and stock option purchase programs (54%).
• Buy-side brokerages: CE credit reimbursement (80%), car or housing (50%), and stock option purchase programs (57%).
57
58
Detailed Employment Profile

59 CFA Societies Canada
26%
4%
6%
64%
25%
4%
7%
64%
One of the 6 largestchartered banks in
Canada
One of the 3 largestinsurance firms in
Canada
One of the 10 largestpension plans in
Canada
None of the above
2015
2012
B2. Which one of the following do you work for?
Employer
Key Differences
• Those more likely to mention one of the six largest chartered banks include those in Toronto (34%), English speakers (27%), those with 5,000+ employees (53%), those with $20B+ in company AUM (43%) and those with 51+ hours a week (32%).
• Those more likely to mention one of the three largest insurance companies include those in Winnipeg (18%) or Toronto (6%) and those with 5,000+ employees (9%).
• Those more likely to mention one of the 10 largest pension plans in Canada include those in Victoria (50%), Edmonton (25%) or Montréal (13%), French speakers (12%), those under the age of 30 (10%), and those with 100-499 (13%), 500-999 (29%) or 1,000-4,999 (11%) employees.
• Those more likely to mention they work in none of the above include those in Vancouver (76%), Calgary (81%), Saskatchewan (89%), Winnipeg (76%), Ottawa (86%), Québec (80%) or Atlantic Canada (80%), those with fewer than 100 (96%), 100-499 (76%) or 1,000-4,999 (79%) employees, and those operating only within their own province (90%).
Findings
• A quarter of CFA charterholders work for one of the six largest chartered banks in Canada (26%), while only 4% work for one of the three largest insurance firms and 6% for one of the 10 largest pension plans.
• Nearly two-thirds (64%) work for none of these types of organizations.
59
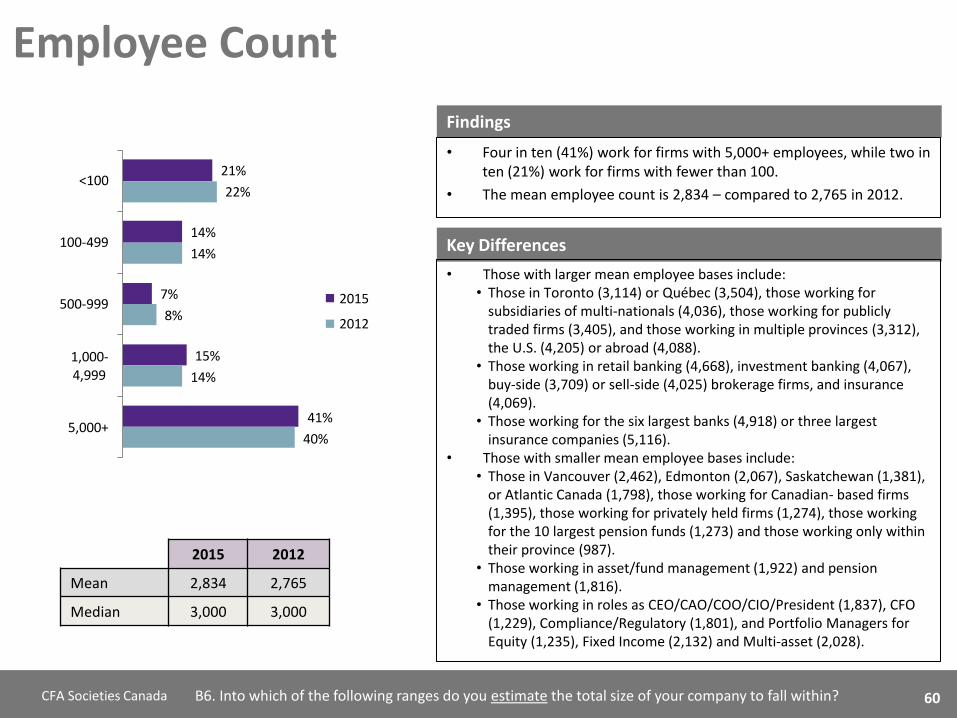
60 CFA Societies Canada B6. Into which of the following ranges do you estimate the total size of your company to fall within?
Employee Count
Key Differences
• Those with larger mean employee bases include: • Those in Toronto (3,114) or Québec (3,504), those working for
subsidiaries of multi-nationals (4,036), those working for publicly traded firms (3,405), and those working in multiple provinces (3,312), the U.S. (4,205) or abroad (4,088).
• Those working in retail banking (4,668), investment banking (4,067), buy-side (3,709) or sell-side (4,025) brokerage firms, and insurance (4,069).
• Those working for the six largest banks (4,918) or three largest insurance companies (5,116).
• Those with smaller mean employee bases include: • Those in Vancouver (2,462), Edmonton (2,067), Saskatchewan (1,381),
or Atlantic Canada (1,798), those working for Canadian- based firms (1,395), those working for privately held firms (1,274), those working for the 10 largest pension funds (1,273) and those working only within their province (987).
• Those working in asset/fund management (1,922) and pension management (1,816).
• Those working in roles as CEO/CAO/COO/CIO/President (1,837), CFO (1,229), Compliance/Regulatory (1,801), and Portfolio Managers for Equity (1,235), Fixed Income (2,132) and Multi-asset (2,028).
Findings
• Four in ten (41%) work for firms with 5,000+ employees, while two in ten (21%) work for firms with fewer than 100.
• The mean employee count is 2,834 – compared to 2,765 in 2012.
2015 2012
Mean 2,834 2,765
Median 3,000 3,000
21%
14%
7%
15%
41%
22%
14%
8%
14%
40%
<100
100-499
500-999
1,000-
4,999
5,000+
2015
2012
60
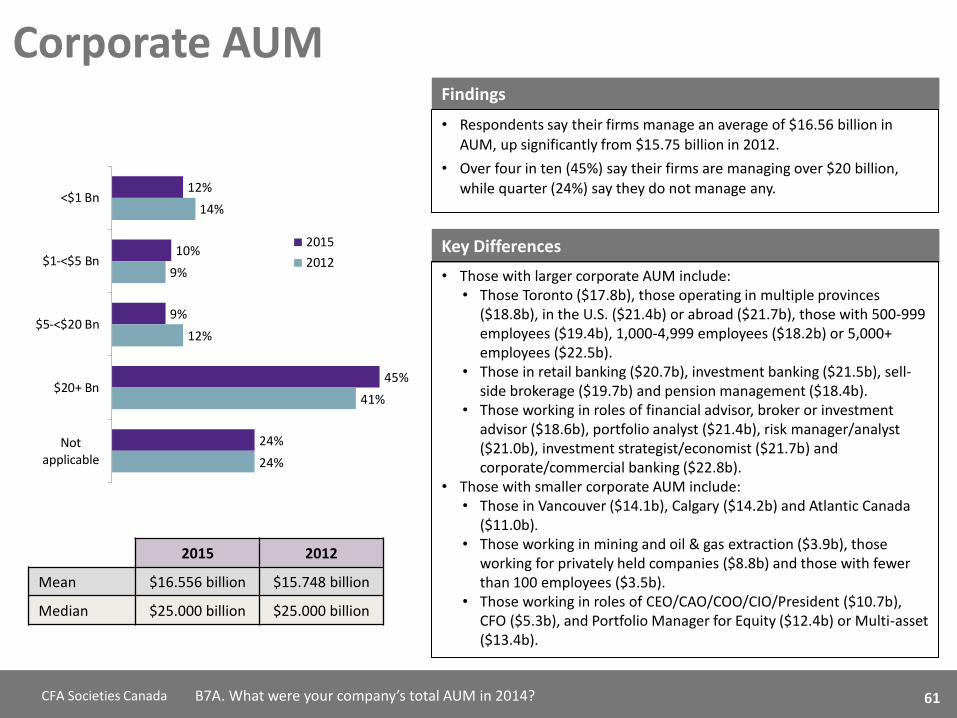
61 CFA Societies Canada B7A. What were your company’s total AUM in 2014?
Corporate AUM
Key Differences
• Those with larger corporate AUM include: • Those Toronto ($17.8b), those operating in multiple provinces
($18.8b), in the U.S. ($21.4b) or abroad ($21.7b), those with 500-999 employees ($19.4b), 1,000-4,999 employees ($18.2b) or 5,000+ employees ($22.5b).
• Those in retail banking ($20.7b), investment banking ($21.5b), sell-side brokerage ($19.7b) and pension management ($18.4b).
• Those working in roles of financial advisor, broker or investment advisor ($18.6b), portfolio analyst ($21.4b), risk manager/analyst ($21.0b), investment strategist/economist ($21.7b) and corporate/commercial banking ($22.8b).
• Those with smaller corporate AUM include: • Those in Vancouver ($14.1b), Calgary ($14.2b) and Atlantic Canada
($11.0b). • Those working in mining and oil & gas extraction ($3.9b), those
working for privately held companies ($8.8b) and those with fewer than 100 employees ($3.5b).
• Those working in roles of CEO/CAO/COO/CIO/President ($10.7b), CFO ($5.3b), and Portfolio Manager for Equity ($12.4b) or Multi-asset ($13.4b).
Findings
• Respondents say their firms manage an average of $16.56 billion in AUM, up significantly from $15.75 billion in 2012.
• Over four in ten (45%) say their firms are managing over $20 billion, while quarter (24%) say they do not manage any. 12%
10%
9%
45%
24%
14%
9%
12%
41%
24%
<$1 Bn
$1-<$5 Bn
$5-<$20 Bn
$20+ Bn
Notapplicable
2015
2012
2015 2012
Mean $16.556 billion $15.748 billion
Median $25.000 billion $25.000 billion
61

62 CFA Societies Canada
12%
19%
11%
11%
47%
15%
18%
11%
10%
47%
<$100 Mn
$100 Mn-<$1Bn
$1 Bn-<$5 Bn
$5+ Bn
Not applicable
2015
2012
B7B. What were the AUM you were responsible for in 2014?
Self-Managed AUM
Key Differences
• Those with larger personal AUM include:
• Those in Toronto ($5.2b), those operating in the U.S. ($5.4b) or abroad ($5.8b), and those with total compensation of $300k+ ($5.1b).
• Those working in asset/fund management ($5.3b), insurance ($6.2b), pension management ($7.7b), and government finance ($9.5b).
• Those working in roles of Fixed Income Portfolio Management ($7.1b), Manager of Managers ($7.5b), Risk Management ($12.7b), Investment Strategist/Economist ($10.9b), and Marketing and Product Development ($11.5b).
• Those with smaller personal AUM include:
• Those in Vancouver ($2.4b), Calgary ($1.4b), Winnipeg ($2.6b) or Atlantic Canada ($2.2b) and those operating only within their province ($2.6b).
• Those working in buy-side ($2.3b) or sell-side ($11.6b) brokerages, financial services consulting ($1.5b), and oil & gas extraction ($0.4b).
• Those working in roles of CFO ($1.6b), Equity Portfolio Manager ($2.9b) and Corporate/Commercial Banking ($2.2b).
Findings
• More than half (53%) of CFA charterholders say they personally manage AUM with 11 percent saying they manage $5 billion or more.
• On average, CFA charterholders manage $4.2 billion, up significantly from $3.5 billion in 2012.
2015 2012
Mean $4,166 million $3,459 million
Median $750 million $300 million
Continued on next page…
62
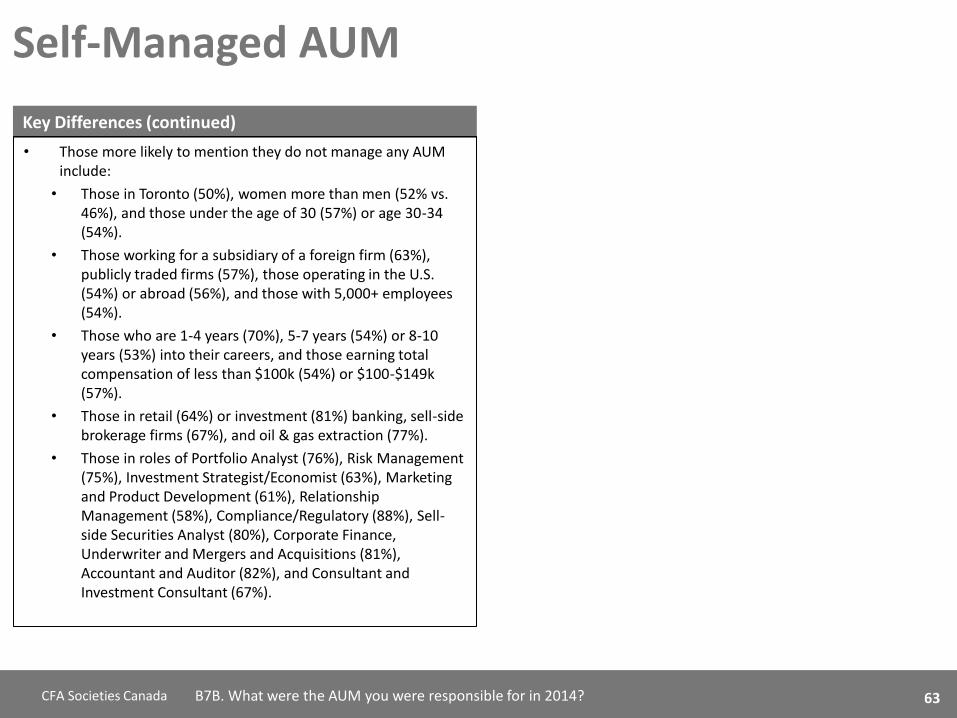
63 CFA Societies Canada B7B. What were the AUM you were responsible for in 2014?
Self-Managed AUM
Key Differences (continued)
• Those more likely to mention they do not manage any AUM include:
• Those in Toronto (50%), women more than men (52% vs. 46%), and those under the age of 30 (57%) or age 30-34 (54%).
• Those working for a subsidiary of a foreign firm (63%), publicly traded firms (57%), those operating in the U.S. (54%) or abroad (56%), and those with 5,000+ employees (54%).
• Those who are 1-4 years (70%), 5-7 years (54%) or 8-10 years (53%) into their careers, and those earning total compensation of less than $100k (54%) or $100-$149k (57%).
• Those in retail (64%) or investment (81%) banking, sell-side brokerage firms (67%), and oil & gas extraction (77%).
• Those in roles of Portfolio Analyst (76%), Risk Management (75%), Investment Strategist/Economist (63%), Marketing and Product Development (61%), Relationship Management (58%), Compliance/Regulatory (88%), Sell-side Securities Analyst (80%), Corporate Finance, Underwriter and Mergers and Acquisitions (81%), Accountant and Auditor (82%), and Consultant and Investment Consultant (67%).
63
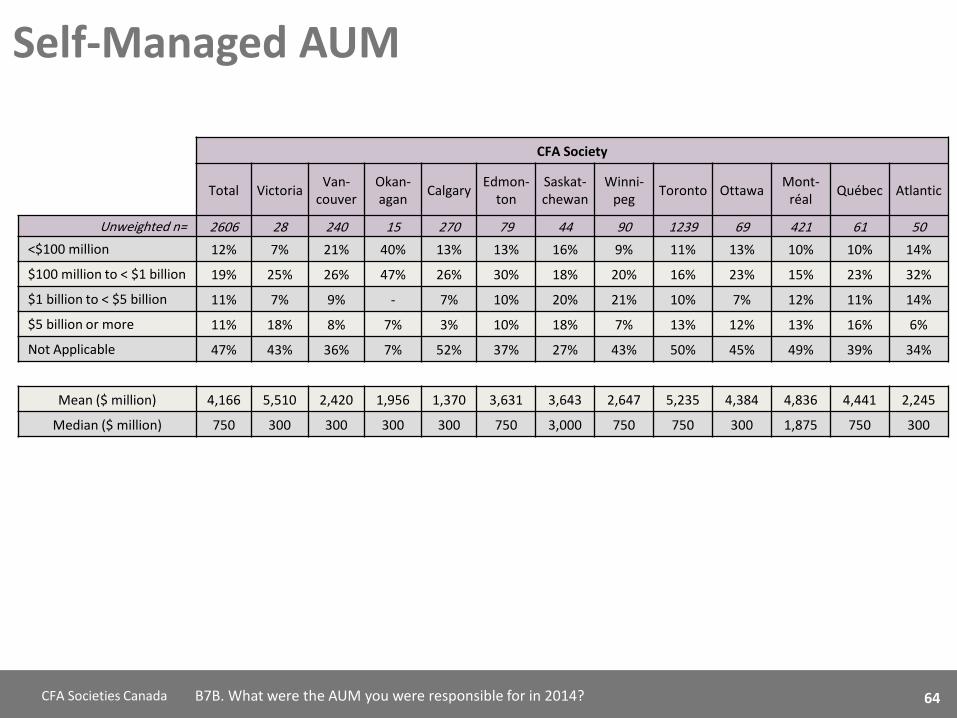
64 CFA Societies Canada B7B. What were the AUM you were responsible for in 2014?
Self-Managed AUM
CFA Society
Total Victoria Van-
couver Okan-agan
Calgary Edmon-
ton Saskat-chewan
Winni-peg
Toronto Ottawa Mont-
réal Québec Atlantic
Unweighted n= 2606 28 240 15 270 79 44 90 1239 69 421 61 50
<$100 million 12% 7% 21% 40% 13% 13% 16% 9% 11% 13% 10% 10% 14%
$100 million to < $1 billion 19% 25% 26% 47% 26% 30% 18% 20% 16% 23% 15% 23% 32%
$1 billion to < $5 billion 11% 7% 9% - 7% 10% 20% 21% 10% 7% 12% 11% 14%
$5 billion or more 11% 18% 8% 7% 3% 10% 18% 7% 13% 12% 13% 16% 6%
Not Applicable 47% 43% 36% 7% 52% 37% 27% 43% 50% 45% 49% 39% 34%
Mean ($ million) 4,166 5,510 2,420 1,956 1,370 3,631 3,643 2,647 5,235 4,384 4,836 4,441 2,245
Median ($ million) 750 300 300 300 300 750 3,000 750 750 300 1,875 750 300
64

65 CFA Societies Canada B7B. What were the AUM you were responsible for in 2014?
Self-Managed AUM
Current Position (1 of 2)
Total
Finan. Or Invest. Adv./
Broker
Invest. Counsel. / Private
Client
Portfolio Man.
(Equity)
Portfolio Man. (Fixed
Income)
Portfolio Man. (Multi -asset)
Portfolio Man.
(Other)
Manager of
Managers
Portfolio Analyst
Risk Manage
ment
Buy-Side R.A.
(Equity)
Buy-Side R.A.
(Other)
Invest. Strateg./ Econo-
mist
Market. and
Product Develop.
Unweighted n= 2606 163 193 157 83 74 137 57 46 153 87 60 65 57
<$100 million 12% 40% 19% 17% 6% 23% 24% 2% 9% 2% 8% 8% 5% 5%
$100 million to < $1 billion
19% 42% 70% 39% 30% 39% 21% 12% 2% 3% 23% 12% 6% 2%
$1 billion to < $5 billion 11% 2% 5% 27% 22% 16% 22% 28% 4% 5% 31% 18% 8% 7%
$5 billion or more 11% 3% 1% 14% 37% 15% 23% 35% 9% 15% 13% 25% 18% 25%
Not Applicable 47% 12% 5% 3% 5% 7% 10% 23% 76% 75% 25% 37% 63% 61%
Mean ($ million) 4,166 731 592 2,877 7,071 3,518 4,759 7,524 7,897 12,667 4,151 8,035 10,905 11,489
Median ($ million) 750 300 300 750 3,000 300 750 3,000 3,000 7,500 3,000 3,000 5,250 7,500
65
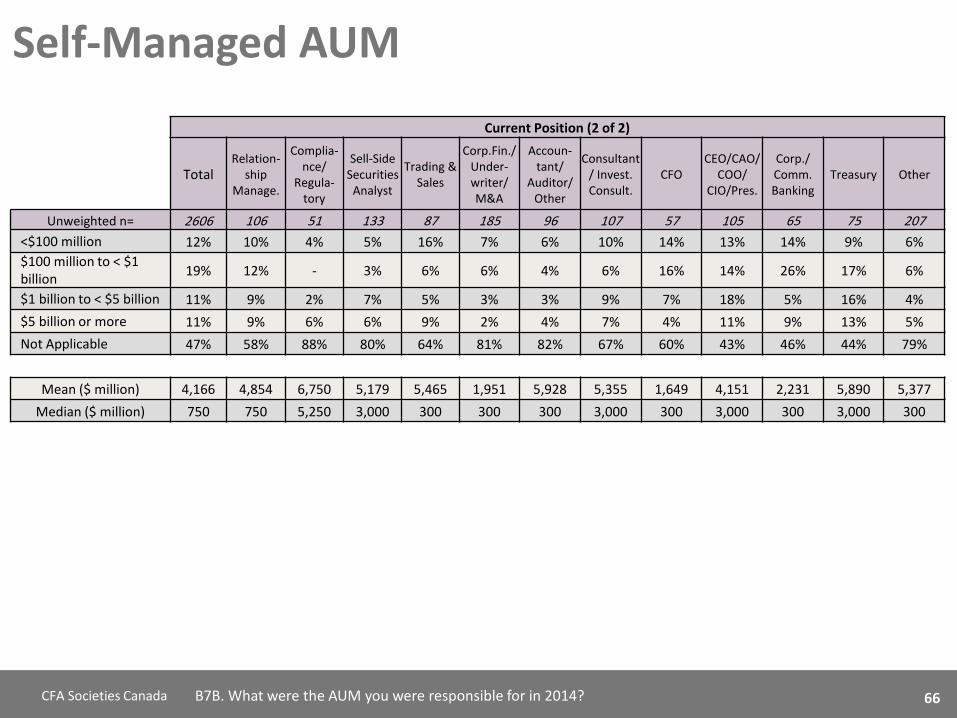
66 CFA Societies Canada B7B. What were the AUM you were responsible for in 2014?
Self-Managed AUM
Current Position (2 of 2)
Total Relation-
ship Manage.
Complia-nce/
Regula-tory
Sell-Side Securities
Analyst
Trading & Sales
Corp.Fin./ Under-writer/ M&A
Accoun-tant/
Auditor/ Other
Consultant / Invest. Consult.
CFO CEO/CAO/
COO/ CIO/Pres.
Corp./ Comm. Banking
Treasury Other
Unweighted n= 2606 106 51 133 87 185 96 107 57 105 65 75 207
<$100 million 12% 10% 4% 5% 16% 7% 6% 10% 14% 13% 14% 9% 6%
$100 million to < $1 billion
19% 12% - 3% 6% 6% 4% 6% 16% 14% 26% 17% 6%
$1 billion to < $5 billion 11% 9% 2% 7% 5% 3% 3% 9% 7% 18% 5% 16% 4%
$5 billion or more 11% 9% 6% 6% 9% 2% 4% 7% 4% 11% 9% 13% 5%
Not Applicable 47% 58% 88% 80% 64% 81% 82% 67% 60% 43% 46% 44% 79%
Mean ($ million) 4,166 4,854 6,750 5,179 5,465 1,951 5,928 5,355 1,649 4,151 2,231 5,890 5,377
Median ($ million) 750 750 5,250 3,000 300 300 300 3,000 300 3,000 300 3,000 300
66
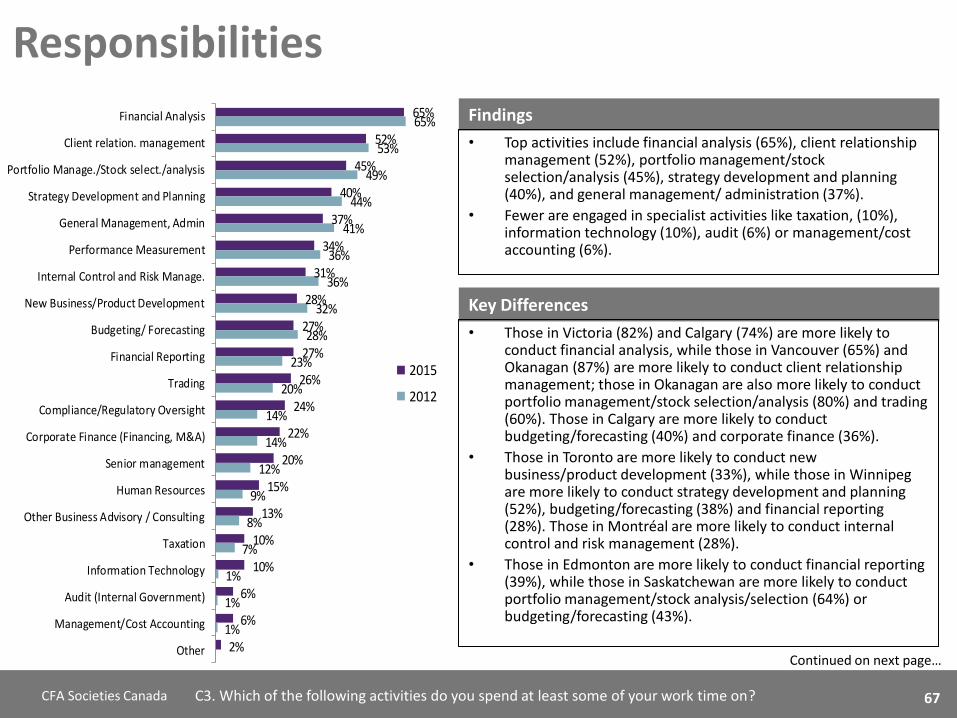
67 CFA Societies Canada
65%
52%
45%
40%
37%
34%
31%
28%
27%
27%
26%
24%
22%
20%
15%
13%
10%
10%
6%
6%
2%
65%
53%
49%
44%
41%
36%
36%
32%
28%
23%
20%
14%
14%
12%
9%
8%
7%
1%
1%
1%
Financial Analysis
Client relation. management
Portfolio Manage./Stock select./analysis
Strategy Development and Planning
General Management, Admin
Performance Measurement
Internal Control and Risk Manage.
New Business/Product Development
Budgeting/ Forecasting
Financial Reporting
Trading
Compliance/Regulatory Oversight
Corporate Finance (Financing, M&A)
Senior management
Human Resources
Other Business Advisory / Consulting
Taxation
Information Technology
Audit (Internal Government)
Management/Cost Accounting
Other
2015
2012
C3. Which of the following activities do you spend at least some of your work time on?
Responsibilities
Key Differences
• Those in Victoria (82%) and Calgary (74%) are more likely to conduct financial analysis, while those in Vancouver (65%) and Okanagan (87%) are more likely to conduct client relationship management; those in Okanagan are also more likely to conduct portfolio management/stock selection/analysis (80%) and trading (60%). Those in Calgary are more likely to conduct budgeting/forecasting (40%) and corporate finance (36%).
• Those in Toronto are more likely to conduct new business/product development (33%), while those in Winnipeg are more likely to conduct strategy development and planning (52%), budgeting/forecasting (38%) and financial reporting (28%). Those in Montréal are more likely to conduct internal control and risk management (28%).
• Those in Edmonton are more likely to conduct financial reporting (39%), while those in Saskatchewan are more likely to conduct portfolio management/stock analysis/selection (64%) or budgeting/forecasting (43%).
Findings
• Top activities include financial analysis (65%), client relationship management (52%), portfolio management/stock selection/analysis (45%), strategy development and planning (40%), and general management/ administration (37%).
• Fewer are engaged in specialist activities like taxation, (10%), information technology (10%), audit (6%) or management/cost accounting (6%).
Continued on next page…
67

68 CFA Societies Canada C3. Which of the following activities do you spend at least some of your work time on?
Responsibilities
Key Differences
• Sell-side Brokerage: client relationship management (76%) and trading (48%).
• Insurance: no significant differences.
• Pension Management: portfolio management/stock selection/analysis (59%), performance measurement (49%), internal control and risk management (42%), and audit (11%).
• Government Finance: budgeting/forecasting (48%).
• Financial Services Consulting: client relationship management (79%), performance measurement (45%), other business advisory or consulting services (33%).
• Oil & Gas Extraction: financial analysis (90%), strategy development and planning (54%), budgeting/forecasting (67%) and corporate finance (63%).
Key Differences (continued)
• Those earning total compensation of $300k+ are more likely to be conducting client relationship management (72%), portfolio management/stock selection/analysis (61%), general management/administration (47%), strategy development and planning (47%), new business/product development (26%), trading (34%), senior management (38%), human resources (26%) and taxation (14%). Those earning a total compensation of less than $100k are more likely to be conducting financial reporting (30%).
• Certain tasks are more likely to be conducted by those in specific industries:
• Asset/Fund Management: portfolio management/stock selection/analysis (64%) and new business/product development (34%).
• Retail Banking: internal control and risk management (51%) and compliance/regulatory oversight (45%).
• Investment Banking: financial analysis (81%), client relationship management (69%) and corporate finance (62%).
• Buy-Side Brokerage: portfolio management/stock selection/analysis (79%), client relationship management (66%) and trading (54%).
68
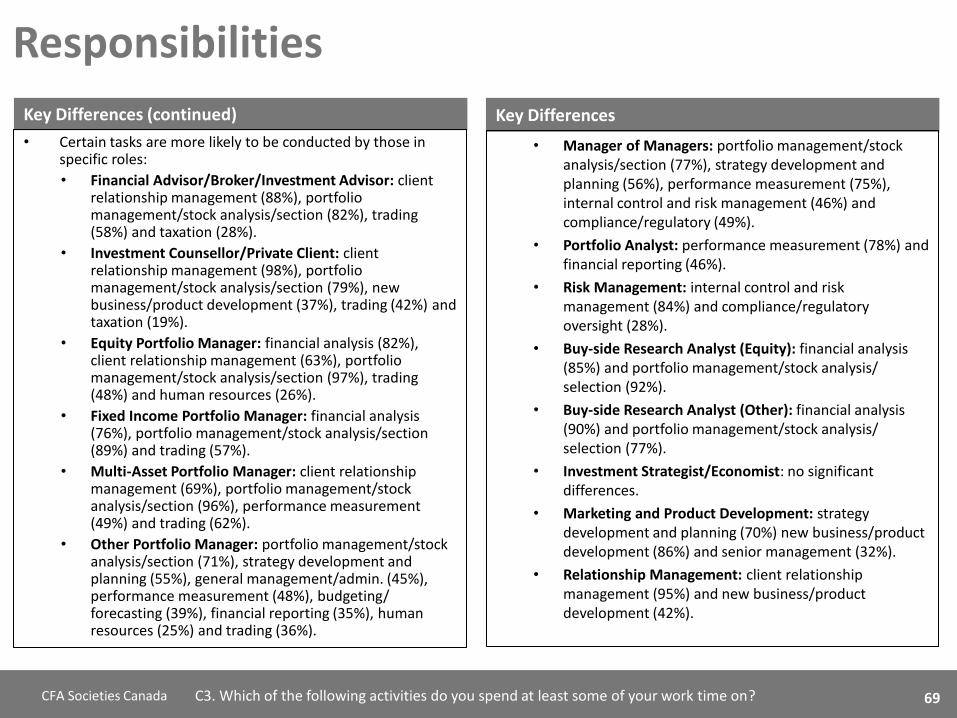
69 CFA Societies Canada C3. Which of the following activities do you spend at least some of your work time on?
Responsibilities
Key Differences
• Manager of Managers: portfolio management/stock analysis/section (77%), strategy development and planning (56%), performance measurement (75%), internal control and risk management (46%) and compliance/regulatory (49%).
• Portfolio Analyst: performance measurement (78%) and financial reporting (46%).
• Risk Management: internal control and risk management (84%) and compliance/regulatory oversight (28%).
• Buy-side Research Analyst (Equity): financial analysis (85%) and portfolio management/stock analysis/ selection (92%).
• Buy-side Research Analyst (Other): financial analysis (90%) and portfolio management/stock analysis/ selection (77%).
• Investment Strategist/Economist: no significant differences.
• Marketing and Product Development: strategy development and planning (70%) new business/product development (86%) and senior management (32%).
• Relationship Management: client relationship management (95%) and new business/product development (42%).
Key Differences (continued)
• Certain tasks are more likely to be conducted by those in specific roles:
• Financial Advisor/Broker/Investment Advisor: client relationship management (88%), portfolio management/stock analysis/section (82%), trading (58%) and taxation (28%).
• Investment Counsellor/Private Client: client relationship management (98%), portfolio management/stock analysis/section (79%), new business/product development (37%), trading (42%) and taxation (19%).
• Equity Portfolio Manager: financial analysis (82%), client relationship management (63%), portfolio management/stock analysis/section (97%), trading (48%) and human resources (26%).
• Fixed Income Portfolio Manager: financial analysis (76%), portfolio management/stock analysis/section (89%) and trading (57%).
• Multi-Asset Portfolio Manager: client relationship management (69%), portfolio management/stock analysis/section (96%), performance measurement (49%) and trading (62%).
• Other Portfolio Manager: portfolio management/stock analysis/section (71%), strategy development and planning (55%), general management/admin. (45%), performance measurement (48%), budgeting/ forecasting (39%), financial reporting (35%), human resources (25%) and trading (36%).
69

70 CFA Societies Canada C3. Which of the following activities do you spend at least some of your work time on?
Responsibilities
Key Differences
• CFO: financial analysis (86%), strategy development and planning (72%), general management/admin. (82%), performance measurement (53%), internal control and risk management (81%), budgeting/forecasting (98%), financial reporting (91%), compliance/regulatory oversight (54%), corporate finance (79%), senior management (79%), human resources (39%), taxation (68%), information technology (33%), audit (18%) and management accounting/cost accounting (56%).
• CEO/CAO/COO/CIO/President: strategy development and planning (77%), general management/admin. (73%), performance measurement (44%), internal control and risk management (54%), new business/product development (53%), budgeting/forecasting (55%), financial reporting (43%), compliance/regulatory oversight (41%), corporate finance (31%), senior management (76%), human resources (48%), taxation (20%), information technology (22%) and audit (13%).
• Treasury: financial analysis (91%), internal control and risk management (65%), budgeting/forecasting (73%), financial reporting (49%) and corporate finance (64%).
Key Differences (continued)
• Certain tasks are more likely to be conducted by those in specific roles (continued):
• Compliance/Regulatory: internal control and risk management (51%) and compliance/oversight (84%).
• Sell-side Securities Analyst: financial analysis (93%).
• Trading & Sales: trading (78%).
• Corporate Finance/Underwriter/M&A: financial analysis (93%), strategy development and planning (61%), budgeting/forecasting (58%), financial reporting (37%), corporate finance (83%) and management accounting/cost accounting (10%).
• Accountant/Auditor: internal control and risk management (49%), budgeting/forecasting (47%), financial reporting (63%), other business advisor or consulting services (25%), taxation (20%), audit (22%) and management accounting/cost accounting (20%).
• Consultant/Investment Consultant: client relationship management (78%), strategy development and planning (55%), performance measurement (50%), and other business advisor or consulting services (51%).
• Corporate/Commercial Banking: financial analysis (91%), client relationship management (82%), internal control and risk management (45%), and corporate finance (72%).
70

71 CFA Societies Canada
22%
17%
7%
6%
5%
5%
4%
3%
3%
3%
2%
2%
2%
2%
2%
1%
1%
1%
11%
34%
26%
14%
7%
9%
5%
3%
5%
3%
2%
2%
3%
3%
2%
1%
1%
1%
1%
1%
14%
36%
MBA
Other Master's
CIM
CA
CFP
FRM
FCSI
CMA
CPA
CAIA
P.Eng.
PFP
CGA
FSA
FCIA
Masters of Tax
Doctorate
CBV/CA
Others
None
2015
2012
C4. Which of the following professional designations and post-graduate degrees do you currently hold?
Designations
Key Differences
• Those more likely to have a MBA include those in Toronto (28%), English speakers (24%), those ages 40-44 (27%), 45-49 (30%), 50-54 (33%) or 55+ (35%), those working in retail banking (34%), those who work 51 hours or more a week (28%), those earning $300k+ in total compensation (30%) and those in the role of Equity Portfolio Manager (29%).
• Those more likely to have an other Master’s degree include those in Montréal (34%) or Québec (38%), those ages 35-39 (23%), those working in government finance (33%) and those in the role of Fixed Income Portfolio Manager (29%), Risk Management (25%) or Investment Strategist/Economist (42%).
• Those more likely to say they have no professional designations include those in Vancouver (40%), Calgary (49%) or Winnipeg (46%), those under the age of 30 (60%) or 30-34 (45%), those with <$100k in compensation (42%) and those in the position of Relationship Management (48%), Corporate Finance/Underwriter/Mergers & Acquisitions (41%) or Corporate/Commercial Banking (48%).
Findings
• The MBA is the most frequently held designation, held by two in ten CFA charterholders (22%). Other top designations include other Master’s degrees (17%), the CIM designation (7%), the CA (6%), the CFP (5%) and the FRM (5%).
• One-third of CFA charterholders indicate they do not hold any other professional designations or post-graduate degrees (34%).
71

72 CFA Societies Canada C4. Which of the following professional designations and post-graduate degrees do you currently hold?
Designations
CFA Society
Total Victoria Van-
couver Okan-agan
Calgary Edmon-
ton Saskat-chewan
Winni-peg
Toronto Ottawa Mont-
réal Québec Atlantic
Unweighted n= 2606 28 240 15 270 79 44 90 1239 69 421 61 50 MBA 22% 18% 18% 7% 13% 24% 27% 9% 28% 22% 18% 16% 32% Other Master's 17% 14% 12% - 7% 10% 2% 9% 16% 19% 34% 38% 8% CIM 7% 7% 11% 33% 7% 13% 9% 4% 7% 6% 2% 5% 10% CA 6% - 6% 13% 6% 10% 5% 6% 7% 3% 4% 7% 8% CFP 5% 11% 10% 20% 6% 9% 2% 8% 5% 6% 1% - 6% FRM 5% - 2% - *% 3% 2% 2% 5% 1% 9% 11% 6% FCSI 4% 4% 6% 33% 5% 9% 5% 2% 3% 6% 2% 3% 2% CMA 3% 7% 3% - 3% 3% 9% 7% 3% 3% 1% 2% 2% CPA 3% 4% 3% - 1% 1% 2% - 4% 6% 3% 8% 2% CAIA 3% 7% 3% 7% 1% 1% 2% 1% 4% - 3% - 4% P.Eng. 2% - 2% - 3% 3% 2% - 2% 7% 2% 5% 2% PFP 2% 4% 3% 13% 4% 8% - 2% 2% 6% - - 4% CGA 2% 4% 3% - 1% 3% - 4% 1% - 5% 2% 2% FSA 2% - 1% - 1% 1% 2% 2% 1% 4% 4% 7% 2% FCIA 2% - 1% - 1% - 2% 3% 1% 4% 3% 7% 2% Master's of Tax 1% - 1% - - - - - 1% 1% *% - - Doctorate 1% - 2% - 1% 3% - 1% 1% 3% *% 2% 4% CBV/CA 1% - 1% 7% 1% - 2% 3% 1% - 1% - 2% Others 11% 8% 11% 20% 8% 11% 11% 11% 9% 9% 19% 29% 10% None 34% 36% 40% 27% 49% 28% 48% 46% 33% 29% 24% 13% 36%
72

73 CFA Societies Canada C4. Which of the following professional designations and post-graduate degrees do you currently hold?
Designations
Current Position (1 of 2)
Total
Finan. Or Invest. Adv./
Broker
Invest. Counsel. / Private
Client
Portfolio Man.
(Equity)
Portfolio Man. (Fixed
Income)
Portfolio Man. (Multi -asset)
Portfolio Man.
(Other)
Manager of
Managers
Portfolio Analyst
Risk Manageme
nt
Buy-Side R.A.
(Equity)
Buy-Side R.A.
(Other)
Invest. Strateg./
Econo-mist
Market. and
Product Develop.
Unweighted n= 2606 163 193 157 83 74 137 57 46 153 87 60 65 57
MBA 22% 20% 18% 29% 24% 18% 22% 19% 13% 20% 29% 13% 20% 21% Other Master's 17% 10% 9% 9% 29% 18% 19% 12% 15% 25% 22% 22% 42% 17% CIM 7% 22% 27% 10% 5% 5% 2% 12% - 1% 5% 7% 3% 5% CA 6% 1% 5% 5% 2% - 7% 4% 9% 4% 7% 3% 2% 4% CFP 5% 21% 25% 4% - 3% 2% 5% 2% 1% 2% - - 4% FRM 5% 2% 2% 1% 6% 4% 3% 7% 13% 17% 2% 8% 2% 4% FCSI 4% 13% 15% 4% 1% 4% 3% 4% - - 1% - - 4% CMA 3% 1% 2% 1% 2% 1% 1% 2% 2% 3% 1% 2% 2% 4% CPA 3% 1% 3% 3% 1% 1% 4% - 7% 4% 2% 2% - 2% CAIA 3% 1% 4% 2% 1% 1% 5% 19% 2% 4% 3% 2% 9% 12% P.Eng. 2% 2% 1% 1% 1% 1% 3% - 2% 2% 5% 2% 2% - PFP 2% 10% 7% 1% - 4% 1% - 2% - - - - 2% CGA 2% - 1% 1% 1% 1% 2% - - 3% 1% - - - FSA 2% 1% - - - 1% 1% - - 3% - - 5% 7% FCIA 2% 1% - 1% - 1% 1% - - 2% - - 3% 5% Master's of Tax 1% 1% - 2% 1% 1% 2% - - 1% 1% - - 2% Doctorate 1% - - - - 1% - - - 1% 1% 2% 5% - CBV/CA 1% 1% 1% - - 1% 1% - - 1% 2% - - - Others 11% 14% 17% 10% 3% 15% 14% 13% 15% 18% 3% 9% 7% 19% None 34% 25% 23% 37% 37% 39% 35% 26% 43% 32% 38% 45% 25% 30%
73

74 CFA Societies Canada C4. Which of the following professional designations and post-graduate degrees do you currently hold?
Designations
Current Position (2 of 2)
Total Relation-
ship Manage.
Complia-nce/
Regula-tory
Sell-Side Securities
Analyst
Trading &
Sales
Corp.Fin./ Under-writer/ M&A
Accoun-tant/
Auditor/ Other
Consultant
/ Invest. Consult.
CFO CEO/CAO
/COO/ CIO/Pres.
Corp./ Comm. Banking
Treasury Other
Unweighted n= 2606 106 51 133 87 185 96 107 57 105 65 75 207 MBA 22% 23% 22% 23% 18% 26% 19% 21% 26% 23% 28% 29% 22% Other Master's 17% 6% 23% 20% 16% 14% 12% 16% 12% 15% 9% 17% 23% CIM 7% 2% 6% 3% 7% 3% - 4% - 8% - - 7% CA 6% 2% 8% 6% 1% 8% 30% 6% 42% 10% 5% 1% 3% CFP 5% 3% - 2% 1% 1% - 3% 4% 8% 3% - 4% FRM 5% 3% 18% 5% 6% 2% 8% 7% 2% 1% 3% 4% 2% FCSI 4% 1% 4% 1% 8% 2% - 3% 4% 4% - 3% 3% CMA 3% 2% 2% 2% - 3% 13% 2% 14% 3% 3% 12% 2% CPA 3% 2% 4% 2% 1% 4% 17% 1% 21% 4% 5% 1% 1% CAIA 3% 1% 6% 1% 5% - 1% 9% - 1% - - 1% P.Eng. 2% 3% 2% 4% 3% 6% 3% 2% - 2% 2% 3% 5% PFP 2% 1% 2% 2% 1% - - 1% 2% 3% - 1% 2% CGA 2% 2% - 1% - 8% 7% 1% 9% 4% 2% 3% 1% FSA 2% 5% 2% 1% - - 18% 7% - 2% - - *% FCIA 2% 2% 2% 1% - 1% 15% 5% - 2% - - *% Master's of Tax 1% 1% 2% - - 2% 1% 1% 2% 1% - - - Doctorate 1% 1% 2% 1% - 1% 2% - - 2% - - 7% CBV/CA 1% - - - - 3% 6% - 4% - - - - Others 11% 11% 12% 14% 8% 11% 13% 18% 14% 22% 3% 7% 8% None 34% 48% 37% 41% 46% 41% 10% 28% 16% 24% 48% 39% 39%
74

75 CFA Societies Canada C6. On average, how many hours per week did you work in 2014?
Hours
Key Differences
• Those working longer hours include those in Toronto (48.6 hours), men over women (48.0 vs. 45.9), those under the age of 30 (50.0), those working in investment banking (56.0) or sell-side brokerage firm (53.4), those working for the six chartered banks (49.2), those operating in the U.S. (48.5) or abroad (48.7), those with a total compensation of $300k+ (51.0), and those in the role of Equity Portfolio Manager (49.6), Relationship Management (49.2), Sell-side Securities Analyst (53.2) or CEO/CAO/COO/CIO/President (50.0).
• Those working fewer hours include those in Edmonton (44.7), Winnipeg (45.8), Ottawa (45.9), Montréal (46.4) or Québec (43.7), those age 55+ (45.8), those working in retail banking (45.3), insurance (43.4), pension management (45.8) or government finance (42.8), those with <$100K in compensation (45.5), and those in the role of Financial Advisor/Broker/Investment Advisor (45.3), Manager of Managers (44.2), Portfolio Analyst (43.2), Risk Management (44.1), Compliance/Regulatory (43.1), Accountant/Auditor (44.9), Consultant/Investment Consultant (44.3) or Treasury (45.6).
Findings
• CFA charterholders report working an average of 47.6 hours per week, down significantly from 48.4 hours per week in 2012.
• About a quarter (23%) say that, on average, they work 51+ hours a week and a further 26 percent work 46-50 hours.
• Three in ten work 40 hours or less (31%).
31%
18%
26%
23%
3%
27%
18%
29%
26%
40 or less
41-45
46-50
51+
Don'tKnow
2015
2012
2015 2012
Mean 47.6 hours/week 48.4 hours/week
Median 46.0 hours/week 50.0 hours/week
75

76 CFA Societies Canada C6. On average, how many hours per week did you work in 2014?
Hours
Current Position (1 of 2)
Total
Finan. Or Invest. Adv./
Broker
Invest. Counsel. / Private
Client
Portfolio Man.
(Equity)
Portfolio Man. (Fixed
Income)
Portfolio Man. (Multi -asset)
Portfolio Man.
(Other)
Manager of
Managers
Portfolio Analyst
Risk Manage
ment
Buy-Side R.A.
(Equity)
Buy-Side R.A.
(Other)
Invest. Strateg./ Econo-
mist
Market. and
Product Develop.
Unweighted n= 2606 163 193 157 83 74 137 57 46 153 87 60 65 57
40 hours or less 31% 40% 33% 18% 31% 22% 20% 42% 54% 46% 20% 27% 28% 26%
41-45 hours 18% 18% 20% 16% 23% 18% 15% 26% 17% 21% 15% 20% 28% 21%
46-50 hours 26% 24% 28% 32% 30% 36% 31% 23% 20% 21% 37% 25% 23% 23%
51 hours or more 23% 15% 18% 31% 16% 19% 31% 7% 4% 11% 25% 27% 14% 26%
Don’t know 3% 3% 1% 3% - 5% 3% 2% 4% 1% 3% 2% 8% 4%
Mean (incl. 0) 47.48 45.29 46.56 49.64 46.07 49.21 50.11 44.20 43.18 44.13 48.44 48.10 45.60 47.84
Median (incl. 0) 46.00 45.00 45.00 50.00 45.00 50.00 50.00 45.00 40.00 45.00 50.00 48.00 45.00 50.00
76

77 CFA Societies Canada C6. On average, how many hours per week did you work in 2014?
Hours
Current Position (2 of 2)
Total Relation-
ship Manage.
Complia-nce/
Regula-tory
Sell-Side Securities
Analyst
Trading & Sales
Corp.Fin./ Under-writer/ M&A
Accoun-tant/
Auditor/ Other
Consultant / Invest. Consult.
CFO CEO/CAO/
COO/ CIO/Pres.
Corp./ Comm. Banking
Treasury Other
Unweighted n= 2606 106 51 133 87 185 96 107 57 105 65 75 207
40 hours or less 31% 22% 49% 25% 11% 29% 40% 38% 18% 19% 25% 45% 43%
41-45 hours 18% 18% 24% 8% 11% 15% 24% 23% 18% 13% 25% 9% 16%
46-50 hours 26% 30% 22% 17% 28% 19% 22% 24% 42% 33% 31% 23% 22%
51 hours or more 23% 25% 4% 48% 45% 35% 14% 12% 19% 31% 17% 17% 17%
Don’t know 3% 5% 2% 2% 5% 2% 1% 2% 4% 3% 3% 5% 3%
Mean (incl. 0) 47.48 49.22 43.10 53.15 52.17 50.37 44.89 44.34 48.44 49.99 47.37 45.59 45.03
Median (incl. 0) 46.00 50.00 41.00 50.00 50.00 50.00 45.00 45.00 50.00 50.00 45.00 45.00 45.00
77

78 CFA Societies Canada
3%
28%
21%
20%
29%
5%
21%
26%
21%
27%
Less than 5 years
5-9 years
10-14 years
15-19 years
20+ years
2015
2011
C7C. Approximately how many years have you been working in your total professional career?
Experience
Key Differences
• Those working for a longer period of time on average include those in Okanagan (19.2 years), those working for privately-held firms (15.9), those operating only within their own provinces (16.5), those with fewer than 100 employees (16.7), those managing $100 million-<$1 billion in AUM (17.5), those with 3+ reports (18.5), and those with total compensation of $150-$199k (16.3) $200-$299k (18.1) or $300k+ (21.4).
• Those in the roles of CEO/CAO/COO/CIO/President (21.3 years), CFO (19.7), Equity (17.5) and Multi-asset (17.8) Portfolio Managers, and Investment Counsellor/Private Client (20.1) have worked longer on average.
• Those working fewer years in total include those asset/fund management (14.5 years) or investment banking (12.0), those working for the 10 largest pension plans (13.2), and those with total compensation of less than $100k (10.8) or $100-$149k (13.6).
• Those working in roles of Portfolio Analyst (11.8 years), Buy-side Equity Research Analyst (10.7 years), Trading & Sales (12.7), Corporate Finance/Underwriter/M&A (11.1 years) and Commercial/Corporate Banking (12.4) have worked fewer years in total.
Findings
• CFA charterholders have total career experience of 15.1 years on average, unchanged from 2012.
• Three in ten (29%) have worked for 20+ years.
• Only three percent have worked fewer than five years.
2015 2012
Mean 15.1 years 15.1 years
Median 14.0 years 14.0 years
2
78
79
About Environics Research
A global company based in Canada,
Environics offers a full range of
quantitative and qualitative research
services, as well as a unique social
values methodology and unrivaled
advanced analytics capabilities.
At Environics, our industry
specialists work with our statisticians
to ensure that clients come away
from the research process with
insights – not just numbers. From
research design through data
analysis and interpretation, we help
our clients understand their
environment and act on the
evidence.
Financial Services Research Division
Environics Research Group
33 Bloor Street East, Suite 900
Toronto, Ontario M4W 3H1
Tel: 416-920-9010
Fax: 416-920-3299
Web: www.environics.ca
David MacDonald, MBA, CMRP
Group Vice President
Robert Stel, MBA, CMRP
Vice President
Kait Filer, CSC
Research Associate
Brittany Denham
Research Associate
CFA® is a registered trademark owned by CFA Institute