ceo message investing in innovation, client growthceo message investing in innovation, client growth...
TRANSCRIPT

April 2017
RECENT TRENDS IN MORTALITY BY CAUSE OF DEATH P2
RESEARCH & DEVELOPMENT INVESTMENT IN CAPABILITIES, CLIENTS P9
GROUP LIFE SHARES MARKET APPROACH P15
INSIDE THIS ISSUE
CEO MESSAGE
Investing in Innovation, Client GrowthInnovation often leads to disruption. History is full of examples – transportation and telecommunications, finance and retail. Now, innovation is disrupting the life insurance business model. This is especially evident in the underwriting arena where data and technology are redefining how carriers select individual risk and market life insurance.
As demonstrated in this edition of SCORviews, SCOR is heavily invested in Research & Development that allows us to provide value beyond traditional reinsurance services. Our purpose is to support our clients’ growth objectives, be that through risk management or innovations that help carriers take advantage of disruption to write more life insurance.
Our R&D staff continuously analyzes our pool of reinsured lives and conducts client- specific experience studies to deepen our knowledge of mortality risks that we share with clients. The team also analyzes new data sources that have the potential to replace traditional underwriting evidence. Understanding the predictive value of these data sources is essential to the transition to accelerated underwriting processes.
R&D Actuary David Wylde and Mary Bahna-Nolan, head of Life R&D, discuss insights from a recent cause of death study. The article compares causes of death data released by the Centers for Disease Control to our own data on insured lives.
Rick Pretty, Deputy Head of Life R&D, reviews R&D initiatives under way at SCOR. Rick also shares our approach to helping individual clients evaluate their mortality risk and explore the viability of accelerated underwriting programs.
Rounding out this issue, Mark Laulainen, Vice President, Group Life & Accident, shares SCOR’s approach to Group Life in the Americas.
For more information on these and all of our reinsurance services, please feel free to contact the authors or your account executive.
By J.C. BruecknerCEO, SCOR Global Life Americas
SCORviews | April 2017 | 2
AN ANALYSIS
Recent Trends in Mortality by Cause of Death
The Centers for Disease Control and Prevention (CDC) regularly issues news releases regarding current trends in US population mortality. In June of 2016, articles in The Washington Post and The Wall Street Journal cited new CDC data from 2015 which showed a rise in the US mortality rate. Figure 1 shows the causes of death and directional impacts on population mortality as noted by the CDC1.
Decreases in Mortality Increases in Mortality
Heart Disease Unintentional Injuries
Cancer Suicide
Stroke Alzheimer’s
Pneumonia Chronic Liver Disease
Hypertension
FIGURE 1 - MORTALITY TRENDS – CDC 2015
Mary Bahna-Nolan, FSA, MAAA, EVP, Head of Life R&D
[email protected] N. Wylde, FSA, MAAA, CLU, ChFC, Director, Actuary-Experience Analysis [email protected]
3
Cause of Death Category 2010 2011 2012 2013 2014 2015
Circulatory System Diseases 32.3% 31.6% 31.4% 31.3% 31.2% 31.3%
Neoplasms 24.2% 23.9% 23.8% 23.4% 23.4% 22.9%
Other 12.5% 13.1% 13.7% 13.8% 13.5% 12.9%
Respiratory System Diseases 7.7% 7.9% 7.8% 8.0% 7.8% 8.0%
Alzheimer's Disease 3.4% 3.4% 3.3% 3.3% 3.6% 4.1%
Endocrine Diseases 3.0% 3.1% 3.1% 3.1% 3.1% 3.2%
External Causes 2.9% 2.9% 2.9% 2.9% 3.0% 3.0%
Infectious Diseases 2.7% 2.8% 2.7% 2.7% 2.7% 2.7%
Influenza and Pneumonia 2.1% 2.2% 2.0% 2.2% 2.1% 2.1%
Genitourinary System Diseases 2.1% 1.9% 1.9% 1.9% 1.9% 1.9%
Digestive System Diseases 1.7% 1.7% 1.7% 1.8% 1.8% 1.9%
Suicide 1.5% 1.5% 1.5% 1.5% 1.6% 1.6%
Poisoning 1.3% 1.4% 1.4% 1.5% 1.6% 1.7%
Motor Vehicle Accidents 1.3% 1.3% 1.3% 1.2% 1.2% 1.3%
Nervous System Diseases 0.9% 0.9% 1.0% 1.0% 1.0% 1.0%
Blood Diseases 0.2% 0.2% 0.2% 0.2% 0.2% 0.2%
Congenital Anomalies 0.1% 0.1% 0.1% 0.2% 0.2% 0.2%
Pregnancy and Childbirth 0.0% 0.0% 0.0% 0.0% 0.0% 0.0%
Perinatal Period Diseases 0.0% 0.0% 0.0% 0.0% 0.0% 0.0%
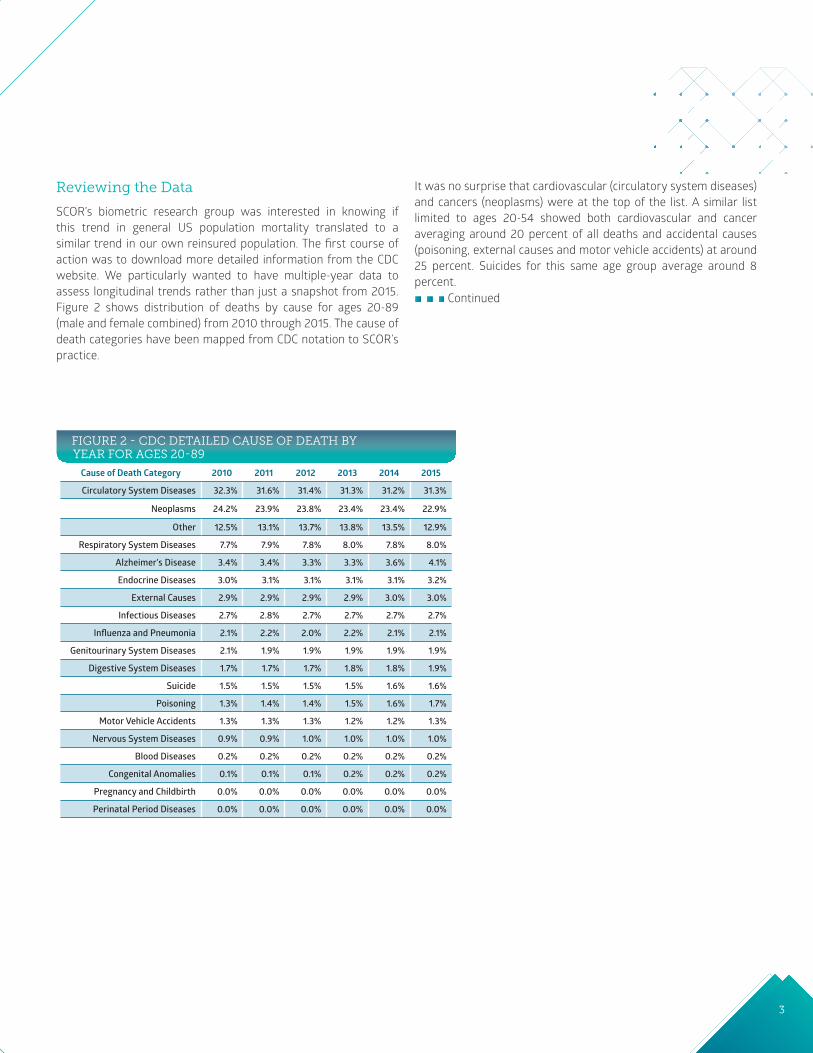
Reviewing the Data
SCOR’s biometric research group was interested in knowing if this trend in general US population mortality translated to a similar trend in our own reinsured population. The first course of action was to download more detailed information from the CDC website. We particularly wanted to have multiple-year data to assess longitudinal trends rather than just a snapshot from 2015. Figure 2 shows distribution of deaths by cause for ages 20-89 (male and female combined) from 2010 through 2015. The cause of death categories have been mapped from CDC notation to SCOR’s practice.
It was no surprise that cardiovascular (circulatory system diseases) and cancers (neoplasms) were at the top of the list. A similar list limited to ages 20-54 showed both cardiovascular and cancer averaging around 20 percent of all deaths and accidental causes (poisoning, external causes and motor vehicle accidents) at around 25 percent. Suicides for this same age group average around 8 percent.
FIGURE 2 - CDC DETAILED CAUSE OF DEATH BY YEAR FOR AGES 20-89
Continued

SCORviews | April 2017 | 4
Next, we reviewed SCOR’s data for ages 20-89 (male and female combined). Figure 3 shows our distribution of death counts (not amounts of reinsurance) by cause category. As with the CDC data, we were able to obtain detailed information from 2010 through 2015.
Similar to the general US population, cardiovascular and cancers (neoplasms) were the leading causes for these ages. Limiting the age group to 20-54 showed cancer as the leading cause, averaging around 35 percent; cardiovascular as number two at 20 percent; accidents (poisoning, external causes and motor vehicle accidents) at 25 percent. Suicides for this age group averaged around 10 percent.
AN ANALYSIS
Recent Trends in Mortality by Cause of Death Cont.
Cause of Death Category 2010 2011 2012 2013 2014 2015
Neoplasms 39.8% 40.9% 39.0% 38.7% 37.5% 37.4%
Circulatory System Diseases 23.6% 22.8% 23.0% 24.0% 23.0% 23.2%
External Causes 16.8% 14.5% 10.6% 10.0% 11.1% 10.3%
Respiratory System Diseases 3.1% 3.2% 4.1% 4.5% 4.9% 5.7%
Suicide 4.8% 4.4% 4.5% 4.2% 4.1% 4.1%
Motor Vehicle Accidents 3.4% 3.0% 2.9% 2.5% 2.2% 2.5%
Nervous System Diseases 1.1% 2.2% 2.8% 2.9% 3.0% 3.2%
Digestive System Diseases 2.2% 2.1% 2.7% 2.7% 2.7% 2.9%
Other 0.7% 1.4% 2.7% 2.6% 2.7% 2.7%
Endocrine Diseases 1.2% 1.3% 2.1% 2.3% 2.1% 2.1%
Infectious Diseases 1.1% 1.2% 1.6% 1.6% 1.8% 1.9%
Influenza and Pneumonia 0.9% 1.2% 1.6% 1.5% 1.9% 1.5%
Genitourinary System Diseases 1.1% 1.3% 1.3% 1.3% 1.5% 1.5%
Alzheimer's Disease 0.1% 0.2% 0.6% 0.6% 0.8% 0.6%
Blood Diseases 0.1% 0.2% 0.3% 0.3% 0.3% 0.3%
Congenital Anomalies 0.1% 0.1% 0.1% 0.1% 0.1% 0.1%
Poisoning 0.0% 0.0% 0.0% 0.1% 0.1% 0.0%
Perinatal Period Diseases 0.0% 0.0% 0.0% 0.0% 0.1% 0.0%
Pregnancy and Childbirth 0.0% 0.0% 0.0% 0.0% 0.0% 0.0%
FIGURE 3 - SCOR DETAILED CAUSE OF DEATH BY YEAR FOR AGES 20-89
5
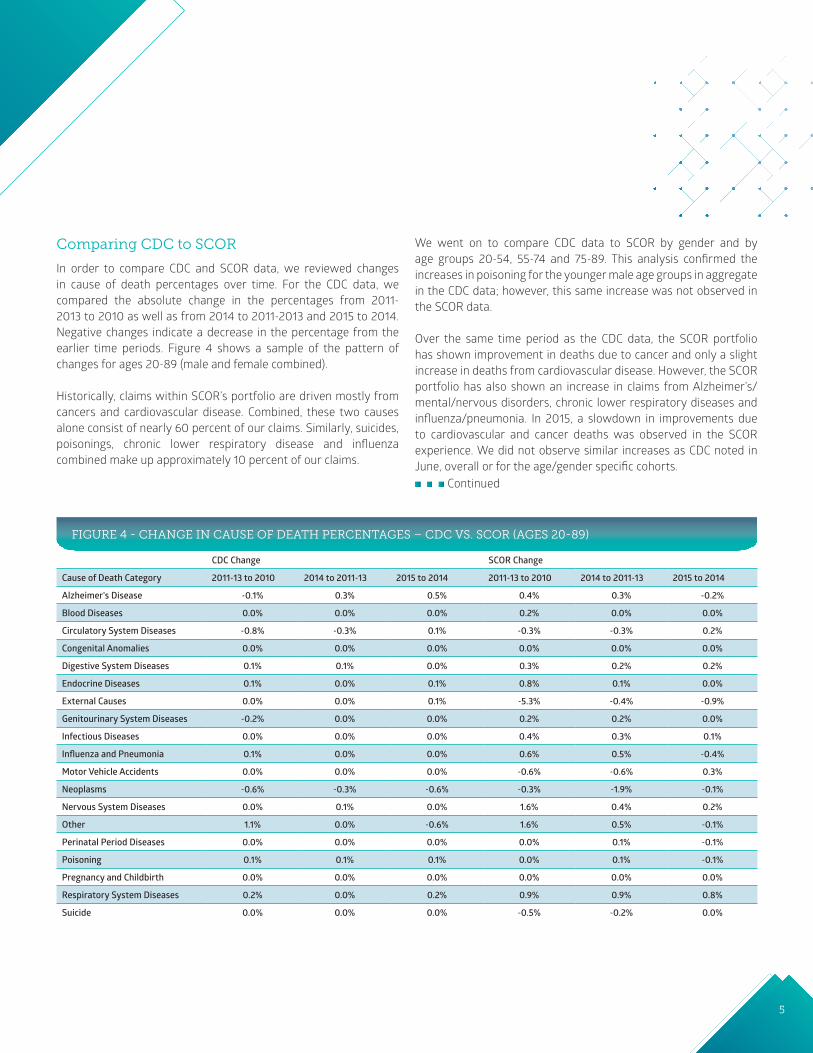
FIGURE 4 - CHANGE IN CAUSE OF DEATH PERCENTAGES – CDC VS. SCOR (AGES 20-89)
CDC Change SCOR Change
Cause of Death Category 2011-13 to 2010 2014 to 2011-13 2015 to 2014 2011-13 to 2010 2014 to 2011-13 2015 to 2014
Alzheimer's Disease -0.1% 0.3% 0.5% 0.4% 0.3% -0.2%
Blood Diseases 0.0% 0.0% 0.0% 0.2% 0.0% 0.0%
Circulatory System Diseases -0.8% -0.3% 0.1% -0.3% -0.3% 0.2%
Congenital Anomalies 0.0% 0.0% 0.0% 0.0% 0.0% 0.0%
Digestive System Diseases 0.1% 0.1% 0.0% 0.3% 0.2% 0.2%
Endocrine Diseases 0.1% 0.0% 0.1% 0.8% 0.1% 0.0%
External Causes 0.0% 0.0% 0.1% -5.3% -0.4% -0.9%
Genitourinary System Diseases -0.2% 0.0% 0.0% 0.2% 0.2% 0.0%
Infectious Diseases 0.0% 0.0% 0.0% 0.4% 0.3% 0.1%
Influenza and Pneumonia 0.1% 0.0% 0.0% 0.6% 0.5% -0.4%
Motor Vehicle Accidents 0.0% 0.0% 0.0% -0.6% -0.6% 0.3%
Neoplasms -0.6% -0.3% -0.6% -0.3% -1.9% -0.1%
Nervous System Diseases 0.0% 0.1% 0.0% 1.6% 0.4% 0.2%
Other 1.1% 0.0% -0.6% 1.6% 0.5% -0.1%
Perinatal Period Diseases 0.0% 0.0% 0.0% 0.0% 0.1% -0.1%
Poisoning 0.1% 0.1% 0.1% 0.0% 0.1% -0.1%
Pregnancy and Childbirth 0.0% 0.0% 0.0% 0.0% 0.0% 0.0%
Respiratory System Diseases 0.2% 0.0% 0.2% 0.9% 0.9% 0.8%
Suicide 0.0% 0.0% 0.0% -0.5% -0.2% 0.0%
Continued
Comparing CDC to SCOR
In order to compare CDC and SCOR data, we reviewed changes in cause of death percentages over time. For the CDC data, we compared the absolute change in the percentages from 2011-2013 to 2010 as well as from 2014 to 2011-2013 and 2015 to 2014. Negative changes indicate a decrease in the percentage from the earlier time periods. Figure 4 shows a sample of the pattern of changes for ages 20-89 (male and female combined).
Historically, claims within SCOR’s portfolio are driven mostly from cancers and cardiovascular disease. Combined, these two causes alone consist of nearly 60 percent of our claims. Similarly, suicides, poisonings, chronic lower respiratory disease and influenza combined make up approximately 10 percent of our claims.
We went on to compare CDC data to SCOR by gender and by age groups 20-54, 55-74 and 75-89. This analysis confirmed the increases in poisoning for the younger male age groups in aggregate in the CDC data; however, this same increase was not observed in the SCOR data.
Over the same time period as the CDC data, the SCOR portfolio has shown improvement in deaths due to cancer and only a slight increase in deaths from cardiovascular disease. However, the SCOR portfolio has also shown an increase in claims from Alzheimer’s/mental/nervous disorders, chronic lower respiratory diseases and influenza/pneumonia. In 2015, a slowdown in improvements due to cardiovascular and cancer deaths was observed in the SCOR experience. We did not observe similar increases as CDC noted in June, overall or for the age/gender specific cohorts.

SCORviews | April 2017 | 6
Differences Between US and Insured Populations
Of late, there has been much press and scrutiny over a decline in expected longevity for the US population relative to other developed nations. While these studies have received noted publicity in the press, it is important to recognize that trends in the general population do not necessarily translate to trends in the insured population, which underlies SCOR’s reinsurance experience. These individuals tend to be in a higher socio-economic class with access to better health care and living conditions and generally make healthier lifestyle choices. For example, the insured population has a lower percentage of tobacco/smoker risks than the general population (less than five percent in the SCOR experience) with a significantly increased cost of insurance for tobacco users.
In 2016, JAMA published an article discussing the correlation between life expectancy and income in the US (Figure 5)2. The authors stated that “between 2001 and 2014, individuals in the top five percent of the income distribution gained around three years of life expectancy, whereas individuals in the bottom five percent experienced no gains. Most of the variation in life expectancy across various geographic areas (and income levels) was related to differences in health behaviors, including smoking, obesity and exercise. Individuals in the lowest income quartile have more healthful behaviors and live longer in areas with more immigrants, higher home prices and more college graduates.”
Other recent papers have come to similar conclusions regarding the link between income and mortality 3,4. It should be noted, however, that studies of this nature typically focus on the short-term effects of income inequality. In theory, socio-economic impacts on health are not immediate and, therefore, the lifetime effects may be underestimated.
AN ANALYSIS
Recent Trends in Mortality by Cause of Death Cont.
FIGURE 5 - LIFE EXPECTANCY BY INCOME

7
The insured population has a lower percentage of tobacco/smoker risks than the general population with a significantly increased cost of insurance for tobacco users.
Due to the socio-economic differences discussed above, deaths due to influenza and pneumonia tend to impact the general population more heavily than the insured population. However, this is not always the case. In 2014 and into 2015, several insurance carriers indicated higher than expected mortality claims related to influenza and cardiovascular diseases due to abnormally bad winters in the midwest and northeast regions. A less than effective influenza vaccine in 2014-2015 was also a contributing factor.
Finally, our industry’s extensive underwriting process (detailed health questions plus medical exam and/or fluid collection) tends to select risks that are generally in much better health than the average individual in the US population. Poorer risks are declined insurance or are rated as substandard and pay appropriately higher premiums. This tends to result in a greater proportion of preferred risks and, for impaired lives, a higher proportion in the upper and middle income status who can afford an increased cost of insurance.
Continued
450
400
350
300
250
200
150
100
50
0
Deaths observed
Potentially preventable deaths
Diseases of the heart Cancer Chronic lowerrespiratory diseases
Cerebrovasculardiseases (stroke)
Unintentional injuries
Cause of death
No.
of d
eath
s (in
thou
sand
s)
www.cdc.gov/mmwr
Potentially Preventable Deathsfrom the Five Leading Causes of Death
United States, 2008–2010

SCORviews | April 2017 | 8
1CDC website http://www.cdc.gov/nchs/data/databriefs.
2JAMA, April 10, 2016: “The Association Between Income and Life Expectancy in the United States, 2001-2014.” Raj Chetty, PhD; Michael Stepner, BA; Sarah Abraham, BA; Shelby Lin, MPhil; Benjamin Scuderi, BA; Nicholas Turner, PhD; Augustin Bergeron, MA; David Cutler, PhD.
3Frontiers in Public Health Services and Systems Research, Vol. 5, No. 5 [2016]: Art. 5. Beth C. Truesdale, Harvard University, [email protected]; Christopher Jencks, Harvard University, [email protected].
4The Lancet, February 21, 2017: “Future life expectancy in 35 industrialised countries: projections with a Bayesian model ensemble.” Vasilis Kontis, PhD; James E Bennett, PhD; Colin D. Mathers, PhD; Guangquan Li, PhD; Kyle Foreman, PhD; Prof Majid Ezzati, FmedSci.
REFERENCES
AN ANALYSIS
Recent Trends in Mortality by Cause of Death Cont.
Conclusion
As more companies broaden their focus to increase penetration in the middle income market, there will likely by a shift in the drivers of insured mortality towards that of the general population. Therefore, it is important to pay attention to population trends. For example, the increased use of e-cigarettes and vaping, especially in the younger population, is worth further study.
SCOR’s biometric research team continually monitors mortality trends in the US and compares them to our own reinsured experience. We are committed to understanding and analyzing the socio-economic and environmental factors that may be affecting general death rates in the US and to consider their impact, if any, on life portfolios and how those factors may change based on market segment.
SCOR’s biometric research team continually monitors mortality trends in the US and compares them to our own reinsured experience.
9
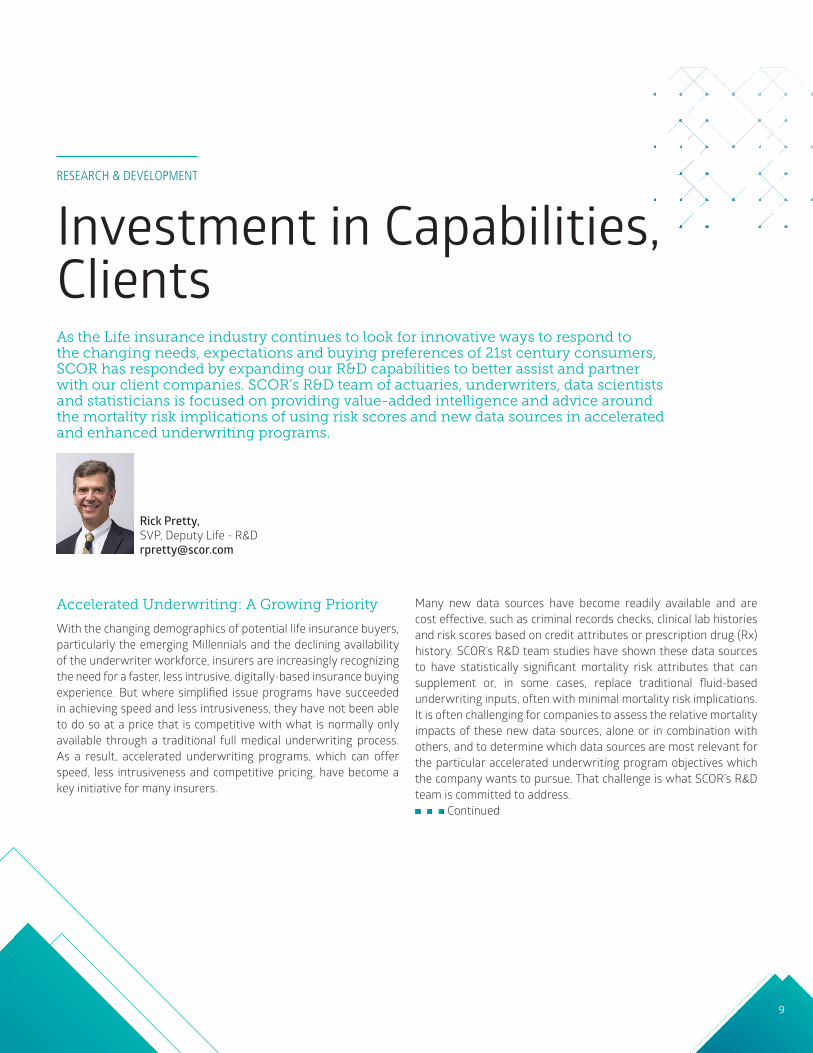
Accelerated Underwriting: A Growing Priority
With the changing demographics of potential life insurance buyers, particularly the emerging Millennials and the declining availability of the underwriter workforce, insurers are increasingly recognizing the need for a faster, less intrusive, digitally-based insurance buying experience. But where simplified issue programs have succeeded in achieving speed and less intrusiveness, they have not been able to do so at a price that is competitive with what is normally only available through a traditional full medical underwriting process. As a result, accelerated underwriting programs, which can offer speed, less intrusiveness and competitive pricing, have become a key initiative for many insurers.
Many new data sources have become readily available and are cost effective, such as criminal records checks, clinical lab histories and risk scores based on credit attributes or prescription drug (Rx) history. SCOR’s R&D team studies have shown these data sources to have statistically significant mortality risk attributes that can supplement or, in some cases, replace traditional fluid-based underwriting inputs, often with minimal mortality risk implications. It is often challenging for companies to assess the relative mortality impacts of these new data sources, alone or in combination with others, and to determine which data sources are most relevant for the particular accelerated underwriting program objectives which the company wants to pursue. That challenge is what SCOR’s R&D team is committed to address.
Continued
RESEARCH & DEVELOPMENT
Investment in Capabilities, Clients
Rick Pretty, SVP, Deputy Life - R&D [email protected]
As the Life insurance industry continues to look for innovative ways to respond to the changing needs, expectations and buying preferences of 21st century consumers, SCOR has responded by expanding our R&D capabilities to better assist and partner with our client companies. SCOR’s R&D team of actuaries, underwriters, data scientists and statisticians is focused on providing value-added intelligence and advice around the mortality risk implications of using risk scores and new data sources in accelerated and enhanced underwriting programs.

SCORviews | April 2017 | 10
RESEARCH & DEVELOPMENT
Investment in Capabilities, Clients Cont.
SCOR’s R&D: A Partnership Approach
SCOR’s R&D team takes a partnership approach to help client companies evaluate mortality risk. The evaluation process starts with clear understanding of the client’s business profile (e.g., target market, distribution channel, product set, past mortality experience, etc.). Differences in target markets, distribution channels and product sets can lead to significantly different mortality risk profiles and implications from one client to the next, as seen in the distribution of credit based risk mortality scores of applicants from three different client companies shown in Figure 1.
Equally important is understanding the needs and objectives of the program or underwriting changes being considered and what the client hopes to achieve. Objectives and reasons for exploring accelerated underwriting and new data sources can vary significantly by client. Examples include:
FIGURE 1 – DIFFERENCES IN BUSINESS PROFILE IMPACT MORTALITY RISK PROFILES SUCH AS DISTRIBUTION OF CREDIT BASED RISK MORTALITY SCORES
6%
3%
0%
6%
3%
0%
6%
3%
0%
Company A (high net worth applicants)
Company B (underserved/middle market applicants)
Company C (general population applicants)
Low HighModerate
Mortality Risk
A better segmentation of good risks in an applicant pool (e.g., Std/Pref/Super Pref)
B quick exclusion of non-standard risks (e.g., rated or declines) from a speed program
C reducing mortality risk for improved performance or pricing
D reducing underwriting timelines for a greater proportion of applicants
E reducing underwriting expenses
F optimizing existing underwriting resources
G improving overall life insurance buying experience
H all or any combination of the above

11
Knowing which objectives apply as well as the priority order of the objectives can lead to different solutions. So whether performing client-specific mortality studies or evaluating mortality risk implications of accelerated underwriting programs, understanding the client’s business, their key objectives and working in partnership with them is essential to delivering a customer-centric solution or recommendation.
Evaluating Accelerated Underwriting Programs: A Disciplined Process
For evaluating accelerated underwriting programs or enhancements to existing programs, SCOR’s R&D team follows a disciplined analytical approach. As described previously, the process begins with an understanding of the client’s business and objectives and then moves into the workflow process shown in Figure 2. To perform the analysis, the team acquires and evaluates the extent of available client data. Although SCOR has extensive expertise and data sets that can overcome certain holes in client data, the larger and more detailed the client, the more meaningful will be the analytical results.
Figure 2 – R&D workflow processThe process begins with an understanding of the client’s business and objectives and then moves into the workflow process shown here.
R&D Client Request Process
Client Requirements Client Program Analysis Results Publication Documenting & Archiving
Data Acquisition and Synthesis
Load and Map into Project Data Mart
Copy into Data Warehouse
or Archive
Perform Client Analysis
Publish to Client
Document and Prioritize Client
Request
Perform Data Quality Checks
Perform Peer Review(s)
Start
End
Collect Client Feedback
Continued

SCORviews | April 2017 | 12
A data set that includes all applicants (including not-taken and lapsed policies along with prior declines) can provide much more analytical value than data that only includes policies issued or inforce. A data set that includes Rx or credit risk scores attributable to individual applicants has more value than data that only includes scores anonymously ascribed. The more detailed and credible the client data, the more relevant and credible will be the predictive analytical results.
Once the client data has been acquired, scrubbed and initially analyzed (the Synthesis phase), an iterative analysis and review process begins (the Usage phase) that can vary by client. In some cases, the process moves directly into evaluating data sources and testing different parameters; in other cases, a client will provide their own initial analysis and ask for validation. In still other cases, a client-specific mortality experience study may be needed before program analysis can begin.
The analyses in this phase can include a number of elements – assessing class shift expectations (i.e., expected changes in the proportions of business across risk classes – see Figure 3), in-class mortality risk adjustments, overall adjustments, etc. If the final analysis results in any expected mortality or class shifts, the Pricing team will likely be engaged to discuss potential mortality assumption and pricing implications.
RESEARCH & DEVELOPMENT
Investment in Capabilities, Clients Cont.
FIGURE 3 – ANALYSES DURING USAGE PHASE INCLUDES ASSESSING EXPECTED RISK CLASS SHIFTS
Best Preferred Preferred Standard
52.8%
65.5%
28.0%
19.5% 19.2%15.0%
Speed as is Quali�cation Speed No Fluids Quali�cation
Class Shifts Due to Removal of Fluids
13
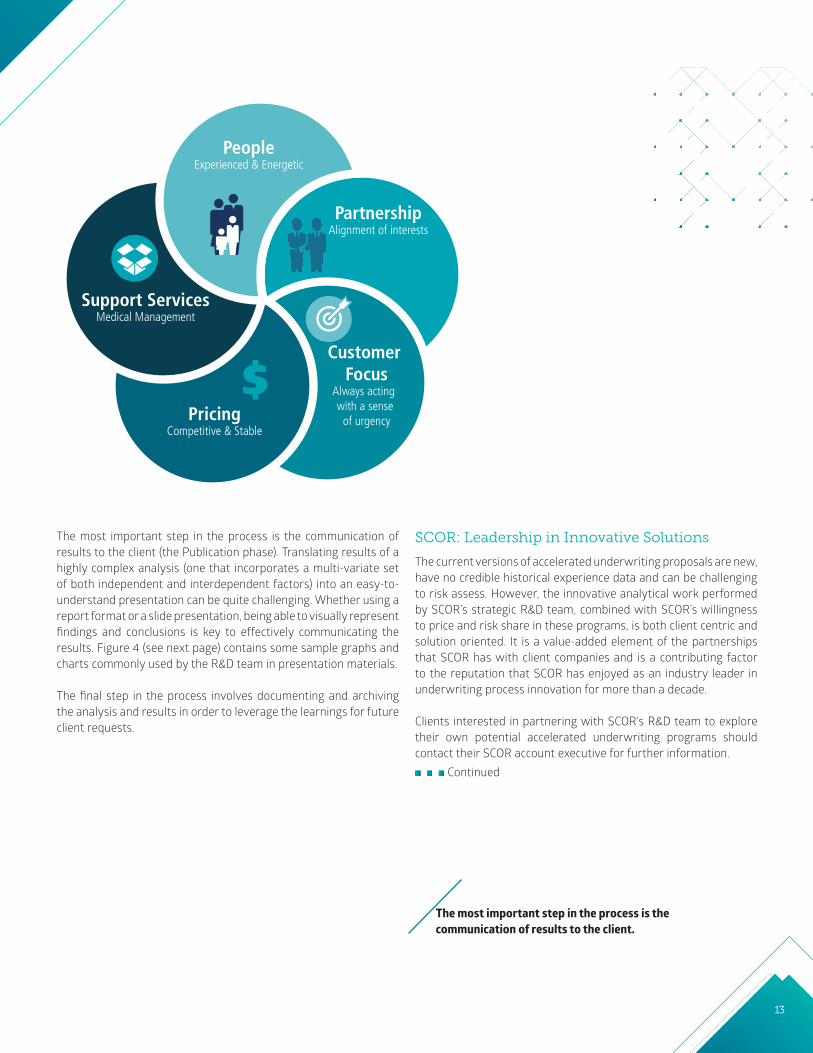
PeopleExperienced & Energetic
PartnershipAlignment of interests
Customer Focus
Always acting with a sense
of urgencyPricingCompetitive & Stable
Support ServicesMedical Management
The most important step in the process is the communication of results to the client (the Publication phase). Translating results of a highly complex analysis (one that incorporates a multi-variate set of both independent and interdependent factors) into an easy-to-understand presentation can be quite challenging. Whether using a report format or a slide presentation, being able to visually represent findings and conclusions is key to effectively communicating the results. Figure 4 (see next page) contains some sample graphs and charts commonly used by the R&D team in presentation materials.
The final step in the process involves documenting and archiving the analysis and results in order to leverage the learnings for future client requests.
SCOR: Leadership in Innovative Solutions
The current versions of accelerated underwriting proposals are new, have no credible historical experience data and can be challenging to risk assess. However, the innovative analytical work performed by SCOR’s strategic R&D team, combined with SCOR’s willingness to price and risk share in these programs, is both client centric and solution oriented. It is a value-added element of the partnerships that SCOR has with client companies and is a contributing factor to the reputation that SCOR has enjoyed as an industry leader in underwriting process innovation for more than a decade.
Clients interested in partnering with SCOR’s R&D team to explore their own potential accelerated underwriting programs should contact their SCOR account executive for further information.
Continued
The most important step in the process is the communication of results to the client.

SCORviews | April 2017 | 14
RESEARCH & DEVELOPMENT
Investment in Capabilities, Clients Cont.
FIGURE 4 – SAMPLE R&D PRESENTATION ILLUSTRATIONS
Rx ScoreNo Score 0.5-0.7 0.8-1.5 1.6+
Score 0.40% 0.20% 0.50% 0.00%
1-7 12.20% 8.80% 15.10% 0.80%
8-20 8.30% 6.80% 9.20% 0.50%
21-50 8.40% 7.10% 8.80% 0.50%
51-75 3.30% 2.60% 3.00% 0.20%
76-100 1.40% 0.70% 1.20% 0.10%
Speed Channel Candidate #1: Credit Score < 20
Speed Channel Candidate #2: Rx Score < 1.5
Cred
it Sc
ore
15
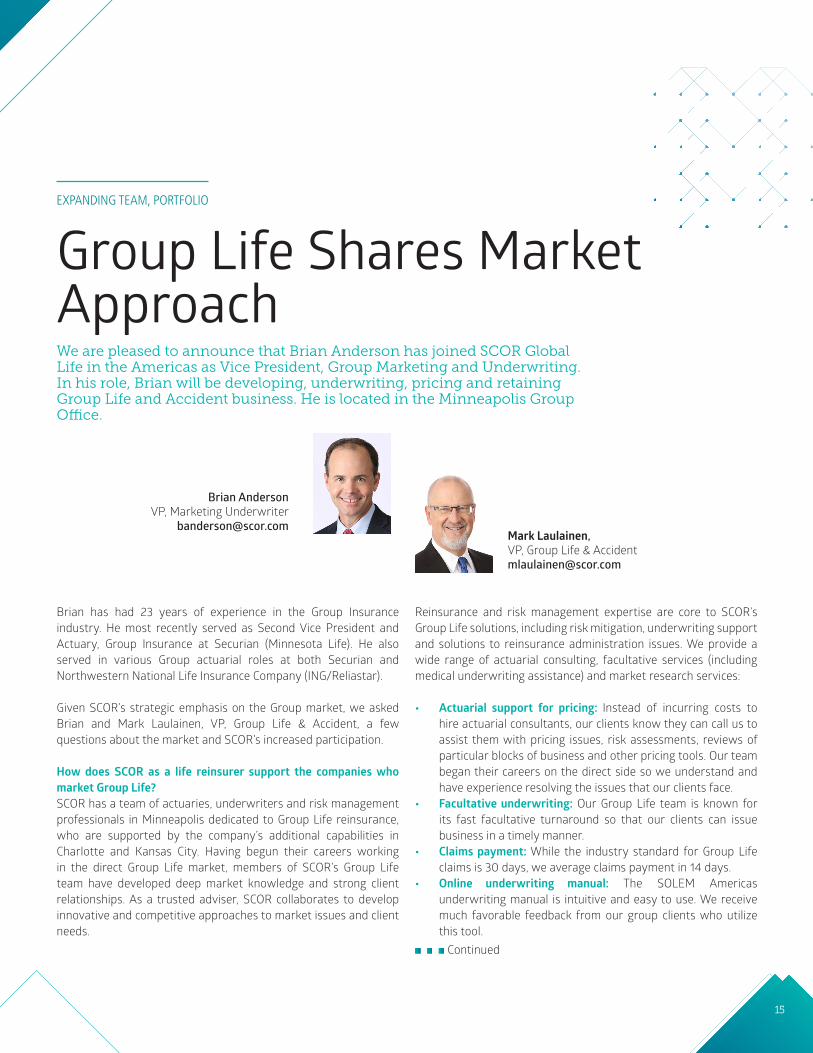
Brian has had 23 years of experience in the Group Insurance industry. He most recently served as Second Vice President and Actuary, Group Insurance at Securian (Minnesota Life). He also served in various Group actuarial roles at both Securian and Northwestern National Life Insurance Company (ING/Reliastar).
Given SCOR’s strategic emphasis on the Group market, we asked Brian and Mark Laulainen, VP, Group Life & Accident, a few questions about the market and SCOR’s increased participation.
How does SCOR as a life reinsurer support the companies who market Group Life?SCOR has a team of actuaries, underwriters and risk management professionals in Minneapolis dedicated to Group Life reinsurance, who are supported by the company’s additional capabilities in Charlotte and Kansas City. Having begun their careers working in the direct Group Life market, members of SCOR’s Group Life team have developed deep market knowledge and strong client relationships. As a trusted adviser, SCOR collaborates to develop innovative and competitive approaches to market issues and client needs.
Reinsurance and risk management expertise are core to SCOR’s Group Life solutions, including risk mitigation, underwriting support and solutions to reinsurance administration issues. We provide a wide range of actuarial consulting, facultative services (including medical underwriting assistance) and market research services:
• Actuarial support for pricing: Instead of incurring costs to hire actuarial consultants, our clients know they can call us to assist them with pricing issues, risk assessments, reviews of particular blocks of business and other pricing tools. Our team began their careers on the direct side so we understand and have experience resolving the issues that our clients face.
• Facultative underwriting: Our Group Life team is known for its fast facultative turnaround so that our clients can issue business in a timely manner.
• Claims payment: While the industry standard for Group Life claims is 30 days, we average claims payment in 14 days.
• Online underwriting manual: The SOLEM Americas underwriting manual is intuitive and easy to use. We receive much favorable feedback from our group clients who utilize this tool.
EXPANDING TEAM, PORTFOLIO
Group Life Shares Market ApproachWe are pleased to announce that Brian Anderson has joined SCOR Global Life in the Americas as Vice President, Group Marketing and Underwriting. In his role, Brian will be developing, underwriting, pricing and retaining Group Life and Accident business. He is located in the Minneapolis Group Office.
Mark Laulainen, VP, Group Life & Accident [email protected]
Brian Anderson VP, Marketing Underwriter
Continued

SCORviews | April 2017 | 16
The information conveyed and the views expressed in this newsletter are provided for informational purposes only and are based on opinions and interpretations made by SCOR Global Life Americas (formerly SCOR Global Life US Re Insurance Company). The opinions and interpretations expressed by SCOR Global Life Americas may not be the only interpretation available. This publication should not be copied or shared with any other company, reinsurer or consultant without obtaining prior approval from SCOR Global Life Americas.
CHARLOTTE101 South Tryon Street Suite 3200Charlotte, NC 28280
KANSAS CITY11625 Rosewood Street Suite 300Leawood, KS 66211
MINNEAPOLIS901 Marquette Avenue Suite 1500 Minneapolis, MN 55402
EditorPam Granzin704.344.2725 [email protected] www.scor.com/SGL
SCOR Global Life Americas Reinsurance Company, a division of SCOR.
Printed in USA © 2017
MONTREAL1250 Boulevard René Lévesque OuestBureau 4510Montréal - Québec H3B 4W8 Canada
TORONTO199 Bay Street, Suite 2800 Toronto, ON M5L 1G1 Canada
MEXICOOficina de Representación en México Edificio Torre ReformaPaseo de la Reforma 483, Piso36Col. Cuauhtemoc,06500, Mexico City
SANTIAGOEdificio Isidora Magdalena Norte Magdalena 181, Piso 12, Oficina 1201 Norte 7550055 Las Condes Santiago - Chile
SAO PAULOSCOR Global Life U.S. Re Escritorio de Representação no Brasil LtdaR.Luigi Galvani 70, Suite 121 04575-020 São Paulo - SP Brazil
SCOR recently announced entry into the Group Health market. Does having a full Group portfolio (Life and Health) have greater appeal to buyers of Group reinsurance?By adding medical management solutions to our portfolio of Group Life products, SCOR can be a more involved partner in our clients’ overall risk management strategy. We seek to increase client satisfaction by improving the value proposition to our clients. Our service model can be adapted to a ceding company’s unique culture, level of internal resources and the desired level of collaboration with us. Some companies desire the reinsurer to have a close partnership with the company’s various operational disciplines; others prefer a more strategic, consultative relationship.
Do you still hear discussion around the potential for Group Life distribution in the evolution of health care exchanges? In recent years, we heard many clients discussing private exchanges as a new distribution platform for Group Life products. But, given the complexity around the exchanges in the Group Health market during the past couple of years, most companies simply did not have the resources to address hurdles to adding Group Life products to exchanges. If the exchanges are here to stay, however, we see potential. Small businesses that may not have been interested in Group benefits in the past may offer our clients new business acquisition opportunities.
Is there greater interest in marketing AD&D or critical illness as standalone products instead of as supplemental coverage along with Life insurance in the Group market? How do these changes impact the Group Life reinsurance business?Yes. Creating a standalone version of a product already being offered as supplemental coverage can expand a carrier’s portfolio of Group products without significant expense. The shift to defined contributions is responsible for growing voluntary insurance market.
For more information on how we can help your company manage your Group exposures, please contact someone on our Group Reinsurance team.
EXPANDING TEAM, PORTFOLIO
Group Life Shares Market Approach Cont.