central arizona salinity study - city of phoenix home central arizona salinity study ... each water...
TRANSCRIPT

The Study Partners: City of Glendale, City of Mesa, City of Phoenix, City of Scottsdale, City of Tempe, Arizona-American Water Company, City of Chandler, City of Goodyear, City of Peoria, City of Surprise, City of Tucson, Town of Buckeye, Town of Gilbert, Queen Creek Water Company, Brown and Caldwell and the Bureau of Reclamation
Central Arizona Salinity Study
Phase II – Salinity Control in Waste Water Treatment Plants
September 2006
______________________________________________________
Table of Contents
Executive Summary .................................................................................................................. 1 1.0 Introduction................................................................................................................... 2
1.1 Background............................................................................................................... 2 1.1.1 Sources of Salinity ............................................................................................ 2 1.1.2 Wastewater Treatment Plants ........................................................................... 6 1.1.3 Water Reclamation Plants................................................................................. 7
2.0 Industry ......................................................................................................................... 8 2.1 Cooling Towers......................................................................................................... 9 2.2. Process Waters ........................................................................................................ 10
2.2.1 Semi-Conductor Industry................................................................................ 10 2.2.2 Health Industry................................................................................................ 10 2.2.3 Food Processing Industry................................................................................ 11 2.2.4 Industrial Laundry Industry ............................................................................ 11 2.2.5 Metal Finishing Industry................................................................................. 11 2.2.6 Concentrate Disposal to Sewers...................................................................... 11
2.3 Commercial............................................................................................................. 12 2.3.1 Cooling Towers............................................................................................... 12 2.3.2 Process Waters ................................................................................................ 12 2.3.3 Water Softeners............................................................................................... 12
2.4 Residential............................................................................................................... 12 2.4.1 RO Treatment.................................................................................................. 12 2.4.2 Water Softeners............................................................................................... 13
2.5 Municipal Treatment............................................................................................... 17 3.0 Regulatory Issues ........................................................................................................ 17
3.1 Quantity Versus Quality ......................................................................................... 17 3.2 Water Treatment Regulations ................................................................................. 18 3.3 Wastewater Treatment Plant Discharges to Waters of the U.S. ............................. 18 3.4 APPs........................................................................................................................ 20 3.5 Biosolids ................................................................................................................. 20 3.6 Long Range Issues – Emerging Contaminants and Disinfection By-Products....... 20
3.6.1 Emerging Contaminants.................................................................................. 20 3.6.2 Disinfection By-Products................................................................................ 21
3.7 Water Reuse Regulations........................................................................................ 21 3.8 Narrative AWQSs ................................................................................................... 22 3.9 Total Maximum Daily Load (TMDL) .................................................................... 22 3.10 Anti-Degradation Standards.................................................................................... 23
4.0 Case Study of CCWRP Sewershed............................................................................. 25 4.1 Sewershed Description............................................................................................ 25 4.2 Commercial Areas .................................................................................................. 26 4.3 Residential Areas .................................................................................................... 26 4.4 Mitigation Strategies............................................................................................... 26
5.0 Salinity Control Strategies .......................................................................................... 27 5.1 Prevention ............................................................................................................... 27
5.1.1 Local limits ..................................................................................................... 27

5.1.2 Surcharges....................................................................................................... 28 5.1.3 Point Source Treatment…………………..…………………………………..29
6.0 Salinity Treatment Options ......................................................................................... 31 6.1 Non-Potable Reuse.................................................................................................. 31
6.1.1 Turf Irrigation ................................................................................................. 31 6.1.2 Irrigation of Agriculture.................................................................................. 32 6.1.3 Industrial Reuse .............................................................................................. 33 6.1.4 Groundwater Recharge ................................................................................... 33 6.1.5. Surface Water Restoration ............................................................................. 34
6.2 Desalination of Effluent.......................................................................................... 34 6.2.1 RO................................................................................................................... 35
6.2.1.1 Advanced Membrane Treatments for Emerging Contaminants ................. 35 6.2.3 Thermal Processes .............................................................................................. 36 6.2.4 Electrodialysis/Electrodialysis Reversal............................................................. 36 6.3 Current Desalination Projects at Wastewater Treatment Plants ............................. 37
6.3.1 Water Factory 21............................................................................................. 37 6.3.2 City of Scottsdale Water Campus ................................................................... 38
6.4 Quantities and Costs ................................................................................................. 39 7.0 Conclusions................................................................................................................. 40
Appendix A: Cave Creek Water Reclamation Plant Study Appendix B: Survey of Water Softener Penetration into the Residential Market in the Phoenix Metropolitan Area

Page 1
Executive Summary Increasing salinity concentration in the effluent at wastewater treatment plants (WWTPs) is often not considered an urgent problem in comparison with other WWTP issues, such as sewer capacity and meeting discharge limits. Yet as water resources become more limited and reclaimed water gains acceptance as source water for reuse applications, increasing total dissolved solids (TDS) will have to be addressed due to the implications that high TDS can have with end uses. For example, many golf courses in the Phoenix metropolitan area use treated effluent for irrigation water and TDS in this water can often reach levels of 1,000 milligrams per liter (mg/L). High TDS, especially high sodium, is known to hinder the growth of plants because it limits the plants ability to extract water from the soil. Without the ability to take water from the soil, plants show symptoms of dehydration and require more water to flush the root zones of excessive levels of salinity. It is anticipated that WWTPs will continue to see increasing salinity concentrations in the future because of high TDS source waters, increased residential and commercial water softener usage, and increased quantities of concentrated blowdown water from cooling towers. Of particular concern is the rising salinity level of the inflow to the WWTPs due to the discharge of brine concentrate from advanced membrane treatment processes. The sewer is currently the most common mechanism for concentrate disposal for inland areas. The Central Arizona Salinity Study (CASS) has identified several options for controlling salinity at the WWTP, including desalination of effluent for certain reuse applications, point-source control, placing local water quality limits on influent into the sewer system, and/or enforcing best management practices in lieu of influent limits. Little data is available to define the impact of high TDS concentrations on WWTP processes; however, a recent study indicates that the nitrification process in WWTPs may be inhibited when TDS concentrations exceed 2,000 milligrams per liter (mg/L). Currently, in Arizona there are no water quality regulations governing TDS concentrations for disposal of wastewater into the sewer system. Therefore, there are no legal mechanisms available and/or enforceable to control rising salinity concentrations in the WWTPs.
Comment: Cite the recent study, author,and date.
Page 2
1.0 Introduction Wastewater treatment plants (WWTPs) are designed to accept and treat influent from a diverse array of sources, including industrial, commercial, and domestic wastes. The proportions, volume, and quality of each waste source are directly related to the ultimate performance of the treatment plant. Wastewater influent contains total dissolved solids (TDS), the most common ions are sodium and chloride. The potential adverse impacts of elevated TDS on WWTPs are currently the subject of intense study. TDS, also referred to as salinity, can impact the operation of the WWTP, limit reuse options, and/or result in violations of effluent discharge standards. It is, therefore, of utmost importance that the potential impacts of salinity on WWTPs in central Arizona be understood.
1.1 Background The purpose of this Central Arizona Salinity Study (CASS) is to identify and recognize the impacts of increasing salinity on WWTP in central Arizona. The study consisted of characterizing the sources of high TDS, evaluating the impacts on WWTP processes and assessing the limitations for reuse of the treated effluent. Improved understanding of the potential impacts will enable planning on both a short- and long-term basis, to revise treatment strategies, make decisions to control (or not) sources of high TDS, and to develop financing strategies to pay for the added cost of TDS management.
1.1.1 Sources of Salinity The Phoenix area has three primary sources of surface water: the Verde River, the Salt River, and Colorado River conveyed through the Central Arizona Project (CAP) aqueduct system. Each water source has variable TDS concentrations, as shown on Figure 1.1.1.1. The Verde River has the lowest TDS concentrations, averages under 400 milligrams per liter (mg/L). Colorado River water, also referred to as CAP water, 30 year average salinity concentration is 650 mg/L TDS but currently is about 600 mg/L TDS. TDS concentrations in the Salt River range, depending on if it is a wet year or a dry year, around 400 to 1,000 mg/L.
Comment: Cite your reference for these TDS numbers.
Comment: Figure 1.1.1.1 shows average is more like 300 mg/l.
Comment: Figure 1.1.1.1 shows Salt River containing between 700 and 1,300 mg/l.

Page 3
Figure 1.1.1.1 TDS Concentrations in Source Waters Source Water TDS
100
200
300
400
500
600
700
800
900
1,000
1,100
1,200
1,300
Jan-00 Jul-00 Jan-01 Jul-01 Jan-02 Jul-02 Jan-03 Jul-03 Jan-04 Jul-04 Jan-05 Jul-05
TDS
(mg/
l)
Salt RiverCAPVerde River
Based on the above data collected by the Salt River Project (SRP), CAP water shows the least variability in TDS concentrations. Data collected by SRP indicates an increasing trend of TDS from 1991 to the present on the Salt River, as shown in Figure 1.1.1.2 below. The historical data also revealed an inverse relationship between TDS concentration and water levels in the Salt River reservoirs, shown in Figure 1.1.1.3, suggesting that drought conditions exacerbate the TDS problem. Unfortunately, the same drought condition may occur at the same time in the Colorado River reservoirs, resulting in higher TDS concentrations in the waters delivered to the lower Colorado River basin states (Nevada, Arizona, and California). Tucson currently has three primary sources of water supply: groundwater and CAP water for potable use, and reclaimed effluent for non-potable use. In general, the average TDS concentration of potable water sources used in Tucson is lower than in the Phoenix area due primarily to the Tucson groundwater supply, which has an average TDS concentration of 265 mg/L. However, over time, TDS concentrations in the Tucson groundwater will increase as more CAP water is imported.
Comment: Cite your source of data.
Comment: Cite the data source (SRP? ADWR?)

Page 4
Figure 1.1.1.2 TDS Concentrations in the Salt River Over Time
Salt River TDS
0
200
400
600
800
1,000
1,200
1,400
Jan-90
Jan-91
Jan-92
Jan-93
Jan-94
Jan-95
Jan-96
Jan-97
Jan-98
Jan-99
Jan-00
Jan-01
Jan-02
Jan-03
Jan-04
Jan-05
TDS
(mg/
l)
Figure 1.1.1.3 Comparison of TDS Concentrations in Lake Roosevelt Storage and the
Salt River Lake Roosevelt Storage and Salt River TDS
0
200,000
400,000
600,000
800,000
1,000,000
1,200,000
1,400,000
1,600,000
Jan-90 Jan-95 Jan-00 Jan-05
Stor
age
(acr
e-fe
et)
0
200
400
600
800
1000
1200
1400
1600
TDS
(mg/
l)
Lake Roosevelt TDS

Page 5
While evaluating TDS concentrations in Phoenix source waters, it became apparent that there was a seasonal variation associated with which water supply was being used in greatest proportion. In the winter, when more Verde River water was being used, TDS concentrations in water entering the water treatment plants averaged between 400 and 500 mg/L, while in the summer, when more Salt River and CAP water was being used, the TDS concentrations increased to over 1,000 mg/L. Figure 1.1.1.4 shows the seasonal variability of TDS concentrations and the relationship between TDS in the influent (from Deer Valley Water Treatment Plant) versus the effluent water (from the 91st Avenue WWTP). The difference in TDS concentrations seen between the water treatment plant and WWTP is due to the increased contribution of TDS from commercial, domestic, and industrial sources to the WWTP. The difference in TDS concentrations in the source water as compared to the effluent water varied seasonally also, for example, during the summer, the difference between source water TDS and wastewater TDS averaged 350 mg/L. In the winter, the TDS difference averaged 450 mg/L. This is primarily due to the increased winter discharges from the largest single TDS point source contributor, the Scottsdale Water Campus. In Tucson, a similar increase in average TDS of 250 to 350 mg/L from source water to wastewater is observed. Figure 1.1.1.4 TDS Concentrations from Deer Valley Water Treatment Plant and 91st
Avenue WWTP
Deer Valley WTP and 91st Avenue WWTP TDS
100
200
300
400
500
600
700
800
900
1,000
1,100
1,200
1,300
Jan-00 Jul-00 Jan-01 Jul-01 Jan-02 Jul-02 Jan-03 Jul-03 Jan-04 Jul-04 Jan-05 Jul-05 Jan-06
TDS
(mg/
l)
91st Avenue WWTP Influent
Deer Valley WTP
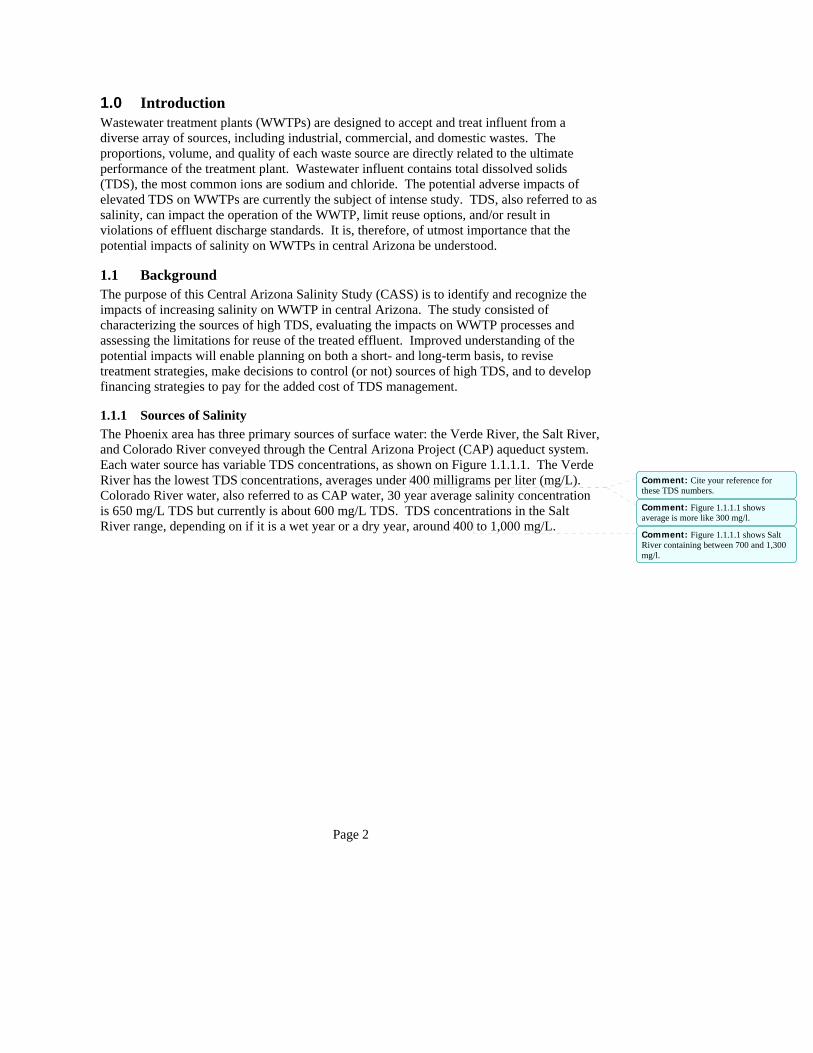
Wastewater treatment plants do not treat for TDS. TDS is passed through the plant with essentially no reduction as evidenced by influent/effluent data from the 23rd Avenue WWTP (Figure 1.1.1.5).
Comment: Is this what you meant to say?
Comment: For
Page 6
Figure 1.1.1.5 TDS Concentration in 23rd Avenue WWTP
23rd Avenue Total Dissolved Solids
500
600
700
800
900
1,000
1,100
1,200
1,300
1,400
1,500
Jan-00 Jul-00 Jan-01 Jul-01 Jan-02 Jul-02 Jan-03 Jul-03 Jan-04 Jul-04 Jan-05 Jul-05
TDS
(mg/
l)
23rd Avenue Influent TDS
23rd Avenue Effluent TDS
1.1.2 Wastewater Treatment Plants Phoenix has two major WWTPs: the 23rd Avenue WWTP, with 60 million gallons per day (MGD) capacity, and the 91st Avenue WWTP, with a 179.25 MGD capacity. The City of Phoenix evaluated the TDS concentrations in the influent to the two major plants found that they were receiving (and passing through) approximately 1.83 million pounds of TDS per day. Of this total, approximately 73 percent could be attributed to the source water, 16 percent was from commercial/domestic sources, and 11 percent was from industry (Figure 1.1.2.1). Tucson has two major WWTP: Roger Road WWTP (41 MGD capacity) and Ina Road Water Pollution Control Facility (25 MGD capacity; expanding to37.5 MGD). Both plants are owned and operated by Pima County.
Comment: Who did the evaluation? And when? Cite reference.

Page 7
Figure 1.1.2.1 Contribution of TDS to Large WWTPs
1.1.3 Water Reclamation Plants Water reclamation plants are smaller WWTPs, typically 5 to 20 MGD capacity, located throughout central Arizona. These plants serve local needs, treating wastewater to produce effluent for reuse purposes such as irrigation, groundwater recharge, or industrial reuse. Most water reclamation plants do not have solids handling facilities, and residuals are returned to the sewer for treatment at larger WWTPs. Water reclamation plants are often located in the outlying, newer parts of town, where the more recently built homes are, and hence, the TDS load from these areas is generally higher because of the increased popularity of water softeners in new homes. The combination of water reclamation plants having smaller volumes to dilute salinity and having more water softeners contributing to their TDS load, results in less buffering capacity than the larger WWTPs. Therefore, adverse impacts from higher TDS concentrations may become apparent sooner at the water reclamation plants, and may serve as a warning of the impacts of TDS at larger WWTPs. An example is the Cave Creek Water Reclamation Plant (CCWRP). Figure 1.1.3.1 shows the contributions of TDS to the CCWRP effluent. Note there are currently no industrial sources of influent to the CCWRP. The TDS load from residential/commercial sources represents 51 percent of the total; at the larger WWTPs, the residential/commercial load is only 16 percent of the total. That means that there is substantially more potential for impacts at the smaller water reclamation plants from commercial/domestic sources.
73%
16%
11%
Source WaterCommercial/DomesticIndustrial
Comment: My suggestion is to eliminate the acronym of WRP; just spell it out. Adds too much confusion with WWTP.

Page 8
Figure 1.1.3.1 TDS Load to CCWRP
The Randolph Park Water Reclamation Facility is located in an older section of central Tucson and operates similarly to other water reclamation plants and WWTPs located in the greater Phoenix area. Effluent from the Randolph Park facility is used in Tucson Water’s Reclaimed Water System. In addition to the facilities discussed in this report, the greater Tucson community is served by eight smaller, satellite WWTPs.
2.0 Industry Evaluation of data for CASS identified the industrial sector as a significant contributor of TDS to the WWTPs, particularly large water users, such as semi-conductor manufacturers and food processing industries that use highly purified water. These industries typically pre-treat potable water with membrane technologies such as reverse osmosis. While advances in membrane technology have produced more efficient, lower cost treatment systems that can remove a range of contaminants, the result is that they produce a large waste stream. Typically, 15 to 20 percent of the water supplied to the membrane is wasted. This waste stream, called concentrate or brine concentrate, is then discharged into the sewer systems, resulting in higher concentrations of TDS in the inflow to the WWTPs. The U.S. Bureau of Reclamation (Reclamation) estimated that 42 percent of brine produced by RO is discharged into sewers. The City of Phoenix sampled TDS load from several industries that contributed waste to the major WWTPs. Table 2.1 summarizes the results of the sampling. (The company names have been removed. The sample sites are identified by industry type only.)
49%
14%
37%
Source WaterCommercialResidential
Comment: Cite the source/article/publication.
Comment: By who? When? How many samples? Cite references.

Page 9
Table 2.1 TDS Load Contributed to Wastewater Treatment Plants in 2004
Industry TypeFlow
(GPD)TDS
(mg/L)Loading (lbs/day)
Semiconductors and related devices 1,389,991 1,318 15,279Semiconductors and related devices 833,710 1,790 12,446Semiconductors and related devices 567,513 2,240 10,602Fluid milk 351,430 2,978 8,729Refuse systems 78,071 7,540 4,909Linen supply 205,110 2,113 3,615Bottled and canned soft drinks 174,480 2,298 3,344Plating and polishing 30,713 10,645 2,727Industrial launderers 160,617 1,843 2,469Printed circuit boards 133,377 1,980 2,202Linen supply 173,740 1,431 2,074Metal cans 84,341 2,923 2,056Eating places 136,835 1,521 1,736Animal and marine fats and oils 66,371 3,130 1,733Linen supply 86,441 2,272 1,638Aircraft engines and engine parts 106,824 1,830 1,630Linen supply 72,247 2,661 1,604General medical & surgical hospital 141,628 1,305 1,541Plating and polishing 62,292 2,565 1,333Linen supply 93,205 1,713 1,332Copper rolling and drawing 77,338 2,003 1,292Primary metal products 42,687 3,295 1,173Industrial launderers 57,025 2,416 1,149Industrial launderers 55,744 2,470 1,148General medical & surgical hospital 87,521 1,189 868
2.1 Cooling Towers Water is the least expensive way to cool air and equipment and the dry desert air provides a perfect vehicle for evaporation of water. A highly economical and efficient cooling system consists of a cooling tower and a heat exchanger, called a chiller and/or a plate and frame. The cooling tower is a low cost piece of equipment used for evaporating and cooling a circulating stream of water. The tower is basically a box that has openings (louvers) on the sides and top. At the top is a large fan that is used to draw air into the tower through the open louvered sides. At the same time, water is distributed over a honeycomb structure which makes up the bulk of the interior. As the water falls slowly over and through the honeycomb in thin layers, the moving air promotes evaporation of the water droplets. Cooling takes place through evaporation. At the bottom of the tower, the cooled water is collected and pumped to a heat exchanger, exchanging heat with a circulating refrigerant or water. This chilled water or refrigerant is used to cool air. The tower water absorbs heat from the circulating refrigerant or water and is returned to the tower, re-cooled and the cycle repeats. As cooling towers evaporate water, the salinity of the remaining water increases until an upper limit is reached. Chemicals are added to the tower to allow higher reuse of the water before it must be discharged. The discharge wastewater is called blowdown. Surveys
Comment: Explain where this honeycomb structure is located – at the top of the tower, all through the tower…

Page 10
conducted by the City of Phoenix Water Conservation Department indicate that manufacturers use between 25 and 50 percent of their total water use for cooling. Cooling towers are typically operated between three and four cycles of concentration. Hence, the TDS concentration entering the sewer is two to three times higher than the source water salinity level.
2.2. Process Waters Process water is used for rinsing, cleaning, chemically treating and, generally, manufacturing a product. Circuit boards, semiconductor chips, aircraft parts, medical devices, golf clubs, LCD displays, machined parts, juices and soda are all made using water. To maintain consistency of product quality, water is often treated by softening, reverse osmosis (RO), and/or deionization. Many manufacturers use softened water to improve rinsing while others soften prior to further treatment with RO and deionization. In addition to increasing the salinity through treatment of water, manufacturing processes, such as cleaning, washing, pickling, metal finishing, plating and etching add salinity from the process chemicals. The wastewater from manufacturing processes must then be treated to adjust pH and remove selected ions in order to meet federal, state, and local discharge regulations. Additional salinity comes from the treatment chemicals. The total increase in salinity discharged to the sewer ranges from 1.25 to two times the source water salinity.
2.2.1 Semi-Conductor Industry The semi-conductor industry uses water for the rinsing steps required in the production of microcircuitry. For product quality, the removal of most chemicals commonly found in water supply is required. To achieve ultrapure water (UPW), manufacturers often use a combination of methods, including ultrafiltration, RO, and electrodeionization to “create” the water they need. The final product of UPW has all of the salts and organics removed down to part per billion levels. Salinity is concentrated in reject streams from the RO process and disposed of to the sewer system. In addition to concentrate from the product water, wastewater from the actual manufacturing process is also discharged to the sewer system. This water from the manufacturing process is approximately 1,000 mg/L higher in TDS than the source water and adds ions such as fluorides, sulfates, chlorides, phosphates, ammonium, trace metals, hydroxides, and sodium.
2.2.2 Health Industry Large hospitals typically have central plants with cooling towers, chillers, and boilers. The cooling towers are generally large and are operated between 3.5 and 5.0 cycles of concentration. The boilers require purified water to control and/or eliminate the build-up of scale on the equipment. The boilers provide steam for autoclaves, sterilizers and laboratories, as well as for heating. Typically, water is softened and then treated with RO prior to being introduced into the boilers. Domestic hot water systems also use softened water for patient rooms, laboratories, surgical units and laundries. The wastewater from hospitals is regulated for chemicals used for disinfection and cleaning. The water discharged to the sewer system includes the softened water, the reverse osmosis reject stream, the boiler

Page 11
blowdown, the softener backwash, the cooling tower blowdown, and process and domestic wastewater.
2.2.3 Food Processing Industry Central Arizona has many large industrial food processing facilities, plus hundreds of smaller commercial food processing facilities. In the case of soft drink manufacturers, the high quality of water needed to produce their products is achieved by RO treatment, and the concentrate is then discharged to the sewer system. Other food processing industries (for example, dairies and ice cream plants) also require advanced water treatment systems, including water softeners, and the cleaning process associated with producing food for human consumption, which results in significantly high TDS wastestreams. Simple treatments, such as washing fresh vegetables, may result in pesticide or fertilizer residue, along with other pollutants, in the wastewater discharge
2.2.4 Industrial Laundry Industry Industrial laundries and commercial laundries represent a large segment of the significant industrial users discharging to the sewer system. These laundries are typically high volume water users and discharge pollutants associated with the industries they serve, along with soaps, surfactants, and other chemicals for cleaning uniforms, shop towels, floor mats, etc. Water softeners are used by many industrial laundries to increase the efficiency of the cleaning process, adding salts to their wastewater.
2.2.5 Metal Finishing Industry Manufacturers that clean, plate, or otherwise modify metal surfaces for aerospace, electronic or other products, must meet Federal Pretreatment regulations. Such regulated discharges not only contain the salinity from the chemicals used for metal finishing, but also the neutralization and metal removal chemicals used in their pretreatment systems. Industrial pretreatment for cyanide, chrome and other metals add specific salt ions into the wastewater. In addition, certain metal finishing processes require the use of purified water to maintain the quality of the process solution as well as the quality of the finished product. Nearly all such manufacturers use water softeners and RO systems to remove hardness and other ions from their supply water. Water purification concentrate and waste water from the manufacturing process are both discharged into the sewer system, they add between 1,000 and 1,700 mg/L of TDS to the initial TDS concentration in the supply water. The range reflects the variation in wastewater composition from day to day.
2.2.6 Concentrate Disposal to Sewers Sewer disposal of the concentrate produced from reverse osmosis membranes is currently not limited, either by strength or volume in central Arizona. This is the most common practice in Arizona, and nationally, 42 percent of concentrate is disposed in sewer systems (Mickley, 2001). Concentrate may be indirectly discharged from the WWTP at the discretion of the Arizona Pollutant Discharge Elimination System (AZPDES) permit holder. This can be done assuming there is no interference with the wastewater treatment process and that pass through to the environment would have adverse consequences.
Comment: What is the difference between an industrial food processing facility and a commercial food processing facility?
Comment: What is the difference between industrial and commercial laundries?

Page 12
2.3 Commercial
2.3.1 Cooling Towers In the Phoenix and Tucson metropolitan areas, all high-rise, mid-rise, and some commercial buildings have cooling towers as part of the cooling system. Some low-rise or single-story buildings will have towers depending upon the age and value of the rented space. No mixed-use space has towers but rather have packaged air conditioning units for the office areas and evaporative coolers for the warehouse areas. Nearly all of the cooling towers will be professionally managed and have cycles of concentration between 3.5 and 5.0. The smaller sized buildings and towers have concentration cycles between 2.0 and 3.5. Blowdown from a 1,000-ton tower having 30 to 35 percent year-round utilization is two gallons per hour per ton. This calculates to an average of 5.7 million gallons per year of blowdown water with TDS concentrations ranging from 650 to 2,600 mg/L.
2.3.2 Process Waters Commercial processes from office buildings, grocery stores, resorts and restaurants will primarily reflect the salinity of food waste and cleaning chemicals. TDS concentrations in the wastewater compared with the TDS in the source water added over background will vary widely with the time of day of operation as well as the size and type of establishment.
2.3.3 Water Softeners From coffee shops to mega resorts, water softeners are used to keep linens white, plumbing free from corrosion and dishware spot-free. Small operations use systems that are slightly larger than typical residential-sized softeners. Larger restaurants, motels, hotels and resorts use large systems, providing softened water to water features and pools, as well as for cleaning purposes. The range of salt purchased and, hence, discharged to the sewer, varies widely from 1,000 pounds per year for a single small restaurant to nearly 500,000 pounds per year for a mega-resort.
2.4 Residential Human activities contribute substantial TDS load to sewer systems. Food waste, washing activities (sinks, baths, showers, dishwashers, clothes washers), and sanitary waste (toilets) all contribute TDS to the sewer system. Use of soaps, detergents, cleaners, water based paints, degreasers, and other household chemicals also add to the load. Personal care products (deodorant, perfume, makeup, skin cream) plus pharmaceutical products (prescription and over the counter) add to the emerging contaminants load that will have to be addressed in the future. Emerging contaminants include chemical and microbial constituents that have not historically been considered as contaminants that are present in the environment on a large scale. TDS load from water softeners are addressed below.
2.4.1 RO Treatment Developed in the 1940s for large-scale desalination plants, RO has become the most popular residential drinking water treatment process, allowing users to further filter their municipal water or well water. A description of how the technology works is located in Section 6.2.1. Residential RO treatment systems consist of a multi-stage system that provides more treatment than carbon filter units. The filtering unit typically fits beneath the kitchen sink

Page 13
with connections to the cold water line for its supply source and to the drain line for its reject water. 2.4.2 Water Softeners The U. S. Department of Interior has defined hard water as water having more than 7 grains per gallon (gpg) of calcium and magnesium. In central Arizona, hardness levels can reach 20 gpg or more. This has led many residential and commercial water customers to use water softeners. Softeners employ an ion exchange process that uses a cation resin enriched by brine, consisting of sodium or potassium, to remove calcium and magnesium from water. Water softeners add salinity to the water system in this exchange and this additional salinity flows into the water system and eventually into the sewer system. There are two basic types of water softeners: automatic water softening systems and portable exchange units. Figure 2.4.1 illustrates the softening process. An automatic water softener system is equipped with a timer that automatically initiates the recharging cycle and every step in the process. Automatic water softeners consist of a pressure vessel, or tank, containing a bed of cation exchange resin, a second vessel that stores the salt (usually sodium chloride [NaCl]) to make up the brine solution, and a control valve to direct the flow of water through the cycle of service and regeneration.
A softener works by flushing the resin bed with highly concentrated brine solution. The hard water enters the resin tank at the valve inlet and flows through the resin bed. The large concentration of sodium or potassium ions in the resin replaces the calcium and magnesium in the water thus softening the water. Calcium and magnesium are removed from the resin and discharged to the drain. The softened water, flows up and out the outlet valve to the sink, washer, etc .
Softener regeneration involves the introduction of a concentrated solution of brine to the resin bed and a reverse exchange process. The water softener system’s regeneration valve can be automatically programmed to regenerate at a specific time (for example, midnight) or after a set amount of water has passed through, or a sensing probe can be employed that signals the end of a softening run. Regeneration valves set to regenerate based on water volume, or demand, can reduce salt use by more than 50 percent over timer valves through the elimination of unnecessary regeneration cycles. Ideally, residential softeners should regenerate about once a week, if used correctly. A softener’s stated capacity relates to how many grains of hardness minerals can be removed before the resin bed is exhausted. Softener capacity is determined by the volume of resin, the amount of salt used to regenerate it, and by the TDS level of source water. Commercial softeners are also sized according to water usage and can regenerate several times per day.
For portable exchange tank softeners, regeneration is performed by a dealer at a central processing (batch) plant. The charged resin tanks are delivered to customers once or twice a month. There are only three such processing plants in the metro Phoenix area, and about 9,000 portable exchange customers. Total discharge from the plants is less than 2,000 gallons per day (gpd) and with the close monitoring of the discharge, it contains very little sodium.
Comment: monitoring by who? Is this a regulated discharge?

Page 14
While the majority of water softeners are regenerated with sodium chloride (NaCl), the alternative of using potassium chloride (KCl) is frequently discussed, and is feasible. At most salt settings, NaCl and KCl have similar efficiencies. The reason that KCl is not in greater use is that it is usually about twice as expensive as NaCl, is not as widely available, and is affected by temperature differentials. Typical temperature fluctuations can cause precipitation in the brine tank resulting in severe bridging problems and less potassium available for regeneration.

Page 15
Figure 2.4.1

Page 16
2.4.2.1 Water Softener Survey CASS has been assessing what the contribution of residential water softeners is to the salinity increase at the WWTPs. To address this issue, Reclamation, on behalf of CASS, contracted with Insights & Solutions, Inc., to conduct a telephone survey in late 2004. The Phoenix metropolitan area was selected as the study area and was divided into two categories: the established area and the new growth area. (The survey and a map of the study area are provided in Appendix B.) Insights & Solutions contacted and received responses from 2,453 households, with an accuracy of the responses of plus or minus two percent. Data from the telephone survey indicate that 26 percent of the homes in the Phoenix metropolitan area have water softeners. Thirty nine percent of homes in new growth areas have water softeners as compared with 16 percent of the established area homes. Table 2.4.2.1, below, shows the increase in water softener use from the 1970s to the present. It was in 1985 that the CAP began delivering Colorado River water for use in the Phoenix metro area. (As stated above in Section 1.1.1., Colorado River water has an average TDS of 600 mg/L, higher than native groundwater.)
Table 2.4.2.1 Age of Houses with Water Softeners Year Home Built Probability of a Water Softener
in House Prior 1970 17%
1970s 23% 1980s 27% 1990s 47% 2000s 51%
Table 2.4.2.2 shows market penetration of water softeners compared to income. Higher income households are more likely to have a water softener than lower income households.
Table 2.4.2.2 Household Income and Probability of Owning Water Softener Household Income Probability of a Water
Softener in House Below $30k 14% $30k to $60k 26%
$60k to $100k 32% Over $100k 49%
Nearly every home that had a water softener installed was using it. In 37 percent of the homes surveyed, all the water delivered to the house was softened. In 45 percent of the homes, only the indoor use water was softened. In 9 percent of the homes, only the hot water was softened. Only in 9 percent of the homes surveyed did the respondent not know what water was softened. Based on the survey results, approximately 40 pounds of salt (one bag) are used per household per month. Further, considering a conservative 26 percent of the homes in the

Page 17
Phoenix area use a water softener, results in approximately 5,700 tons of salt per month, or approximately 68,000 tons of salt annually, which is sent to the WWTPs, solely due to residential water softeners. That is approximately a quarter of the salinity increase above the source water salinity level that is seen at the WWTPs. At smaller water reclamation plants in the new growth areas, the salinity increase above source water salinity due to residential water softeners is even more acute. At the CCWRP, as discussed in Section 1.1.3 and Appendix A, the residential water softener salt load accounts for 36 percent of the problem.
2.5 Municipal Treatment Chlorination sites add salinity into the supply water at booster stations and wellheads. For example, the water supply into the CCWRP watershed includes 13 sites that add salinity from either on-site chlorine generators or from the addition of calcium hypochlorite tablets. These 13 sites add 134.8 tons per year of salt into the supply water and contribute 10 percent of the CCWRP sewer shed salt load that returns to the CCWRP.
3.0 Regulatory Issues The following section discusses the potential regulatory areas of concern that relate to treatment, discharge, and storage of TDS. In this discussion, the TDS discharge may range from highly concentrated (RO concentrate) to moderately concentrated (reclaimed wastewater). In any case, changes to existing rules and laws may have a significant impact on how Arizona manages increasing salinity in water resources, specifically effluent. Regulations associated with discharge or reuse of effluent or with concentrate disposal will, therefore, be site-specific. Disposal alternatives may be dictated by federal, state or local restrictions, depending upon the sensitivity of the water body receiving the discharge.
3.1 Quantity Versus Quality In Arizona, water is governed by two state agencies; establishment, permitting, and enforcement of water quality standards is the responsibility of the Arizona Department of Environmental Quality (ADEQ), while the Arizona Department of Water Resources (ADWR) regulates water supply (quantity). The two agencies coordinate efforts on such matters as recharge permits, where ADEQ requires an Aquifer Protection Permit (APP) for effluent recharge and ADWR administers quantity aspects of groundwater storage. Arizona encourages recharging water back to the aquifer when it is available for times of drought and even though source waters being recharged differ in quality from water in the aquifer. For this reason, the activity of recharging CAP water is exempt from APP regulations. ADWR’s Underground Water Storage (UWS) Program, also known as the Recharge program, is designed to allow a recharge project to proceed as long as it is hydrologically feasible and will not cause unreasonable harm to other land or water users. Potential unreasonable harm includes both physical impacts (rising water levels) and water quality impacts. The approved and permitted underground storage facility (USF) must be designed, constructed, and operated such that the storage of the maximum amount of water will not impair existing uses of land or the structural integrity or function of existing structures. This demonstration is initially the product of a groundwater flow model or analytical assessment.
Page 18
The ADWR permit for an USF includes a monitoring network to ensure that as the facility is operated, the protection of other land and water users in maintained.
3.2 Water Treatment Regulations New water treatment plant regulations, such as the recently revised federal arsenic standard, have the potential to impact the TDS issue. For example, if a well or surface water has elevated arsenic levels, and RO treatment is chosen as the preferred treatment strategy, then the concentrate will contain highly concentrated arsenic, plus other dissolved materials. If discharged to the sewer, that waste stream may cause problems with the National or Arizona Pollutant Discharge Elimination System (NPDES/AZPDES) permits. Other developing water treatment plant limits are becoming harder to meet with conventional coagulation/filtration technology. This is motivating many water providers to consider the use of membrane technologies to meet new, more restrictive drinking water standards. The concentrate from these new plants will be discharged into sewers, unless limits are placed upon such discharges. If local sewer limits are imposed, then water providers may have to pre-treat the waste prior to disposal, requiring capital investment and added operating costs. At present, the Clean Water Act (CWA) does not specifically address drinking water treatment plant by-products. As a result, they are addressed through a default classification: industrial waste (American Membrane Technology Association [AMTA] 2005). This results in a more stringent set of regulations, potentially higher permitting costs, and public perception problems. The U.S. Environmental Protection Agency (EPA) has proposed, under the 2004 Effluent Guidelines Plan, a new federal category, under Sections 304(b) and 304(m) of the CWA, that requires review of existing water treatment plant discharges (proposed Drinking Water Facilities category), and may require new federal limits on such discharges, either through Publicly Owned Treatment Works (POTW’s) via indirect discharges or to Waters of the U.S. (direct discharges). The schedule for final action on the proposed Drinking Water Facilities category is August 2007.
3.3 Wastewater Treatment Plant Discharges to Waters of the U.S. In Arizona, the AZPDES program approves, issues, and enforces permits for surface water discharges. Concentrated TDS wastestreams, including RO concentrate, may be indirectly discharged, at the discretion of the AZPDES permit holder, through a POTW, assuming there is no interference with the treatment process, or pass through to the environment that would have adverse consequences. Sewer disposal is the most common practice in Arizona, and nationally, 42 percent of concentrate is disposed in sewers (Mickley 2001). Continuing this practice in the future will not be a regulatory issue but rather a policy issue, developed by each municipality. WWTPs that discharge to Waters of the U.S. are required to have a whole effluent toxicity monitoring program for the protection of aquatic life. This program requires that sensitive invertebrates, fish, and algae be subjected to varying effluent concentrations, to confirm the presence or absence of toxicity. This is then used as an indicator of potential in-stream
Comment: Include the Desalting Facts in the References section of the report.

Page 19
impacts on aquatic life. The CCWRP effluent has demonstrated chronic toxicity and was required to enter into a Toxicity Identification Evaluation (TIE). If a primary toxicant is identified, then the CCWRP will undergo a Toxicity Reduction Evaluation (TRE) for the purpose of identifying effective control measures for effluent toxicity. It is common to spend hundreds of thousands of dollars on such studies, even millions. The City of Phoenix will soon send the sixth quarterly report to ADEQ, identifying activities and strategies developed to identify the cause of this toxicity. To date the results remain inconclusive, but among the possible causes currently under investigation is salinity, specifically sodium concentration. One possible cause of the observed toxicity may be ion imbalance. The Society of Environmental Toxicology and Chemistry (SETAC 2004) produced a technical issue paper discussing this subject. They concluded that ions commonly found in aquatic ecosystems could be toxic to aquatic organisms when present in concentrations above or below biologically tolerable levels. They observed that changes in the concentration or composition of ions in the external water, particularly over long periods of time, might cause an organism to spend too much energy trying to regulate its internal water balance, resulting in chronic stress. This stress could affect the organism’s growth and reproduction. The authors further suggest that sudden changes in ion concentration or composition in the external water could cause death. An interesting conclusion was that TDS levels in freshwater above approximately 1,340 mg/L could adversely affect freshwater organisms. TDS concentrations at the CCWRP regularly exceed this level (see Appendix A). The SETAC paper discusses relative toxicity of specific ions to one freshwater organism, Ceriodaphnia dubia, and concluded that potassium was the most toxic ion to the organism, followed by: bicarbonate > magnesium > chloride > sulfate > bromide (least toxic). This may have an impact on the possible substitution of KCl for NaCl in water softeners, as a solution to sodium toxicity in irrigated plants. An interesting conclusion to the article was that in toxicity studies where the only responsible toxicant was identified as ion imbalance, one proposed regulatory solution would be to develop site-specific ion or TDS limits (SETAC 2004). In another article (Mount et al. 1997), LC50 (lethal dose for 50 percent of test population) values for Ceriodaphnia dubia were found at conductivities ranging from 3,500 to 4,000 microsiemens per centimeter (mS/cm). Another study showed major ion toxicity to Ceriodaphnia dubia from an industrial process water with a conductivity of 1,800 mS/cm (Jop and Askew, 1994). Conductivity values at the CCWRP regularly exceed all these conductivity levels (refer to Appendix A). In addition, Mount et al. demonstrated that Ceriodaphnia dubia is more sensitive to major ion toxicity than Daphnia magna or fathead minnows (Pimphales sp). A study conducted by Nikolay Voutchkov (Voutchknov ----year) at the 30 MGD Terminal Island WWTP in Los Angeles, determined that influent salinity above 3,000 mg/l caused nitrification inhibition. Mr. Voutchkov proposed that the bacteria present in the activated sludge were adapted to freshwater/human body salinity, in which optimum TDS concentrations ranged from 2,000 to 3,000 mg/L. If the activated sludge rose to levels above that optimum range, the activated sludge organisms would be subjected to osmosis, where water in the bacterial cells begins to move through the cell membrane toward the surrounding (more salty) wastewater. This osmotic stress can cause cells to rupture or reduce the bio-
Comment: Which levels? 1800 or 4000 or both?
Comment: Find out year
Page 20
assimilation capability of the bacteria, and reduce activated sludge BOD (biological oxygen demand) removal efficiency (Voutchkov, personal communication). Daily average salinity levels at the CCWRP have not reached this level, however, diurnal data indicate that spikes have occurred at higher levels, and these short-term impacts may require further study.
3.4 APPs APPs are reviewed, issued and administered by ADEQ. These permits require that discharges into aquifers meet Arizona Aquifer Water Quality Standards (AWQS), which were adopted in 1986 and based on the federal primary drinking water standards at that time. The standard practice for ADEQ is that APPs for WWTPs will include alert levels calculated at 80 percent of the AWQS. Alert levels serve as early warning signs for an exceedance of an AWQS. APPs require that the owner/operator of the WWTP demonstrate that the facility is using the Best Available Demonstrated Control Technology (BADCT) for discharge reduction. In addition, APPs require financial and technical capability demonstrations. Because the Arizona AWQSs are based on the federal primary drinking water standards, there are no numeric AWQSs for TDS or salinity. However, the APP Program does have regulatory authority to establish a “narrative” standard for TDS, chloride, nitrate, or any other contaminant if there is a down gradient user that could be impacted by the discharge.
3.5 Biosolids TDS is not generally considered a biosolids or water treatment plant solids issue because the TDS is separated from the solids using centrifuges, belt presses, filter presses, or other separation technology. The separated centrate, filtrate, or other liquid waste stream does have concentrated TDS and it must be treated appropriately. In cases where a water treatment plant discharges centrate or RO concentrate to a POTW, the POTW may determine that the wastestream be treated as an industrial waste. This determination would be case-specific and would depend upon the potential for the wastestream to interfere with the treatment process or pass through the WWTP.
3.6 Long Range Issues – Emerging Contaminants & Disinfection By-Products
3.6.1 Emerging Contaminants In recent years, laboratory methods have evolved to the point that certain compounds can be detected in wastewater down to the parts per trillion. Such compounds include pharmaceutical and personal care products (PPCPs) and endocrine disrupting compounds (EDCs), and are often referred to as emerging contaminants or xenobiotics. These products enter the wastewater system from human usage and there is growing concern over their eventual fate in the environment. While most of these compounds are not currently regulated, the long-term impacts of exposure are not yet understood. There are two principal concerns for the presence of emerging contaminants in effluent: human health effects if effluent is indirectly used for potable water supply, and environmental effects if emerging contaminants are significantly concentrated in a brine waste stream as effluent undergoes membrane treatment.
Comment: There is no statute or rule that requires that the alert levels be 80% of the limits; its just standard practice with ADEQ.
Page 21
Public concern over emerging contaminants in potable water supplies has grown in recent years as the ability to detect these compounds has accelerated faster than our understanding of the potential health effects. As effluent begins to be more widely used as a potable water supply, these concerns must be addressed. Further research must be conducted to determine the health effects of these compounds so that municipal water providers can determine the appropriate treatment goals. The concentration of these materials in brine wastestreams presents another set of challenges. As the use of membrane processes continues to grow, including their use in the treatment of effluent, brine management technologies will continue to evolve. The effects of concentrating emerging contaminants in brine streams must be understood and managed to prevent environmental harms. There are several treatment technologies that are effective at removing certain emerging contaminants from water. However, none of the current technologies are effective at removing all such compounds. The use of a particular technology or combination of technologies must be tied to the eventual end use of the water. Research on new technologies is active and must be monitored so that future projects take advantage of the best available technology at the time.
3.6.2 Disinfection By-Products The organic content of a source water can react with conventional disinfection chemicals, such as chlorine, to form disinfection by-products (DBPs). These by-products are subject to evolving regulations due to the potential for human health impacts. Treated wastewater effluent contains measurable amounts of organic matter that will form DBPs. The formation of DBPs in wastewater is of minor concern when the effluent is discharged to the environment or recycled for non-potable uses. DBPs are subject to a variety of natural attenuation mechanisms in the environment. The limited contact that humans have with non-potable recycled effluent, such as turf irrigation and industrial processes, provides an effective barrier to DBP compounds. However, as water supplies continue to become more limited, many communities will evaluate the use of recycled effluent to augment potable water supplies. This will require additional study of DBPs as effluent becomes an increasingly important source of potable water supply. In addition to further study of DBP formation and health effects, research of the effectiveness of alternative disinfection processes, such as ultraviolet (UV) disinfection, will be warranted. Such processes could reduce the potential generation of DBPs, but they must also be proved effective at preventing disease while being compatible with other disinfection methods used to disinfect the balance of a community’s water supplies.
3.7 Water Reuse Regulations At this time, the EPA is reviewing the 1992 Guidelines For Water Reuse (EPA 1992), but has taken no action to revise or expand the existing regulations. The 1992 EPA guidelines
Page 22
specify pH, turbidity, strength (BOD, total suspended solids), bacteriological, and chlorine residual requirements that are site-specific and vary with the type of reuse. Arizona’s reclaimed water quality standards are established and enforced by ADEQ, and are similar to federal standards, requiring different limits for different classes of reclaimed water. There are no reclaimed water standards for TDS, chloride, or other salinity limits in Arizona’s rules. Other states have adopted specific water quality requirements for reclaimed water, including limits on TDS, or antidegradation standards (California, Florida, Texas), that are unique to the water quality conditions and laws of each state.
3.8 Narrative AWQSs Arizona’s rules provide regulatory authority for ADEQ to establish site-specific narrative AWQSs, if necessary, to ensure that all aquifers and surface water bodies be free from pollutants in amounts or combinations that are toxic to humans, animals, plants, or other organisms.
3.9 Total Maximum Daily Load (TMDL) Section 303 of the CWA requires that each state review, adopt, and modify from time to time, surface water quality standards. EPA must then approve the standards. In addition, each state is required to identify those water bodies or segments that are impaired by one or more pollutants and are not meeting surface water quality standards. Those surface water bodies are then listed on the CWA Section 303(d) list of impaired waters. The CWA requires that each state evaluate the TMDL for each of its impaired water bodies to determine the amount of a specific pollutant a water body can absorb and still meet the surface water quality standard. A TMDL is the sum of the allowable loads of a single pollutant from all contributing point and non-point sources, and includes a margin of safety to ensure that the waterbody can be used for the purposes the state has designated. The calculation must also account for seasonal variation in water quality. The attached map identifies all impaired waters in the United States.
Figure 3.9.1 Impaired Waters in the United States
Comment: What is the point of this sub-section? How does it relate to the water reuse? Expand on this discussion.

Page 23
Arizona, like other states has identified impaired waters and reported those to the EPA. The following table lists, for the six Southwestern states, the total water bodies identified as impaired and the total water bodies impaired for by salinity, TDS, and/or chlorides.
Table 3.9.1 Impaired Waters in Specific States
As indicated in Table 3.9.1, Arizona has yet to identify water bodies as impaired for salinity, TDS, or chloride.
3.10 Anti-Degradation Standards Arizona has adopted, by rule, both numeric and narrative water quality standards and an anti-degradation policy for surface waters. The surface water quality standards are prescribed in Title 18, Chapter 11, Article 1 of the Arizona Administration Code (A.A.C.). Narrative standards are defined in A.A.C. R18-11-108, while the anti-degradation policy is defined in A.A.C. R18-11-107. The current numeric surface water quality standards do not address TDS, chlorides, or salinity, except in certain Unique surface waters, where no increase in TDS is allowed as a result of discharges. However, such standards may be developed in the
State Total Impaired Waters Total Impaired Waters
Identified For Salinity/TDS/Chloride
California 1774 70 New Mexico 347 12
Texas 351 33 Utah 364 77
Nevada 217 15 Arizona 100 0

Page 24
future. It is important to note that Arizona’s antidegradation standards require a determination as to whether or not there is degradation of water quality in a surface water on a pollutant-by-pollutant basis. The rule further requires a three-tiered approach that protects existing water uses, does not allow degradation where existing water quality does not meet a standard, and under certain conditions, may allow limited degradation under controlled circumstances. Waters that are classified as Unique under A.A.C. R18-11-112 must not be degraded.

Page 25
4.0 Case Study of Cave Creek Water Reclamation Plant Sewershed To assist CASS in clarifying the amount of TDS loading added to the sewer system, a study of the CCWRP was conducted. This plant is a small (2 MGD) water reclamation facility located in a growing area of north Phoenix where effluent is reused for turf irrigation purposes. The CCWRP was selected because it has one source of water for potable supply, a mix of commercial and residential customers, and high salinity is already becoming an issue for reuse customers. Effluent from the CCWRP is used as the irrigation source water for the Desert Marriot golf course. Conversations with the Desert Marriott’s golf course superintendent revealed a pattern of data showing increasing soil sodium levels corresponding to increasing sodium levels in the irrigation water as show in Figure 4.0.
Figure 4.0 Rising Salinity in Turf Fairway
59
146.9
78.1
212.7
0
50
100
150
200
250
12/4/2000 3/6/2002 6/27/2003 6/29/2004
Time of Testing
mg/
l Sod
ium
in ir
rigat
ion
wat
er
0
5
10
15
20
25
perc
ent s
odiu
m in
fairw
ay
soils
Potable Water
Reclaimed Water from CC WRP
The full study can be found in Appendix A.
4.1 Sewershed Description Commercial development in the CCWRP sewershed has been focused along the freeway and major north-south roads while large residential development is focused around resorts and greenbelts. Point source contributors of salinity, especially sodium-based softener salt, were investigated to build a reasonable model of a growth-area sewershed. Current data shows that the sewershed adds nearly 500 mg/L TDS over background, a 75 percent increase. The two highest contributing ions to the overall TDS are sodium and chloride. Sodium increases 236 percent and chloride increases 328 percent over background in the CCWRP treated effluent (reuse water). Two main sewer lines connect to the CCWRP; the northern line is called the Cave Creek interceptor, the southern line is called the Mayo Interceptor. At the time of the study, several large commercial and industrial dischargers were not sending wastewater to the CCWRP due
Comment: Figure number is not consistent with other figures.

Page 26
to a lift station (LS51) that needed repair. This represents approximately 600,000 gpd flow and point source contributions of 85,000 pounds per year of softener salt from three sites.
4.2 Commercial Areas Commercial areas predominate on the Mayo Interceptor including Desert Ridge Marketplace, a large outdoor shopping mall, and the Desert Marriott Resort. These two sites contribute nearly 650,000 pounds per year of salt from softeners alone. Three additional point sources that currently are diverted to 91st Avenue due to LS51 are: Mayo Hospital, American Express, and the Scottsdale/101 shopping centers. As stated above, these three sites will contribute an additional 85,000 pounds per year of salt when the lift station is repaired. Additional commercial development of the magnitude of Desert Ridge Marketplace is expected in the next 5 years. The frequency and magnitude of softener regeneration can be shown in the spikes of salinity during the monitoring of the Mayo Interceptor. All of the point sources contribute between 500 and 1,100 mg/L TDS over the background supply water, with Desert Marriott and the area east of Mayo Hospital contributing the highest chloride content.
4.3 Residential Areas The Cave Creek Interceptor is predominately residential. Data collected in this study and in Reclamation’s Residential Softener Use Study indicates that the newer homes have a higher percentage of softeners installed and in use than older homes. Three different residential areas were investigated to show the impact of number of homes and ages on the salinity contribution. The first area, Residential A – Desert Ridge, is a mid 1990s development. Over the course of a one-week flow and conductivity testing, the peak conductivity was 10,316 mS/cm with an average flow of 13.6 gpm for a total flow of 3,819 gallons. Residential B- Dove Valley is early 2000s homes with a peak of 6,555 mS/cm conductivity. Residential C- Tatum Ranch/Desert Willow is 865 accounts of early 1990s homes with a peak conductivity of 5,660 mS/cm and an average flow of 170 gpm for a total of 1.7 million gallons over the week’s data gathering. The grab samples show another side of the conductivity impact of these three residential areas. Residential A showed a 497 mg/L TDS increase over background. Residential B showed a 1,377 mg/L TDS increase over background, and Residential C showed a 697 mg/L TDS increase over background. Residential B, the newest homes, showed the highest increase of both sodium and chloride over background levels.
4.4 Mitigation Strategies Commercial and residential salinity contributors have a greater impact on a small water reclamation plant because the salt is not diluted by abundant flow. Potential solutions to improving the quality of the reclaimed water include: diversion of high salt flows to a large wastewater plant; switching from sodium to potassium salt for softener regeneration, evaluation of non-salt regeneration chemistry as used in Europe, developing a water softener portable exchange unit program to reduce salt load to the sewer system, and/or regulation of commercial dischargers with fees used for water treatment at the water reclamation plant.

Page 27
5.0 Salinity Control Strategies Increasing salinity represents a threat to the sewer system, and to beneficial use of treated effluent. Decisions must be made to control the salinity from entering the wastewater treatment plants. These controls may be regulatory, financial, or technical, and following is a discussion of possible salinity control strategies.
5.1 Prevention Preventing salinity from becoming a problem is one of the most difficult issues faced by municipalities in central Arizona. The largest portion of the TDS load comes from source waters, either from the SRP or CAP surface waters, and to a lesser extent from groundwater. CASS has identified source control measures on the watershed scale. While the Colorado River Basin Salinity Control (CRBSC) Forum has prevented a rise in TDS of Colorado River water, no other watershed-level salinity prevention method is currently financially feasible. Therefore, it is likely that in the immediate future TDS in imported source water will continue to be a challenge whether or not there are any human activities to add to the increase in TDS load. Dealing with the salts added by human activities is where preventive measures will be helpful, however, salts imported with the source waters must also be considered when apportioning the costs of treatment to water users.
5.1.1 Local limits Local limits are designed to prevent introduction of pollutants into the sanitary sewer system that might harm wastewater treatment facilities, to protect the health of treatment plant staff and the public, to allow continued beneficial reuse of treated effluent and biosolids, and to ensure NPDES permit compliance. In the late 1990’s, the Sub-Regional Operating Group (SROG), composed of Phoenix, Mesa, Tempe, Glendale and Scottsdale and co-owners of the 91st Avenue WWTP, was aware of the high TDS problem and recommended that the TDS concentration of effluent flows from WWTP’s not exceed 1,200 mg/L. SROG also projected that several advanced water treatment plants would be built by communities in the Phoenix area over the next 20 years to remove excess TDS (greater than 1,200 mg/L) from wastewater flows. SROG further predicted that the advanced water treatment plants would produce concentrate wastestreams with flows of 20 MGD by 2017 (Greeley and Hansen 1997). Current data indicate that the 1997 projection of WWTP discharges exceeding 1,200 mg/L within the next 20 years has already occurred. Discharges from the 91st Avenue WWTP and the City of Phoenix’s 23rd Avenue WWTP ranged from 1,300 to 1,400 mg/L in the summer of 2004. A local limits study was conducted for the 91st Avenue WWTP and the 23rd Avenue WWTP from 2002 through 2004, however, the final recommendations for establishing TDS local limits were inconclusive. The consultant advised that since there were currently no permit limits for TDS, that a local limit could only be established if the WWTP owners, including SROG member cities Glendale, Mesa, Tempe, Phoenix, and Scottsdale, could agree to water quality goals for various uses of treated effluent. For example, there might be different goals for stream discharge, crop irrigation, industrial reuse, groundwater recharge, or golf course irrigation.

Page 28
A local limits study is currently under way at the CCWRP and data demonstrated that the water being discharged from that plant is even higher, occasionally exceeding 1,500 mg/L. Some of the problems associated with high TDS flows being treated at WWTPs and WRPs are discussed above in Section 3.0 Regulatory Issues. One method to prevent excessive TDS load is the establishment of numeric local limits. Some cities in other states have imposed local limits on TDS dischargers to POTWs, however, this is an uncommon practice and the limits vary considerably, depending on local conditions (Table 5.1).
Table 5.1 Local Limits for TDS Discharge Into WWTP in Various States
State City/Utility TDS Local
Limit (mg/L) Texas El Paso 6,140
Florida Boca Raton 2,000 California Inland Empire
Utility Agency 800
Nevada Clark County Water
Reclamation District
Source water TDS plus 400
mg/L
Other non-numeric(narrative) local limits strategies include use of Best Management Practices (BMP’s) and prohibitions. An example of a BMP might be encouraging use of water softening methods that do not add salts to the sewer (portable exchange units), while an example of a prohibition might be to not allow the use of self-regenerating water softeners, as was done in Santa Clara, California. Another example of a prohibition might be prohibiting discharge of RO concentrate to the sewer. Local limits, either numeric or narrative, will remain one of the tools available to address salinity problems.
5.1.2 Surcharges The process of developing surcharges to support sewer services is well established. Municipalities typically develop charges for flow, strength (BOD, TSS), and other parameters, as needed to pay for the cost of wastewater treatment. Some parameters, such as strength are measured accurately at the WWTPs to determine the actual number of pounds being treated. The number of pounds is divided by the actual cost to treat the wastewater, and a cost per pound is developed, typically on an annual basis. Then the strength is measured by sampling at Significant Industrial Users (SIUs), and the SIUs are billed by the pound. In other cases, an analysis is done for a class of users, such as commercial facilities, and those facilities are billed at a uniform rate that ensures cost recovery. It is currently possible to measure the number of pounds of TDS entering each WWTP, and to develop the actual cost of treating TDS. It will also be possible to develop costs for new
Page 29
treatment equipment, personnel, and disposal that may be required to manage TDS. It is essential to first understand the sources of TDS entering the system, both water and wastewater, and by accurate measurements, or by developing models, to identify the load generated by various industrial, commercial, and residential user classes. Then it will be possible to fairly apportion the cost of treatment to the contributors, based upon their contributions. Since the waters imported into central Arizona from the CAP and Salt River Project (SRP) surface waters are the primary TDS sources, all water users would bear some of the burden of treatment, just like they would to treat high turbidity, algae, or any other water contaminant. However, it would be possible to develop a surcharge system that identifies certain contributors that exceed a threshold, and they could be charged appropriately. On the residential side, a strategy might be to identify homes with water softeners, and to add a small monthly fee to treat the added load from that softener.
5.1.3 Point Source Treatment Point source treatment occurs at many areas throughout the sewershed. Large industrial users use RO or other membrane technology to purify water for their process needs, and then discharge the concentrate to the sewer. Cities treat water, or wastewater, using membranes, and then discharge the concentrate to the sewer. Large centralized cooling systems concentrate TDS, prior to discharge after a number of cycles of concentration. It is possible to identify the actual TDS load generated by these facilities, and to consider whether it may be prudent to require hauling of that concentrate to a centralized disposal facility. One method would be to identify the largest contributors and to consider the economics. If a large contributor had to pay a surcharge, by the pound, to dispose of TDS in the sewer, then it might be possible to develop alternative disposal methods that would be of equal, or even lower in cost. There might be an incentive for cities to assist in developing alternative disposal strategies.
5.1.3.1 Point of Use
5.1.3.1.1 Treatment to Remove Salts as Solid Slurry One potential control strategy for point-of-use treatment is to use a desalting technique such as DewVaporation TM, crystallizers, or RO at larger cooling tower operations to create a solid slurry that could be disposed of as non-hazardous waste. Source water ranges between 500 and 650 mg/L TDS. Larger cooling towers are operated between 3.5 and 5.0 cycles of concentration and concentrate the blowdown to about 1,700 and 3,500 mg/L TDS, which is disposed of in the sewer. The DewVaporation TM technology has yet to be proven reliable in daily use, but the small compact size would have a distinct advantage over other desalting methods because it requires very little energy relative to other technologies. The City of Phoenix’s Sky Harbor Airport evaluated RO on Terminal Two’s cooling towers, but did not find favorable economics for water savings.

Page 30
5.1.3.1.2 Non-Salt Regeneration of Softeners Non-salt regeneration of water softeners is another potential control strategy for point-of-use treatment. One type of “non-salt” regeneration refers to the use of potassium chloride in lieu of sodium chloride. This is a misnomer, as potassium chloride is also a salt, although it is proclaimed to be a more beneficial salt for health. The EPA has established toxicity limits for potassium and high potassium levels have also been indicated in process inhibitions at WWTPs. The true “non-salt” regeneration uses an acid to regenerate a weak acid ion exchange resin instead of sodium-chloride brine. This method has been used extensively in Europe and only removes hardness, not alkalinity, from the water. Although water is not completely softened, it may be sufficient in many cases. Weak acid regeneration works similarly to normal softening in that hard water passes through the ion exchange bed. The difference is that the resin is composed of a weak acid cation that will only remove calcium instead of resin composed of concentrated sodium-chloride brine. The greatest advantage of weak acid regeneration is the reduction of TDS in the treated water, thus reducing the TDS load at the WWTP. The efficiency has been shown to reduce TDS up to 75 percent depending upon the source water composition. Because of the acid used for regeneration, it is better suited to large, point-use systems in hospitals, industrial companies and central exchange bottle operations. The cost difference has not been analyzed and must be demonstrated before this method could be implemented.
5.1.3.1.3 Reuse of Treated Water for On-Site Irrigation Large industrial firms such as the former Motorola (now Freescale) realized that the investment in water treatment makes water a valued commodity. They also realized that merely discharging this valued resource to the sewer reduced its value for both water conservation and environmental compliance. To offset this, Motorola obtained a ruling from ADEQ to use certain types of treated wastewater for on-site irrigation as well as for cooling tower water makeup. Although Motorola has sold the facility, the irrigation project continues to be used. Reuse of treated water for cooling tower makeup required blending with supply water to reduce corrosion of the metallic components of the cooling water system. Honeywell is investigating the use of treated wastewater for cooling tower makeup to reduce overall water and wastewater treatment costs.
5.1.3.2 Small Regional Treatment The concept of a small regional “desalting” treatment facility is based upon the successful model of Northwind, a centralized chilled water facility that services several downtown Phoenix buildings. Northwind is an ice storage and chilled water distribution system for cooling tower water in downtown Phoenix that has been in operation for four years. It is a joint venture between Arizona Public Service (APS) and Bank One Ballpark that delivers 34-degree (Fahrenheit) chilled water to 10 downtown facilities. This service reduces construction and operation costs by eliminating the need for chillers and towers at each

Page 31
customer’s site. Power savings are also substantial due to the efficiency of the chiller system. It is expected that the water savings is also significant because smaller and less efficiently run tower systems have been replaced. The infrastructure of chilled water piping in the downtown area proves that a small regional system can be efficient and beneficial. A small regional treatment desalination facility would be based upon a finite size and customer base, like the Northwind facility, to provide more highly efficient removal of salts and higher quality returned reclaimed water for potential use on site.
6.0 Salinity Treatment Options Because of the growing need for additional water resources, effluent has become an additional source of water for municipalities, industries and the agriculture. As salinity rises, the ability to use effluent as source water may become increasingly limited and will likely result in either direct treatment for non-potable reuse, or use of highly treated effluent for groundwater augmentation. If salinity cannot be prevented from entering the WWTP, it may be prudent to use the desalination method for various non-potable uses to continue the ability to use effluent as a source water. This section describes the different uses of effluent, how rising salinity may impact the end uses, and the different desalination technologies available.
6.1 Non-Potable Reuse Effective reuse of water to maximize potable supply is a resource management issue facing many water providers in central Arizona. Some water providers have developed reclaimed water systems to provide treated wastewater to meet irrigation demands for turf and industrial uses, such as cooling tower water. As the population in central Arizona grows, the need to increase effluent use to provide a supplement for potable uses will occur. As potable water demands increase, competing uses of effluent may drive some creative solutions to issues facing central Arizona communities, including environmental enhancement and restoration projects.
6.1.1 Turf Irrigation Arizona is a golf paradise, and the tourism industry attracts players to the state from around the world. The largest users of reclaimed water for turf irrigation are golf courses, but other large users include schools, hospitals, parks, industries, and green belts. Use of reclaimed water has resulted in a build-up of salts in soils, required selection of salt tolerant turf, and requires application of up to 25 percent more water than is needed for agronomic purposes, simply to leach the salts through the soil column and into the groundwater. Turf irrigation in well-designed golf courses, with sophisticated underdrain systems will delay the need to address salinity in reclaimed water, although it is wasteful. However, continued turf irrigation in other areas such as public parks, may be threatened more quickly. Information on salinity build-up in golf courses irrigated by the CCWRP may be found in Appendix A.
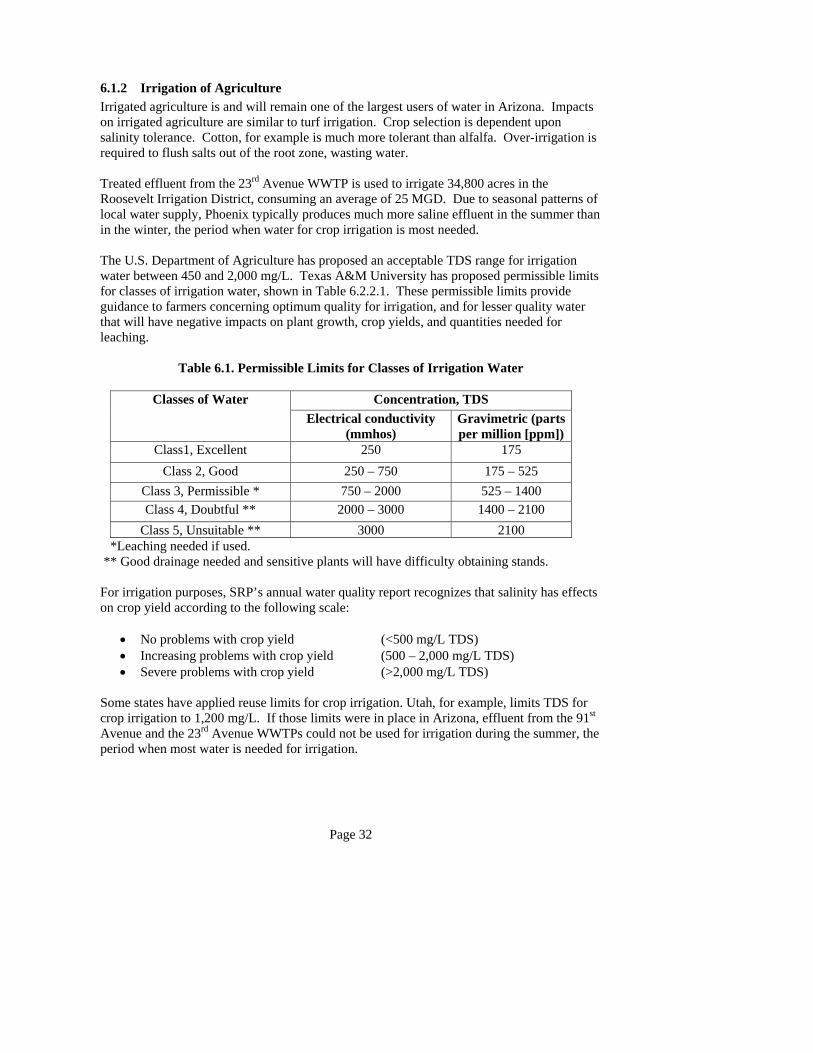
Page 32
6.1.2 Irrigation of Agriculture Irrigated agriculture is and will remain one of the largest users of water in Arizona. Impacts on irrigated agriculture are similar to turf irrigation. Crop selection is dependent upon salinity tolerance. Cotton, for example is much more tolerant than alfalfa. Over-irrigation is required to flush salts out of the root zone, wasting water. Treated effluent from the 23rd Avenue WWTP is used to irrigate 34,800 acres in the Roosevelt Irrigation District, consuming an average of 25 MGD. Due to seasonal patterns of local water supply, Phoenix typically produces much more saline effluent in the summer than in the winter, the period when water for crop irrigation is most needed. The U.S. Department of Agriculture has proposed an acceptable TDS range for irrigation water between 450 and 2,000 mg/L. Texas A&M University has proposed permissible limits for classes of irrigation water, shown in Table 6.2.2.1. These permissible limits provide guidance to farmers concerning optimum quality for irrigation, and for lesser quality water that will have negative impacts on plant growth, crop yields, and quantities needed for leaching.
Table 6.1. Permissible Limits for Classes of Irrigation Water
Concentration, TDS Classes of Water Electrical conductivity
(mmhos) Gravimetric (parts per million [ppm])
Class1, Excellent 250 175 Class 2, Good 250 – 750 175 – 525
Class 3, Permissible * 750 – 2000 525 – 1400 Class 4, Doubtful ** 2000 – 3000 1400 – 2100
Class 5, Unsuitable ** 3000 2100 *Leaching needed if used. ** Good drainage needed and sensitive plants will have difficulty obtaining stands. For irrigation purposes, SRP’s annual water quality report recognizes that salinity has effects on crop yield according to the following scale:
• No problems with crop yield (<500 mg/L TDS) • Increasing problems with crop yield (500 – 2,000 mg/L TDS) • Severe problems with crop yield (>2,000 mg/L TDS)
Some states have applied reuse limits for crop irrigation. Utah, for example, limits TDS for crop irrigation to 1,200 mg/L. If those limits were in place in Arizona, effluent from the 91st Avenue and the 23rd Avenue WWTPs could not be used for irrigation during the summer, the period when most water is needed for irrigation.

Page 33
Other states have applied TDS limits for water used for aquifer recharge that may subsequently be used for agricultural purposes. California has many reuse applications throughout the state, where the limits for recharge are 1,000 mg/L TDS, or less (DRIP 2004). DRIP further noted that meeting this requirement is often difficult because the salinity of water increases by 250 to 500 mg/L every time water is reclaimed. In Arizona, the increase associated with reclamation is 300 to 500 mg/L .
6.1.3 Industrial Reuse Industrial reuse of municipal treated wastewater has traditionally been to power plants or refineries. In the Phoenix metropolitan area, the largest users of effluent for cooling tower purposes are the Palo Verde Nuclear Generating Station and Red Hawk Power Plant, both owned and operated by APS. High salinity is an issue for power plants because it reduces the number of times it can be used in the cooling tower cycle, but this has been somewhat overcome by tertiary treatment. High TDS also causes a problem because power plants must deal with highly concentrated water that is left over in the blowdown. Palo Verde Nuclear Power plant has been in operation for 25 years and utilizes 70,000 acre-feet annually for cooling water to condense steam. This water is treated to tertiary standards with filtration, trickling filters for the removal of ammonia, cold lime softening and clarifiers to remove the hard water salts. The site uses evaporation ponds to contain the blowdown water from the cooling towers, so the salinity does not leave the site.
Redhawk receives water from Palo Verde Nuclear Generating Station's tertiary treatment plant and has been operating for almost 5 years. Redhawk utilizes a Zero Liquid Discharge (ZLD) system to treat cooling tower blowdown, which is composed of an evaporator and crystallizer. The plant has experienced some challenges in using municipal effluent for cooling towers because the composition of the municipal effluent contains varying quantities of organics and nitrates, which causes the crystallizer to have impaired operation. Crystallizers by definition are designed to separate a distinct solid compound from a liquid mixture that is highly concentrated in that compound in its dissolved form, but low molecular weight and low boiling organics will transfer over into the distillate from the brine concentrator, causing problems with reuse of that water for boiler makeup. A small surge pond is installed for the purpose of holding cooling tower blowdown water for a sufficient time to repair the ZLD system.
6.1.4 Groundwater Recharge Artificial groundwater recharge is a water management tool used by water agencies to assist in fully utilizing available renewable water supplies by annually recharging and recovering water for use or storing water underground and recovering it when it is needed at a later date. Recharge in Arizona is typically done via recharge basins or injection wells after vigorous permitting through ADWR, in cooperation with ADEQ. Many municipalities and sewer companies throughout central Arizona have been recharging effluent, but as TDS in effluent increases, others who pump groundwater in the vicinity may start having concerns that recharge is driving up the TDS in their groundwater.
Comment: Cite reference.

Page 34
6.1.4.1. Indirect Potable Reuse In many places in the United States, unplanned indirect potable reuse routinely occurs when treated wastewater discharged from an upstream community is subsequently withdrawn for potable use by a downstream community. The percentage of wastewater effluent in the raw drinking water supply varies significantly depending upon the specific community. In some cases, up to one half of the raw water can be traced to a wastewater origin.
As the populations of communities in the arid Southwest grow, and other available potable water supplies become fully utilized, the need for planned reuse of effluent as a potable supply source will increase. Communities in California, Texas, and Arizona have already begun to utilize recycled water for indirect potable supply. Some of these projects have been in operation for over 25 years. In planned indirect potable reuse systems, treated wastewater is intentionally used to augment water supplies. Highly treated wastewater is blended with other raw water supplies through surface reservoirs or by recharging the aquifer prior to final potable treatment and delivery. In order to provide the highest degree of health protection and maintain community support, the concept of multiple barriers to remove contaminants is practiced. These barriers include wastewater treatment, blending with other supplies (including the added benefits of soil aquifer treatment if recharge is employed), effective drinking water treatment, and extensive raw and treated water monitoring.
6.1.5. Surface Water Restoration With careful planning, water supply and environmental enhancement goals can be mutually achieved. The City of Tucson developed the Sweetwater Wetlands multi-benefit project to treat backwash water from the reclaimed treatment plant filters. Treated effluent is piped to recharge basins in this 18-acre facility, where it and other stored treated water is recovered during the summer months to meet irrigation demands through the City’s reclaimed water system. The wetland ponds and surrounding vegetation also provide food and shelter for a variety of birds, small reptiles, and mammals. The Sweetwater Wetlands has become a popular bird-watching site in southeastern Arizona due to the seasonal species it attracts and it also provides additional community educational benefits through school tours and similar activities. Traditional approaches to restoration projects implemented in partnership with the U.S. Army Corps of Engineers and/or Reclamation may result in a range of design elements with competing water needs. Creative water resource managers look for alternatives that incorporate water supply elements, such as constructed recharge projects, into these restoration projects to result in multi-benefit projects providing water resource, ecosystem, and recreation improvements that meet a range of community needs.
6.2 Desalination of Effluent There are various treatments of desalination that can be utilized to reduce TDS in effluent for various end uses.

Page 35
6.2.1 Reverse Osmosis Osmosis occurs when two liquid solutions of different concentrations are separated by a semi-permeable membrane and water will move through the membrane from the dilute (purer) solution into the more concentrated solution. The flow of water will continue until the concentration on each side of the membrane equilibrates or pressure is applied to the concentrated solution. RO works by applying pressure to the concentrated solution, which then reverses the water flow. Water molecules from the concentrated side are forced through the membrane to the dilute solution. Salt and other dissolved solids are left behind with the concentrated solution. The purified water is referred to as permeate and the concentrated solution of salt and dissolved solids is generally referred to in the water treatment industry as concentrate. Recovery rates are largely limited by the concentration of some sparingly soluble salts in the feed water and thus in the concentrate or reject stream. If recovery is pushed beyond the saturation limits of one or more of these constituents, precipitation will begin to occur on the membrane surface, causing scale. Sulfuric acid, carbonic acid or hydrochloric acid can be used as pretreatment to RO in order to lower pH and add anti-scalant compounds to prevent precipitation of sparingly soluble salts within the RO system. Careful selection of an appropriate scale inhibitor may allow the RO plant to operate at higher recoveries and thus control the amount of concentrate requiring ultimate disposal. RO permeate is aggressive and post-treatment is required to condition and stabilize permeate before injection into the distribution system. For stabilization, lime addition is used to add calcium hardness back to the water to generate water that will not degrade the distribution system. Another option for stabilization is bypass blending, where a portion of the feed water is diverted around the RO system and re-blended with permeate. This reduces the amount of RO treatment equipment and additionally imparts hardness to adjust finished water stability. Nanofiltration (NF) is another membrane treatment, sometimes called “low-pressure RO”. NF works much like RO, but allows more salt to pass through the membrane and does not work as well as RO when TDS levels are over about 1,500 mg/L.
6.2.1.1 Advanced Membrane Treatments for Emerging Contaminants In addition to treating effluent for salinity, membranes may be used to treat effluent for other contaminants (emerging contaminants). As described in Section 2.4 above, the list of emerging contaminants, which have been detected in secondary effluent, includes pharmaceuticals, personal care products, pesticides, and industrial wastes. The EPA does not currently regulate many emerging contaminants but they may be regulated in the future. Some states, such as California, have developed guidelines or regulations concerning these compounds. Potential treatment techniques needed to address emerging contaminants include granular activated carbon (GAC) adsorption, RO, and advanced oxidation processes (AOPs). GAC has the ability to remove many different types of pesticides, as well as other man-made organic contaminants. Pharmaceutical compounds and personal care products can be

Page 36
removed by RO. Certain synthetic organic contaminants, which are not effectively removed by other treatment methods, may be successfully treated using AOPs. The processes employed in AOPs produce hydroxyl radicals during the interaction of two or more oxidants, including ozone/hydrogen peroxide and UV radiation/hydrogen peroxide. The hydroxyl radicals produced have the ability to treat a large number of both man-made and naturally occurring organic contaminants. These techniques may be combined into a system process which effectively removes emerging contaminants from treated secondary effluent.
6.2.3 Thermal Processes Thermal processes, also called distillation, work by heating a saline solution to boiling and vaporizing pure water while leaving the salts (dissolved solids) in solution. Water collects on a cooler surface and is free from dissolved solids. Distillation is the oldest desalting technology, mostly used for sea water desalination, but requires a lot of energy to heat water. This technology has the highest capital, and operation and maintenance costs of all desalination processes and is most often used in dual power-generating and potable water facilities. Distillation is typically not used in the U.S. because of the cost and power requirements.
6.2.4 Electrodialysis/Electrodialysis Reversal Electrodialysis (ED) and Electrodialysis Reversal (EDR) are the processes that desalinize brackish water using electrical currents and semi-permeable membranes. ED works by using a direct electrical current to divide negatively-charged ions (anions) and the positively-charged ions (cations) from its salt solution. A semi-permeable membrane then allows either cations or anions to pass, while blocking the passage of the other ion. For example, a cation permeable membrane allows cations to pass, while it prohibits anions from passing through. ED does not remove particles that are not charged or bacteria. The membrane surface often becomes clogged (or scaled) with buildup of salts and organic material. EDR evolved from ED in the early 1970s and was developed to deal with the scaling issues associated with ED. EDR adds the periodic reversing the polarity of the anode and cathode to the ED technology. This reversal dissipates and prevents buildup of scale on the membrane, which in turn reduces the need for using anti-scalant chemicals and improves the overall life of the membrane. Although ED/EDR does not have as much sensitivity to constituents (such as silica, silt density and turbidity) as other membrane technologies, it does not address organics, microorganisms, and taste and odor constituents which may be found in effluent.

Page 37
6.3 Current Desalination Projects at Wastewater Treatment Plants One way of controlling TDS in effluent of wastewater treatment plants is to treat a portion of that effluent with advanced water treatment methods. The treated effluent could be blended back with non-treated effluent to produce different quality levels of water that could be used for various end uses that require water with lower TDS. Two locations where advanced treatment is being used on effluent is the Water Factory 21 in Orange County, California, and the Water Campus in Scottsdale, Arizona.
6.3.1 Water Factory 21 Water Factory 21 was a long-term testing facility constructed for the purpose of understanding the pros and cons of treating effluent with RO. Water Factory 21 was replaced in the summer of 2004 with a 70 mgd facility that was built to reuse more effluent. During its operation, Water Factory 21 treated and blended 5 MGD of effluent that had undergone RO, 9 MGD of carbon adsorption-treated secondary effluent, and 8.6 MGD of deep well water to produce 22.6 MGD of water, which met all California Department of Health Services primary and secondary drinking water standards. This water was injected into the ground to act as a seawater intrusion barrier in addition to replenishing the aquifers, from which drinking water is drawn for Orange County. The Orange County sanitation district supplied reclaimed secondary effluent because it reduced 15,000 acre-feet of ocean discharge, reduced dependency on imported water, and reclaimed water is drought resistant. Water Factory 21’s treatment train included chemical clarification, re-carbonation, multi-media filtration, GAC, RO, chlorination and blending. The 5 MGD, which was treated by RO, went through a series of treatments prior to the RO process. All the secondary effluent entering Water Factory 21 went through rapid mixing, flocculation, settling, re-carbonation and multi-media filtration. The multi-media filtration reduced turbidity and consisted of anthracite coal, silica sand, and fine and course garnet for a total depth of 30 inches. The multi-media filtration took the place of micro-filtration membranes prior to the RO membranes. The flow stream was then split with 5 MGD going through RO and 9 MGD going through GAC treatment. Just prior to entering the RO membranes, anti-scalant and sulfuric acid to lower pH were added before the effluent went through cartridge filters. Operation of the RO units required pressures of 200 to 325 pounds per square inch (psi) produced by two high pressure pumps. The RO unit was designed in two parallel 2.5 MGD systems. The basic elements consist of six spiral-wound cellulose acetate membranes placed end-to-end inside a 23-foot long, 8-inch diameter fiberglass vessel. There were six banks of membranes, each containing 42 vessels, arranged in three-stages to provide 85 percent recovery. The membranes were cleaned in situ, using product water with a detergent additive. Product water had 90 percent of the TDS removed. The concentrate (15 percent of the total input) was returned to the Orange County Sanitation District for disposal via their ocean outfall.

Page 38
Water Factory 21 is an example of a successful application of RO technology used on effluent. With the knowledge gained from this long-term testing facility, Orange County can build with confidence the new 70 mgd RO facility which will take effluent to a quality where it will meet California state drinking water standards and the 500 mg/L TDS maximum for recharge in California.
6.3.2 City of Scottsdale Water Campus The Scottsdale Water Campus consists of a 54 MGD conventional water treatment plant for Colorado River water delivered by the CAP aqueduct system, a 12 MGD water reclamation plant, and a 12 MGD advanced water treatment facility, which consists of microfiltration (MF) and RO. Also included with the Water Campus, is a distribution system that provides effluent to 21 golf courses in Scottsdale and a 21 MGD recharge facility that consists of 27 vadose zone recharge wells. During periods when irrigation demand is low, tertiary effluent is treated by the advanced water treatment facility with MF then RO. This water is then recharged into the vadose zone through shallow recharge wells as future potable water. When the effluent is being used on the golf courses, Colorado River water is treated by MF and then recharged in the vadose zone wells. Although the Colorado River water has a higher TDS than the ambient groundwater, the annual average TDS recharged is close to the TDS of ambient groundwater because the effluent that is treated by RO has a lower TDS than the ambient groundwater. The MF units consist of 24 USFilter 90M20Cs filters. They are grouped in “sixes”, and each can treat either surface water or tertiary effluent. Pretreatment before the MF units consists of 400 micron screens, and when effluent is being treated, ammonia is fed to ensure that the membranes are not exposed to free chlorine. The RO units consist of 14 3-stage trains each containing Koch Fluid Systems 8832-HR polyamide membranes. Each train recovers 85 percent of its feed flow. Pretreatment consists of pH adjustment with sulfuric acid and anti-scalant. The concentrate is disposed of in the sewer and transported to a large regional WWTP. One train of MF is dedicated to effluent treatment year round to supply one or two RO trains with feed water. The RO permeate is used for membrane flushing and cleaning, to blend down CAP water TDS, and to keep the RO trains ready for summertime monsoon events. These rain events reduce demand at the golf courses quickly and require operations to shift RO production from CAP to effluent. The advanced water treatment portion of the Scottsdale Water Campus is operating successfully. From 1998 to 2003, it has recharged 26,700 acre-feet of water, of which approximately half was effluent processed by RO. The Water Campus creates a new indirect use potable water supply from effluent
Comment: Is this a part number? Describe more or say membrane filters.
Comment: Define ‘train’

Page 39
6.4 Quantities and Costs The Desalination and Water Purification Research and Development Program Report (Mickely, 2001) indicated that only 15.1 percent of desalination plants in the U.S. used ED/EDR, while almost 74 percent used RO. The remaining 11.3 percent of plants used nanofiltration systems. RO has an advantage over ED/EDR because ED/EDR does not have a barrier to organics and microorganisms nor does it remove taste and odor compounds. Because of the likelihood that RO would be used to treat effluent for the added removal of organics and other microorganisms, only RO was looked at for cost. Costs for advanced water treatment are very site specific. In 1998, during the Tucson RO study (Reclamation, 2004), cost curves were developed for constructing and operating RO plants of various sizes in the Tucson area. These curves reflected all phases of constructing and operating a RO facility including the costs of MF pretreatment, chemicals, labor, structures, electricity and everything else needed to build and operate a MF/RO facility. Since Tucson and Phoenix are similar (being southwest urban centers with similar labor force and construction material costs), these cost curves were put into a spreadsheet, indexed forward from 1998 to 2004, and used by the Planning Subcommittee for some “high level” planning work. These same curves are now used for this discussion on costs of advanced water treatment of effluent. It is usually not cost effective or even necessary to treat all the water at a wastewater treatment or reclamation plant. For example, the approximate cost of RO treatment of 150 MGD of effluent at a large WWTP would be about $150 million in construction and $13.8 million annual O&M costs. Brine disposal in evaporation ponds would more then double the capital costs. But obviously, not all the effluent at a WWTP requires treatment. Different water qualities are needed for different uses. As an example, irrigation water for commercial crops such as cotton can use fairly high TDS water; there would be no need to treat effluent used to irrigate cotton or other salt tolerant crops. But water used for recharge into a good quality aquifer may need to be treated to 500 mg/L TDS, such as in California, and water for a golf course may need to be treated to below 1,000 mg/L TDS for optimal turf growing. The following examples illustrate the cost magnitude of decreasing TDS in reclaimed water. Example 1: A regional wastewater treatment plant with 60,000 acre-feet of effluent that will be recharged for indirect potable reuse has a TDS of 1,200 mg/L. The entity recharging this water desires to decrease the TDS to 500 mg/L. An RO facility utilizing MF pretreatment would have capital costs of about $64 million and the annual O&M would be about $5 million. An RO facility of this size would create a brine concentrate stream of 5.33 MGD that would require 1,240 acres of evaporative ponds for disposal. The cost of evaporation ponds would be approximately $116 million for construction, lining and piping. Capital investment for the RO unit may be feasible, but adding cost of concentrate management makes this example project not cost effective. Solutions for this obstacle involve the creation of a more efficient RO system that produces smaller concentrate streams and developing concentrate disposal alternatives that reduce the volume of concentrate.
Comment: What Tucson RO study? Refer to Section if previously mentioned, or describe now.
Comment: State what aspects they are similar in (population size? Number of WWTPs?)

Page 40
Example 2: A new suburban water reclamation plant delivers 500,000 gpd of effluent for golf course irrigation at a current TDS of 1,100 mg/L TDS. The golf course and water reclamation facility would like to decrease TDS to 900 mg/L TDS. An RO facility utilizing MF pretreatment would cost about $750,000 and the O&M is estimated at about $70,000 annually. An RO facility of this size would create a concentrate stream of 17,000 gpd that would require four acres of land for disposal at a cost of $560,000. If the land was already available and a single liner used for the evaporation ponds the costs would be greatly reduced. Advanced treatment of reclaimed water will be much more likely if an inexpensive concentrate disposal method was available. The desalination of effluent, while expensive, may have to be done to continue using effluent as a renewable water resource for future uses. This is especially critical for indirect potable reuse through recharge.
7.0 Conclusions Rising salinity at the wastewater treatment plant is often not considered a pressing problem in comparison with other wastewater treatment plant issues such as sewer capacity and meeting discharge limits. Yet as water resources become more limited and reclaimed water gains acceptance as source water for irrigation, manufacturing and eventual indirect potable reuse, increasing TDS will have to be dealt with because of the implications high TDS may have with these end uses. Currently there are no quantity or quality limits for TDS entering the wastewater treatment plant, although effluent must meet whole effluent toxicity standards as it is discharged. No rules or regulations for TDS levels at the WWTP are expected in the near future. Little data is available to define the impact of TDS load on processes at the large central WWTPs, however, a recent study indicates that the wastewater treatment process may experience nitrification inhibition as influent TDS concentrations reach 2,000 to 3,000 mg/L. It is likely that smaller water reclamation plants will receive more concentrated TDS, and will be impacted sooner than larger WWTPs. This is the case with the CCWRP in northeast Phoenix, which has experienced chronic whole effluent toxicity, possibly associated with TDS or chloride. Adverse impacts at smaller WRP’s may be a warning of future concerns at larger WWTP’s. It is anticipated that WWTPs will continue to see increasing salinity concentration in the future because of high TDS source waters, increased residential and commercial water softener usage, and increased quantities of concentrated water from cooling towers. Of particular concern is the rising salinity level of the inflow to the WWTP due to the discharge of brine concentrate from advanced membrane treatment processes. The sewer is currently the most used for concentrate disposal. There may not be a single solution to resolve the problem of increasing TDS at the WWTP, yet several options for controlling the amounts of salinity entering the treatment plant. These include:

Page 41
• Elimination of the largest TDS streams into sewer system to protect WWTPs and WRPs from inhibition or pass through.
This may require point-source treatment of concentrated TDS streams that is generated at large industrial facilities, membrane treatment, and cooling towers. A strategy may be to encourage the private sector to develop a centralized receiving/treatment facility for TDS. • Placing local limits on TDS quantity and quality on known TDS sources
discharging into the sewer system. Local limits to TDS discharge may be difficult to calculate, because there are currently no regulatory limits on TDS discharges. Studies similar to the CCWRP study will be needed to analyze who and where the largest source contributors are and quantify the chemical composition of the TDS stream so that appropriate treatment processes may applied to manage the brine concentrate. A possible alternative to local limits may be to develop a surcharge program. This would require an accurate accounting of TDS sources to support a surcharge, so that the costs can be fairly apportioned. An accurate evaluation of the cost of TDS treatment, including current and new costs for equipment, staff, and residuals handling must be made to allow development of cost per pound of TDS treated. All water users will be impacted by charges for TDS management, however, the largest contributors will pay more. • BMPs or prohibitions may be considered in place of actual local limits. Examples of BMPs are encouraging use of non-self regenerating water softeners (portable exchange units) and encouraging product substitution, such as using potassium chloride instead of sodium chloride in water softeners. An example of a prohibition might be limiting point source discharges to a certain number of pounds of TDS per day. • Allowing high TDS streams to enter the sewer system, but using desalination to
treat water for end uses such as turf irrigation, industrial reuse and recharge. Allowing high salinity effluent to enter the WWTP would require limits for end uses and may drive up the cost of effluent. Goals should be in a range rather than specific and must be refined upon further study. Potential limits for end uses are:
o Stream discharge: 800 to 1,500 mg/L o Industrial reuse: industry specific o Agricultural reuse: 800 to 1,500 mg/L o Turf irrigation; 500 to 1,200 mg/L o Groundwater recharge: 500 to 1,000 mg/L or allowing no unreasonable harm
There are still many unknowns on the impacts of salinity on the wastewater treatment plant processes and until these impacts are identified, the mechanisms to control rising salinity entering the plants are not available or enforceable. What is necessary is to further study the effects of salinity on the WWTP and education on the implications of high salinity to water resources, not just effluent.
Page 42
8.0 References American Membrane Technology Association (AMTA), Desalting Facts
http://www.membranes-amta.org/desalting.html Burton, G.A. and Nordstrom, J.F. 2004: An In Situ Toxicity Identification Evaluation
Method Part I: Laboratory Validation. Environmental Toxicology and Chemistry: Vol. 23, No. 12, pp. 2844–2850.
Burton, G.A. and Nordstrom, J.F. 2004: An In Situ Toxicity Identification Evaluation
Method Part Ii: Field Validation. Environmental Toxicology and Chemistry: Vol. 23, No. 12, pp. 2851–2855.
Desalination Research and Innovation Partnership (DRIP), 2004
http://www.mmenvirosoft.com/drip_website/default.htm Jop, K.M. and A.M. Askew. 1994. Toxicity identification evaluation using a short-term
chronic test with Ceriodaphnia dubia. Bulletin of Environmental Contamination and Toxicology 53:91-97.
Mickley, M., et. al, Mickley and Associates. 2001. Membrane Concentrate Disposal:
Practices and Regulation. Desalination and Water Purification Research and Development Program Report No. 69
Mount, David R., Gulley, David D., Hockett, J. Russell, Garrison, Tyler D., Evans, James M.
1997. Statistical Models to Predict The Toxicity Of Major Ions To Ceriodaphnia Dubia, Daphnia Magna And Pimephales Promelas (Fathead Minnows). Environmental Toxicology And Chemistry 1997 16: 2009-2019
United States Department of the Interior, Bureau of Reclamation. 2003. Desalting Handbook
for Planners. Desalination and Water Purification Research and Development Program Report No. 72.
United States Department of the Interior, Bureau of Reclamation. 2004. Reverse Osmosis
Treatment of Central Arizona Project Water for the City of Tucson. Desalination and Water Purification Research and Development Program Report No. 36.
United States Department of the Interior, Bureau of Reclamation. 2001. Report to Congress -
Desalination and Water Purification Research & Development Program. Report No. 67
The Study Partners: City of Glendale, City of Mesa, City of Phoenix, City of Scottsdale, City of Tempe, Arizona-American Water Company, City of Chandler, City of Goodyear, City of Peoria, City of Surprise, City of Tucson, Town of Buckeye, Town of Gilbert, Queen Creek Water Company, Brown and Caldwell and the Bureau of Reclamation
Appendix A Cave Creek Water Reclamation Plant Study
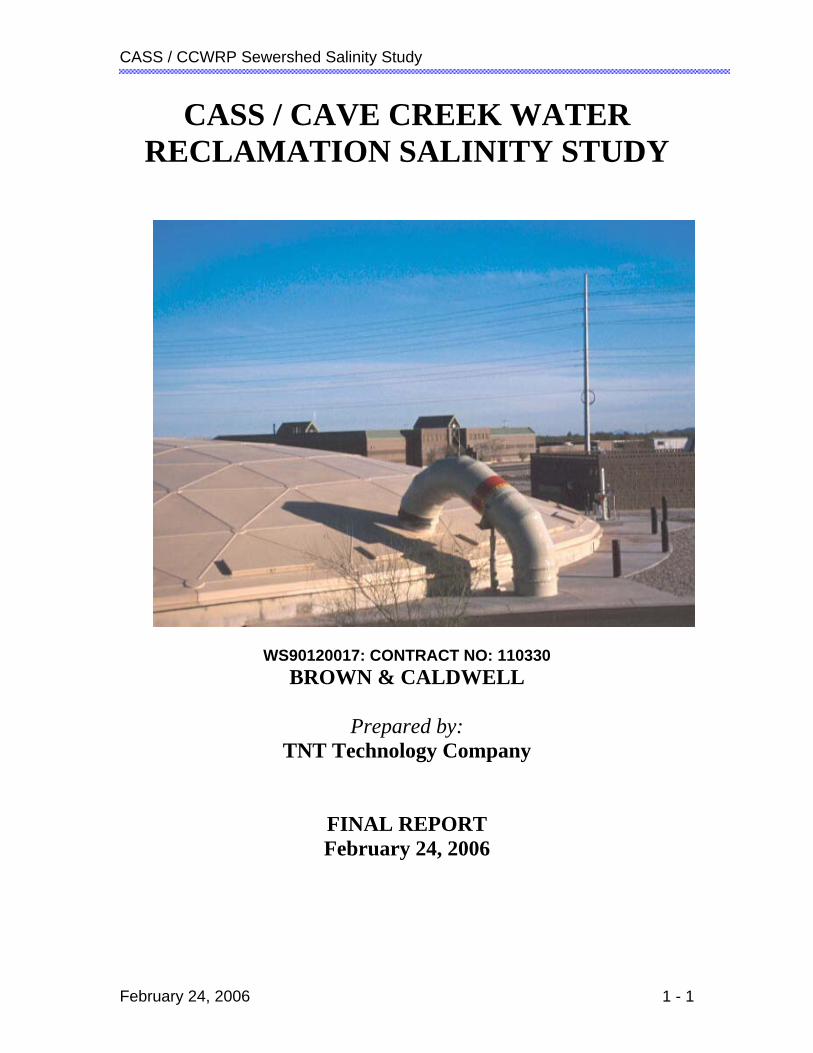
CASS / CCWRP Sewershed Salinity Study
February 24, 2006 1 - 1
CASS / CAVE CREEK WATER RECLAMATION SALINITY STUDY
WS90120017: CONTRACT NO: 110330 BROWN & CALDWELL
Prepared by:
TNT Technology Company
FINAL REPORT February 24, 2006

CASS / CCWRP Sewershed Salinity Study
February 24, 2006 1 - 2
ACKNOWLEDGMENTS
This report is complied from work conducted by various members of the City of Phoenix including: Peggy Parma who investigated rental equipment and laboratory testing costs and provided supervision and reporting of sampling activity; Roger Vial who investigated each manhole site, deployed the equipment and reported testing data results, and sampled the J.W. Marriott Softener backwash. Andy Terrey obtained zoning maps, aerial maps of each site, and with other staff members provided graphics and photos of CCWRP. David Perry of Arizona Water Quality Association provided information on residential water softener operation, softener salts and current exchange bottle marketplace intelligence. City personnel conducted the laboratory testing and others worked with Roger Vail to deploy, retrieve and clean the flow, conductivity and composite sampler equipment. Thank you to City of Phoenix, Bureau of Reclamation and Brown & Caldwell personnel who provided oversight and review of the project, technical presentations and this report. Funding for this project was provided by the Bureau of Reclamation’s Central Arizona Salinity Study group.
CASS / CCWRP Sewershed Salinity Study
February 24, 2006 1 - 3
CITY OF PHOENIX Contract No. 110330
BROWN & CALDWELL Project No. WS90120017
CASS / CAVE CREEK WATER RECLAMATION SEWER SHED SALINITY STUDY
Final Report
February 24, 2006 Table of Contents
1.0 Executive Summary ............................................................................................... 1-1
1.1 Applicability .............................................................................................. 1-1 1.2 Key Findings.............................................................................................. 1-1 1.3 Additional Findings ................................................................................... 1-2 1.4 Recommendations...................................................................................... 1-2
2.0 Introduction............................................................................................................ 2-1 2.1 Purpose and Scope ..................................................................................... 2-1 2.2 Sewershed Description............................................................................... 2-3 2.3 Background................................................................................................ 2-3 2.4 Study Approach
3.0 Sampling Plan Site Characteristics & Data ........................................................... 3-1 3.1 Site Descriptions ....................................................................................... 3-1
3.1.1 Commercial Sampling Sites...................................................... 3-1 3.1.1.1 J.W. Marriott Desert Ridge Resort & Spa .................... 3-1 3.1.1.2 American Express ......................................................... 3-3 3.1.1.3 Mayo Hospital............................................................... 3-3 3.1.1.4 Desert Ridge Marketplace............................................. 3-4 3.1.1.5 Developments East of Mayo Hospital .......................... 3-4
3.1.2 Residential Sampling Sites ....................................................... 3-5 3.1.2.1 Residential A................................................................. 3-5 3.1.2.2 Residential B................................................................. 3-5 3.1.2.3 Residential C................................................................. 3-5
3.2 Sampling Plan ............................................................................................ 3-6 3.2.1 Analyte Selection and Analytical Methods............................... 3-6
4.0 Water Softeners ..................................................................................................... 4-1 4.1 Overview.................................................................................................... 4-1 4.2 Equipment and Process of Softening ......................................................... 4-1 4.3 Residential Softeners ................................................................................. 4-2 4.4 Commercial Softeners................................................................................ 4-2 4.5 Potassium vs. Sodium Chloride Salt for Regeneration.............................. 4-3 4.6 Non-Salt Regeneration (Demineralization) ............................................... 4-4
5.0 Results and Discussions......................................................................................... 5-1 5.1 Introduction................................................................................................ 5-1
5.1.1 Data Sources and Quality.......................................................... 5-1 5.2 CCWRP TDS vs. TDS at Other WRPs...................................................... 5-2 5.3 Conductivity and TDS Results................................................................... 5-4

CASS / CCWRP Sewershed Salinity Study
February 24, 2006 1 - 4
5.3.1 Conductivity vs. TDS................................................................ 5-4 5.3.2 Conductivity Variability at the CCWRP................................... 5-5 5.3.3 Conductivity and TDS within the Sewershed........................... 5-6
5.4 TDS Contributions from Residential Development................................... 5-8 5.4.1 Water Conservation and TDS ................................................... 5-9 5.4.2 Residential Water Softeners and TDS .................................... 5-10
5.4.2.1 Updated residential Water Softener Market Penetration Results ......................................... 5-12
5.4.3 Projected Residential TDS Increases as a Function of Softener Use and Conservation............................................... 5-13
5.4.4 Pools and TDS ........................................................................ 5-15 5.4.4.1 General Impact of Pools on TDS................................ 5-15 5.4.4.2 Salt Pools .................................................................... 5-15
5.5 TDS Contributions from Commercial Development ............................... 5-15 5.5.1 TDS Contributions from Resorts ............................................ 5-16 5.5.2 TDS Contributions from Non-resort Commercial
Operations ............................................................................... 5-17 5.5.2.1 TDS Contributions from Mayo Hospital .................... 5-17 5.5.2.2 TDS Contributions from American Express............... 5-18 5.5.2.3 TDS Contributions from Desert Ridge Marketplace .. 5-18 5.5.2.4 TDS Contributions from Pinnacle High School ......... 5-18
5.6 Disinfection and TDS .............................................................................. 5-18 5.6.1 Salt Use for Disinfection......................................................... 5-18 5.6.2 Impact of Disinfection on TDS............................................... 5-19
5.7 Impacts of TDS........................................................................................ 5-20 5.7.1 Impacts of TDS on Turf Irrigation.......................................... 5-20 5.7.2 Impacts of TDS on Recharge and Recovery........................... 5-22 5.7.3 Impacts of TDS on Compliance Requirements ...................... 5-22 5.7.4 Impacts of TDS on Reclamation Costs................................... 5-23 5.7.5 Impacts of TDS on Water Supply........................................... 5-23
6.0 Conclusions............................................................................................................ 6-1 6.1 Water Softeners and Conservation............................................................. 6-1 6.2 Actual TDS vs. Predicted........................................................................... 6-1 6.3 The Impacts of TDS................................................................................... 6-1 6.4 Prioritized TDS Contributors..................................................................... 6-2 6.5 Impacts of Growth ..................................................................................... 6-2 6.6 Future Trends ............................................................................................. 6-3
7.0 Recommendations.................................................................................................. 7-1 Appendices A Raw Data B. Aerial Photographs of Sampling Sites C Statement of Work D Presentations
CASS / CCWRP Sewershed Salinity Study
February 24, 2006 1 - 5
E References
CASS / CCWRP Sewershed Salinity Study
February 24, 2006 1 - 6
TABLES No. Page 2.1 Classes of Dischargers ................................................................................... 2-4 3.1 Sample Location Designations ...................................................................... 3-1 3.2 J.W. Marriott Water Use (gallons)................................................................. 3-4 3.3 Analyte Selection and Analytical Methods.................................................... 3-7 4.1 Water Hardness Values vs. Surface Supply................................................... 4-1 5.1 Summary of Water Quality Analyses ............................................................ 5-1 5.2 Summary of Conductivity Data ..................................................................... 5-6 5.3 Sewershed TDS.............................................................................................. 5-7 5.4 Residential Sampling Locations .................................................................... 5-8 5.5 TDS as a Function of Water Conservation .................................................. 5-10 5.6 Concentration Factor Calculations (Residential) ......................................... 5-11 5.7 Major Constituents (Residential Change Over Source)............................... 5-11 5.8 Softener Use Based on Water Quality Data................................................. 5-12 5.9 Projected TDS Increases as a Function of Softener Use and Conservation ........ ...................................................................................................................... 5-14 6.1 Prioritized TDS Discharges ........................................................................... 6-2 A.1 Residential A Peak Conductivity ................................................................ A-11 A.2 Residential B Peak Conductivity ................................................................ A-11 A.3 Residential B Peak Conductivity ................................................................ A-12 A.4 JW Marriott Resort Peak Conductivity....................................................... A-12 A.5 Mayo Hospital Peak Conductivity .............................................................. A-13 A.6 American Express West Peak Conductivity ............................................... A-13 A.7 Desert Ridge Marketplace Peak Conductivity............................................ A-14 A.8 Mayo Interceptor Peak Conductivity .......................................................... A-15 A.9 Cave Creek Peak Conductivity ................................................................... A-15 FIGURES No. Page 2.1 CCWRP Sewershed map ...............................................................................2-2 3.1 J. W. Marriott Desert Resort photograph.......................................................3-2 3.2 Commercial Water Softener ..........................................................................3-2 3.3 American Express ..........................................................................................3-3 3.4 Mayo Hospital................................................................................................3-3 3.5 Desert Ridge Marketplace map......................................................................3-4 3.6 Residential Sampling Location......................................................................3-5 4.1 Ion Exchange .................................................................................................4-1
CASS / CCWRP Sewershed Salinity Study
February 24, 2006 1 - 7
4.2 Residential Water Softener Schematic Drawing............................................4-2 4.3 Commercial Softener Salt Contributors to CCWRP – Mayo Interceptor......4-3 5.1 WRP TDS – Increase Over Supply................................................................5-3 5.2 WRP Salinity – Selected Ion Changes...........................................................5-3 5.3 TDS vs. Conductivity.....................................................................................5-4 5.4 CCWRP Influent Conductivity ......................................................................5-5 5.5 CCWRP Influent Conductivity (Detail).........................................................5-6 5.6 Flow Diagram of Sewershed TDS Contributors............................................5-8 5.7 Average Wastewater TDS by Residential Development Age .......................5-9 5.8 Projected Changes in Major Ions Over Source..............................................5-12 5.9 Estimated Residential Softener Use Based on Water Quality Data...............5-13 5.10 Projected TDS Impacts from Growth, Softener Use and Conservation ........5-14 5.11 Commercial Softener Regeneration Cycle – Conductivity vs. Elapsed Time ...................................................................5-17 5.12 On-Site Chlorine Generator Schematic .........................................................5-19 5.13 Irrigation Water Sodium and Soil Sodium.....................................................5-21 5.14 Sodium Adsorption Ratio ..............................................................................5-22 A.1 Residential A Conductivity............................................................................A-1 A.2 Residential B Conductivity ............................................................................A-2 A.3 Residential C Conductivity ............................................................................A-3 A.4 JW Marriott Resort Conductivity...................................................................A-4 A.5 Mayo Hospital Conductivity..........................................................................A-5 A.6 American Express – West Conductivity ........................................................A-6 A.7 American Express – East Conductivity .........................................................A-7 A.8 Desert Ridge Marketplace Conductivity........................................................A-8 A.9 Mayo Interceptor Conductivity......................................................................A-9 A.10 Cave Creek Interceptor Conductivity ............................................................A-10

CASS / CCWRP Sewershed Salinity Study
February 24, 2006 1 - 8
1.0 Executive Summary This document summarizes work conducted as part of the Cave Creek Water Reclamation Plant (CCWRP) Sewershed Salinity Study (City of Phoenix Contract# 110330). 1.1 Applicability The results of this work are applicable to new and rapidly growing development areas within Central Arizona and any sewershed with significant water softener utilization. 1.2 Key Findings The key findings of this study are that: • Total dissolved solids (TDS) increased 590-730 mg/L between potable water being
delivered to City of Phoenix (COP) water customers in the vicinity of the CCWRP (650 mg/L), and wastewater being received at the CCWRP(1260-1380 mg/L).
• This increase exceeds those experienced at larger COP Wastewater Reclamation Plants (WRPs), as well as others (Gilbert and Scottsdale) within the Phoenix Metropolitan Area.
• Thirty to seventy percent of this additional TDS is in the form of sodium chloride (NaCl), and is generated by residential and commercial water softeners.
• Residential water softener market penetration is higher than expected (68% as opposed to 51%), and growing at a rate of 2% per year.
• Water conservation efforts have reduced wastewater flows from 86 gpcd (used in the mid-1990’s for planning) to 62 gpcd, (actual after 2000) which increase the impact of water softener use on TDS.
• TDS from residential and commercial sources in CCWRP product is expected to increase to levels that will negatively impact the intended uses of the product. By 2025 the increase in TDS at CCWRP from fast growth in residential alone can reach 600-700 mg/L .
• J.W. Marriott resort is the largest single point source contributor of sodium chloride (over 500,000 pounds annually) and the resort’s golf course (Wildfire) is the largest customer of CCWRP.
• Sodium content of CCWRP product water directly correlates with sodium levels measured in Wildfire golf course fairways.
• Individual restaurant contribution of softener salt varies from very small to large, but when clustered together in a large intense commercial development (such as Desert Ridge Marketplace) they can produce TDS concentrations greater than 1500 mg/L.
• Additional TDS and concentrations of sodium and chloride to CCWRP product water will occur when Lift Station 51 is repaired.

CASS / CCWRP Sewershed Salinity Study
February 24, 2006 1 - 9
1.3 Additional Findings Additionally, this study has: • Characterized and prioritized the major salinity contributors to this sewershed,
PRIORITY Description Justification
1
New residential This area can produce a TDS greater than 2000 mg/L, is showing 60% water softener utilization,and represents an increasing percentage of the sewershed.
2Resort/Large Hotels These facilities can deliver a TDS greater than 1700 mg/L,
and represents 100% water softener utilization.
3
Intense commercial, (restaurants, bars, data centers)
These facilities can produce a TDS greater than 1500 mg/L, and represent significant softener use
4 Hospitals TDS greater than 1100 mg/L, existing SIU5 Pre-2000 residential TDS greater than 1100 mg/L, may change with time6 Light retail, office, schools TDS greater than 1100 mg/L, expected to remain consistent
Table 6.1 Prioritized TDS Discharges
• Analytically quantified the 30% drop in gallons per capita per day (gpcd) after the
year 2000 due to water conservation and residential water softener market penetration within this sewershed,
• Produced relevant slow and fast growth projections based on this lower gpcd, • Summarized the key issues that will result from increased salinization within this
sewershed, • Projected TDS increases at CCWRP over the next twenty years, • Quantified residential and commercial softener regeneration cycles by time, volume
and salinity, • Developed correlation curves for TDS and conductivity for wastewater samples, and • Investigated technical, environmental and cost issues that favor sodium over
potassium chloride for softener regeneration. 1.4 Recommendations The following recommendations are made: • Determine actual gpcd flows for this sewershed from residential and commercial
developments since 2002. • Verify the level of sodium and chloride that are toxic to Ceriodaphnia dubia through
the on-going Toxicity Identification Evaluation.
CASS / CCWRP Sewershed Salinity Study
February 24, 2006 1 - 10
• Continue diurnal study of conductivity spikes and the short-term impacts on CCWRP activated sludge process.
• Begin tracking groundwater quality in the vicinity of the CCWRP if this is not
already being done. • Compare and contrast salinity impacts at CCWRP to other high growth areas in
Central Arizona. • Develop an understanding of salt pool technology, to determine its potential for future
salinity discharges to the sewershed. • Speed up the development of an overall salinity management strategy for this
sewershed.

CASS / CCWRP SAMPLING PLAN
February 24, 2006 C-11
2.0 Introduction 2.1 Purpose and Scope This study was commissioned to characterize the CCWRP sewer shed, identify and quantify TDS sources, and attempt to project TDS changes over a 15 year planning horizon. As a small WRP with a consistent and steady source water TDS, this area represents an ideal study location to determine specific ion and overall TDS contributors of both residential and commercial sources. The Scope of Work for this project can be found in Appendix C. This study focused on developing concrete measurements and calculations to identify the true nature of the sewer shed and the impact residential and commercial sources have on a small water reclamation plant, today and projected over the next 15 years. 2.2 Sewershed Description The CCWRP sewershed covers a 55 square-mile area in northeast Phoenix, Arizona, and is comprised of relatively new development. Two interceptor sewers collect wastewater from the sewershed for treatment at the CCWRP. The Mayo interceptor runs along the southern border of the sewershed, and transports wastewater from east to west. A majority of the discharges to this interceptor are from commercial developments. The Cave Creek interceptor runs along the western edge of the sewershed, and is dominated by a variety of residential developments, with limited commercial sites. This interceptor transports wastewater from north to south. Both interceptors serve the CCWRP. CCWRP is an 8 MGD WRP which is currently treating an average daily flow of 2.6 MGD. At full build-out it will treat 32 MGD. CCWRP is ideal for this kind of study because of the consistent Central Arizona Project (CAP) water supply with a stable TDS level year round. Wells in this area were not in use during the sampling period. This reduced the number of variables in the study. It also has well-defined and easily isolated neighborhoods in a growth area. The impact of salt in this small sewershed is a microcosm of the larger wastewater treatment plants in Central Arizona. The product from this facility is utilized for large (>5 acres) irrigation and groundwater recharge, both of which are impacted by high salinity. Figure 2.1 is a map of the CCWRP sewershed. The location of the CCWRP is identified and the areas of the sewershed that contribute to each of the interceptors are highlighted. The light blue area flows to the Cave Creek interceptor and the beige area flows to the Mayo interceptor. The North Gateway Forced Main will contain 87,875 gpd flows from Lake Pleasant Water Treatment Plant via the North Gateway Water Reclamation Plant starting in 2007. This flow will contain centrate, sanitary, wash and grey water. The general names of the sampling sites are identified by location. The boxes outlined in red
CASS / CCWRP SAMPLING PLAN
February 24, 2006 C-12
indicate those sampling sites that are currently being diverted to 91st Avenue due to repairs at Lift Station 51 (LS 51). LS51 currently diverts 600,000 gpd.
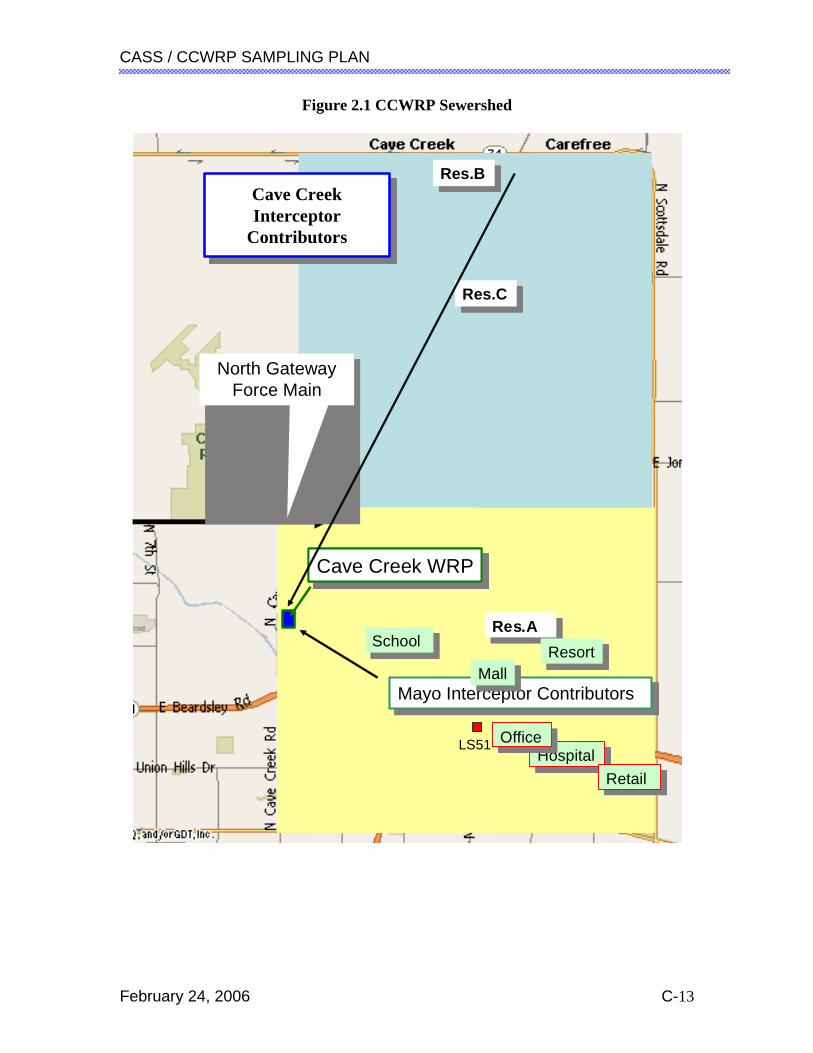
CASS / CCWRP SAMPLING PLAN
February 24, 2006 C-13
Figure 2.1 CCWRP Sewershed
Cave Creek WRPCave Creek WRP
Mayo Interceptor ContributorsMayo Interceptor Contributors
North Gateway Force Main
North Gateway Force Main
Res.BRes.B
Res.CRes.C
Res.ARes.A
MallMallResortResort
HospitalHospitalLS51
SchoolSchool
RetailRetail
Cave Creek Interceptor
Contributors
Cave Creek Interceptor
Contributors
OfficeOffice
Cave Creek WRPCave Creek WRPCave Creek WRPCave Creek WRP
Mayo Interceptor ContributorsMayo Interceptor Contributors
North Gateway Force Main
North Gateway Force Main
Res.BRes.B
Res.CRes.C
Res.ARes.A
MallMallResortResort
HospitalHospitalLS51
SchoolSchool
RetailRetail
Cave Creek Interceptor
Contributors
Cave Creek Interceptor
Contributors
OfficeOffice

CASS / CCWRP SAMPLING PLAN
February 24, 2006 C-14
2.3 Background The City of Phoenix operates two large Water Reclamation Plants (WRPs) (the 23rd Avenue WRP and the 91st Avenue WRP). The sewershed for these facilities transports wastewater from a complex mix of residential, commercial and industrial discharges. Reclaimed water from these facilities is utilized for large scale agricultural and cooling needs, as well as a constructed wetland operated by the City. City of Phoenix (COP) has previously determined that 27% of the TDS going to these facilities comes from residential, industrial, and commercial sources, while 73% is attributable to source water. A growing trend within the Salt River Valley (SRV) has been to build smaller, localized WRPs such as the Cave Creek Water Reclamation Plant (CCWRP). This reduces the impact of growth related flow on older infrastructure, and allows reclaimed water to be utilized for irrigation and recharge within the WRP’s service area. Data from the CCWRP shows that unlike COP’s larger facilities, less than 50% of the TDS entering the CCWRP can be attributed to source water. This represents a significant increase in TDS over what had been expected, and impacts the City’s reuse goals for this facility. A second trend has been the increased use of point of use (POU) water treatment devices to improve water quality (predominately hardness). This trend has become so prevalent, that many new homes come equipped with technologies such as water softeners, which replace hardness causing ions (calcium and magnesium) with sodium or potassium. Nearly all water softeners in use today are sodium-based. Currently 9300 housing units are connected to the sewer and this figure is projected to potentially rise to 62,000 units by 2025. A high percentage of these homes have and use softeners. Taken together, these two developments have had the effect of increasing the concentrations of salt entering localized WRPs, and negatively impacting the quality of their product. 2.4 Study Approach The study began by identifying specific classes of dischargers to the sewershed that would represent changes in residential development ages, as well as various commercial contributors to the sewershed. These classes of dischargers are summarized in Table 2.1.
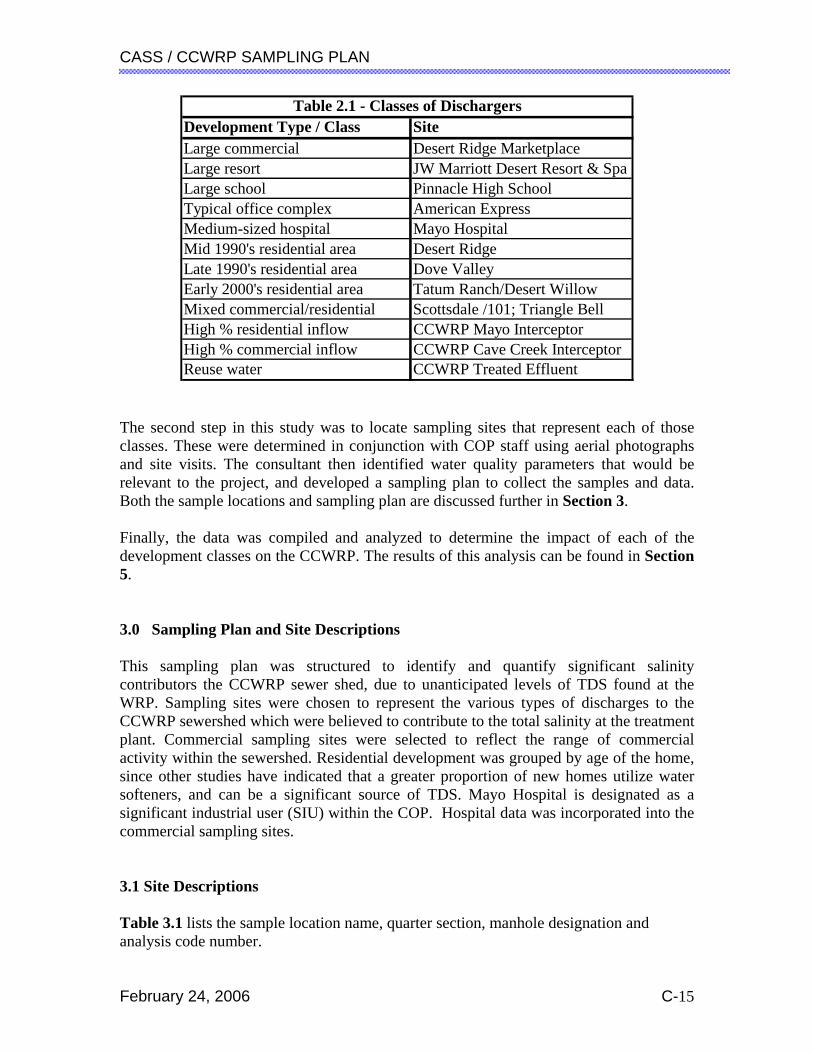
CASS / CCWRP SAMPLING PLAN
February 24, 2006 C-15
Development Type / Class Site Large commercial Desert Ridge MarketplaceLarge resort JW Marriott Desert Resort & SpaLarge school Pinnacle High SchoolTypical office complex American ExpressMedium-sized hospital Mayo HospitalMid 1990's residential area Desert RidgeLate 1990's residential area Dove ValleyEarly 2000's residential area Tatum Ranch/Desert WillowMixed commercial/residential Scottsdale /101; Triangle BellHigh % residential inflow CCWRP Mayo InterceptorHigh % commercial inflow CCWRP Cave Creek InterceptorReuse water CCWRP Treated Effluent
Table 2.1 - Classes of Dischargers
The second step in this study was to locate sampling sites that represent each of those classes. These were determined in conjunction with COP staff using aerial photographs and site visits. The consultant then identified water quality parameters that would be relevant to the project, and developed a sampling plan to collect the samples and data. Both the sample locations and sampling plan are discussed further in Section 3. Finally, the data was compiled and analyzed to determine the impact of each of the development classes on the CCWRP. The results of this analysis can be found in Section 5. 3.0 Sampling Plan and Site Descriptions This sampling plan was structured to identify and quantify significant salinity contributors the CCWRP sewer shed, due to unanticipated levels of TDS found at the WRP. Sampling sites were chosen to represent the various types of discharges to the CCWRP sewershed which were believed to contribute to the total salinity at the treatment plant. Commercial sampling sites were selected to reflect the range of commercial activity within the sewershed. Residential development was grouped by age of the home, since other studies have indicated that a greater proportion of new homes utilize water softeners, and can be a significant source of TDS. Mayo Hospital is designated as a significant industrial user (SIU) within the COP. Hospital data was incorporated into the commercial sampling sites. 3.1 Site Descriptions Table 3.1 lists the sample location name, quarter section, manhole designation and analysis code number.

CASS / CCWRP SAMPLING PLAN
February 24, 2006 C-16
Site Name QS Manhole CDesert Ridge Marketplace 41-39 219JW Marriott Desert Resort 43-40 302American Express - East Bldg 39-40 401American Express - West Bldg 39-40 402Mayo Hospital 39-41 Vault 5Residential A - Desert Ridge 43-39 407Residential B - Dove Valley 56-37 213Residential C - Tatum Ranch/Desert Willow 54-37 104East of Mayo (Scottsdale 101/Triangle Bell) 39-41 102CCWRP Mayo Interceptor 43-33 206CCWRP Cave Creek Interceptor 43-33 201CCWRP Treated Effluent (Reservoir) 43-33JW Marriott Resort supply water 43-40 2JW Marriott Resort Softener effluent 43-40 216Tatum Ranch Well W
Table 3.1 Sample Location Designations
3.1.1 Commercial Sampling Sites 3.1.1.1 J.W. Marriott Desert Ridge Resort & Spa The JW Marriott Desert Ridge Resort & Spa is a 950-room mega-resort situated on 316 acres with two 18-hole golf courses and 4 acres of pools and ten restaurants. Occupancy rates are a fairly consistent 90% summer and winter. As an up-scale resort with all the amenities mentioned, the quality of water is highly important for maintaining the landscaping, the fixtures in guest rooms, shower facilities in the guest rooms and spa, kitchen facilities for the restaurants as well as for turf irrigation. The dramatic difference in water use summer to winter tells the story of how much water is evaporated from the cooling towers and pools and how much additional water the vegetation demands in the summer. Both periods represent similarly high occupancy rates for the resort. The director of engineering provided the details in Table 3.2.
Period of Use Irrigation Cooling towers, pools, guest and kitchen
facilities7/17-8/13/04 6,830,900 9,827,000
1/1-2/1/04 2,000,000 752,800
Table 3.2 J.W. Marriott Water Use (gallons)
Figure 3.1 J.W. Marriott Resort
Figure 3.1 J.W. Marriott Resort

CASS / CCWRP SAMPLING PLAN
February 24, 2006 C-17
All water on the site is softened and then blended back to achieve 4 grains of hardness. The custom softener system consists of three 50 cubic foot vessels, each of which is capable of providing 1.5 million grains of softening. Two are on-line at all times with the third on stand-
by. Regeneration
of each vessel is set at 45,000 gallons treated. All three discharge into one sump which allowed for easy sampling and analysis of the conductivity of a typical regeneration cycle. Figure 3.2 shows the three large softener resin containers and the 700 gallon brine tank that serves all three. A complete 82-minute regeneration cycle was observed and sampled. The backwash (brine draw), slow rinse and fast rinse
generated approximately 2000 gallons and used nearly 700 gallons of concentrated brine. The Marriott purchases sodium chloride salt from Salt Works for $.08125 per pound and the resort consumed 518,501 pounds from Sept. 2003 to Sept. 2004. A portion of that salt was used in the cooling towers in 2003 during a trial to determine if the economics favored use of salt to increase cycles of concentration to 5.0. The salt use was discontinued because the cost was not justified by water and chemical savings.
3.1.1.2 American Express The American Express operates a data center at the facility selected for this sampling. The campus currently has 2 office buildings with three floors each comprising 360,000 sq. ft and serving 2500 people. The site was originally planned to have six buildings in order to centralize American Express operations in Arizona. After the terrorist attack on September 11th, those plans were changed and at this time, no further expansions are planned. The site uses water from the Union Hills WTP, and also has two wells on-site as a backup supply. OB1, the east building only has bathrooms for water use and sewer discharge. OB2, the west building, houses the data center, central cooling plant with two, 1000-ton cooling towers, and a cafeteria. The cooling towers are operated at 3.1 cycles, and staff reports water quality issues resulting from rapid changes in source water. The cafeteria has a commercial water softener that is regenerated on-site using approximately 4500 pounds of salt per year. No accurate flow data could be obtained from this site. 3.1.1.3 Mayo Hospital Figure 3.4
Mayo HospitalFigure 3.4
Mayo Hospital
Figure 3.2 CommercialWater SoftenerWater SoftenerWater SoftenerWater Softener
Figure 3.2 CommercialWater SoftenerWater SoftenerWater SoftenerWater Softener
Figure 3.3 American ExpressFigure 3.3 American Express

CASS / CCWRP SAMPLING PLAN
February 24, 2006 C-18
The Mayo Hospital campus is currently expanding. An additional building, a specialty treatment center, is being erected adjacent to the central plant (Figure 3.4). Hospitals are regulated dischargers to the sewer system. All testing of the wastewater was done at the sampling vault. During the time of the testing, a large flow of black solids was found in the vault, which might be coming from the on-site water treatment system – carbon solids are used to remove chlorine before water is treated in a reverse-osmosis system. Hospital central plants have cooling towers, large commercial softening systems, reverse osmosis and deionization systems. Water used for boiler feed, steam sterilization and other instrument cleaning needs to be of a very high purity. Mayo Hospital is related to the Mayo Clinic located on 136th Street and Shea in Scottsdale, which is a smaller facility. The two-resin bed softener system is run in series and regenerates two to three times per week or every 200,000 gallons. The fast rinse rate is 365 gpm according to the facilities person who started up and ran the system before being transferred to Mayo Clinic. He estimated that 1400 pounds of salt were used per regeneration and that 26-50% of the salinity is in the first part of the cycle; namely the backwash. Additional softeners polish boiler feedwater. These regenerate every 35,000 gallons or once every six months. Flows from American Express and Mayo Hospital are currently diverted to 91st. Avenue due to repairs at LS-51. 3.1.1.4 Desert Ridge Marketplace Desert Ridge Marketplace is one of the largest outdoor retail developments in the north Phoenix area, located just north of the 101 on Tatum Boulevard. It has 1.15 million sq. feet of retail, restaurants and entertainment. Thirty restaurants range in size from a coffee shop, Starbucks to a large dining and bar operation like Bahama Breeze. Nearly every restaurant uses softeners. Each tenant building (except Albertson’s grocery store) and the shared buildings have packaged roof-top air conditioning systems so no cooling towers are present on this site. This is in contrast to the large enclosed malls, which use cooling towers to achieve higher efficiency cooling and lower operating costs. No flow data was obtained from this site after extensive site investigation to find the manholes. Fourteen of the 30 restaurants on site were interviewed to determine softener use and obtain estimates of salt use. Those restaurants that have a large bar business use the most salt, ranging from 10,400 to 15,600 pounds per year. The smaller restaurants or ones that primarily serve meals use less salt – about 2400 pounds per year. Even Starbucks uses a small softener to keep the steam systems from corroding. The 61,583 pounds of annual
Figure 3.5 Desert Ridge MarketplaceFigure 3.5 Desert Ridge Marketplace

CASS / CCWRP SAMPLING PLAN
February 24, 2006 C-19
salt use for the 14 restaurants represents a sizeable load into the CCWRP. Each restaurant manager / owner was encouraged by the City’s interest in the water quality issues faced by water users and the overall water supply and reuse issue. 3.1.1.5 Developments East of Mayo Hospital The area east of Mayo Hospital to Scottsdale Road and bordered on the north by the 101 Freeway and on the south by the CAP canal is zoned for primarily commercial development, with some residential. Currently there are several retail developments with another very large one planned that will be larger than Desert Ridge Marketplace. Currently all of the wastewater flow from this area is diverted to the 91st Avenue WWTP because Lift Station 51 is not operating. The salinity from these sites and the developments in the area will have a direct impact on the CCWRP. Scottsdale/101 is a retail development just south of the 101 freeway, and was under construction during this study. It contains 600,000 sq. feet of space with several very large box retailers and about 10 restaurants. More pads are evident that may add restaurants and therefore increase the salinity discharge from this site. It is estimated based upon the size of the restaurants that approximately 26,000 pounds per year of salt will be contributed to CCWPR when LS51 is repaired. Further south on Scottsdale Road, across from the Scottsdale Princess Resort is a large auto mall with large dealerships for Porche, BMW, Audi, Land Rover, Jaguar, Volvo, Acura, Lincoln and VW which are all part of United Auto Group. A Danny’s Car Wash is located behind this group of dealerships that will likely have a softener for rinsing vehicles. An apartment complex – Desert Club – is located on the western end of this plot of land with nearly 500 units, pool and spa. According to the manager, no softeners are used on site. No cooling towers were evident on any of the structures.
Triangle Bell is a small, tightly packed development is on a county island bordered by Bell Road, Scottsdale Road and the CAP canal. Two restaurants, two Marriott hotels and a luxury apartment complex dominate this development with a few small retail shops. The restaurants and the hotels contribute approximately 89,000 pounds of salt on an annualized basis. 3.1.2 Residential Sampling Sites 3.1.2.1 Residential A Residential A is an area behind the JW Marriott Resort. It consists of 503 accounts and the homes were built in mid-1990’s (1995-1997).
Figure 3.6 Residential Sampling LocationFigure 3.6 Residential Sampling Location

CASS / CCWRP SAMPLING PLAN
February 24, 2006 C-20
3.1.2.2 Residential B Residential B is an area immediately south of Carefree Highway and west of Cave Creek Road, on the western edge of development in that region. It consists of 1015 accounts and the homes were built in the early 2000’s (1999-2003). 3.1.2.3 Residential C Residential C is an area that bridges Cave Creek Road between 40th and 51st Streets. The 865 houses were built in the early 1990’s (1989-1992) with some small pockets of home built in 1994 and 1996. 3.2 Sampling Plan The sampling plan consisted of a combination of on-line monitoring and laboratory analysis. On-line monitoring was conducted for a period one week at each site. Composite samples were collected in conjunction with on-line monitoring. The COP’s water quality laboratory provided all analytical services for this project. COP also rented the continuous conductivity and flow measurement devices (Troll 9000 from Insitu Inc.) for the sampling events. Two units were rented, so two sites were tested at any one time. COP personnel assisted with identifying locations for the sampling event. Table 3.1 identifies the sampling points for each site selected for this sampling effort. Staff identified manholes that would segregate the target contributor from other flows. In some cases, alternative manholes were needed due to problems with access (gated residential communities; manholes buried under 18 inches of parking lot fill and asphalt; multi-sewer connections in one place, etc.) In some cases, flow data could not be collected due to a.) depth of the manhole exceeded the cable length; b) excessive debris; or c.) inability to shield or set the probe for reliable data collection. The Union Hills WTP provided the annual water quality data that was used to document background TDS coming from the source water. To verify the source water salinity as measured by both TDS and conductivity, several sites were tested, namely: J.W. Marriott Desert Resort & Spa, Union Hills WTP, Tatum Ranch well #285. Wells were not active during the days of testing. COP also provided salt use data for its on-site chlorine generators. Pinnacle High School was not sampled. Maintenance staff indicates that water softeners are not utilized. City personnel supplied water meter reading data to assist in determining the impact of specific commercial / industrial sites; namely, Pinnacle High School, American Express and Mayo Hospital.
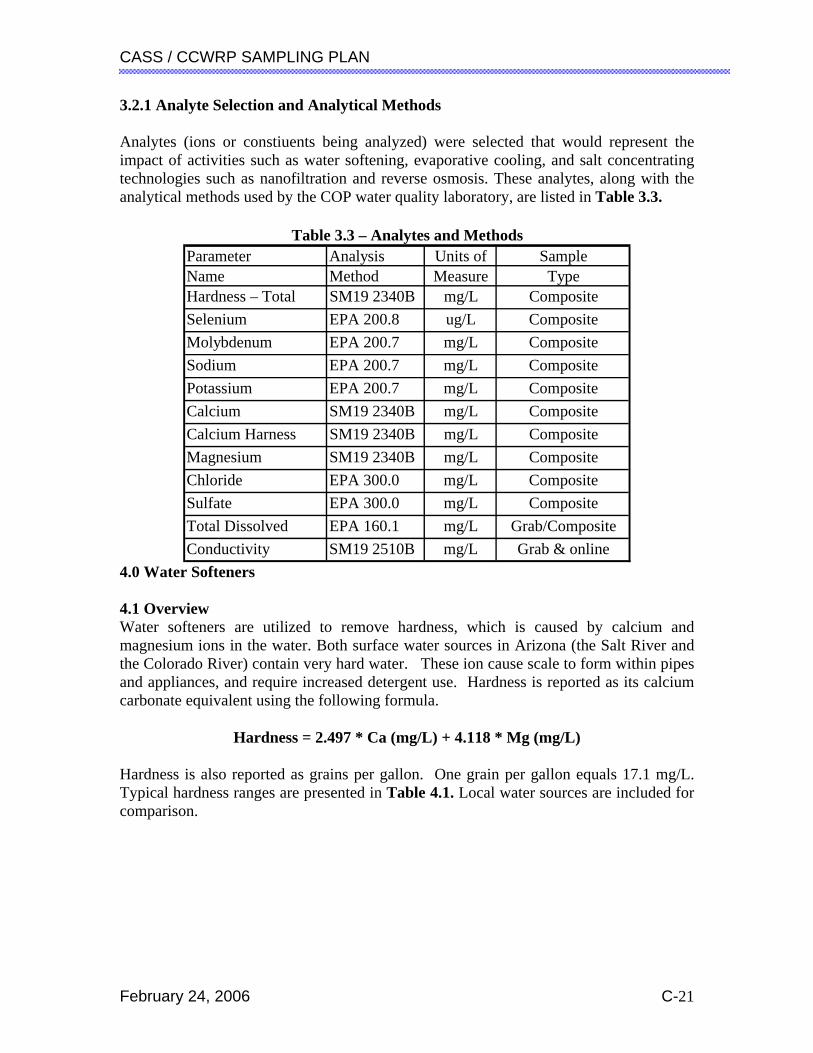
CASS / CCWRP SAMPLING PLAN
February 24, 2006 C-21
3.2.1 Analyte Selection and Analytical Methods Analytes (ions or constiuents being analyzed) were selected that would represent the impact of activities such as water softening, evaporative cooling, and salt concentrating technologies such as nanofiltration and reverse osmosis. These analytes, along with the analytical methods used by the COP water quality laboratory, are listed in Table 3.3.
Parameter Analysis Units of SampleName Method Measure TypeHardness – Total SM19 2340B mg/L CompositeSelenium EPA 200.8 ug/L CompositeMolybdenum EPA 200.7 mg/L CompositeSodium EPA 200.7 mg/L CompositePotassium EPA 200.7 mg/L CompositeCalcium SM19 2340B mg/L CompositeCalcium Harness SM19 2340B mg/L CompositeMagnesium SM19 2340B mg/L CompositeChloride EPA 300.0 mg/L CompositeSulfate EPA 300.0 mg/L CompositeTotal Dissolved EPA 160.1 mg/L Grab/CompositeConductivity SM19 2510B mg/L Grab & online
Table 3.3 – Analytes and Methods
4.0 Water Softeners 4.1 Overview Water softeners are utilized to remove hardness, which is caused by calcium and magnesium ions in the water. Both surface water sources in Arizona (the Salt River and the Colorado River) contain very hard water. These ion cause scale to form within pipes and appliances, and require increased detergent use. Hardness is reported as its calcium carbonate equivalent using the following formula.
Hardness = 2.497 * Ca (mg/L) + 4.118 * Mg (mg/L)
Hardness is also reported as grains per gallon. One grain per gallon equals 17.1 mg/L. Typical hardness ranges are presented in Table 4.1. Local water sources are included for comparison.
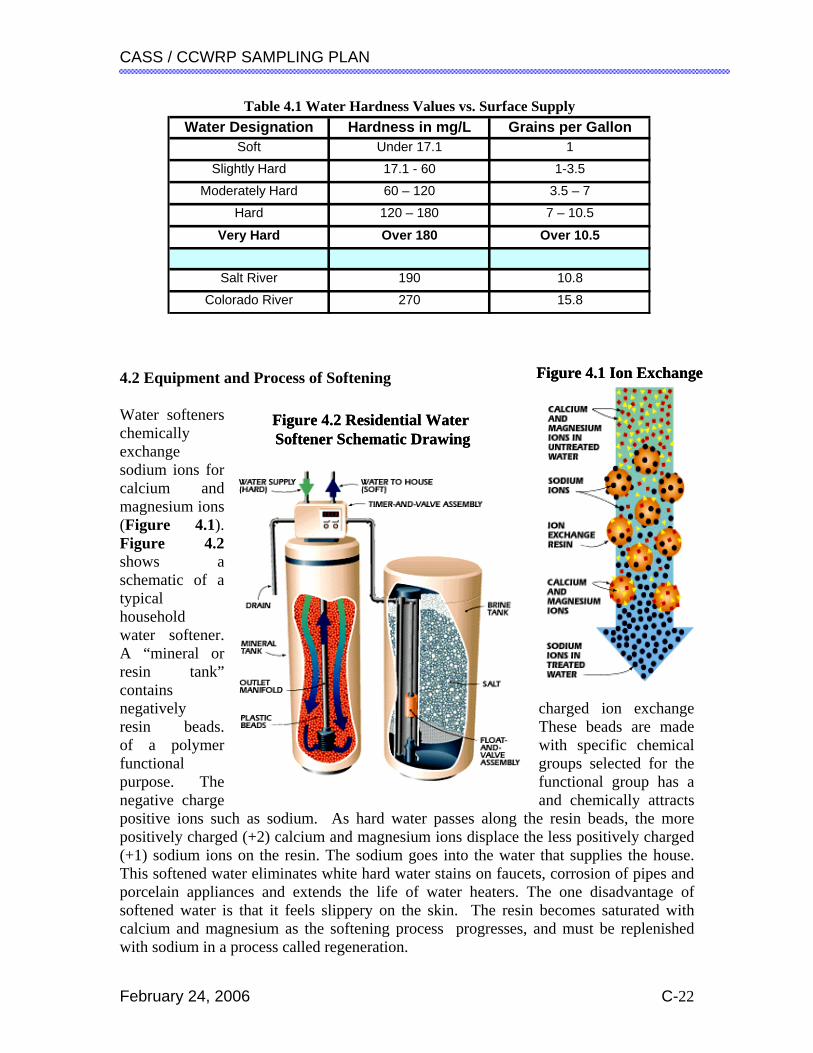
CASS / CCWRP SAMPLING PLAN
February 24, 2006 C-22
Figure 4.1 Ion ExchangeFigure 4.1 Ion Exchange
Water Designation Hardness in mg/L Grains per GallonSoft Under 17.1 1
Slightly Hard 17.1 - 60 1-3.5
Moderately Hard 60 – 120 3.5 – 7
Hard 120 – 180 7 – 10.5
Very Hard Over 180 Over 10.5
Salt River 190 10.8
Colorado River 270 15.8
Table 4.1 Water Hardness Values vs. Surface Supply
4.2 Equipment and Process of Softening
Water softeners chemically exchange sodium ions for calcium and magnesium ions (Figure 4.1). Figure 4.2 shows a schematic of a typical household water softener. A “mineral or resin tank” contains negatively charged ion exchange resin beads. These beads are made of a polymer with specific chemical functional groups selected for the purpose. The functional group has a negative charge and chemically attracts positive ions such as sodium. As hard water passes along the resin beads, the more positively charged (+2) calcium and magnesium ions displace the less positively charged (+1) sodium ions on the resin. The sodium goes into the water that supplies the house. This softened water eliminates white hard water stains on faucets, corrosion of pipes and porcelain appliances and extends the life of water heaters. The one disadvantage of softened water is that it feels slippery on the skin. The resin becomes saturated with calcium and magnesium as the softening process progresses, and must be replenished with sodium in a process called regeneration.
Figure 4.2 Residential Water Softener Schematic DrawingFigure 4.2 Residential Water Softener Schematic Drawing

CASS / CCWRP SAMPLING PLAN
February 24, 2006 C-23
Next to the mineral or resin tank is a brine tank. The brine tank holds salt (sodium chloride) pellets and about 3 gallons of water, resulting in a saturated brine solution. A meter, at the top of the resin tank, regulates the regeneration cycle. At that time, the brine solution is pulled into and flushes the resin tank, forcing the calcium and magnesium ions off the resin bead and replacing them with sodium. Most houses have softeners that operate simply on a timer, and are set to regenerate at some period during each day. The more expensive water softeners are based upon actual flow. The timer and valve assembly is set based upon the hardness value for the water in grains per gallon. Many homes do not use the most efficient settings and are therefore using more salt than necessary to soften their water supply. During the regeneration cycle, the calcium and magnesium, along with the saturated brine, are flushed down the drain to the sewer. Timer-based softener systems are not typically set to the most efficient regeneration cycles, therefore the amount of calcium, magnesium, sodium and chloride going to the sewer is higher than necessary. 4.3 Residential Softeners There are a wide range of residential water softeners on the market today. A typical 2-3 person household water softener contains 1 cubic foot of resin and has a rated capacity of up to 30,000 grains of hardness. It will process about 1000 gallons of Phoenix-area water (17 grains hardness) before needing to regenerate. Each 100-minute regeneration cycle discharges approximately 30 gallons of brine and uses 9-10 pounds of sodium chloride. This results in a discharge of up to 35,000 mg/L NaCl to the wastewater collection system. Both the BOR softener study, and the Water Quality Association (WQA) confirmed that approximately 40 pounds of salt is used each month in a residential water softener. 4.4 Commercial Softeners Since commercial systems vary so widely, there is no “typical” size or regeneration frequency. Data gathered from restaurants, the resort and the hospital indicate that these systems are managed based upon an assumed hardness of the supply water and computer-controlled regeneration is based upon the total number of gallons processed. For the JW Marriott Resort, an 86-minute cycle generated 1840 gallons of waste and a peak conductivity of 84,200 mS/cm. This system regenerates one of three large resin tanks every 45,000 gallons. By contrast, the system at the Mayo Hospital regenerates every 200,000 gallons. Figure 4.3 shows the percent contribution by the commercial sites to the 826,084 pounds of annual softener salt use. The sites in red are those that would normally go to Lift Station 51 and enter the Mayo Interceptor to CCWRP. A total of 600,000 gallons is currently being by-passed to the 91st Avenue WWTP until repairs to LS51 are completed.

CASS / CCWRP SAMPLING PLAN
February 24, 2006 C-24
Figure 4.3 - Commercial Softener Salt Contributors to CCWRP – Mayo Interceptor
Commercial Softener Salt Contributors
JW Marriott Resort62%
Triangle Bell11%
Mayo Hospital7%
Scottsdale / 1013%American Express
1%Desert Ridge Marketplace
16%
Locations in RED currently by-passing LS51 to 91st. Avenue
4.5 Potassium vs. Sodium Chloride Salt for Regeneration Either potassium or sodium chloride can be used to regenerate ion exchange resins. The primary difference between the two is cost, and the behavior of the two salts in the brine tank. Sodium salt is by the far the most common salt used because the largest and local Central Arizona supplier – Morton Salt – promotes this as the least expensive and most convenient. On occasion, the local newspaper will have a $1.00 Off coupon for two or three bags. Salt is typically purchased by home owners at Home Depot or Costco for $4.00 per 50-pound bag.
Excessive amounts of sodium are known to cause problems when irrigating turf. Soils with high clay content (common in the desert southwest) breakdown in the presence of excess sodium, impeding good drainage. Potassium does not cause this problem, and in fact, is a plant nutrient. A literature and internet search revealed much discussion and many papers given at various symposia which tout the benefits of potassium chloride over sodium chloride. In one case, a Canadian golf course was cited as benefiting from the potassium salt. The following classification is used by the U.S. Department of Agriculture to indicate the degree of hazard of saline soils to food crops. It is based on conductivity and salinity hazard. (Conductivity can be converted to approximate mg/L dissolved solids).
CASS / CCWRP SAMPLING PLAN
February 24, 2006 C-25
USDA Salinity hazard ratings: Low: 70 - 175 mg/l Medium: 176 - 525 mg/l High: 526 - 1,575 mg/l Very high: more than 1,575 mg/l A number of studies, including a 1992 Transportation Research Board Special Report about deicing salt, confirm that the environmental effects of elevated chloride levels are highly site specific. Other factors that affect the degree of salinity hazard are: soil texture, soil permeability, drainage, quantity of water applied and the salt tolerance of the vegetation. There are several reasons why potassium has not been widely applied to residential or commercial softening systems. They are: A. Potassium chloride is not as prevalent in as sodium chloride. Sodium chloride
occurs naturally in many parts of the world. In fact, sodium chloride is mined in the western portions of the Phoenix Metropolitan Area.
B. There is only one commercial source of potassium chloride and one mine located in Canada. This results in a doubling of the price per pound. The Home Depot price of $6.97 for 40 pounds or $0.174/ pound vs. $0.08/pound for sodium chloride.
C. Potassium chloride bridges in the brine tank. If the tank is not flushed frequently, the resulting cake cannot be broken up and requires the replacement of the brine tank. There are systems on the market that use potassium, and have engineering solutions to the bridging issue.
D. The EPA has identified a higher toxicity for potassium chloride, while various independent consultants have proposed improved health benefits from drinking water containing potassium over sodium.
E. Potassium chloride as a substitute may lower the chloride levels but the total dissolved solids issue is remains unaddressed
4.6 Non-Salt Regeneration (Demineralization) Jay Miers, Manager of Business Development for Rohm & Hass, a supplier of ion exchange resins, provided the following information regarding non-salt regeneration of ion exchange for partial water softening. This method of softening has been used in Europe and may or may not prove to be economical here due to limitations on such systems. Dave Perry, Executive Director of the Arizona Water Quality Association provided insight into these limitations and identified this process as demineralization, not true softening.
Normal water softening ion exchange resin is called “strong acid”, which means that all the divalent – calcium and magnesium – ions will be removed and replaced with sodium ions. The calcium and magnesium that accumulate on the resin are washed off the resin

CASS / CCWRP SAMPLING PLAN
February 24, 2006 C-26
with an excess of sodium ions in the brine. In this way, all of the calcium and magnesium are washed off as well as the excess sodium and the chloride. All of these salts are in the backwash that goes to sewer. Only a portion of the sodium ions remain on the resin to soften the next volume of hard water. By contrast, when a “weak acid” ion exchange resin is used, only the hardness associated with alkalinity will be removed. That is the portion that causes scale on heat transfer surfaces. For local supply water, only 125-130 mg/L of alkalinity as calcium carbonate would be removed out of a total hardness of 295-310 mg/L, reducing overall hardness by less than half. If this reduction is sufficient for a given application, then this method may have some merit for commercial accounts or for centralized exchange bottle regeneration. Instead of regenerating the resin with a brine solution, this method uses an acid, such as hydrochloric (muriatic) acid. This means that hydrogen ions are being used to replace the calcium ions. Weak Acid Cation (WAC) method has had limited use in this country. The following are advantages and disadvantages of WAC method of demineralization compared to true softening. Advantages include:
1. Smaller more efficient system size. A single, 50-cubic foot resin container can treat approximately 240,000 gallons per regeneration cycle.
2. Smaller waste volume. The above 50 cubic-foot container would generate 1.25 pounds of calcium chloride per 1000 gallons treated.
3. Lower salinity to the sewer. For a normal softener, each mg/L of hardness removed puts 2.20 mg/L TDS in the waste brine to the sewer. For WAC, an actual reduction (>50%) in TDS often is achieved. This is because hydrogen is substituted for the hardness ion.
Disadvantages include:
1. Need to degas or remove the carbon dioxide from the waste brine so that it can be discharged to the sewer at the proper pH.
2. Safety concerns due to handling of acid and a potential need to scrub the air to remove fumes that can occur when hydrochloric acid meets moisture in the air.
3. Cost for regeneration with acid may be higher than for sodium chloride. Additional investigation needs to be done to determine if this process should be tested as part of an overall salt mitigation strategy. 5.0 RESULTS AND DISCUSSIONS 5.1 Introduction

CASS / CCWRP SAMPLING PLAN
February 24, 2006 C-27
As the project developed, it was expanded from creating a sampling plan to performing an analysis of the data in an effort to project the impact of increasing salinity on the CCWRP, and its product. The results of that data analysis follow. 5.1.1 Data Sources and Quality Data from a variety of sources was utilized for this analysis. These include: • On-line flow and conductivity measurements, • Data and information provided by other municipalities and the resort selected for this
project, • Analysis performed by the COP’s water quality laboratory, • COP residential water billing data for 2003, • AWWARF 2274 (DRAFT), • BOR Water Softener Study (Survey of Water Softener Penetration into the
Residential Market in the Phoenix Metropolitan Area, Nov. 2004), and • The Basis of Design Report for the CCWRP (Final Design Information
Memorandum). No quality control issues were reported for the samples analyzed in the City’s water quality laboratory. These data are presented in Table 5.1, and are the basis for a significant portion of this analysis.
Table 5.1 SUMMARY TABLE OF WATER COMPONENT DATA for SAMPLING SITES
Total Calcium TOTALLocation description source of salinity Hardness Hardness Hardness Calcium Sodium Magnesium Potassium Molybdenum Selenium Chloride Sulfate
QuartSection / ManHole mg/L mg/L grains/gal mg/L mg/L mg/L mg/L mg/L ug/L mg/L mg/LSUPPLY WATER
CAP supply water rocks 70.8 93.45 29.25 4.91 <.010 <4.0 89.5 254.44
Union Hills supply water rocks 299 17.49 79 94 27 86
site supply water Desert Mariott rocks + chlorination
well Tatum Ranch #l295 rocks + chlorination
SITE EFFLUENT - to Mayo Interceptor42-39 MH 302 Desert Mariott resort softener 315 165 42.05 66.2 516 36.4 26.2 <.025 <5.0 673 228
41-39 MH 224 Desert Ridge restaurant softeners 719 407 19.06 163 340 75.7 28.4 <.025 <5.0 464 202
43-39 MH 407 Res. A-Desert Ridge washing, food, softeners 326 190 19.06 76 261 33.1 28.6 0.006 <2.0 368 192
SITE EFFLUENT - to Cave Creek Interceptor56-37 MH 213 Res B -Dove Valley washing, food, softeners 571 347 33.39 139 445 54.3 54.3 <.020 2.2 737 266
54-37 MH 104 Res C-Tatum washing, food, softeners 444 265 25.96 106 276 43.5 33 0.014 2 419 269
SITE EFFLUENT -to LS51 diverted to 91st Avenue39-40 MH 401 AmExp West office cafeteria, CT's 626 330 36.61 132 318 71.9 30.3 0.609 <5.0 269 594
39-40 MH 402 AmExp East office 449 327 26.26 131 216 29.7 25.5 0.024 <4.0 193 280
39-41 MH vault Mayo Hospital sofener, CT's, RO 199 117 11.64 46.8 297 20 21.9 0.755 2.6 164 356
39-41 MH 102 East of Mayo restaurant softeners 454 312 26.55 125 200 34.4 20.7 <.025 <5.0 616 218
CAVE CREEK INFLUENT43-33 210 Cave Creek Int. N supply + sites 387 229 22.63 91.8 277 38.2 36.7 <.010 <5.0 395 233
43-33 206 Mayo Int. E supply + sites 379 230 22.16 92.3 317 36 36.8 <.010 <5.0 446 260
CAVE CREEK EFFLUENTCCWRP product water supply + sites + treat 330 192 19.30 76.9 281 33.4 35.2 0.011 <2.0 368 252
Difference UH Supply vs. CCWRP Effluent 187 282% Increase 236.7% 327.9%
Cations / Metals Anions
On-line monitoring at the manholes proved challenging. The primary issue was loss of flow to the conductivity sensors, which resulted in the probes “zeroing out” during low flows at most of the sampling locations. For the purposes of this analysis, conductivities below the potable water background of 1050 µS/cm were excluded from the statistical

CASS / CCWRP SAMPLING PLAN
February 24, 2006 C-28
analysis. There were also issues with flow data from Residential B; however COP has actual flow data for this area based off potable flow readings from each residence. All of the on-line data for each of the sampling locations is included as figures and tables in Appendix A. Data from the CCWRP Final Design Information Memorandum No. 1 was reviewed as part of this project. Hydraulic design assumed 86 gpcd of wastewater, and 3.2 persons per household. It also assumed a CAP water TDS of 750 mg/l, a residential TDS contribution of 250 mg/L and a commercial TDS contribution of 350 mg/L. 5.2 CCWRP TDS vs. TDS at Other WRPs TDS changes within the CCWRP were first compared to changes within other sewersheds in the SRV in an effort to better gauge how TDS values observed in this area compared to other communities. The Scottsdale Water Campus and Gilbert WRP were chosen for this comparison. The Scottsdale facility is adjacent to the CCWRP service area, has experienced significant growth over the last decade, and utilizes CAP water exclusively to meet the potable water demands in this area for significant portions of the year. The Gilbert WRF is located in the southeast valley, utilizes a mix of Salt River Project (SRP) water and groundwater, and is beginning its growth phase. Average potable water TDS for the Gilbert, Scottsdale and Phoenix facilities were 699 mg/L, 624 mg/L and 650 mg/L respectively. Figure 5.1 shows the increase in TDS between potable supply and reclaimed water for the three facilities. These data indicate that of the three communities examined, the CCWRP experiences the greatest increases in TDS between its potable water and its reclaimed water. Figure 5.2 shows that a major portion of the increase in TDS at all three facilities is due to the addition of sodium and chloride. Calcium at both the Scottsdale facility and CCWRP remain relatively unchanged, suggesting that concentration technologies (i.e, evaporative cooling and membrane systems) are not significant contributors to the overall rise in TDS in either sewershed. Calcium data from Gilbert was not available.

CASS / CCWRP SAMPLING PLAN
February 24, 2006 C-29
Figure 5.1 - WRP TDS - Increase over Supply
0%
10%
20%
30%
40%
50%
60%
70%
80%
90%
Gilbert Scottsdale CCWRP
Ca Na Cl
Gilbert
Scottsdale
CCWRP
0%
50%
100%
150%
200%
250%
300%
350%
Figure 5.2 - WRP Salinity - Selected Ion Changes

CASS / CCWRP SAMPLING PLAN
February 24, 2006 C-30
5.3 Conductivity and TDS Results 5.3.1 Conductivity vs. TDS The relationship between conductivity and TDS is a function of the electrical charge on the ions that make up the TDS. This is especially true in wastewater, where overall TDS can be significantly impacted by organic compounds, which tend to carry a weak electrical charge. Conductivity was used to monitor and record presumed changes in TDS at the WRP and the remote sampling sites selected as part of this project. Conductivity and TDS were determined for each of the samples collected during this study. These data are presented in Figure 5.3. Overall, there appears to be a distinct difference in conductivity between waters influenced by softeners and those that are not. Both the mall and the hospital are known large users of softeners, but grab sampling did not catch these events. More work would need to be done in this area before a definitive relationship could be established; however, it should be noted that sodium chloride does have a higher specific conductance (conductivity) than other minerals. Given the significant increase in both sodium and chloride between potable supplies and the wastewater in this area, it is not unreasonable to attribute the differences in these relationships to changes to NaCl concentration.
Figure 5.3 - TDS vs. Conductivity
0
500
1000
1500
2000
2500
0 500 1000 1500 2000 2500Conductivity in µS/cm
TD
S in
mg/
L
Supply WaterCAP and Wells
Mall
Office,Hospital
Softener-Influnced WastewaterTDS = .837 x conductivity
Supply Water, Light CommercialTDS = .608 x conductivity
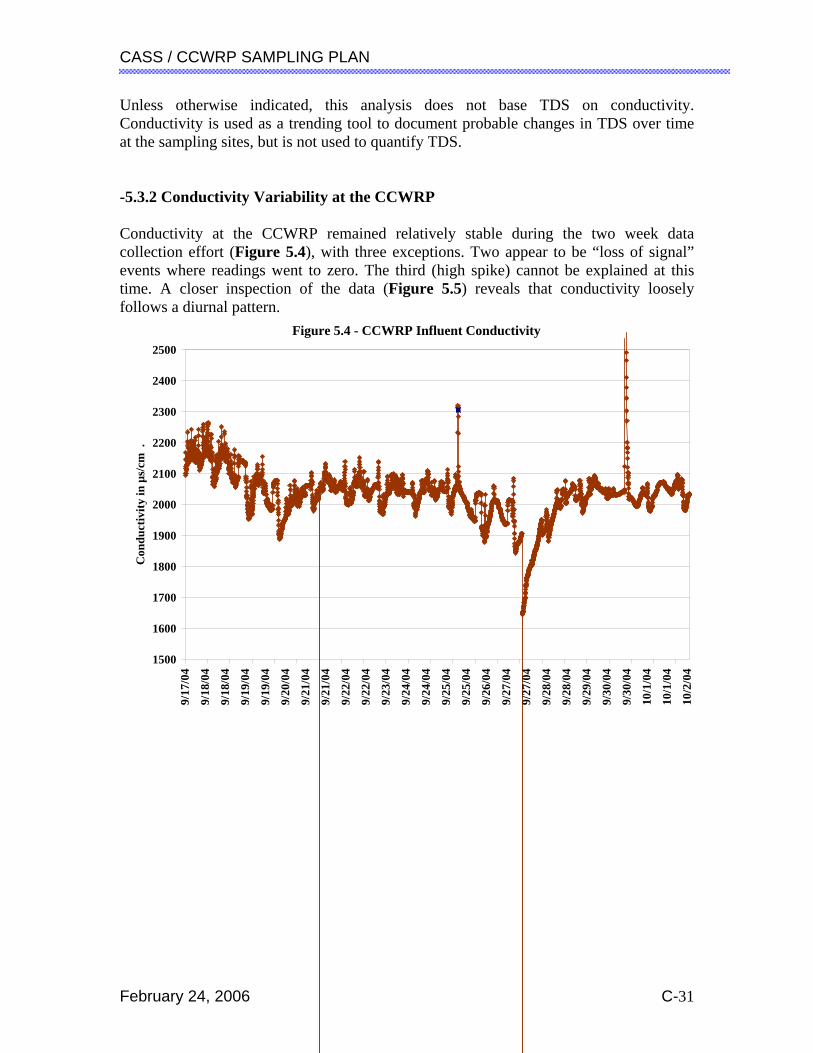
CASS / CCWRP SAMPLING PLAN
February 24, 2006 C-31
Unless otherwise indicated, this analysis does not base TDS on conductivity. Conductivity is used as a trending tool to document probable changes in TDS over time at the sampling sites, but is not used to quantify TDS. -5.3.2 Conductivity Variability at the CCWRP Conductivity at the CCWRP remained relatively stable during the two week data collection effort (Figure 5.4), with three exceptions. Two appear to be “loss of signal” events where readings went to zero. The third (high spike) cannot be explained at this time. A closer inspection of the data (Figure 5.5) reveals that conductivity loosely follows a diurnal pattern.
Figure 5.4 - CCWRP Influent Conductivity
1500
1600
1700
1800
1900
2000
2100
2200
2300
2400
2500
9/17
/04
9/18
/04
9/18
/04
9/19
/04
9/19
/04
9/20
/04
9/21
/04
9/21
/04
9/22
/04
9/22
/04
9/23
/04
9/24
/04
9/24
/04
9/25
/04
9/25
/04
9/26
/04
9/27
/04
9/27
/04
9/28
/04
9/28
/04
9/29
/04
9/30
/04
9/30
/04
10/1
/04
10/1
/04
10/2
/04
Con
duct
ivity
in µ
s/cm
.

CASS / CCWRP SAMPLING PLAN
February 24, 2006 C-32
Figure 5.5 - CCWRP Influent Conductivity (Detail)
1900
1950
2000
2050
2100
2150
2200
2250
2300
9/18
/04
0:00
9/18
/04
1:55
9/18
/04
3:50
9/18
/04
5:45
9/18
/04
7:40
9/18
/04
9:35
9/18
/04
11:3
0
9/18
/04
13:2
5
9/18
/04
15:2
0
9/18
/04
17:1
5
9/18
/04
19:1
0
9/18
/04
21:0
5
9/18
/04
23:0
0
9/19
/04
0:55
9/19
/04
2:50
9/19
/04
4:45
9/19
/04
6:40
9/19
/04
8:35
9/19
/04
10:3
0
9/19
/04
12:2
5
9/19
/04
14:2
0
9/19
/04
16:1
5
9/19
/04
18:1
0
9/19
/04
20:0
5
9/19
/04
22:0
0
9/19
/04
23:5
5
Con
duct
ivity
in µ
s/cm
.
5.3.3 Conductivity and TDS within the Sewershed Conductivity within the sewershed was highly variable (Table 5.2), due primarily to the influence of water softeners. This variability is particularly evident in the data colleted from the J.W. Marriott Resort, but can also be seen in the Residential A data. Residential B showed the most stability; however, there were multiple sampling difficulties at this site, and the overall amount of electronic data is limited.
AverageMedian of all peaks Peak
Residential C 1716 3765 5870Residential A 2054 5564 10317Residential B 1495 1593 6555
Marriott Resort 4091 45627 119386Desert Ridge 1770 4033 5172
Mayo Interceptor 2420 6814 10250CC Interceptor 1738 2030 7683
CCWRP 2031 2217 2791
Table 5.2 - Summary of Conductivity Data

CASS / CCWRP SAMPLING PLAN
February 24, 2006 C-33
In general, conductivity stabilized as wastewater moved from the point of discharge through the system. Conductivity swings were wider in the interceptor serving the commercial area than they were in the interceptor serving the residential area. Overall, conductivity had stabilized by the time wastewater entered the WRP. This would suggest that diverting flows to the 91st Ave. WRP during high conductivity events may not be effective. However, diverting flows from large point-source contributors could be practical under the right conditions. Further, if a large salt discharger were to locate near the CCWRP, its impact could be significant, and diversion strategies may be practical. TDS analyses were performed on composite samples collected from each of the sampling sites, and are presented in Table 5.3. Figure 5.6 provides a flow diagram of TDS throughout the sewershed during the sampling event.
Location description TDS ChangeUnion Hills WTP supply water 653
42-39 MH 302 Desert Mariott 1790 274%41-39 MH 224 Desert Ridge 1520 233%43-39 MH 407 residential A 1150 176%56-37 MH 213 residential B 2030 311%54-37 MH 104 residential C 1350 207%39-40 MH 401 AmExp Offices 1140 175%39-40 MH 402 AmExp Towers 1780 273%
39-41 MH vault Mayo Hospital 1160 178%39-41 MH 102 East of Mayo 1190 182%
43-33 210 Cave Creek Interceptor 1260 193%43-33 206 Mayo Interceptor 1380 211%CCWRP product water 1170 179%
Table 5.3 - Sewershed TDS
Residential B had the highest TDS (2030 mg/L) during this sampling event, with the second highest TDS at the J.W. Marriott Resort. All TDS values were significantly higher than the background value of 650 mg/L and sixty percent were more than twice the background level. This contrasts with the anticipated increase of 250 mg/L and 350 mg/L, for residential and commercial dischargers respectively, forecast in the Design Information Memorandum.
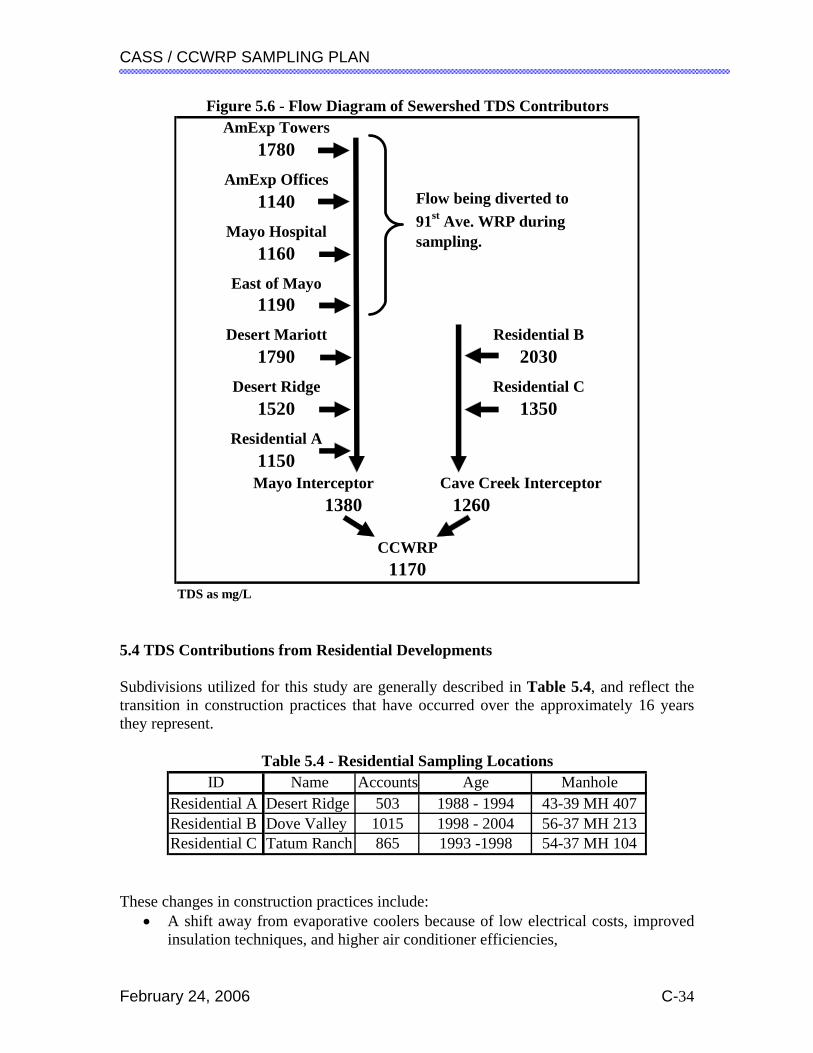
CASS / CCWRP SAMPLING PLAN
February 24, 2006 C-34
AmExp Towers1780
AmExp Offices1140
Mayo Hospital1160
East of Mayo1190
Desert Mariott Residential B1790 2030
Desert Ridge Residential C1520 1350
Residential A1150
Mayo Interceptor Cave Creek Interceptor1380 1260
CCWRP1170
TDS as mg/L
Figure 5.6 - Flow Diagram of Sewershed TDS Contributors
Flow being diverted to 91st Ave. WRP during sampling.
5.4 TDS Contributions from Residential Developments Subdivisions utilized for this study are generally described in Table 5.4, and reflect the transition in construction practices that have occurred over the approximately 16 years they represent.
ID Name Accounts Age ManholeResidential A Desert Ridge 503 1988 - 1994 43-39 MH 407Residential B Dove Valley 1015 1998 - 2004 56-37 MH 213Residential C Tatum Ranch 865 1993 -1998 54-37 MH 104
Table 5.4 - Residential Sampling Locations
These changes in construction practices include:
• A shift away from evaporative coolers because of low electrical costs, improved insulation techniques, and higher air conditioner efficiencies,

CASS / CCWRP SAMPLING PLAN
February 24, 2006 C-35
• More frequent inclusion of water softeners as part of a new home package, and • More water efficient plumbing.
The last two shifts in building practices have the most significant impact on salinity within the Phoenix Metropolitan Area because; taken together, they simultaneously add salt and reduce dilution volume. Figure 5.7 shows the residential TDS within the CCWRP watershed as a function of development age, and suggests that there is a significant increase in TDS concentration coming from newer homes.
Figure 5.7 - Average Wastewater TDS by Residential Development Age
y = 975.02e0.204x
R2 = 0.4846
0
500
1000
1500
2000
2500
3000
3500
Residential C(early '90s)
Residential A (mid '90s)
Residential B ('00 +)
Projected ('05) Projected ('10) Projected ('15)
mg/
L
5.4.1 Water Conservation and TDS Water conservation increases TDS concentrations in effluent from homes. The impact is even greater from those homes with water softeners, primarily due to the time-based operation of most water softeners on the market today. Under these conditions, the quantity of TDS remains constant, while water use, and therefore dilution, decreases over time. Table 5.5 is derived from actual billing data for homes that discharged into the CCWRP sewershed in 2003, grouped by the year they were first occupied (from 1990 through 2002). Flows from all houses for January through March were averaged to determine the flow on which sewer billing is based. These data show that from 1990 through 1999 sewer flows were somewhat lower (~20%) than the planning estimate of 86 gpcd, and

CASS / CCWRP SAMPLING PLAN
February 24, 2006 C-36
began to drop further in 2000. It is believed that this decreased flow is due to the installation of more efficient plumbing during the construction of these newer homes.
Year Occupied
JAN Flow
FEB Flow
MAR Flow
Average Potable
Flow
Sewer Flow
(75%)
GPCD Sewer Flows
Softener Based TDS
Increase1990 9055 8577 8155 8595 6447 67 7441991 8631 8286 7545 8154 6115 64 7841992 9281 8703 8618 8867 6651 69 7211993 9053 8624 8769 8815 6611 69 7251994 8371 8274 7891 8179 6134 64 7821995 8817 8376 7699 8297 6223 65 7711996 9108 8425 8001 8512 6384 66 7511997 9267 8453 8005 8575 6431 67 7461998 8772 7896 7684 8117 6088 63 7881999 9008 8119 7699 8275 6207 65 7732000 8340 7487 7055 7627 5720 60 8382001 7305 6898 6445 6883 5162 54 9292002 6907 6779 6849 6845 5134 53 934
8134 6101 64 786All Flows are average gallons per month per residence derived from COP billing dataSewer flow is assumed to be 75% of billing flowsTDS assumes one 40 lb. bag of salt per month added to sewer flow
2003 AVERAGE
Table 5.5 - 2003 Household Impact of Conservation on TDS by Year Occupied
The last column of data show the TDS impact of an average 2003 household with a softener based upon when it was initially occupied. For example, if a house was occupied in 2002, it contributes approximately 150 mg/L more TDS than one initially occupied in the 1990s. Based on these data, it is safe to assume that average gpcd sewer flows will continue to drop as newer homes begin to dominate the area. 5.4.2 Residential Water Softeners and TDS The major ions contributed by water softeners are potassium, sodium, and chloride. The concentrations for each of these ions, related to residential activity from sampling sites, are summarized in Table 5.7. While all show significant increases over background, there were questions regarding some of these data; namely, the data from the early 1990’s homes (Residential C) were higher than the mid-1990’s homes (Residential A). A review of the calcium (Ca) and magnesium (Mg) data showed similar patterns, and it was hypothesized that some degree of concentration was occurring. To test this, Ca and
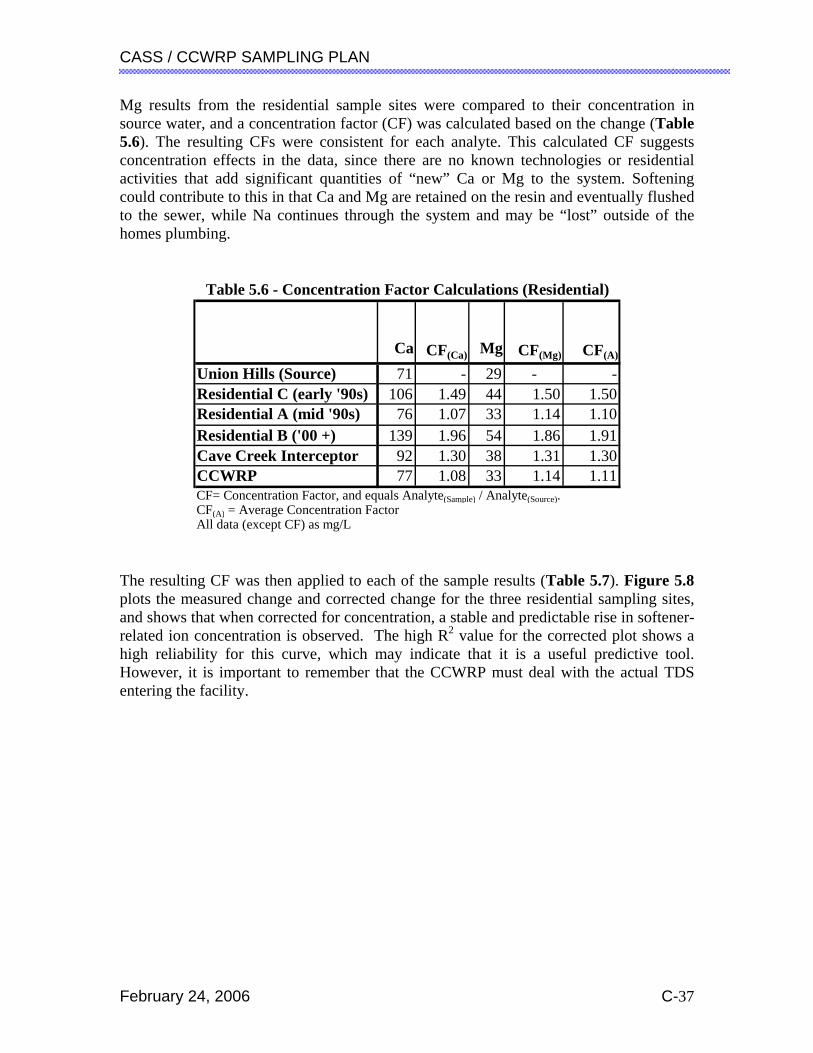
CASS / CCWRP SAMPLING PLAN
February 24, 2006 C-37
Mg results from the residential sample sites were compared to their concentration in source water, and a concentration factor (CF) was calculated based on the change (Table 5.6). The resulting CFs were consistent for each analyte. This calculated CF suggests concentration effects in the data, since there are no known technologies or residential activities that add significant quantities of “new” Ca or Mg to the system. Softening could contribute to this in that Ca and Mg are retained on the resin and eventually flushed to the sewer, while Na continues through the system and may be “lost” outside of the homes plumbing.
Ca CF(Ca) Mg CF(Mg) CF(A)
Union Hills (Source) 71 - 29 - -Residential C (early '90s) 106 1.49 44 1.50 1.50Residential A (mid '90s) 76 1.07 33 1.14 1.10Residential B ('00 +) 139 1.96 54 1.86 1.91Cave Creek Interceptor 92 1.30 38 1.31 1.30CCWRP 77 1.08 33 1.14 1.11CF= Concentration Factor, and equals Analyte(Sample) / Analyte(Source).CF(A) = Average Concentration FactorAll data (except CF) as mg/L
Table 5.6 - Concentration Factor Calculations (Residential)
The resulting CF was then applied to each of the sample results (Table 5.7). Figure 5.8 plots the measured change and corrected change for the three residential sampling sites, and shows that when corrected for concentration, a stable and predictable rise in softener-related ion concentration is observed. The high R2 value for the corrected plot shows a high reliability for this curve, which may indicate that it is a useful predictive tool. However, it is important to remember that the CCWRP must deal with the actual TDS entering the facility.
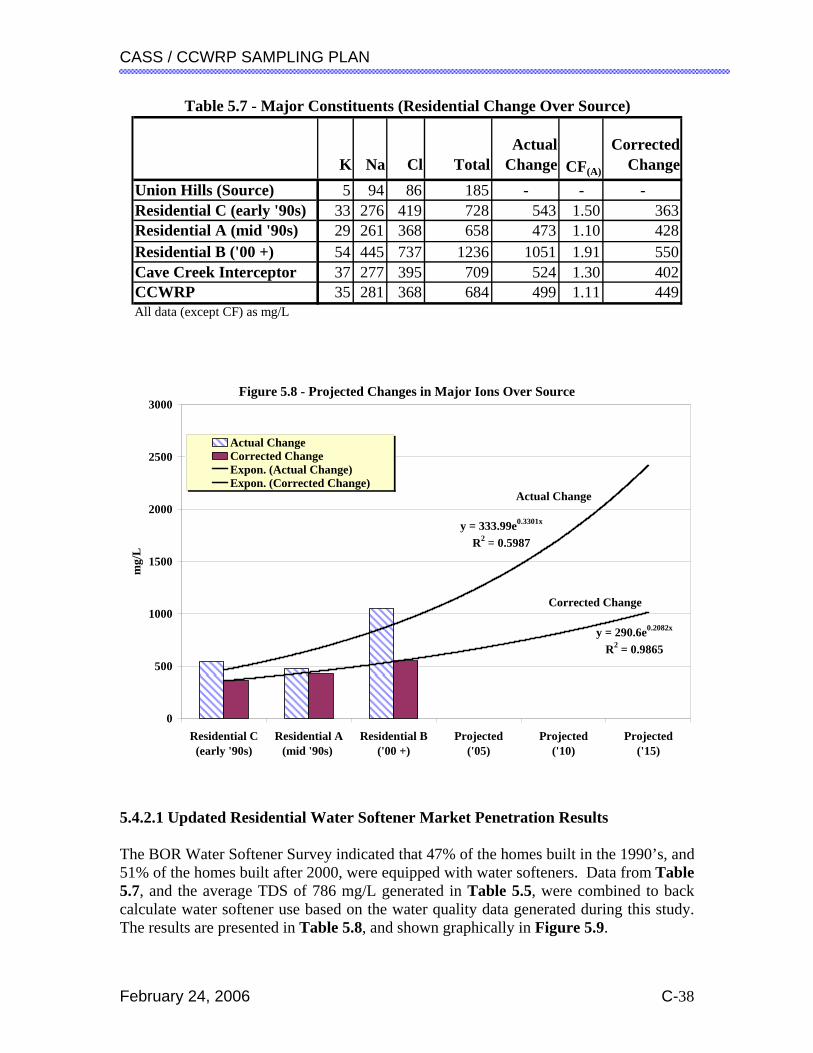
CASS / CCWRP SAMPLING PLAN
February 24, 2006 C-38
K Na Cl TotalActual
Change CF(A)
Corrected Change
Union Hills (Source) 5 94 86 185 - - -Residential C (early '90s) 33 276 419 728 543 1.50 363Residential A (mid '90s) 29 261 368 658 473 1.10 428Residential B ('00 +) 54 445 737 1236 1051 1.91 550Cave Creek Interceptor 37 277 395 709 524 1.30 402CCWRP 35 281 368 684 499 1.11 449All data (except CF) as mg/L
Table 5.7 - Major Constituents (Residential Change Over Source)
Figure 5.8 - Projected Changes in Major Ions Over Source
y = 333.99e0.3301x
R2 = 0.5987
y = 290.6e0.2082x
R2 = 0.9865
0
500
1000
1500
2000
2500
3000
Residential C(early '90s)
Residential A(mid '90s)
Residential B('00 +)
Projected('05)
Projected('10)
Projected('15)
mg/
L
Actual ChangeCorrected ChangeExpon. (Actual Change)Expon. (Corrected Change)
Actual Change
Corrected Change
5.4.2.1 Updated Residential Water Softener Market Penetration Results The BOR Water Softener Survey indicated that 47% of the homes built in the 1990’s, and 51% of the homes built after 2000, were equipped with water softeners. Data from Table 5.7, and the average TDS of 786 mg/L generated in Table 5.5, were combined to back calculate water softener use based on the water quality data generated during this study. The results are presented in Table 5.8, and shown graphically in Figure 5.9.

CASS / CCWRP SAMPLING PLAN
February 24, 2006 C-39
Estimated Year
Corrected Change (Tbl 5.7)
Estimated Softener
UseResidential C (early '90s) 1992 364 46%Residential A (mid '90s) 1997 442 56%Residential B ('00 +) 2002 537 68%
Table 5.8 - Softener Use Based on Water Quality Data
Figure 5.9 - Estimated Residential Softener Use Based on Water Quality Data
y = 0.1091x + 0.3464R2 = 0.9968
0%
10%
20%
30%
40%
50%
60%
70%
80%
90%
100%
1992 1997 2002 2007 2013 2017
PROJECTED
These data suggest a higher use of water softeners in the CCWRP sewershed than was predicted in the Greater Phoenix area BOR survey, as well as a steady increase of approximately 2% per year in utilization as development continues. 5.4.3 Projected Residential TDS Increases as a Function of Softener Use and Conservation TDS increases were projected for a 20 year period as a function of growth rate, updated water softener market penetration, and water conservation. Assumptions used in this analysis were that softener use would slow down beginning around 90% market saturation, and conservation would reduce water use by 1% per year.
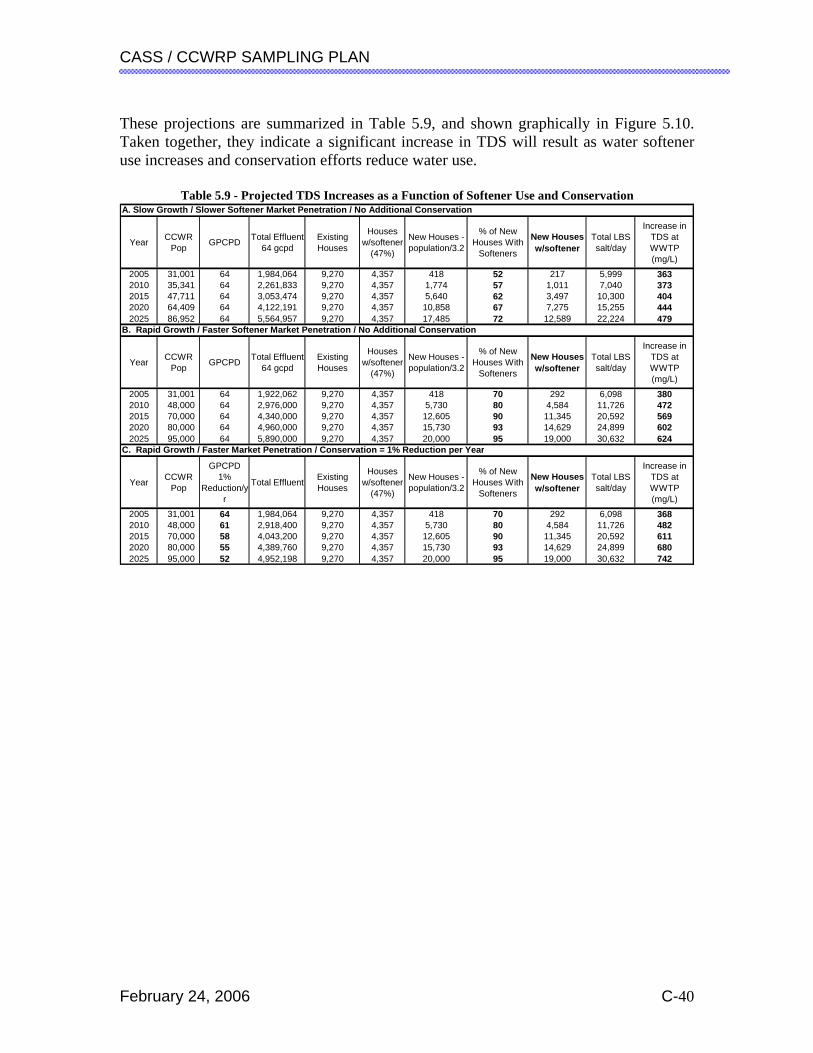
CASS / CCWRP SAMPLING PLAN
February 24, 2006 C-40
These projections are summarized in Table 5.9, and shown graphically in Figure 5.10. Taken together, they indicate a significant increase in TDS will result as water softener use increases and conservation efforts reduce water use.
A. Slow Growth / Slower Softener Market Penetration / No Additional Conservation
Year CCWR Pop GPCPD Total Effluent
64 gcpdExisting Houses
Houses w/softener
(47%)
New Houses -population/3.2
% of New Houses With
Softeners
New Houses w/softener
Total LBS salt/day
Increase in TDS at WWTP (mg/L)
2005 31,001 64 1,984,064 9,270 4,357 418 52 217 5,999 3632010 35,341 64 2,261,833 9,270 4,357 1,774 57 1,011 7,040 3732015 47,711 64 3,053,474 9,270 4,357 5,640 62 3,497 10,300 4042020 64,409 64 4,122,191 9,270 4,357 10,858 67 7,275 15,255 4442025 86,952 64 5,564,957 9,270 4,357 17,485 72 12,589 22,224 479
B. Rapid Growth / Faster Softener Market Penetration / No Additional Conservation
Year CCWR Pop GPCPD Total Effluent
64 gcpdExisting Houses
Houses w/softener
(47%)
New Houses -population/3.2
% of New Houses With
Softeners
New Houses w/softener
Total LBS salt/day
Increase in TDS at WWTP (mg/L)
2005 31,001 64 1,922,062 9,270 4,357 418 70 292 6,098 3802010 48,000 64 2,976,000 9,270 4,357 5,730 80 4,584 11,726 4722015 70,000 64 4,340,000 9,270 4,357 12,605 90 11,345 20,592 5692020 80,000 64 4,960,000 9,270 4,357 15,730 93 14,629 24,899 6022025 95,000 64 5,890,000 9,270 4,357 20,000 95 19,000 30,632 624
C. Rapid Growth / Faster Market Penetration / Conservation = 1% Reduction per Year
Year CCWR Pop
GPCPD 1%
Reduction/yr
Total Effluent Existing Houses
Houses w/softener
(47%)
New Houses -population/3.2
% of New Houses With
Softeners
New Houses w/softener
Total LBS salt/day
Increase in TDS at WWTP (mg/L)
2005 31,001 64 1,984,064 9,270 4,357 418 70 292 6,098 3682010 48,000 61 2,918,400 9,270 4,357 5,730 80 4,584 11,726 4822015 70,000 58 4,043,200 9,270 4,357 12,605 90 11,345 20,592 6112020 80,000 55 4,389,760 9,270 4,357 15,730 93 14,629 24,899 6802025 95,000 52 4,952,198 9,270 4,357 20,000 95 19,000 30,632 742
Table 5.9 - Projected TDS Increases as a Function of Softener Use and Conservation

CASS / CCWRP SAMPLING PLAN
February 24, 2006 C-41
Figure 5.10 - Projected Residential TDS Impacts from Growth, Softener Use, and Conservation
200
300
400
500
600
700
800
2005 2010 2015 2020 2025
TD
S (a
s NaC
l) In
crea
se (m
g/L
) Slow Growth + Slow Softener AdditionFast Growth + Fast Softener AdditionFast Growth + Fast Softener Addition + Conservation
It should be noted that there are water softeners that operate based on flow and/or conductivity; however, these tend to be more expensive and are not prevalent at this time; therefore this analysis assumes no additional efficiency improvements in residential water softener technology. 5.4.4 Pools and TDS 5.4.4.1 General Impact of Pools on TDS Pools concentrate salts through evaporation, and in Arizona, evaporation rates are approximately 7 feet per year. In a pool that is 5 feet deep, this significantly increase the concentration of naturally occurring salts. Had a pool in Residential A been dumping high TDS water during the sampling event, it may explain the high Ca levels; however, it would not explain the high sodium and chloride levels. 5.4.4.2 Salt Pools A relatively new contributor to salt loads on a sewershed is the salt pool. The technology is intended to replace more traditional disinfection technologies such as chlorination, and works by electrically generating Cl- from NaCl. To work, the salt concentration in the pool must be at least 3,000 mg/L with a range of up to 7,000 mg/L. If the pool is

CASS / CCWRP SAMPLING PLAN
February 24, 2006 C-42
backwashed, the salt is sent to the sewershed (or local groundwater if the home is on a septic system), and is replenished when TDS in the pool drops below the desired salt concentration as measured by conductivity. Literature indicates that some systems can operate up to ocean salinity levels (~35,000 mg/L) and beyond. There are also suggestions that a softening effect takes place when Ca and Mg precipitate on the electrode. It is not clear where these compounds go, but if they go to the sewer, they could contribute to the higher Ca and Mg levels seen in the Residential B sample. The industry reports that in recent years, market penetration has exceeded 25%. 5.5 TDS Contributions from Commercial Development TDS contributions from commercial developments were examined as part of this study. Commercial development was broken down into subcategories covering resort, office, medical, school and retail operations. Concentration factors were not applied to commercial development. It was felt that unlike residential development, the range of technologies (softeners, cooling towers, reverse osmosis) that may concentrate salts was too complex to assess based on a 24 hour composite. 5.5.1 TDS Contributions from Resorts The J.W. Marriott Resort served as a test site for this study. In reviewing information from this facility, it was felt that the site could best be characterized as “intense residential.” Each of the facilities 950 rooms utilizes softened water, so the equivalent water softener market penetration is expected to be 100%. Additionally, laundry, dishwashing, and other household activities occur more intensely than within a residential household. To verify this, salt use was obtained from resort staff for a one year period. They indicate that a total of 518,500 pounds of salt was purchased for their softeners between September 2003 and September 2004. This translates into 43,208 pounds of salt per month, and when compared to residential salt use (one 40-pound bag of salt per month per softener), is the equivalent of 1080 residential softeners. Resort staff indicates that occupancy rates were 90% throughout the year. The occupancy rate was not used to adjust the room count for actual use since it was felt that water would still be used by cleaning staff even though the room was empty. Therefore, water softener market penetration equals:
1080 equivalent softeners / 950 rooms, or 114%. This is a reasonable estimate for a facility of this type.

CASS / CCWRP SAMPLING PLAN
February 24, 2006 C-43
All water that enters the resort is softened and then blended back to 4 grain hardness. The resort operates three softeners based on flow, regenerating every 45,000 gallons. Typically, two of the units are online, while the third is either being regenerated or is in standby mode. Figure 5.11 provides on-line conductivity as a function of time during a regeneration cycle. Fortunately, the effluent from this facility is well buffered. Were the peak NaCl discharges from a facility of this type discharged unbuffered (closer) to the WRP, the impact could be far more immediate.
Figure 5.11 - Commercial Softener Regeneration Cycle Conductivity vs. Elapsed Time
0
10000
20000
30000
40000
50000
60000
70000
80000
90000
5 11 27 42 57 71 86
Elapsed Time in minutes
Con
duct
ivity
in µ
S/cm
Feed Water =1090
5.5.2 TDS Contributions from Non-Resort Commercial Operations TDS contributions from non-resort commercial operations were, in general, lower than the contributions seen in new residential and resort-type development. The exception to this was the American Express East building. The data from the development east of Mayo Hospital were not used for this analysis. The sum of reported ions exceeded TDS for this sample. 5.5.2.1 TDS Contributions from Mayo Hospital

CASS / CCWRP SAMPLING PLAN
February 24, 2006 C-44
TDS coming from Mayo Hospital was 1160 mg/L. This is similar to CCWRP product, residential A, and office/light commercial sites such as American Express West. There were some concerns about the low calcium and magnesium concentrations found in this sample, which were both lower than that of the source water. Engineering and maintenance staff indicated that the softeners regenerated two to three times per week (every 200,000 gallons), so the facility’s softeners may not have regenerated during the sampling event. Therefore, the lower calcium and magnesium numbers observed may have been the result of the ion exchange process. Each regeneration uses approximately 1400 pounds of salt, which calculates to 182,000 pounds of salt per year. 5.5.2.2 TDS Contributions from American Express TDS for American Express West and American Express East were 1780 mg/L and 1140 mg/L respectively (Table 5.1). American Express West houses a data center for their credit card processing operations as well as a cafeteria that services both buildings. Data centers require larger cooling systems than commercial buildings of similar size. This extra cooling requirement is due to the presence of multiple large data servers, which generate a significant amount of heat. The cafeteria kitchen has a small commercial water softener. American Express East consists of offices only, and did not show the TDS increase seen in the West building. 5.5.2.3 TDS Contributions from Desert Ridge TDS from Desert Ridge was 1520 mg/L (Table 5.1). Desert Ridge houses 31 restaurants and bars of various size, most of which use water softeners. A survey of restaurant managers revealed softener salt use ranges between 500 and 15,000 pounds per year. The total annual softener salt used by 14 of the 31 establishments is 61,583 pounds. Aerial photograph of the Marketplace show packaged air conditioning units on all the retail spaces. A large grocery store on this site, Albertson’s, usually has cooling towers (250-300 tons total) and softeners for the coffee shop and food preparation areas. 5.5.2.4 TDS Contributions from Pinnacle High School No sampling data were collected from Pinnacle High School. Maintenance staff indicates that no softener was installed in the cafeteria. Four cooling towers (typically 1000 – 1500 tons total) service the entire campus for 1900 students. The school had requested reclaimed water for its fields, but at that time, the request had not been finalized and approved. 5.6 Disinfection and TDS

CASS / CCWRP SAMPLING PLAN
February 24, 2006 C-45
5.6.1 Salt Use for Disinfection
On-site chlorination technology is used for disinfection of the water supply at wells, elevated storage sites and booster stations. Figure 5.12 shows a schematic flow drawing of an on-site chlorine generator. This equipment uses a sodium chloride salt brine which is then electrolyzed to create sodium hypochlorite. The lower left shows a softener on the supply water used to dilute the saturated (30%) brine in the brine tank. The brine concentration sent to the electrolyzer is reduced to 3%. It takes 3 pounds of salt to generate one pound of chlorine.
Figure 5.12 On-Site Chlorine Generator SchematicFigure 5.12 On-Site Chlorine Generator Schematic
5.6.2 Impact of Disinfection on TDS
It is assumed that all of the salt added into the disinfection points will wind up on the wastewater flow to the CCWRP. Table 5.10 contains the data provided by City of Phoenix identifying the on-site chlorine generation locations and type of disinfection salt (sodium chloride or calcium hypochlorite) used. The monthly amounts were projected over one year. The concentration added into the supply water was calculated from the pounds per day of salt added (947 pounds) divided by the winter average sewer discharge for all 9,270 accounts in the Cave Creek Sewershed. This activity adds 44.6 mg/l TDS to the water delivered to both

CASS / CCWRP SAMPLING PLAN
February 24, 2006 C-46
residential and commercial customers in the CCWRP sewershed. The TDS is made up of either calcium or sodium hypochlorite.
Site Description Type Type of Salt Used
Pounds of Salt./Tablets per
MonthPounds per
YearTons per
year6A-B2 Booster-Mayo Int. On-Site Salt - Sodium Chloride 6000 72000 366A-ES1 Elev.Stor.-Mayo Int. On-Site Salt - Sodium Chloride 5250 63000 31.56A-W292 well-Mayo Int. Tablet Calcium Hypochlorite 900 10800 5.46A-W293 well-Mayo Int. On-Site Salt - Sodium Chloride 1500 18000 96A-W295 well-Mayo Int. On-Site Salt - Sodium Chloride 1500 18000 97A-B1 Booster-CC Int. Tablet Calcium Hypochlorite 2250 27000 13.57A-W291 well-CC Int. Tablet Calcium Hypochlorite out of service 08A-B1 Booster-CC Int. Tablet Calcium Hypochlorite 600 7200 3.68A-W287 well-CC Int. Tablet Calcium Hypochlorite out of service 08A-W288 well-CC Int. On-Site Salt - Sodium Chloride 1500 18000 98A-W289 well-CC Int. Tablet Calcium Hypochlorite 1500 18000 99A-W280 Arsenic Treat well On-Site Salt - Sodium Chloride 7500 90000 459A-W281 well - CC Int. Tablet Calcium Hypochlorite 300 3600 1.8
Total 28800 345600 172.8
Table 5.10 Salt and Hypochlorite Use for Disinfection Within the CCWRP Sewershed
5.7 Impacts of TDS 5.7.1 Impacts of TDS on Turf Irrigation The most significant negative impact of TDS on turf irrigation comes from sodium, which impedes root development, and breaks down the clay in the soil, thereby reducing permeability. Figure 5.12 shows the increase in soil sodium content as a function of sodium in irrigation water for the Wildfire Country Club Golf Course. This course is part of the Desert Marriott Resort (the resort in this study), and because of the high sodium levels in CCWRP’s effluent, additional water is utilized simply to flush sodium away from the root zone. Sodium Adsorption Ratio (SAR) is used to determine the impact that sodium will have on a particular soil. It is calculated as follows:
SAR = Figure 5.13 shows the SAR for key waters in this study, and indicates that the highest SAR can be found in the resort’s effluent. SAR is not significantly affected by the technologies used at the CCWRP.
v (Ca + Mg) /2
Na
v (Ca + Mg) /2
Na

CASS / CCWRP SAMPLING PLAN
February 24, 2006 C-47
Figure 5.13 - Irrigation Water Sodium and Soil Sodium
59
146.9
78.1
212.7226.4
0
50
100
150
200
250
12/4/2000 3/6/2002 6/27/2003 6/29/2004 3/30/2005
Sodi
um in
Irri
gatio
n W
ater
(mg/
L)
.
0
5
10
15
20
25
30
35
40
45
50
Sodi
um in
Fai
rway
Soi
ls (p
erce
nt)
Irrigation waterFairway Soil
Potable Water
Reclaimed Water (from CCWRP)
Figure 5.14 - Sodium Adsorption Ratio
0
10
20
30
40
50
60
70
80
CAP CCWRP Efflluent Residential B Desert Marriott
Sodi
ium
Ads
orpt
ion
Rat
io

CASS / CCWRP SAMPLING PLAN
February 24, 2006 C-48
5.7.2 Impacts of TDS on Recharge and Recovery The CCWRP service area is located over a high quality aquifer. The area has not been influenced by irrigated agriculture, and groundwater TDS is generally less than 500 mg/L. As recharge occurs in this area, the local groundwater will be impacted by the quality of the recharge water. Given the high TDS found in CCWRP product, it is anticipated that the TDS of local groundwater will increase. As COP begins utilizing this water, it may find that wellhead treatment is required before these waters can be incorporated into the potable supply. 5.7.3 Impact of TDS on Compliance Requirements CCWRP has reported sublethal toxicity in approximately 1/3 of its Whole Effluent Toxicity (WET) tests using Ceriodaphnia dubia as the test organism, and has initiated a study to determine the cause of this toxicity. Several studies, including AWWARF 290 (Major Ion Toxicity in Membrane Plant Concentrate), suggest that chloride may contribute to WET test failures. Another study (TOXICITY REDUCTION EVALUATIONS AT TEXTILE MILLS, Burke, North Carolina Division of Pollution Prevention and Environmental Assistance,) reports that chloride above 450 mg/L and sodium above approximately 300 mg/L can be a source of chronic toxicity to Ceriodaphnia dubia. During this sampling event, both chloride and sodium levels in the CCWRP product were near these levels, and samples from several of the contributors to this sewershed exceeded them. Undefined during this study is the impact of chloride, particularly chloride concentration swings, on the treatment process as a whole. If chloride is impacting bioassay results used to monitor the WRP product, it is not illogical to deduce that it may impact biological processes utilized within a WRP. These impacts may manifest themselves as turbidity increases, nitrification, or denitrification inhibitions; however, there is little industry data addressing this issue one way or the other. The argument here is not that chloride kills the bacteria necessary for these processes; rather it is a suggestion that chloride, and particularly chloride swings, may stress organisms utilized in the treatment process. A brief internet search revealed several discussions regarding the impact of water softeners on septic tanks. Among the reports are a loss of solids, loss of clarity, and poor settling and grease isolation. Were a large resort to begin discharging close to the WRP, wide chloride swings could negatively impact the performance of the facility. 5.7.4 Impacts of TDS on Reclamation Costs The cost of TDS reduction is well described in the CASS Phase I and II documents, and will not be included here. Generally, monovalent salts, such as sodium and potassium chloride, are the most expensive to remove from water. Precipitation technologies commonly used to remove calcium and magnesium are ineffective at removing chlorides, so some form of advanced treatment, such as nanofiltration or reverse osmosis, are

CASS / CCWRP SAMPLING PLAN
February 24, 2006 C-49
required. Significant pre-treatment is necessary to prevent membrane fouling, and the resulting brine must be disposed of. Overall, the cost is significant. 5.7.5 Summary of the Impacts of TDS on Water Supply Probably the most important issue facing water managers is that increasing TDS concentrations have the potential to make water unfit for use. This is particularly important in desert areas, where water supplies are limited, and drought is a routine occurrence. In this study area for example, we see one water source that is negatively impacting turf irrigation practices, groundwater quality, and regulatory compliance goals. If TDS is allowed to increase unaddressed, the issues it presents will only increase in magnitude. 6.0 Conclusions The trends noted in this study are applicable to all new-growth wastewater contributors within the Phoenix Metropolitan Area. 6.1 Water Softeners and Conservation This study determined from residential TDS data that the percent of homes with softeners exceeds what was predicted by the BOR Softener Survey. Water conservation had not been previously considered as part of a salinity study, but it is obvious from the water meter reading data that gpcd declined significantly in homes built after 1999. The combination of water conservation and water softening are having a more significant impact on the CCWRP than originally anticipated. These impacts may be inhibiting the COP’s desire to meet compliance requirements, is negatively impacting its reuse customers, and will probably impact groundwater quality in the area. 6.2 Actual TDS vs. Predicted Overall TDS entering the CCWRP exceeds what was predicted in the Basis of Design Report. The impact of water softening and conservation could not be anticipated at that time of its development. The Basis of Design Report for this sewershed indicates that CAP water TDS would be 750 mg/L, and that overall wastewater TDS would be around 1000 mg/L for the life of the project. TDS at the CCWRP was approximately 1150 mg/L during this sampling event. This is an increase of 500 mg/L over the CAP water source (650 mg/L). Further, the Cave Creek interceptor contained 1260 mg/L TDS, and the Mayo interceptor was 1380 mg/L, suggesting an overall TDS of at least 1200 mg/L. Finally, the design report predicted a wastewater flow of 86 gpcd. Actual wastewater flow was approximately 64

CASS / CCWRP SAMPLING PLAN
February 24, 2006 C-50
gpcd during the planning, design, and commissioning phase of the CCWRP project, and has decreased significantly since then in new housing developments as a result of water conservation efforts. Overall, planning estimates do not reflect current conditions within the CCWRP sewershed. 6.3 The Impact of TDS Effluent from the CCWRP provides a product that is negatively impacting a customer, is showing sub-lethal toxicity during its bioassay testing, and will negatively impact the quality of groundwater within its recharge zone. As TDS increases, as it is expected to do, these impacts will increase. The J.W. Marriott Resort is one of the largest point source contributors of salinity and sodium in the sewershed and its Wildfire golf course experiences the downside impact of salinity on its fairways and greens. Discussions with resort personnel indicate they are interested in being a part of the solution to the salinity problem. Other turf irrigation customers, however, do not bear the same kind of responsibility and have less opportunity to mitigate the impacts (such as underdrains, overwatering, chemical additions). 6.4 Prioritized TDS Contributors This work has prioritized salt contributors to the sewershed in Table 6.1.
PRIORITY Description Justification
1
New residential This area can produce a TDS greater than 2000 mg/L, is showing 60% water softener utilization,and represents an increasing percentage of the sewershed.
2Resort/Large Hotels These facilities can deliver a TDS greater than 1700 mg/L,
and represents 100% water softener utilization.
3
Intense commercial, (restaurants, bars, data centers)
These facilities can produce a TDS greater than 1500 mg/L, and represent significant softener use
4 Hospitals TDS greater than 1100 mg/L, existing SIU5 Pre-2000 residential TDS greater than 1100 mg/L, may change with time6 Light retail, office, schools TDS greater than 1100 mg/L, expected to remain consistent
Table 6.1 Prioritized TDS Discharges
6.5 Impact of Growth Cave Creek offers an up-scale lifestyle, high quality homes and amenities. Because of this, growth in the area will continue at a fast rate. It is reasonable to assume that at least
CASS / CCWRP SAMPLING PLAN
February 24, 2006 C-51
another 15,000 homes will be built in this area. At present, most of the homes in this area were built before 2000. The percent of these homes with softeners is higher than predicted in the BOR study, and the percentage of new homes with water softeners is even higher. Additionally, new homes will have the latest water conservation technologies. As this process continues, the discharges from these newer homes will dominate residential contributions to the sewershed. To support this population increase, small and large retail will likely double. Commercial areas at major intersections along the Cave Creek Interceptor will add small contributions of salinity while large retail, such as the development expected to be larger than Desert Ridge Marketplace, will add significantly more TDS to the Mayo Interceptor. More people means additional schools will be built and hospital expansion that is already underway will continue to grow to meet an aging population demand. Amenities of an upscale lifestyle include golf courses, recreation areas and green belts. The largest users of reclaimed water for turf irrigation are golf courses, but other large users include schools, hospitals, parks, industries, and green belts. Use of reclaimed water has resulted in a build-up of salts in soils, required selection of salt tolerant turf, and requires application of up to 25% more water than is needed for agronomic purposes, simply to leach the salts through the soil column and into the groundwater. Turf irrigation in well-designed golf courses, with sophisticated underdrain systems will delay the need to address salinity in reclaimed water, although it is wasteful. However, continued turf irrigation in other areas such as public parks, may be threatened more quickly. 6.6 Future Trends Based on this analysis, the following are expected to occur:
• Water softeners will be more commonplace in new residential development than originally believed.
• Conservation will reduce the dilution volume carrying TDS (as NaCl) from water softeners.
• Together, conservation and softening will continue to increase TDS concentrations within the sewershed.
• Reuse, recharge and recovered water quality will deteriorate. • Reclaimed water will incur additional costs for improving reclaimed water
quality. • Salinity increases will exacerbate WRP compliance. • Small WRPs will feel the effects of increased salinity sooner than large plants and
serve as a bell-weather for such impacts. 7.0 Recommendations

CASS / CCWRP SAMPLING PLAN
February 24, 2006 C-52
Based on this study, the following recommendations are made: • Determine actual gpcd flows for this sewershed from residential developments since
2002. Additional analysis of the water meter readings since 2002 will confirm the gpcd trend. This will not only allow COP to refine the relationship between water softeners and conservation, it will also allow the City to verify planning assumptions for future WRP expansions.
• Determine actual flows from commercial developments and compile them with
softener use. This will verify the contribution of commercial development to overall salinity in the wastewater flowing to each of the interceptors.
• Verify the level of sodium and chloride that are toxic to Ceriodaphnia dubia through
the on-going Toxicity Identification Evaluation. • Continue diurnal study of conductivity spikes and the short-term impacts on CCWRP
activated sludge process. • Begin tracking groundwater quality in the vicinity of the CCWRP if this is not
already being done. • Compare and contrast salinity impacts at CCWRP to other high growth areas in
Central Arizona such as Goodyear and Gilbert. Scottsdale, which is built-out, offers a similar developments and TDS issues.
• Develop an understanding of salt pool technology, to determine its potential for future
salinity discharges to the sewershed. • Confirm impact of LS51 flows when they return to CCWRP after repairs are
completed. • Consider speeding up the development of an overall salinity management strategy for
this sewershed. Elements within such a strategy may include:
o Consider installing dedicated sewer lines to send softener waste from large commercial developments to the 91st Ave. WRP. In the case of the J.W. Marriott resort, this would remove over 500,000 pounds of salt from the sewer shed.
o Continuing the dialog begun with J.W. Marriott engineering and golf course
management personnel to engage them in determing best technology and methods to reduce salt discharges that are negatively impacting turf irrigation.
o Determine the impact to residents and commercial establishments of
improving water softener efficiency or encouraging the use of exchange bottles that are regenerated at central locations.

CASS / CCWRP SAMPLING PLAN
February 24, 2006 C-53
o Confirm sodium and chloride levels in discharges and project regulatory
impacts that will require mitigation steps. APPENDIX B – AERIAL PHOTOGRAPHS OF SAMPLING SITES
B-1 J.W.Marriott Desert Ridge Resort & Spa, MH# 302 B-2 Residential A, 503 Accounts, MH# 407 B-3 Residential B, 1,105 Accounts, MH# 213 B-4 Residential C, 852 Accounts, MH# 104 B-5 American Express East and West, MH#401,402 B-6 Mayo Hospital, Vault B-7 Desert Ridge Marketplace, MH# 224 B-8 East of Mayo, MH#102 B-9 Cave Creek Water Reclamation Plant, Mayo Interceptor, MH#206 B-10 Cave Creek Water Reclamation Plant, Cave Creek Interceptor, MH#210
CASS / CCWRP SAMPLING PLAN
February 24, 2006 C-1
APPENDIX C – STATEMENT OF WORK TASK ONE: Kick off Meeting TASK TWO: Review Existing Data Review “sewershed” maps, AWWARF Draft Report and existing water data from the CCWRP. This effort focuses on confirmation of the sampling points identified in the meeting of 7/9/04 based upon the conclusions of the AWWARF study. Review data formats and useful information that can link to this project, enhancing the value of the AWWARF study to the specific needs of the CCWRP. DELIVERABLE: Email summary points from the review. TASK THREE: Data Collection / Sampling Plan Verify sampling plan locations, frequency and grab-sample water chemical component analysis. Visit the eight sampling locations to confirm the sewershed map details and determine if any other point source salinity contributors should be characterized, such as the hospital site - Mayo. The sites are: Desert Ridge Mall, Marriott Resort, Pinnacle High School, residential districts in the Desert Ridge or Tatum Ranch areas, Mayo Clinic, American Express, and the commercial district east of Mayo Clinic. City personnel will take conductivity and flow measurements using Sonde equipment. In addition to conductivity, the same probe collects pH and Temperature data. Conductivity is an easy-to-determine, continuous measurement for any given location, while TDS is a lab-based batch test. Therefore, it was important to determine the correlation of TDS to conductivity is based upon the chemical composition of the water. A series of tests points are used to develop a TDS vs. conductivity calibration curve for the sampling points. Identify other data and sampling points that can be valuable to this effort during the early course of this project so that the time and effort for sampling would yield as much useful information for current as well as future needs. DELIVERABLES: Summary of site visits and confirmation of sampling plan. Calibration curve test method. REVIEW MEETING: Meet with Peggy and other lab personnel as needed to confirm calibration curve test method and chemical analysis for grab samples. Expanded Scope TASK THREE: Review raw data from the Sonde units and create Excel graphs which allow comparison of time-of-day events between flow and conductivity measurements.
TASK FOUR: Softener Salt Use Conduct a system-wide evaluation of softener salt sales, by visiting sites to determine the types of salt sale outlets – grocery, hardware, warehouse, chemical companies – and to determine the amount of sales and especially the ratio of potassium vs. sodium salt sales. Meet with the

CASS / CCWRP SAMPLING PLAN
February 24, 2006 C-2
representatives of softener equipment vendors to determine the market penetration, attitude towards the alternative potassium salt and other issues of note in the marketplace. Quantify the economics and penetration of potassium vs. sodium in the local market and Phoenix metro area. Compare the higher cost of the potassium to the benefits – to the user as well as to the CCWRP. Define the technical set up of commercial vs. residential softeners based upon the type of equipment, timing for regeneration and the types of regeneration methods. Interview off-site regeneration firms, such as Culligan, and Rayne, to determine this portion of the market and the locations, since they are large point-source salinity contributors. From the information and the technical basis for ion exchange, calculate the actual need for softening and the efficiency of use of salt in regeneration – both on-site and off-site.
Changed Scope TASK FOUR: Interview industry representatives f softener equipment and exchange bottle industry in greater Phoenix to obtain basic sales information. Interview Mayo Hospital, American Express, Pinnacle High School, Marriott Resort and Golf Course, various restaurants in Desert Ridge Mall, and various hotels, apartments and restaurants in Triange Bell, Scotsdale/101 retail developments. From these interviews determine annual salt consumption, which is directly discharged into the sewers to CCWRP. Expanded Scope TASK FOUR: Use data from interviews of salt users was to show relative contribution by types of salt users. Include the salt contribution from water disinfection. Review and analyzedzoning maps, CCWRP Design information, development permits and population projections to develop projections of the salt load to CCWRP for 2010, 2015, and 2020. Document all assumptions.
TASK FIVE: Write draft report. DELIVERABLE: Draft Report TASK SIX: Complete Final Report, prepare and present summary of Final Report to City of Phoenix and CASS. DELIVERABLE: Final Report and one presentation
Expanded Scope TASK SIX:
Co-author and co-present a technical paper to the AWPCA Conference in May 2005 and the WateReuse Conference in September, 2005

CASS / CCWRP SAMPLING PLAN
February 24, 2006 C-3
APPENDIX E - REFERENCES
Salt Institute website: www.saltinstitute.org Cargill website: www.cargill.com Morton Salt website: www.morton.com Culligan website: www.culligan.com Rayne Conditioning website: www.azh2o.com Bureau of Reclamation, Report 69, Chapter 15, Mike Mickley Design Information Memorandum No. 1 – Design Basis for CCWRP Email correspondence Morton Salt Consumer Affairs, “Potassium vs. Sodium.” “FOCUS ON: Potassium vs. Sodium Chloride,” Don Oster, Water Quality Products, December 2000. “Guidelines for Water Reuse,” USEPA – EPA/625/R-04/108, September, 2004. “History of Softening,” Peter Meyers, Water Conditioning & Purification, August, 2003. Morton System Saver, Residential Model Softener Installation and Operation Manual: Model MSD27B, Model MSD30D, MSD34C, Rev. A 4/30/04 “New Softener Efficienty Guidelines Affect Your Business.” Jerry Po, Water Conditioning and Purification, February 2001 “Planning for Growth and Salinity at a Small Water Reclamation Plant”, Allies and Day, WateReuse Conference, September, 2005. "Potassium Chloride: Alternative Regenerant for Softening Water" by Dr. Kim Polizotto and Dr. Charles Harms, Pipeline, a newsletter of the National Small Flows Clearinghouse, Winter, 2001 “Potassium Chloride offers Medical Center an Alternative,” Sid Blair, Water Technology, July 1998. “Priddis Greens Golf and Country Club Recycled Water Irrigation Research Project,” Roberts, Polizzotto and Blair, January, 2000. “Salt of the Earth: salt pool chlorinators have been around for decades. Now technological advancements have them posed to finally make their mark on the American pool market.” Bob Dumas, Pool and Spa News, July 23, 2004.

CASS / CCWRP SAMPLING PLAN
February 24, 2006 C-4
“Softener Certification: Standard 44 Capacity Testing,” Rick Andrew, Water Conditioning & Purification, August, 200a4. “Soft Water Creates Hard Choices,” Allies, Day and Poulson, AWPCA Newsletter, Vol. 22, No. 1, January 2005. “Toxicity Reduction Evaluations at Textile Mills, Burke, North Carolina Division of Pollution Prevention and Environmental Assistance. U.S. Bureau of Mines, Information Circular #9343, 1993, “The Material Flow of Salt,” Dennis S. Kostick.

The Study Partners: City of Glendale, City of Mesa, City of Phoenix, City of Scottsdale, City of Tempe, Arizona-American Water Company, City of Chandler, City of Goodyear, City of Peoria, City of Surprise, City of Tucson, Town of Buckeye, Town of Gilbert, Queen Creek Water Company, Brown and Caldwell and the Bureau of Reclamation
Appendix B Survey of Water Softener Penetration into
the Residential Market in the Phoenix Metropolitan Area

Survey of Water Softener Penetration Into the Residential Market in The Phoenix Metropolitan Area November 2004 Source: Insights & Solutions, Inc.
1
1
1
Survey of Water Softener Penetration Into the Residential Market in
The Phoenix Metropolitan Area
Prepared For:
U.S. DEPARTMENT OF THE INTERIOR BUREAU OF RECLAMATION LOWER COLORADO REGION
PHOENIX AREA OFFICE
November 11, 2004
Prepared By:
Insights & Solutions, Inc.
8222 S. 48th St. Suite 210
Phoenix Arizona 85044
(480) 874-1222 Fax (480) 874-2111
insightssolutions.com
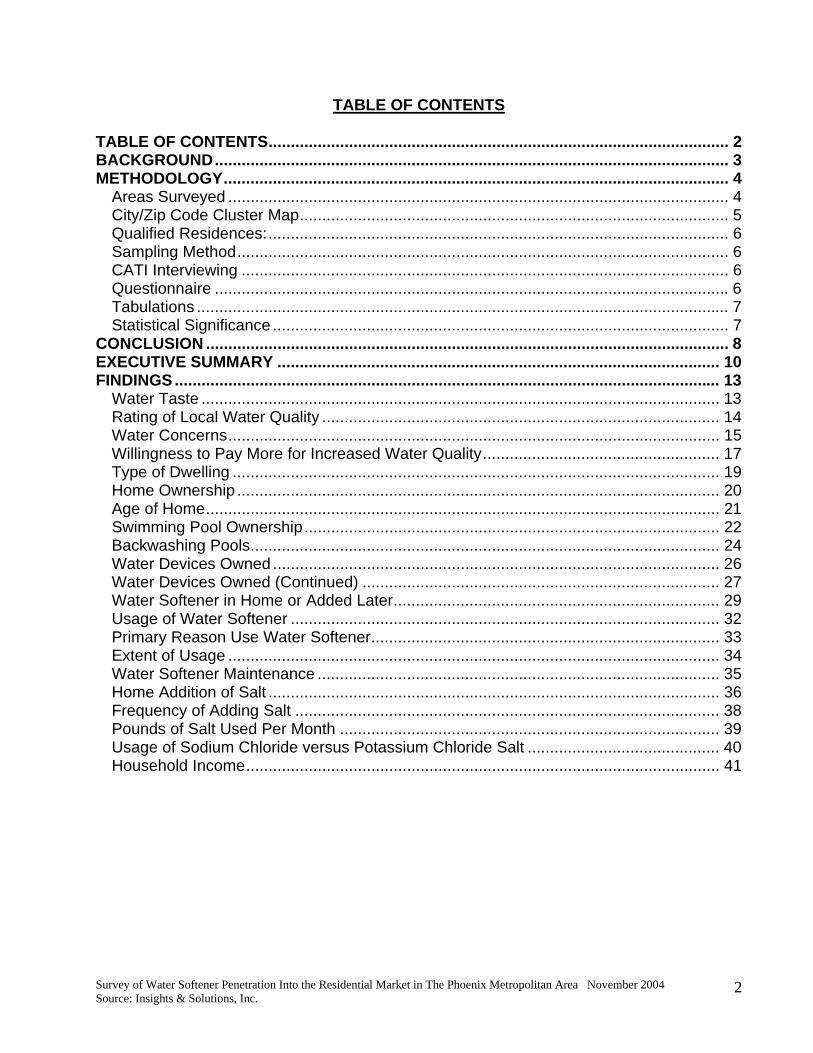
Survey of Water Softener Penetration Into the Residential Market in The Phoenix Metropolitan Area November 2004 Source: Insights & Solutions, Inc.
2
TABLE OF CONTENTS TABLE OF CONTENTS....................................................................................................... 2 BACKGROUND................................................................................................................... 3 METHODOLOGY................................................................................................................. 4
Areas Surveyed ................................................................................................................ 4 City/Zip Code Cluster Map................................................................................................ 5 Qualified Residences:....................................................................................................... 6 Sampling Method.............................................................................................................. 6 CATI Interviewing ............................................................................................................. 6 Questionnaire ................................................................................................................... 6 Tabulations ....................................................................................................................... 7 Statistical Significance ...................................................................................................... 7
CONCLUSION ..................................................................................................................... 8 EXECUTIVE SUMMARY ................................................................................................... 10 FINDINGS .......................................................................................................................... 13
Water Taste .................................................................................................................... 13 Rating of Local Water Quality ......................................................................................... 14 Water Concerns.............................................................................................................. 15 Willingness to Pay More for Increased Water Quality..................................................... 17 Type of Dwelling ............................................................................................................. 19 Home Ownership ............................................................................................................ 20 Age of Home................................................................................................................... 21 Swimming Pool Ownership............................................................................................. 22 Backwashing Pools......................................................................................................... 24 Water Devices Owned .................................................................................................... 26 Water Devices Owned (Continued) ................................................................................ 27 Water Softener in Home or Added Later......................................................................... 29 Usage of Water Softener ................................................................................................ 32 Primary Reason Use Water Softener.............................................................................. 33 Extent of Usage .............................................................................................................. 34 Water Softener Maintenance .......................................................................................... 35 Home Addition of Salt ..................................................................................................... 36 Frequency of Adding Salt ............................................................................................... 38 Pounds of Salt Used Per Month ..................................................................................... 39 Usage of Sodium Chloride versus Potassium Chloride Salt ........................................... 40 Household Income.......................................................................................................... 41

Survey of Water Softener Penetration Into the Residential Market in The Phoenix Metropolitan Area November 2004 Source: Insights & Solutions, Inc.
3
BACKGROUND The Central Arizona Salinity Study in Phase I attempted to identify and quantify the sources of salt that are entering the waste water treatment plants in the Phoenix metropolitan area. Residential properties seem to be a large contributor of salts to the water cycle. It is thought that water softeners, which replace calcium and magnesium, with sodium or potassium are one of the biggest sources of residential salts. One major unanswered question has been; how many residents have water softeners in their homes? The Bureau of Reclamation and the Sub-Regional Operating Group (SROG) cities of Phoenix, Tempe, Glendale, Scottsdale and Mesa asked Insights & Solutions, Inc. (I&S) to conduct a telephone survey to answer the question; how far have the water softeners penetrated into the residential market? Among other issues, the study was designed to answer the following questions:
• Percentage of water softeners in established (Area 1) verses growth areas (Areas 2). • Percentage of water softeners verses household income. • Percentage of sodium chloride versus potassium chloride versus household income. • Percentage of households who believe they have poor quality water which have water
softeners versus percentage of households who believe they have poor quality water which do not have a water softener.
• Percentage of households who have water softeners and home RO units. • Percentage of water softeners compared to age of home.
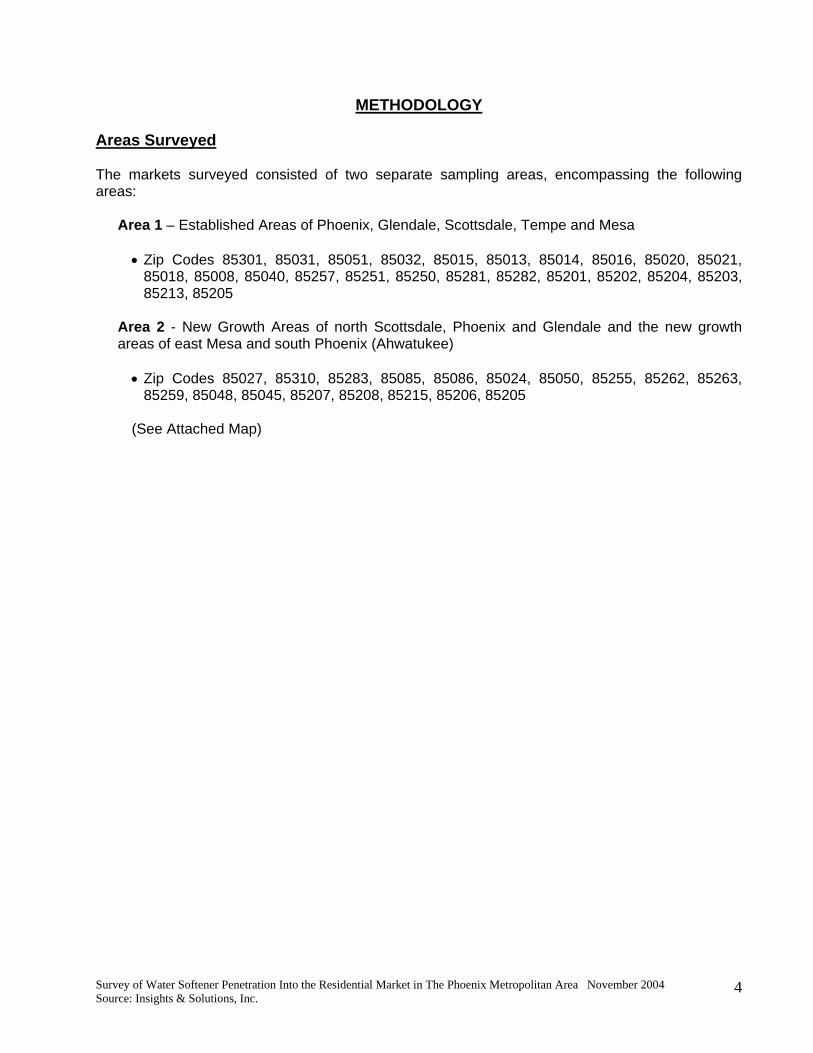
Survey of Water Softener Penetration Into the Residential Market in The Phoenix Metropolitan Area November 2004 Source: Insights & Solutions, Inc.
4
METHODOLOGY Areas Surveyed The markets surveyed consisted of two separate sampling areas, encompassing the following areas:
Area 1 – Established Areas of Phoenix, Glendale, Scottsdale, Tempe and Mesa • Zip Codes 85301, 85031, 85051, 85032, 85015, 85013, 85014, 85016, 85020, 85021,
85018, 85008, 85040, 85257, 85251, 85250, 85281, 85282, 85201, 85202, 85204, 85203, 85213, 85205
Area 2 - New Growth Areas of north Scottsdale, Phoenix and Glendale and the new growth areas of east Mesa and south Phoenix (Ahwatukee) • Zip Codes 85027, 85310, 85283, 85085, 85086, 85024, 85050, 85255, 85262, 85263,
85259, 85048, 85045, 85207, 85208, 85215, 85206, 85205 (See Attached Map)

Survey of Water Softener Penetration Into the Residential Market in The Phoenix Metropolitan Area November 2004 Source: Insights & Solutions, Inc.
5
City/Zip Code Cluster Map

Survey of Water Softener Penetration Into the Residential Market in The Phoenix Metropolitan Area November 2004 Source: Insights & Solutions, Inc.
6
Qualified Residences: Qualified residences included:
• Single Family • Duplex • Townhouse • Condominium • Mobile Home/Trailer
Apartment dwellers were excluded from the study. Sampling Method As the primary objective of the study was to determine incidence of Water Softeners in homes, I&S employed random telephone numbers in the two selected areas and Random Digit dialing to complete the surveys, as opposed to using listed samples. Random samples and Random Digit dialing ensured that all households had an equal chance of being contacted (as opposed to listed samples that eliminate unlisted households).
CATI Interviewing All calls were made from I&S’ in-house, CRT equipped telephone interviewing facility in Phoenix, Arizona. I&S computerized the survey process ensuring that interviewers accurately followed the telephone script. I&S’ in-house, expertly trained CATI programmers programmed the survey for use. The survey was programmed in both English and Spanish. Respondents were asked in which language they preferred to have the survey conducted and were surveyed in the selected language. The inclusion of Spanish language surveys ensured that all households were included in the study, increasing the accuracy of the findings. Questionnaire The questionnaire was four minutes in length and addressed the following subjects:
• Language preference • Rating taste of tap water • Residence Zip Code • Rating of local water quality • Primary concern: Water quality, water availability, water cost • Willingness to pay more for increased water quality • Type of residence

Survey of Water Softener Penetration Into the Residential Market in The Phoenix Metropolitan Area November 2004 Source: Insights & Solutions, Inc.
7
• Own or rent dwelling • Age of home • Swimming pool ownership • Where backwash pool • Ownership of Reverse Osmosis filter or Water Softener • Purchased home with Water Softener or added it later • Current use of Water Softener • Primary reason for using Water Softener • Extent to Water Softener usage • Service unit themselves or through Service Contract • Salt added by household member • Frequency of adding salt • Quantity of salt utilized each month • Type of salt used: Sodium Chloride vs. Potassium Chloride • Household income
Tabulations The study was tabulating by Insights & Solutions’ trained programming staff using Insights & Solutions’ proprietary SaTabs tabulation program. This program provides imbedded charting and graphing functions for the end user to use in reporting the information as well as the standard cross tabulations of the data. Statistical Significance In total, 2,453 households were screened, 1,392 in the Established Area and 1,061 in the Growth area. At the 95% confidence interval the data is statistically significant +/- 2 percentage points in total and +/- 3 percentage points within each sampled area.

Survey of Water Softener Penetration Into the Residential Market in The Phoenix Metropolitan Area November 2004 Source: Insights & Solutions, Inc.
8
CONCLUSION Overall, residents are equally concerned about Water Quality and Water Availability, with few concerned about Water Cost. Those in the Established area are more concerned about Water Quality than those in the Growth area, the latter being more concerned about Availability. While half of the residents rate their water as Excellent or Good, one-in-five believe their Water Quality is Poor. Those in the Established area are much more likely to rate their Water Quality as Poor than those in the Growth area. Views of Water Quality are not materially different between those owning Water Softeners and those that don’t. This is likely due to the fact that eight-out-of-ten state they primarily use them to Reduce Water Hardness and not to Remove Contaminants. One-quarter of all homes surveyed have a Water Softener, with penetration approaching four-in-ten in the Growth area, almost two and one half times greater than in the Established area. Reverse Osmosis system ownership follows this same pattern. Water Softener (and Reverse Osmosis system) ownership significantly increases with income to nearly half of all households having Water Softeners in the highest income group.
WATER SOFTENER PENETRATION BY INCOME TOTAL CAME INCOME PENETRATION EQUIPPED % % <$30,000 14 5 $30,000-$60,000 26 9 $60,000-$100,000 32 15 $100,000+ 49 24

Survey of Water Softener Penetration Into the Residential Market in The Phoenix Metropolitan Area November 2004 Source: Insights & Solutions, Inc.
9
The survey shows an increasing trend for new homes to come equipped with Water Softeners. And, Water Softeners are now a significance presence in all homes regardless of age, when we include those added after individuals move in.
WATER SOFTENER PENETRATION BY YEAR OF HOME YEAR HOME TOTAL CAME BUILT PENETRATION EQUIPPED % % <1970 17 5 1970s 23 8 1980s 27 12 1990s 47 22 2000+ 51 29
We also see a strong correlation between swimming pool ownership, Water Softener and Reverse Osmosis System ownership indicating they are all “quality of life” amenities. Nearly all Water Softeners are currently being used. About one-third are used to soften all the household’s water, about half are used to soften just the inside water and the remainder are softening just hot water. About a third of those with Water Softeners have someone else maintain them and the remainder do it themselves. Most households add 40 lbs of salt, once a month. Sodium Chloride is the predominant type of salt used at the rate of 1.63 to 1 compared to Potassium Chloride.

Survey of Water Softener Penetration Into the Residential Market in The Phoenix Metropolitan Area November 2004 Source: Insights & Solutions, Inc.
10
EXECUTIVE SUMMARY
• The taste of tap water in the sampled areas is rated Fair to Poor by two-thirds of the population (66%), with four-out-of-ten (41%) rating it Poor.
o Poor ratings were similar whether or not they own a Water Softener 9Own Water Softener=37% vs. Don’t Own Water Softener=41%)
o Residents in the Established area rated their tap water poorer than those living in the Growth area (44% vs. 37%).
• Half (50%) of the population surveyed rate their Water Quality as Excellent or Good, with the Growth areas rating their Water Quality higher than those in the Established area (53% vs. 48%).
• About one-in-five (19%) rate their Water Quality as Poor. o Those in the Established area rate their Water Quality significantly Poorer
than those in the Growth area (22% vs. 15%). o Ownership of Water Softeners does not materially affect their rating of Water
Quality (Own Water Softener=53% vs. Don’t Own Water Softener=51%). • Residents are equally concerned about Water Quality (44%) and Water Availability
(43%). Few (7%), overall, think Cost is a major concern, even among the lowest income groups (12%).
o Water Quality is more important to those in the Established area (48%). o Water Availability is more important in the Growth area (47%), among higher
income groups (up to 56%) and among those with Water Softeners (50%). o Those without Water Softeners are equally concerned about Water Quality
(43%) and Water Availability (46%). • One-quarter (26%) of the respondents would pay more to increase their Water
Quality. o Those living in the Established area are significantly more likely to say they
would pay more (30%) versus those in the Growth areas (20%) • Single-family homes are the predominant dwelling type, with more than two-thirds
(68%) living in this home type. One-in-seven (14%) live in apartments and the remainder are spread across the remaining home types.
o In the Growth area, a higher percentage of people live single-family homes (79% vs. 61%) and Mobile homes/Trailers (9% vs. 4%).
o In the Established area a higher percentage of people live in Apartments (22% vs. 4%), Condos (6% vs. 4%), Townhouses (5% vs. 1%) and Duplexes (2% vs. < 1%).
• Three-quarters (75%) of respondents say they own their dwelling. o Home ownership is significantly higher in the Growth area (87% than in the
Established area (66%). • The average home was built in 1985, with the average dwelling in the Established
area built in 1975 and in the Growth area in 1995.

Survey of Water Softener Penetration Into the Residential Market in The Phoenix Metropolitan Area November 2004 Source: Insights & Solutions, Inc.
11
o One-third (33%) of the homes built in the Established area were built before 1970.
• Over one-in-four (27%) homes have a swimming pool. o There are significantly more pools in the Growth area (31%) than in the
Established area (24%). o Homes with Water Softeners are much more likely to have swimming pools
than those without Water Softeners (46% vs. 26%). o Pool ownership skews significantly to higher income groups (<$30,000=14%
vs. $100,000+=60%). o New homes are significantly more likely to have swimming pools (pre-
1970s=24% vs. 1990s=44%, 2000+ 38%) • About one-in-six (17%) people backwash their pools, amounting to about two-thirds
(63%) of pool owners backwashing their pools. • One-quarter (25%) of all households surveyed own a Water Softener.
o Penetration is significantly higher in the Growth area (39%) than in the Established area (16%) or nearly two and one half times greater (2.44).
o Ownership of Reverse Osmosis systems is similar to Water Softener ownership (Growth area=35% vs. Established area=18%).
o Ownership of both types of systems is much higher in the Growth area (23% vs. 6%) or almost four times as great (3.83).
o Significantly more households have neither type of system in the Established area (49% vs. 42%).
o There is a direct relationship between income and water system ownership. Water Softener ownership increases with income (<$30,000=14%; $100,000+=49%) and fully 70% of those earning <$30,000 do not have either a Reverse Osmosis or a Water Softener system.
o Newer homes have a much higher penetration of Water Softeners and Reverse Osmosis systems than older homes.
Half (51%) of homes built since 2000 have Water Softeners Only one-in-six (17%) of homes built prior to 1970 have Water
Softeners Two-thirds (67%) of homes built before 1970 have neither system.
• Nearly half (43%) of homes that have a Water Softener said it was in the home when they moved in (or 11% of total homes), with the remainder adding it.
o Nearly one-in-five (18%) of homes in the Growth area came with Water Softeners.
o Only 6% of homes in the Established area came with a Water Softener. o Those earning $60,000 or more are as likely to add a Water Softener as to
have had it in the home when they moved in $60,000-$100,000=In-Home 15% vs. Added 17%; $100,000+=In-Home-24% vs. Added-25%).
o Those in lower income groups are more likely to add Water Softeners after they move in (<$30,000=In-Home-5% vs. Added-9%; $30,000-$60,000=In-Home-9% vs. Added-16%).
o There is an increasing trend for new homes to have Water Softeners.

Survey of Water Softener Penetration Into the Residential Market in The Phoenix Metropolitan Area November 2004 Source: Insights & Solutions, Inc.
12
<1970 = 5% 1970s = 8% 1980s = 12% 1990s = 22% 2000+ = 29%
• Nearly all households with Water Softeners use their units (94%). This amounts to
14% in the Established area and 37% in the Growth area, 24% overall. • Water Softeners are primarily used to Reduce Water Hardness (80%). Removing
Contaminants is a distant, secondary (6%) reason. • Nearly half (45%) of Water Softeners just soften inside water, a third (37%) soften all
the water and 9% soften just hot water. o Overall, 10% are softening all the water, 12% inside water and 2% hot water.
• One-in-fourteen (7%) households have someone maintain their Water Softener or just over a quarter (27%) of those with Water Softeners.
• One-in-six (16%) households add their own salt to their Water Softener. o Two-thirds (61%) of households with Water Softeners add their own salt. o One-quarter (25%) of households in the Growth area add their own salt. o Corresponding to newer homes having more Water Softeners, approximately
one-third of homes 1990s or newer add their own salt (1990s=30%, 2000+=34%)
• Most households add salt once a month or 11% of households. • The average household adds 40 pounds of salt a month. • Sodium Chloride salt is used significantly more often than Potassium Chloride (18%
vs. 11%).

Survey of Water Softener Penetration Into the Residential Market in The Phoenix Metropolitan Area November 2004 Source: Insights & Solutions, Inc.
13
FINDINGS Water Taste Overall, the taste of tap water is rated Fair or Poor by two-thirds of those screened (66%), with 41% rating it Poor. Poor ratings are similar regardless of owning a Water Softener (Own Water Softener=37%, Do not own Water Softener=41%). However, Poor ratings are significantly greater in the Established area (44%) than in the Growth area (37%)

Survey of Water Softener Penetration Into the Residential Market in The Phoenix Metropolitan Area November 2004 Source: Insights & Solutions, Inc.
14
Rating of Local Water Quality Half (50%) of respondents rate their local water quality as Excellent or Good. Similar to taste ratings, the Established areas rate taste significantly lower (48%) than those in the Growth area (53%). Ownership of Water Softeners indicates a directional skew with those with Water Softeners rating their water quality somewhat higher (53% Excellent/Good vs. those without Water Softeners 50% Excellent/Good). Just less than one in five (19%) rate their local water quality as Poor, with significantly more in the Established areas rating their water quality as Poor (22%) than those in the Growth areas (15%). Poor ratings are similar regardless of Water Softener ownership (Own=17%, Do Not Own=18%).

Survey of Water Softener Penetration Into the Residential Market in The Phoenix Metropolitan Area November 2004 Source: Insights & Solutions, Inc.
15
Water Concerns When asked about their principal concern, Water Quality and Water Availability are virtually tied, with 44% saying Water Quality and 43% saying Water Availability. Only 7% say Cost. Water Quality is much more of a concern among those living in the Established areas (48%), whereas Water Availability is more of a concern among those in the Growth area (47%). Those with Water Softeners are significantly more likely to be concerned with Water Availability over Quality (Water Availability=50% vs. Water Quality=39%). Those without Water Softeners are about equally concerned about Water Quality and Water Availability (Water Quality=43% vs. Water Availability=46%).

Survey of Water Softener Penetration Into the Residential Market in The Phoenix Metropolitan Area November 2004 Source: Insights & Solutions, Inc.
16
Water Concerns (Continued) While concerns about Water Quality are fairly stable by income (Range 37%-41%), Water Availability skews higher by income, from a low of 42% among those earning under $30,000 to a high of 56% among those earning $60,000-$100,000. The Cost of Water skews to lower income groups from a high of 12% among the lowest income group to a low of 4% among those earning $60,000-$100,000.

Survey of Water Softener Penetration Into the Residential Market in The Phoenix Metropolitan Area November 2004 Source: Insights & Solutions, Inc.
17
Willingness to Pay More for Increased Water Quality About one-quarter (26%) of all respondents would pay more for increased Water Quality. Those in the Established areas show significantly more likelihood to pay more (30%) versus the Growth areas (20%).

Survey of Water Softener Penetration Into the Residential Market in The Phoenix Metropolitan Area November 2004 Source: Insights & Solutions, Inc.
18
Willingness to Pay More for Increased Water Quality (Continued) Willingness to pay more generally skews higher with income, though not to the degree that geography does (<$30,000=23% vs. $100,000+=27%).

Survey of Water Softener Penetration Into the Residential Market in The Phoenix Metropolitan Area November 2004 Source: Insights & Solutions, Inc.
19
Type of Dwelling Overall, over two-thirds of all respondents live in a single-family home (68%); one in seven (14%) live in apartments, with the remainder spread across Mobile homes/Trailers (6%), Condominiums (5%), Townhouses (3%) and Duplexes (1%). While single-family homes are still the predominant dwelling type in the Established area (61%), versus the Growth Area, we see a higher percentage of people living in Apartments (22% vs. 4%), Condos (6% vs. 4%), Townhouses (5% vs. 1%) and Duplexes (2% vs. <1%). In the Growth area, significantly more live in single-family homes (79% vs. 61%) and Mobile homes/Trailers (9% vs. 4%).
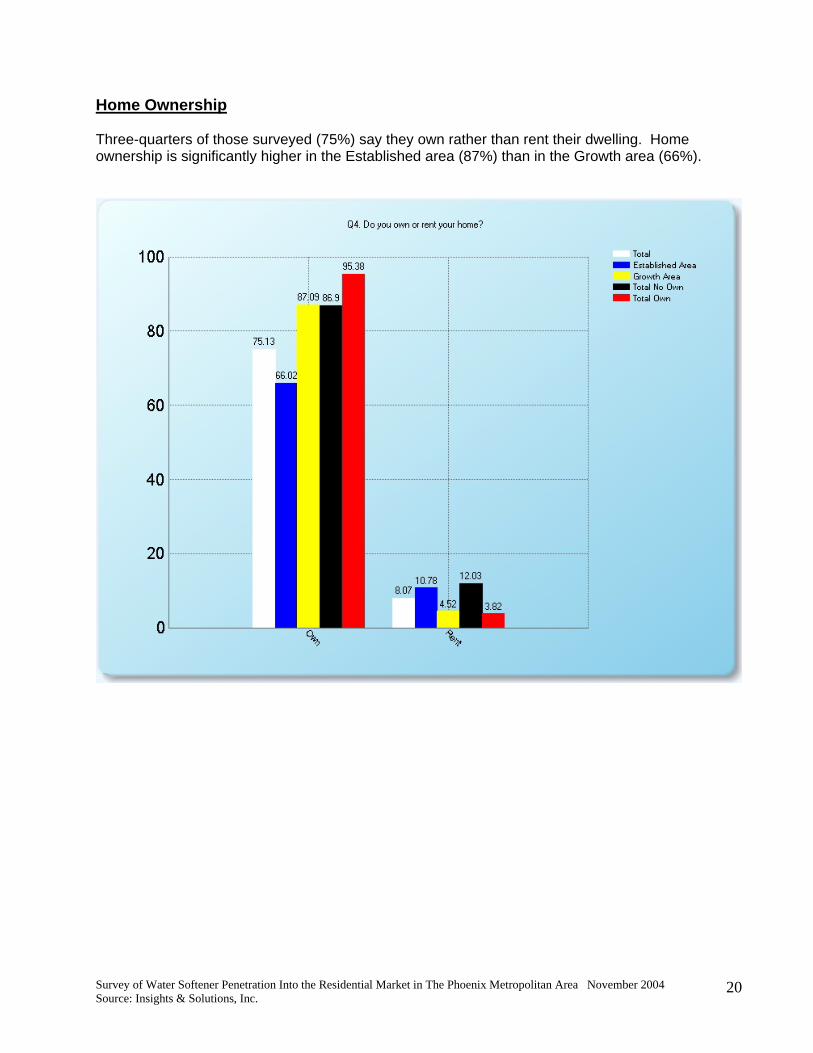
Survey of Water Softener Penetration Into the Residential Market in The Phoenix Metropolitan Area November 2004 Source: Insights & Solutions, Inc.
20
Home Ownership Three-quarters of those surveyed (75%) say they own rather than rent their dwelling. Home ownership is significantly higher in the Established area (87%) than in the Growth area (66%).

Survey of Water Softener Penetration Into the Residential Market in The Phoenix Metropolitan Area November 2004 Source: Insights & Solutions, Inc.
21
Age of Home The average home was built in 1985. As would be expected, homes are much older in the Established area with the median age at 1975 versus 1995 in the Established area. Fully, one-third of the dwellings in the Established area were built before 1970 (33%) versus only 5% in the Established area.
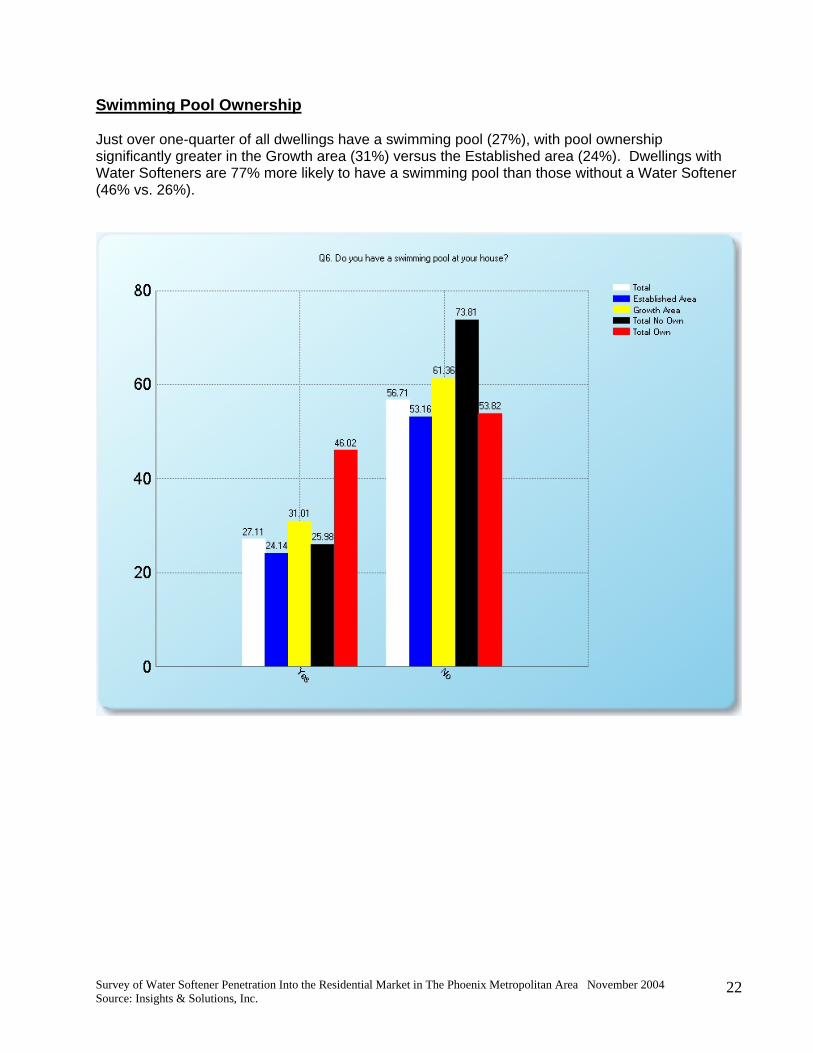
Survey of Water Softener Penetration Into the Residential Market in The Phoenix Metropolitan Area November 2004 Source: Insights & Solutions, Inc.
22
Swimming Pool Ownership Just over one-quarter of all dwellings have a swimming pool (27%), with pool ownership significantly greater in the Growth area (31%) versus the Established area (24%). Dwellings with Water Softeners are 77% more likely to have a swimming pool than those without a Water Softener (46% vs. 26%).

Survey of Water Softener Penetration Into the Residential Market in The Phoenix Metropolitan Area November 2004 Source: Insights & Solutions, Inc.
23
Swimming Pool Ownership (Continued) As would be expected, swimming pool ownership skews significantly to higher income groups, ranging from 14% among with incomes under $30,000 to a high of 61% among those with incomes $100,000+. Generally, the newer the home, the more likely they are to own a pool, but not precisely. For instance, pool ownership among those with homes built before 1970 (30%) exceeds those built during the 1970s. Likewise, pool ownership is highest among homes built during the 1990s (44%) than among the newest homes (38%).

Survey of Water Softener Penetration Into the Residential Market in The Phoenix Metropolitan Area November 2004 Source: Insights & Solutions, Inc.
24
Backwashing Pools While pool ownership is higher in the Growth area, the incidence of backwashing pools is similar in both the Established area (16%) and the Growth area (19%). Overall, about two-thirds of pool owners (63%) backwash their pools (Total Sample Own Pool=27% vs. Backwash Pool=17%). Coinciding with their higher pool ownership, those with Water Softeners have a significantly higher incidence of backwashing their pools (29%) than those without Water Softeners (17%).

Survey of Water Softener Penetration Into the Residential Market in The Phoenix Metropolitan Area November 2004 Source: Insights & Solutions, Inc.
25
Backwashing Pools (Continued) Similarly, backwashing follows the pattern of pool ownership within income and age of home groups.

Survey of Water Softener Penetration Into the Residential Market in The Phoenix Metropolitan Area November 2004 Source: Insights & Solutions, Inc.
26
Water Devices Owned Overall, one-quarter (26%) of the households surveyed have a Water Softener. Water Softener ownership is significantly higher in the Growth area (39%) than in the Established area (16%), or almost two and one half times greater (2.44). The ownership pattern for Reverse Osmosis systems is similar to Water Softener ownership (35% vs. 18%). Ownership of both types of systems is much higher in the Growth area (23%) vs. the Established area (6%) or almost four times greater (3.83). As a result, those in the Established area have significantly more saying they own neither type of system than those in the Growth area (49% vs. 42%).
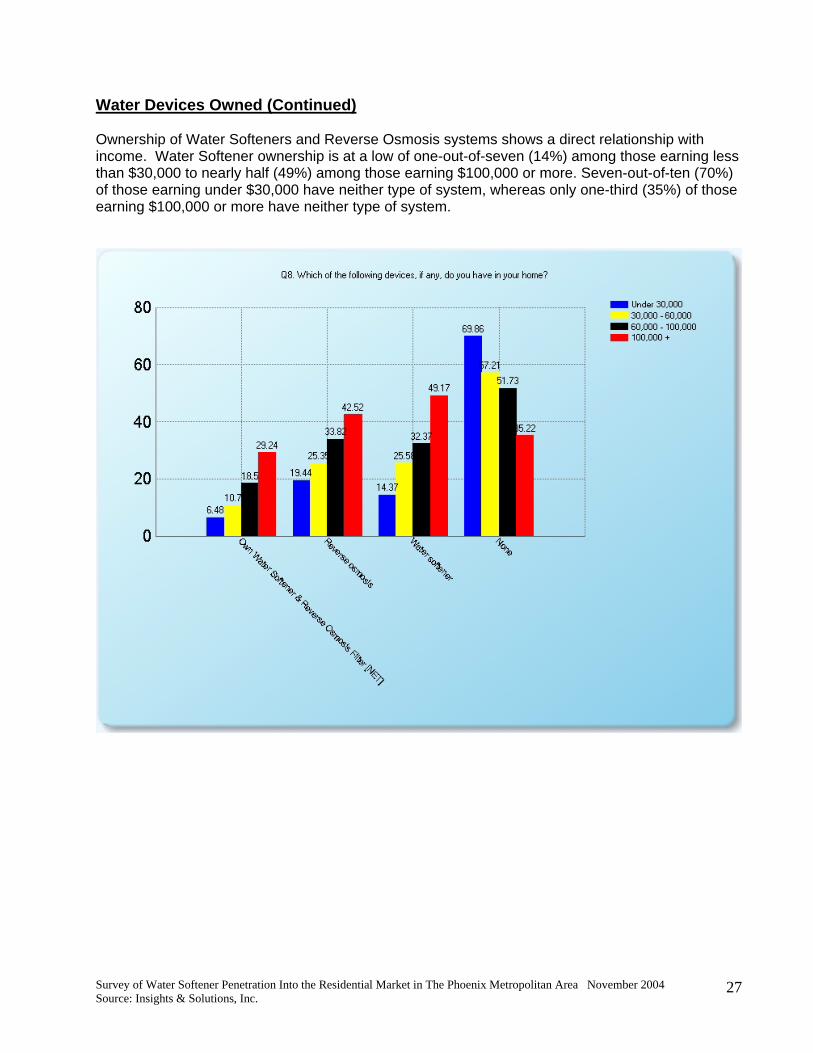
Survey of Water Softener Penetration Into the Residential Market in The Phoenix Metropolitan Area November 2004 Source: Insights & Solutions, Inc.
27
Water Devices Owned (Continued) Ownership of Water Softeners and Reverse Osmosis systems shows a direct relationship with income. Water Softener ownership is at a low of one-out-of-seven (14%) among those earning less than $30,000 to nearly half (49%) among those earning $100,000 or more. Seven-out-of-ten (70%) of those earning under $30,000 have neither type of system, whereas only one-third (35%) of those earning $100,000 or more have neither type of system.

Survey of Water Softener Penetration Into the Residential Market in The Phoenix Metropolitan Area November 2004 Source: Insights & Solutions, Inc.
28
Water Devices Owned (Continued) Similarly, we see that, the newer the home, the higher the penetration of Water Softener and Reverse Osmosis systems. Homes built since 2000 have a Water Softener penetration of 51% versus only 17% among homes built before 1970. Two-thirds of homes built before 1970 (67%) have neither type of system, versus only one-third (38%) having neither type of system in homes built since 2000.
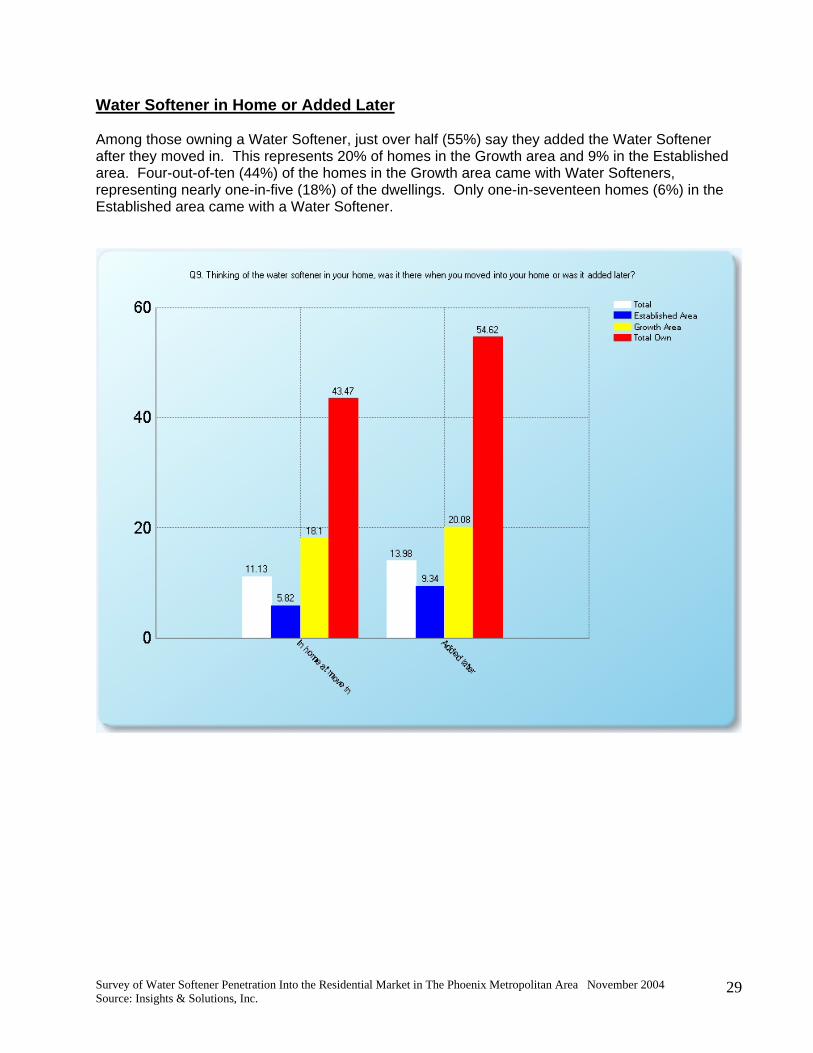
Survey of Water Softener Penetration Into the Residential Market in The Phoenix Metropolitan Area November 2004 Source: Insights & Solutions, Inc.
29
Water Softener in Home or Added Later Among those owning a Water Softener, just over half (55%) say they added the Water Softener after they moved in. This represents 20% of homes in the Growth area and 9% in the Established area. Four-out-of-ten (44%) of the homes in the Growth area came with Water Softeners, representing nearly one-in-five (18%) of the dwellings. Only one-in-seventeen homes (6%) in the Established area came with a Water Softener.

Survey of Water Softener Penetration Into the Residential Market in The Phoenix Metropolitan Area November 2004 Source: Insights & Solutions, Inc.
30
Water Softener in Home or Added Later (Continued) Those earning $60,000 or more are as likely to add a Water Softener as to have had one in their home when the moved in ($60,000-$100,000= In-Home-15% vs. Added-17%; $100,000+= In-Home-24% vs. Added-25%). Those in lower income groups are more likely to add Water Softeners after they move in (<$30,000= In-Home-5% vs. Added-9%; $30,000-$60,000= In-Home-9% vs. Added-16%).

Survey of Water Softener Penetration Into the Residential Market in The Phoenix Metropolitan Area November 2004 Source: Insights & Solutions, Inc.
31
Water Softener in Home or Added Later (Continued) There is an increasing trend toward equipping new homes with Water Softeners. Those living in homes built prior to 1970 only have 5% reporting their home came with a Water Softener, then this number increases to 8% among homes built in the 1970s, then to 12% in homes built in the 1980s. There is a dramatic increase in homes built in the 1990s coming with Water Softeners, with the percentage leaping to 22% and to 29% among homes built in 2000 or later

Survey of Water Softener Penetration Into the Residential Market in The Phoenix Metropolitan Area November 2004 Source: Insights & Solutions, Inc.
32
Usage of Water Softener Nearly all of those owning a Water Softener are using their units (94%). This amounts to one quarter of all households (24%); 14% of households in the Established area and 37% in the Growth area.

Survey of Water Softener Penetration Into the Residential Market in The Phoenix Metropolitan Area November 2004 Source: Insights & Solutions, Inc.
33
Primary Reason Use Water Softener The primary reason Water Softeners are used is to Reduce Water Hardness, cited by eight-out-of-ten (80%) of those with Water Softeners. The next most important reason cited, Removing Contaminants, is minor in comparison (6%).

Survey of Water Softener Penetration Into the Residential Market in The Phoenix Metropolitan Area November 2004 Source: Insights & Solutions, Inc.
34
Extent of Usage Nearly half of those with Water Softeners (45%) say they just soften inside water. A third (37%) say they soften all their water and the remainder (9%) says they just soften their hot water. Thus, one-in-ten households (10%) are softening all their water, one-in-eight (12%) are softening just their inside water and 2% are softening just their hot water.

Survey of Water Softener Penetration Into the Residential Market in The Phoenix Metropolitan Area November 2004 Source: Insights & Solutions, Inc.
35
Water Softener Maintenance Just over half (27%) of those with Water Softeners have someone come to their home on a regular basis to maintain their Water Softener, or one-in-fourteen homes. One-in-ten (10%) households in the Growth area have someone maintain their units.
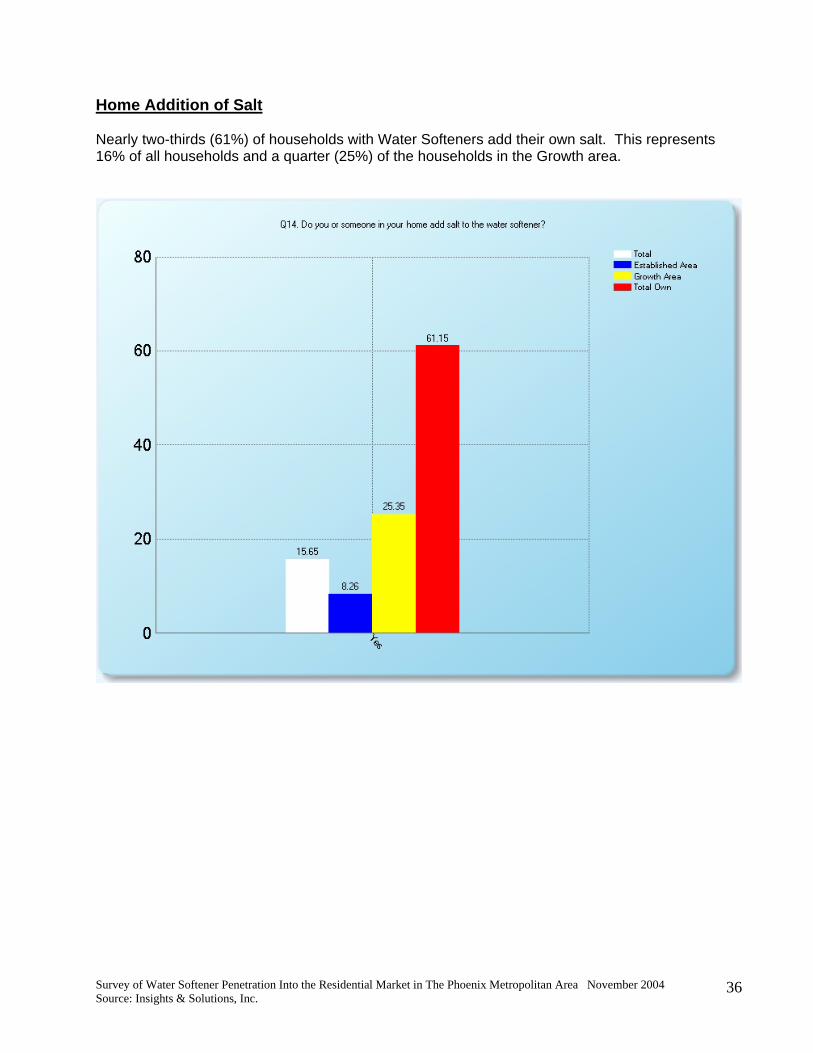
Survey of Water Softener Penetration Into the Residential Market in The Phoenix Metropolitan Area November 2004 Source: Insights & Solutions, Inc.
36
Home Addition of Salt Nearly two-thirds (61%) of households with Water Softeners add their own salt. This represents 16% of all households and a quarter (25%) of the households in the Growth area.

Survey of Water Softener Penetration Into the Residential Market in The Phoenix Metropolitan Area November 2004 Source: Insights & Solutions, Inc.
37
Home Addition of Salt (Continued) Approximately one-third of homes built since 1990 add salt to their units (1990s=30%; 2000+=34%). Homes built prior to 1990 show rates from 17% among those built during the 80s to a low of 8% among those homes built prior to 1970.

Survey of Water Softener Penetration Into the Residential Market in The Phoenix Metropolitan Area November 2004 Source: Insights & Solutions, Inc.
38
Frequency of Adding Salt The vast majority of those owning Water Softeners add salt once a month (41%) or 11% of households.

Survey of Water Softener Penetration Into the Residential Market in The Phoenix Metropolitan Area November 2004 Source: Insights & Solutions, Inc.
39
Pounds of Salt Used Per Month The median amount of salt used per month is 40 pounds.

Survey of Water Softener Penetration Into the Residential Market in The Phoenix Metropolitan Area November 2004 Source: Insights & Solutions, Inc.
40
Usage of Sodium Chloride versus Potassium Chloride Salt While many don’t know the type of salt they use, those that do know say they use Sodium Chloride significantly more than Potassium Chloride (18% vs. 11%).

Survey of Water Softener Penetration Into the Residential Market in The Phoenix Metropolitan Area November 2004 Source: Insights & Solutions, Inc.
41
Household Income The median income of all households surveyed is $45,000. The median for the Established area is $45,000 and for the Growth area is $80,000. This same pattern is seen among those owning Water Softeners ($80,000) and those that don’t ($45,000).