central arizona salinity study - phoenix.gov · the chino desalter was designed to produce potable...
TRANSCRIPT

The Study Partners: City of Glendale, City of Mesa, City of Phoenix, City of Scottsdale, City of Tempe, Arizona-American Water Company, City of Chandler, City of Goodyear, City of Peoria, City of Surprise, City of Tucson, Town of Buckeye, Town of Gilbert, Queen Creek Water Company, Brown and Caldwell and the Bureau of Reclamation
Central Arizona Salinity Study
Phase II – Brackish Groundwater
September 2006
______________________________________________________

i
Table of Contents
1.0 Executive Summary ................................................................................................... 1 2.0 Introduction................................................................................................................ 3
2.1 Methodology/Area of Study ............................................................................. 3 3.0 Case Studies............................................................................................................... 4
3.1 City of Goodyear RO Facility........................................................................... 6 3.2 Town of Gila Bend RO Facility........................................................................ 7 3.3 Lewis Prison EDR Facility ............................................................................... 7 3.4 Chino I Desalter ................................................................................................ 7 3.5 Goldsworthy Desalter ....................................................................................... 8
4.0 Legal, Legislative, and Regulatory Issues of Drinking Water................................... 9 4.1 National Environmental Regulations................................................................ 9 4.2 Arizona Regulations........................................................................................ 11 4.3 Local County/City Regulations....................................................................... 13
5.0 Water Supply, Adequacy, Reliability, and Quality ................................................. 14 5.1 Brackish Water Quality................................................................................... 14 5.1.1 TDS........................................................................................................... 14 5.1.2 Other Constituents .................................................................................... 16 5.2 Brackish Water Quantity................................................................................. 17 5.2.1 WSRV Water Quantity ............................................................................. 17 5.2.2 ESRV Water Quantity............................................................................... 18
6.0 Treatment Technology............................................................................................. 19 6.1 RO and Membranes ........................................................................................ 19 6.1.1 Process Fundamentals............................................................................... 19 6.1.2 Osmotic Pressure and Feed Pressure ........................................................ 19 6.1.3 Contaminant Removal Efficiencies .......................................................... 20 6.1.4 Flux ........................................................................................................... 20 6.1.5 Water Quality Recovery Rates.................................................................. 20 6.1.6 Nature of Concentrate Products ................................................................ 22 6.1.7 Pre-Treatment Requirements .................................................................... 22 6.1.8 RO System Configurations ....................................................................... 22 6.1.9 Post Treatment Requirements ................................................................... 25 6.1.10 Life Cycle Costs........................................................................................ 25 6.2 Membranes/Nanofiltration.............................................................................. 27 6.3 Membranes/Forward Osmosis ........................................................................ 27 6.4 Electrodialysis (ED) /EDR.............................................................................. 28 6.4.1 Process Fundamentals............................................................................... 28 6.4.2 Recovery Rates ......................................................................................... 28 6.4.3 Power Consumption.................................................................................. 29 6.4.4 Pre-Treatment Requirements .................................................................... 29 6.4.5 Life Cycle Costs........................................................................................ 29 6.5 Thermal Processes - Distillation ..................................................................... 29 6.6 Concentrate Management ............................................................................... 30
7.0 Conclusions.............................................................................................................. 31 7.1 Future Research Needs ................................................................................... 31

8.0 References................................................................................................................ 33 Appendix A-Benchmarking Project Summaries................................................................. 1 Appendix B-List of Primary and Secondary MCLs ........................................................... 1 Appendix C-West Valley Brackish Groundwater Appraisal Study.................................... 1
TABLES
Table 3.1 – Summary of Pertinent Desalting Projects in the Southwest ............................ 5 Table 3.2 – Centerra Well Raw Water Quality................................................................... 6 Table 5.1 – Study Area Well Data .................................................................................... 15 Table 5.2 – Constituents with High Water Quality Levels............................................... 17 Table 6.1 – Typical Saturation Limits for Sparingly Soluble Salts .................................. 21 Table 6.2 – Life Cycle Cost of Various RO Facilities..................................................... 25
FIGURES
Figure 5.1 – TDS Wells from ADWR .............................................................................. 16 Figure 6.1 – Osmotic Diagrams ........................................................................................ 19 Figure 6.2 – Spiral Wound RO Element Construction ..................................................... 23 Figure 6.3 – RO Element Assembly within Pressure Vessel............................................ 24 Figure 6.4 – Typical Membrane 24:10:5 Array ................................................................ 24 Figure 6.5 – RO System Life Cycle Cost ......................................................................... 26 Figure 6.6 – Flow diagram of a FO system ...................................................................... 28
APPENDICES
Appendix A Benchmarking Project Summaries......................................................... A-1 Appendix B List of MCLs and SMCLs...................................................................... B-1 Appendix C West Valley Brackish Groundwater Appraisal Study ........................... C-1

1
1.0 Executive Summary
As the population in central Arizona continues to grow, brackish groundwater will need to be added to the water resources portfolio. The use of traditional water resources will be unable to meet the water needs of projected growth scenarios. In order to use brackish groundwater for potable water, the total dissolved solids (TDS) will need to be significantly reduced to make the water palatable to water consumers. In addition, the quality of the treated brackish groundwater must meet all federal and state regulations. This study focuses on a review of several items that need to be addressed to bring brackish groundwater into current water resource plans. These items include regulatory codes, water quantity and quality, and treatment processes. The following is a summary of the key findings of this report. • Currently, the two most widely-used methods for treating brackish groundwater in the
southwestern United States (U.S.) are reverse osmosis (RO) membranes and electrodialysis reversal (EDR). Of the two, RO appears to be more popular because it can remove TDS and many other constituents. EDR primarily treats dissolved ionic constituents, such as Na, Ca, and Mg, which may limit its usefulness. In addition, EDR is a sole source product in that only one company has the patent on the technology; therefore, eliminating the competitiveness.
• To meet water quality goals, it may be beneficial to use a blending scenario, where a
portion of the brackish stream is treated and then blended with non-treated water. Blending scenarios may also mitigate the need to post-treat or stabilize water prior to sending to the distribution system as well as decrease treatment costs while keeping water supply flows high.
• The by-product of treating brackish water is brine concentrate. The most common
concentrate disposal methods are discharge to lined evaporation ponds or to sanitary sewers. Both methods have problems that may limit the amount of brackish groundwater than can be treated and used. For example, evaporation ponds require extensive land. Therefore, in some instances, it may not be feasible to use evaporation ponds when the available area around the brackish groundwater well is limited. Discharging to a sanitary sewer may be limited due to the capacity of the sewer or wastewater treatment plant (WWTP).
• The product water from desalinating brackish groundwater will need to meet all federal and state water quality regulations. In addition, the volume of groundwater pumped in certain areas in Arizona must meet the Arizona Department of Water Resources (ADWR’s) Groundwater Management Code to assure long-term water supplies. There may be some relief of this requirement in “waterlogged” areas, as defined in Section 2.3.10 of ADWR’s Third Management Plan for the Phoenix Active Management Area (AMA).
• The availability of brackish groundwater is still under investigation to determine the
long-term viability of this water source. However, based on water quality data, it

2
appears that brackish groundwater sources may need to be treated not only to reduce TDS concentrations, but to remove nitrates, arsenic, and silica.
3
2.0 Introduction
As water supplies in Arizona become more limited and population increases, new water sources are being sought. Two new potential water sources are water reuse (or reclaimed water) applications and brackish groundwater. Reclaimed water is being more extensively used in golf course irrigation, cooling water supply, and groundwater recharge, while brackish groundwater is being used to supplement potable water supplies. The objective of this study was to determine the viability of using brackish groundwater in central Arizona, which includes the metropolitan and surrounding areas of Phoenix and Tucson. Brackish groundwater is defined as having a total dissolved solids (TDS) concentration between 1,000 and 10,000 milligrams per liter (mg/L). In this range of TDS, water becomes unpalatable for human consumption. In addition, traditional water treatment technologies do not remove TDS. Therefore, advanced treatment technologies, such as membranes, are required to remove TDS. In addition, the concentrations of other water quality constituents, such as arsenic, nitrate, and silica, need to be evaluated to determine the final treatment process required to use brackish groundwater as a potable water source. In addition to treatment aspects and other water quality issues, the quantity of brackish groundwater supply needs to be examined. The West Salt River Valley (WSRV) groundwater basin in central Arizona includes areas that are known to have TDS levels ranging from 1,000 up to 5,000 mg/L. However, the volume of the brackish groundwater is uncertain and it is unclear if this water source can be used on a sustainable basis. Water resources investigations are needed in other areas to determine potential brackish groundwater supplies. As with any water source, several regulatory aspects need to be considered. For brackish groundwater, this may include water rights, clean water regulations, and assured water supply.
2.1 Methodology/Area of Study
This report focuses on issues related to brackish groundwater desalination in central Arizona. To better understand the issues, the first task of the study was to conduct a survey of existing brackish water treatment facilities located throughout the southwestern United States to identify potential problems with the treatment of brackish water. Several of these facilities were reviewed and are summarized in Section 3. Issues particular to Arizona include regulatory issues (Section 4), supply quantity and quality (Section 5), and treatment technologies (Section 6). The quantity and quality section of this study focused on the Phoenix metropolitan area. Special consideration will be focused on a known area of brackish groundwater in the WSRV. This area is defined in ADWR’s Third Management Plan as the “waterlogged area” in Buckeye/Goodyear. Further discussions of this particular area can be found in Section 5 and Appendix C of this report.

4
3.0 Case Studies
Over 30 existing brackish water treatment facilities and reports were reviewed and summarized for this study to determine similarities in TDS concentrations, treatment methods, concentrate management methods, permitting requirements, and environmental or public acceptance. A complete list of the facilities reviewed and summary data sheets are included in Appendix A. Of the 30 facilities, five were selected to be highlighted in Table 3.1 below with additional information in the following sections. These five projects were selected based on having groundwater as the source, utilizing either RO or EDR treatment, and having similar water quality, specifically TDS concentrations, to the central Arizona conditions. The projects presented are all in the southwestern U.S., with TDS values ranging from 800 to 4000 mg/L.

5
Table 3.1 – Summary of Pertinent Desalting Projects in the Southwestern U.S. Project Centerra
Well Facility Gila Bend
Facility Lewis Prison
Facility Chino I Desalter
Goldsworthy Desalter
Location Goodyear, Arizona
Gila Bend, Arizona
Buckeye, Arizona
Chino, California
Torrance, California
Owner City of Goodyear
Town of Gila Bend
Lewis Prison Chino Basin Desalter Authority
Water Replenishment District of Southern California
Source Water TDS, mg/L
>1,900 1,000-2,000 2,000-2,500 871 ~3,800
Treatment Method
RO RO EDR RO RO
Plant Capacity (in millions of gallons per day [MGD])
2.5 1.0 1.35 8.0 2.5
System Recovery (in percent)
79 Unknown Unknown 90 81.3
Year Online 2002 2002 1988 2000 2001 Capital Cost (in millions [M] of U.S. dollars)
$1.98M Unknown $1.1M $25M $6.5M
Operating Cost (in U.S. dollars per every thousand gallons [kgal])
$0.93/kgal Unknown Unknown $1.61/kgal Unknown
Concentrate Disposal
Sanitary Sewer
Evaporation Ponds
Evaporation Ponds
Ocean Outfall
Sanitary Sewer
Notes: 1. All five treatment systems operate with a brackish groundwater source. 2. Detailed summaries of these and other desalting projects are provided in Appendix A. 3. RO – Reverse osmosis. 4. EDR – Electrodialysis reversal.

6
3.1 City of Goodyear RO Facility
The City of Goodyear (COG) in Maricopa County, Arizona, began processing brackish groundwater in 2004 from the City’s existing Centerra Well. Brackish water is pumped from the well through approximately 2 miles of raw water transmission pipeline to a 2.5 million gallon per day (MGD) RO water treatment facility located at an existing COG potable water booster pump station and 2 million gallon storage reservoir site. The RO system includes four individual RO treatment trains that will be operated at a minimum recovery of 75 percent. The Centerra Well was drilled in 1949 to supply irrigation water to local farmers. The well has historically been utilized as an irrigation well, but was converted to a municipal well in 2004. The rehabilitation included installing a 16-inch diameter inner well casing to 500 feet. The inner casing is perforated between 234 and 490 feet. Water quality at the Centerra Well is summarized below in Table 3.2.
Table 3.2 – Groundwater Quality Data from Centerra Well* Parameter Value
Calcium, mg/L 163 Magnesium, mg/L 69
Sodium, mg/L 414 Sulfate, mg/L 505 Barium, mg/L 0.04 Nitrate, mg/L 17.9
Silt Density Index, units 1.2 – 5.6 Fluoride, mg/L 0.7
Temperature, degrees Fahrenheit 51.8 TDS, mg/L 1,940
Total Alkalinity (CaCO3), mg/L 193 pH, standard units 7.4
Arsenic, mg/L 0.003 *Data from City of Goodyear, 2004 As shown in Table 3.2, the Centerra Well contains high TDS, in excess of 1,900 mg/L, and nitrate above the state and federal drinking water standards of 10 mg/L. COG’s treatment goal is to produce a finished water product with a TDS of 500 mg/L or less and a nitrate concentration (as nitrogen) of 10 mg/L or less. To meet the treatment goals, a water blending scenario is used. The Centerra Well will pump 3.2 MGD raw water to the treatment facility, of which 2.7 MGD will be sent to the RO units and the remaining 0.5 MGD will bypass the RO units to be blended with the RO product water. The blended product is anticipated to have a TDS concentration of 479 mg/L and a nitrate concentration of 5.29 mg/L. TDS concentration in the 0.7 MGD concentrate rejected from the RO units is projected to be 7,447 mg/L. Pretreatment includes a cartridge filtration system to remove larger particles as well as the addition of a threshold inhibitor compound to prevent the precipitation of sparingly

7
soluble salts in the concentrate stream. Sodium hypochlorite is used for disinfection of the finished water prior to discharging into the storage reservoir. Concentrate is disposed in the sanitary sewer.
3.2 Town of Gila Bend RO Facility
In 2002, the Town of Gila Bend (Town), located in southern Maricopa County, completed the construction of a 1-MGD RO facility to treat groundwater. The facility includes three independent treatment trains. Groundwater for the facility is supplied from a series of wells located 5 miles south of the Town. TDS concentrations in the groundwater average between 1,000 to 2,000 mg/L. Concentrate from the RO system is disposed in evaporation ponds located at the RO facility site. In 2004, the Town started experiencing problems with the system. The RO system has been producing about 300 gallons per minute (gpm) for 16 to 17 hours per day using two treatment trains. This is significantly less than the design capacity of 1 MGD. The problem has been attributed to inadequate pretreatment. High chloride concentrations in the groundwater have corroded the stainless steel membrane housings. In 2005, the Town began replacing the existing stainless steel housings with fiberglass housings. The first replaced housing skid has been operating for over six months and it appears this will fix most of the problems with the system.
3.3 Lewis Prison EDR Facility
The Lewis Prison EDR Facility is a 1.35 MGD treatment plant with 3 EDR units, constructed to treat groundwater, which is supplied by two wells with TDS concentrations of approximately 2,000 mg/L. The facility is expandable up to 1.8 MGD with 4 units. Pretreatment includes acid addition and cartridge filtration. The EDR permeate is post-treated with caustic solution to provide pH adjustment and chlorination for disinfection. The system has had problems operating at the rated capacity; therefore, the recovery rate is down and more concentrate is generated. The concentrate is disposed of in onsite evaporation ponds. These evaporation ponds are close to exceeding capacity due to the problems associated with the EDR units.
3.4 Chino I Desalter
The Chino I Desalter, located in Chino, Orange County, California, was commissioned in 2000 and built to treat high TDS groundwater with high nitrates. The facility was constructed by the Santa Ana Water Production Authority (SAWPA) then transferred to the Chino Basin Desalter Authority (CDA). The system consists of a 6.7 MGD RO system and bypass facilities for a combined production capacity of 8.4 MGD. The system is operated at 80 percent recovery. In 2005, the plant expanded to 13 MGD by adding ion exchange and volatile organic compound (VOC) removal towers to the facility. The Chino Desalter was designed to produce potable water with a TDS concentration of less than 350 mg/L and nitrate concentration less than 25 mg/L. The source water

8
(groundwater) has an average TDS of 871 mg/L. Pretreatment methods include acid addition, threshold inhibitor addition, and cartridge filtration. The treatment process includes a 6 MGD RO stream, a 4 MGD ion exchange stream, and a 3 MGD VOC removal stream. The RO permeate is decarbonated and blended with the two other treatment streams to achieve the desired TDS and nitrate goals. Concentrate from the RO system is sent to an ocean outfall through the Santa Ana Regional Interceptor (SARI).
3.5 Goldsworthy Desalter
The objective of the Goldsworthy Desalter, located in Torrance, Los Angeles County, is to provide an additional source of local potable water utilizing a portion of the West Coast groundwater basin currently contaminated by seawater. The average TDS of source water to the Goldsworthy Desalter is approximately 3,800 mg/L. Pretreatment technologies include cartridge filtration, sulfuric acid addition, and threshold inhibitor injection. RO is used as the primary treatment method. The RO permeate is further processed by decarbonation and sodium hydroxide addition prior to blending. Blending goals include using as much bypass volume as possible to achieve a TDS goal of 500 mg/L. The RO treatment capacity is 2.5 MGD with the option to expand to 5 MGD. Overall, the recovery rate of the system is 81.3 percent. Concentrate from the RO system is discharged to the sewer system.

9
4.0 Legal, Legislative, and Regulatory Issues of Drinking Water
Groundwater quality and quantity are regulated by several different agencies prior to its distribution for potable use. Water quality is primarily regulated by the U.S. Environmental Protection Agency (EPA). In some instances, the EPA has allowed states to assume primacy over these regulations, as is the case with Arizona. Additionally, Arizona has delegated its primacy authority to Maricopa and Pima, Arizona’s most populated counties. Issues related to groundwater quantity in central Arizona are regulated by ADWR.
4.1 National Environmental Regulations
Listed below are water quality regulations that may affect the distribution of brackish water for potable uses. Brackish water may have other constituents dissolved in the water and it is important to catalog what regulations may impact the distribution of this water. Safe Drinking Water Act, 1974, Amended 1986 and 1996 The Safe Drinking Water Act (SDWA) was established in 1974 and authorized the EPA to establish and enforce safe drinking water standards. The SDWA is the primary federal legislation that regulates drinking water in the U.S. The 1996 amendment was enacted to specifically address source water protection, water plant operator training, funding for water system improvements, and dissemination of public information on water systems. As part of the SDWA, the EPA established Maximum Contaminant Limits (MCLs) on various chemical constituents to ensure that public health is adequately protected. An MCL is the maximum allowable concentration of a specific constituent in public drinking water considered to be safe by the EPA. Primary MCLs are enforceable and are established as the maximum permissible level for contaminants in the water that may cause adverse public health effects. Secondary MCLs are based on aesthetic qualities (taste, odor, color), and are not enforceable. Secondary MCLs are established for contaminants that may have cosmetic or aesthetic effects, but are not considered to present a risk to human health. An example of a secondary MCL is TDS; with a limit of 500 mg/L. TDS concentrations above this limit may impair the taste of water, cause scale build-up on water-dependent appliances, and/or prohibit the growth of plants. A list of the primary and secondary MCLs is provided in Appendix B. EPA’s Proposed Ground Water Rule The proposed Ground Water Rule still under review by the EPA at the end of 2005 is proposed by the EPA to promote disinfection of groundwater sources for public drinking water supplies for the purpose of protecting against microbial contaminants. Current standards require the use of disinfection only for drinking water sources consisting of surface water and/or groundwater under the direct influence of surface water as well as

10
residual chlorine level in the distribution system. The Proposed Ground Water Rule would require a hydrologic sensitivity analysis be conducted for public drinking water systems that are not currently disinfecting groundwater and a 99.99 percent virus inactivation/removal. The sensitivity analysis would determine if the aquifer has the potential for microbial contamination. Currently, the EPA considers karst, gravel and/or fractured bedrock aquifers sensitive to microbial contamination. Public drinking water systems would be required to add microbial monitoring for fecal indicators and treatment if microbial indicators were found in the groundwater. Additionally, public drinking water systems would be required to monitor the treatment system to assure that treatment levels are continually met. Radionuclides Rule Regulations for radionuclides in community drinking water systems were first promulgated in 1976; the standards became effective in December 2003. Primary MCLs were established for radium 226 + radium 228, radon, uranium, gross alpha particle activity, and beta and photon emitters to reduce the risk of cancer. The southeastern U.S. is affected by this rule in particular because of naturally high levels of radionuclides. The EPA estimates that only 795 systems throughout the U.S. will require treatment for these contaminants. Lead and Copper Rule The Lead and Copper Rule was adopted in 1991 for the purpose of protecting public health by reducing corrosivity. The typical source of lead and copper is from plumbing fixtures; therefore, testing for lead and copper is done at the tap. Monitoring schedules are dependant on size of the water system as well as whether or not there have been exceedances in previous test results. Stage 1 Disinfectants and Disinfection Byproducts Rule (D/DBP) This rule was developed to limit residual disinfectant in finished water, since disinfectants may react with naturally-occurring organics to form unintended byproducts. This rule applies to all water systems that use disinfection products. Disinfection byproducts (DBPs) have been linked to causing cancer, reproductive and developmental effects in humans. DBPs include trihalomethanes, haloacetic acids, chlorite and bromate. Adherence to meeting the D/DBP MCLs is performed by monitoring the system and determining the D/DBP concentrations on a running annual average for the system. Water providers who use surface water or groundwater under the influence of surface water and use conventional filtration must also use some sort of enhanced coagulation to remove organic materials which may bond with chlorine to form the DBPs. Stage 2 Disinfectants and Disinfection Byproducts Rule Stage 2 of the D/DBP Rule was promulgated on January 4, 2006 and supplements the existing regulations by requiring drinking water suppliers to meet disinfection byproduct

11
MCLs at each monitoring site in the distribution system; the MCLs for total trihalomethanes and haloacetic acids will remain the same. The new rule will require that the community water systems calculate the running annual average at each specific sampling site in the distribution system rather than a running annual average for all sites. Additional requirements must be met if exceedances occur or if Cryptosporidium is determined to be present. Surface Water Treatment Rule (SWTR) The Surface Water Treatment rule, which applies to all community and non-community public water supply systems, became effective in 1990. The SWTR was developed to protect the public from Giardia, Legionella, insects, algae, and viruses that are found in surface water and groundwater under the influence of surface water. The SWTR requires that all public water supplies be treated through a system of disinfection and/or filtration. Long Term 1 Enhanced Surface Water Treatment Rule (LT1ESWTR), Long Term 2 Enhanced Surface Water Treatment Rule (LT2ESTR) and Filter Backwash Recycling Rule The Long Term 1 Enhanced Surface Water Treatment rule became effective in 2001. The Rule was developed to protect public drinking water systems serving less than 10,000 people and use either surface water or groundwater under the direct influence of surface water from microbial contaminants, specifically Cryptosporidium. The LT2ESTR rule is a follow up to LT1ESTR and applies to all public water systems that use surface water or groundwater under the direct influence of surface water, regardless of size. This rule became effective in 2005. The purpose of the FBRR is to further protect public health by requiring public water systems, establishes stricter filter requirements including additional monitoring and recycling that may otherwise compromise microbial control. This rule also became effective in 2001. Arsenic Rule Long-term exposure to arsenic has been linked to cancer of the bladder, lungs, skin, kidney, nasal passages, liver, and prostate. Non-cancer effects of ingesting arsenic include cardiovascular, pulmonary, immunological, neurological, and endocrine (e.g., diabetes) effects.. Based on health studies, EPA revised the previously established MCL for arsenic by reducing it from 50 mg/L to 10 mg/L. The Arsenic Rule was adopted on January 22, 2001 and became effective on February 22, 2002. The date by which drinking water systems must comply with the new 10 mg/L standard is January 23, 2006.
4.2 Arizona Regulations
In 1980, the Arizona legislature created the Groundwater Management Code to control the state’s limited groundwater resources and provide a means for allocating groundwater

12
resources for Arizona’s water demand needs. The Code established the State agency, ADWR, to administer the Code’s provisions. The Code also established five “Active Management Areas” (AMAs) within the State where groundwater level declines were most severe. The AMAs include Phoenix, Tucson, Prescott, Pinal, and Santa Cruz and encompass approximately 14,600 square miles of area. The Code also created a system of groundwater rights that limits groundwater withdrawals, prohibits development of new irrigated farmland, requires new developments to demonstrate that a long-term water supply is available and dependable, and requires the measuring and reporting of groundwater uses for these rights. Management goals were developed for each AMA and these goals were to be met with the implementation of a series of five management plans, each one more stringent than the prior. The management plans consist of conservation requirements for industrial, municipal, and agricultural groundwater users. Currently, the Code is operating in its Third Management Plan (TMP), which covers the period of 2000 through 2009. In addition to the groundwater rights within the AMAs, the Assured Water Supply (AWS) program evolved from the 1973 Water Adequacy Statute to ensure that new development would have water on a legal, physical, and continual basis for 100 years. The two ways to demonstrate an AWS are through a developer attaining a Certificate of Assured Water Supply (CAWS) for a new development or through a water provider having a Designation of Assured Water Supply (DAWS). Many municipal water providers within the Phoenix AMA have secured a DAWS. Brackish groundwater is subject to the Code’s regulation. Pumping and desalination of this water would require that brackish groundwater be counted against groundwater allotments and would also require the groundwater pumper to pay fees for utilizing this water. Because of the quality of this water, brackish groundwater is a somewhat underutilized water resource. It would be advantageous for water providers to have regulatory relief from pumping restrictions. The following references to statute and rule that indicate where some exemptions from the groundwater code already exists. A.R.S § 45-411.01 Exemptions from Irrigation Water Duties, Conservation Requirements for Distribution of Groundwater and portions of Groundwater Withdrawal Fees for Portions of Phoenix Active Management Area A.R.S. § 45-411.01 was written to address shallow groundwater levels in the southwest portion of the Phoenix AMA and allows for the exemption of conservation requirements and portions of withdrawal fees until the end of the Fourth Management Plan Period (December 31, 2019) for lands within the Arlington, Buckeye and St. Johns Irrigation Districts. A review of hydrologic conditions of this area and a re-evaluation of the statute (A.R.S. § 45-411.01) must be done by ADWR before December 15, 2015 to extend this exemption. Located within portions the City of Goodyear and the Town of Buckeye, this area is also known as the “waterlogged area” per Section 2.3.10 of the ADWR Third Management Plan (TMP). Depth to groundwater in this waterlogged area is as shallow as 10 feet below land surface and the TMP acknowledges that this area is plagued with

13
high salinity. CASS Phase 1 further studied water quality in this area and determined that in most cases the groundwater meets the definition of “brackish” due to its high TDS content, which can be over 2,500 mg/L. Assured Water Supply Requirement Exemption Under Arizona Administrative Code (A.A.C.) R12-15-705.T, water providers with an AWS certificate and/or within the designated waterlogged area are allowed to exclude the uses of the following types of groundwater:
• Surface water (under certain conditions) • Contaminated Groundwater (under certain conditions)
o Groundwater Pumping for Remedial Action (under approval of ADEQ) o Groundwater is treated, blended or exchanged to achieve water quality
standards o Groundwater would have otherwise not been pumped o Groundwater is withdrawn before 2025
• Water excluded from conservation requirements under Title 45 due to waterlogging. This exemption is to be reviewed on a periodic basis, not to exceed 15 years.
4.3 Local County/City Regulations
City of Tucson Water Consumer Protection Act (WCPA) The City of Tucson (Tucson Water) initiated the delivery of Colorado River water to Tucson residents via the Central Arizona Project (CAP) aqueduct in 1992. In 1994, delivery of CAP water was terminated after customers experienced broken water mains and “brown water”. High levels of TDS and pH levels different from previous water sources are blamed for the CAP water problems. To ensure that Tucson Water would be prohibited from directly delivering CAP water to water customers in the future, the City of Tucson voters passed the 1995 Water Consumer Protection Act (WCPA) regardless of the opposition of the community's elected officials. The WCPA placed limits on TDS levels and limits on where and how CAP water could be used. Voters understood the necessity for augmenting water supplies with the use of CAP and, therefore, allowed Tucson Water to recharge CAP. Tucson Water developed the Clearwater Renewable Resource Facility in Avra Valley. This facility is composed of multiple recharge basins used to recharge the aquifer and recovery wells that are used to withdraw the recharged water and pump it into the Tucson Water potable water system. Eventually the amount of TDS in the water pumped from Avra Valley will increase from the current 200 mg/L to around 450 mg/L as more and more CAP water is recharged and recovered.

14
5.0 Water Supply, Adequacy, Reliability, and Quality
The quantity and quality of brackish groundwater in central Arizona needs to be evaluated to determine the viability of using this source to augment current potable water sources. With brackish water, the main quality constituent of concerns is TDS; however, several other constituents can affect treatment selection and concentrate management strategies. In addition to water quality, groundwater quantity needs to be examined. This can be done within specific areas to determine where new groundwater wells can be added without impact to current pumping practices. As mentioned above in Section 4.2, an area that appears to contain sufficient brackish groundwater is in the waterlogged area near Buckeye/Goodyear. The supply and reliability of this groundwater source is being examined by the West Valley Central Arizona Project Subcontractors (WESTCAPS). The results of the WESTCAPS study are summarized below in section 5.2 with the final report included in Appendix C.
5.1 Brackish Water Quality
5.1.1 TDS TDS is the sum of the concentrations of dissolved minerals in water. Sources of high TDS include soluble mineral deposits, urban and agricultural runoff, and concentration of salts by evapotranspiration. The concentration of salts by evapotranspiration is particularly important in arid regions, such as central Arizona. As the water placed on crops or landscaping evaporates, or is taken up by the plants root system, the salts are left behind. Subsequent waterings and/or precipitation will mobilize, or leach, the salts in the surface and subsurface soils to the extent that the salts will ultimately reach the underlying groundwater.. As discussed above in Section 4.1, the EPA has established a secondary MCL for TDS. Secondary MCLs are set based on aesthetic properties, such as taste and odor, rather than on health effects. Although there is some research that indicates that high TDS may cause adverse health effects, such as diarrhea, high TDS water is usually rejected as a drinking water source due to the taste or the presence of a particular constituent that exceeds a primary drinking water standard. In general, water with a TDS over 1,200 mg/L is designated at unacceptable for human consumption by the World Health Organization (1996). Groundwater quality records from ADWR’s Groundwater Site Inventory database, Salt River Project’s (SRP’s) wells, and CASS members were examined to determine the extend of brackish water in the Phoenix AMA. Data from a total of 592 wells within the Phoenix AMA were compiled and reviewed. Summary statistics for the TDS data are shown below.

15
Table 5.1 – Study Area Well Data
Number of
Wells
Maximum TDS
(mg/l)
Minimum TDS
(mg/l)
Mean TDS
(mg/l)
Number of Wells Above 1,000 mg/l
Percentage of Wells above 1,000 mg/l
592 5,700 501 1,471 340 57% As stated in Section 2.0 above, brackish groundwater is defined as having a TDS concentration between 1,000 and 10,000 mg/L. The reported location of the 592 wells is shown on Figure 5.1, which are mostly located in the WSRV. The WSRV has historically been dominated by irrigated agriculture, although much of it is currently being developed. A U.S. Geological Survey (USGS) map, published in 1974, indicates that groundwater beneath much of the WSRV has elevated TDS (Osterkamp, 1974). Groundwater in certain portions of the East Salt River Valley (ESRV), which includes Mesa, Chandler, and Tempe, also contains elevated TDS levels. However, there are several municipal production wells located within these areas of elevated TDS that produce groundwater containing less than 1,000 mg/l TDS. The variation of TDS concentrations reported in the different wells is most likely attributable to the total depth of the wells and screened intervals, i.e. the portion of the aquifer producing water. In areas where there are multiple alluvial aquifers, it is common for the uppermost aquifer to contain the highest TDS concentrations while the deeper aquifers have lower concentrations. For this reason, plotting the aerial distribution of TDS can be misleading if the screened interval and total depth of the wells being used is not taken into account.

16
Figure 5.1 – TDS Wells from ADWR In 2000, the USGS published a detailed study of water quality in the Central Arizona Basins (Cordy, et. al, 2000). The study covered an area of 34,700 square miles in central and southern Arizona and northern Mexico. One of the noted findings in the study was the elevated nitrates and TDS in the shallow groundwater in the WSRV. The USGS noted that in the area of the town of Buckeye, north of the Gila River, corresponding to the ADWR TMP defined “waterlogged area”, there are distinctive upper and lower alluvial aquifers separated by low-permeability clay layers. This area has historically been used for agricultural cultivation. The study evaluated water quality data based on well depth and concluded that wells completed in the shallow (uppermost) aquifer had a median TDS concentration of 3,050 mg/l and a median nitrate concentration of 19 mg/l. Wells completed in the deeper aquifer, that is, below the low-permeability clay layer(s), contained a median TDS concentration of 702 mg/l and a median nitrate concentration of 1.9 mg/l. The one or more clay layers, which occurred at depths from 150 to 400 feet below ground surface, provided a protective barrier to the deeper aquifer. 5.1.2 Other Constituents Dissolved solids typically include the major ions of calcium, magnesium, sodium, potassium, nitrate, sulfate, carbonate, bicarbonate and chloride. However, high TDS water may also contain elevated concentrations of other ions which may exceed primary drinking water standards or interfere with water treatment. The constituents listed in Table 5.2 are from shallow wells located in the waterlogged area near Buckeye. The constituents listed tended to be present in high concentrations in the brackish water wells.

17
Table 5.2 – Constituents with High Water Quality Levels Constituent Number of
Wells Minimum
Value Maximum
Value Mean Value
Nitrate as NO3 (mg/l)
11 4 102 57
Hardness as CaCO3 (mg/l)
9 41 2200 803
Silica as SiO2 (mg/l)
15 18 56 30
The federal primary MCL and Arizona Aquifer Water Quality Standard (AWQS) for nitrate (as nitrogen) are 10.0 mg/l. Of these wells, 64 percent exceed the MCL and AWQS and would require treatment for potable water uses. This is consistent with the 1974 USGS map (Osterkamp, 1974), which also showed some overlap between the areas of high TDS and high nitrate. Although there are no established drinking water standards for hardness or silica, these constituents can affect the treatment process and should be considered in designing a treatment facility.
5.2 Brackish Water Quantity
Within the WSRV, brackish groundwater is mostly concentrated within the southern portion of the Phoenix AMA, as shown on Figure 5.1, with the highest TDS concentrations being in the waterlogged area. Figure 5.1 also shows the distribution of wells and their respective TDS concentration. In some areas, the wells are clustered together while in other areas they are widely scattered. The distribution of the wells in this area would suggest two separate types of water treatment methodologies be utilized. For those wells clustered together, a wellfield could be constructed that would pump the brackish groundwater to a centralized treatment plant. For the outlying wells, a more individual approach consisting of wellhead treatment would be the most feasible treatment method.. Although the treatment technologies for the two methods may be similar, the economics will be quite different. Although the areal extent of brackish groundwater in the area of the WSRV has been defined, the quantity, or approximate volume, of this water needs to be evaluated to determine the long-term availability of this source for future potable water uses. The following sections discuss the water availability for the WSRV and ESRV. 5.2.1 WSRV Water Quantity As discussed above in Section 5.0, WESTCAPS is studying the brackish groundwater quantity in the waterlogged area near Buckeye. This area seems to be the best example of a potential brackish water wellfield, since this area is continually pumped to maintain current groundwater levels. To quantify the amount of water in the area, the ADWR 2002 SRV groundwater model is being used to determine the long term viability of this source. Several modeling scenarios are currently being evaluated. Additional information on the WESTCAPS study will be provided in the final report once the modeling is completed. A complete copy of the study report is included in Appendix C.

18
5.2.2 ESRV Water Quantity There is less data available for the ESRV, and therefore, it is difficult to draw conclusions about the availability of brackish groundwater in the ESRV. However, the USGS map and Figure 5.1 indicate that, at least in the shallow aquifer, there are areas containing high TDS groundwater. There may be many individual wells, particularly shallow irrigation wells, in the ESRV that could be converted to drinking water use if treated for TDS and nitrate. The Centerra Well treatment system, described in section 3.1 of this report, is a good example of this type of project.
19
6.0 Treatment Technology
6.1 RO and Membranes
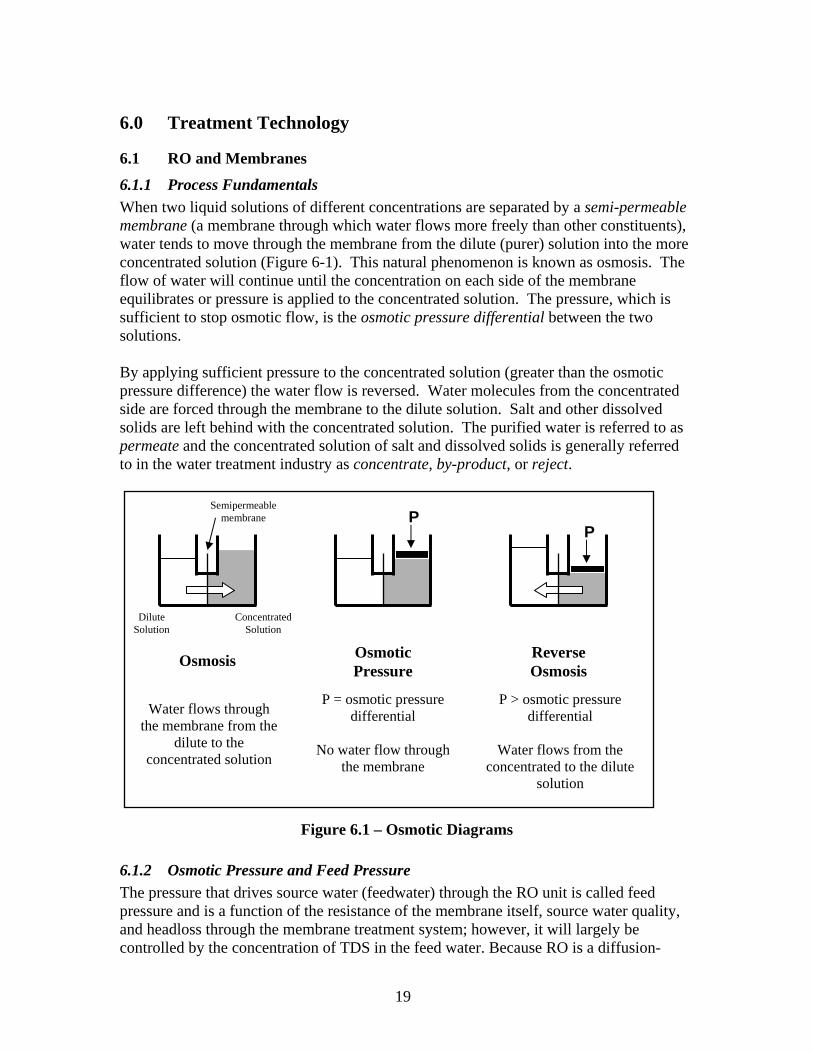
6.1.1 Process Fundamentals When two liquid solutions of different concentrations are separated by a semi-permeable membrane (a membrane through which water flows more freely than other constituents), water tends to move through the membrane from the dilute (purer) solution into the more concentrated solution (Figure 6-1). This natural phenomenon is known as osmosis. The flow of water will continue until the concentration on each side of the membrane equilibrates or pressure is applied to the concentrated solution. The pressure, which is sufficient to stop osmotic flow, is the osmotic pressure differential between the two solutions. By applying sufficient pressure to the concentrated solution (greater than the osmotic pressure difference) the water flow is reversed. Water molecules from the concentrated side are forced through the membrane to the dilute solution. Salt and other dissolved solids are left behind with the concentrated solution. The purified water is referred to as permeate and the concentrated solution of salt and dissolved solids is generally referred to in the water treatment industry as concentrate, by-product, or reject.
Figure 6.1 – Osmotic Diagrams
6.1.2 Osmotic Pressure and Feed Pressure The pressure that drives source water (feedwater) through the RO unit is called feed pressure and is a function of the resistance of the membrane itself, source water quality, and headloss through the membrane treatment system; however, it will largely be controlled by the concentration of TDS in the feed water. Because RO is a diffusion-
P = osmotic pressure differential
No water flow through
the membrane
P > osmotic pressure differential
Water flows from the
concentrated to the dilute solution
Dilute Solution
Concentrated Solution
Osmosis
Semipermeable membrane
Osmotic Pressure
P
Reverse Osmosis
Water flows through the membrane from the
dilute to the concentrated solution
P

20
based membrane process, osmotic pressure must be overcome before purified water can be produced. Osmotic pressure is directly dependent on the salt concentration of the source water. As a rule of thumb, each 100 mg/L of TDS is roughly equivalent to one pound per square inch (psi) of osmotic pressure. Brackish water applications will have an osmotic pressure of 30 to 300 psi, while seawater applications are closer to 550 psi. Temperature is also an important consideration in determining feed pressure. As temperature varies, so will the feed pressure due to changes in viscosity of the feed water. Lower temperatures require higher feed pressures to produce the same amount of permeate water. 6.1.3 Contaminant Removal Efficiencies While RO removes the majority of dissolved constituents, there still exists a minimal amount of salt passage, which will be affected by several factors, including:
• Feed water quality, • Applied feed pressure to affect permeate flow, • Recovery, and • Material properties of the membrane itself.
Each membrane has a salt rejection specification, which is measured by the manufacturer before shipment and expressed as a percent removal of sodium chloride (typically 98 to 99.5 percent for RO membranes). As a RO system operates over time, salt rejection can change depending on the level of membrane fouling. There are many ways to calculate salt rejection of a membrane and data normalization plays an important role in evaluating membrane performance. 6.1.4 Flux Flux is the rate at which water is filtered through a unit area of membrane. Often expressed in gallons per day per square foot (gal/day/ft2), flux, is a useful tool to allow direct comparison of membrane performance. As opposed to low-pressure membrane processes (microfiltration and ultrafiltration), diffusion-based membrane systems are run at a constant flux to maintain consistent permeate water quality. Design flux rate is largely determined by feed water quality and is primarily controlled by the pressure applied to the system. Brackish surface water RO applications typically have a design flux of 10 to 14 gal/day/ft2, while brackish well water applications have a flux of 14 to 18 gal/day/ft2. 6.1.5 Water Quality Recovery Rates RO is a cross-flow membrane separation process, which separates the feed stream into a permeate stream and a concentrate or reject stream. The recovery of a RO plant is defined as a percentage of feed water that is recovered as permeate, and is calculated using the following equation.

21
100(%)Recovery ×=FeedFlow
owPermeateFl
Salt concentration in the concentrate or reject stream increases logarithmically with recovery rate. For example, at 50 percent recovery, the salt concentration in the reject is about double that of the feed, and at 90 percent recovery, the salt concentration in the reject is nearly 10 times that of the feed. Recovery rates are largely limited by the concentration of some sparingly soluble salts in the feed water and thus in the concentrate or reject stream. If recovery is pushed beyond the saturation limits of one or more of these constituents, precipitation will begin to occur on the membrane surface, causing scale. Table 6.1 provides a summary of some typical saturation limits. As the membrane fouls, decreased flux and increased salt passage may also occur, adversely impacting permeate water quantity and quality. Consequently, the design recovery rate of a RO plant is established after careful consideration of:
• Desired product quality, • Solubility limits of the feed water constituents, • Feed water availability, and • Concentrate or reject disposal requirements.
Table 6.1 – Typical Saturation Limits for Sparingly Soluble Salts
Sparingly Soluble Salt
Units Membrane Supplier 1
Concentrate Stream
Saturation Limit
Scale Inhibitor Supplier 2
Concentration Stream Saturation
Limit Calcium Carbonate LSI +1.8 +1.8 to +3.0 Calcium Sulfate % Saturation 230 240 to 700 Barium Sulfate % Saturation 6,000 6,500 to 10,500 Strontium Sulfate % Saturation 800 3,000 to 3,500 Calcium Fluoride % Saturation - 100,000 to 1,300,000 Silica % Saturation 100 100 to 320 Iron mg/L <0.1 0.5 Manganese mg/L - 0.5 Aluminum mg/L - 0.5 Notes:
LSI: Langelier Saturation Index Solubility and saturation are dependent on temperature, pH, ionic strength, and pressure. 1 Saturation limits specified in standard performance warranty agreement. 2 Saturation limit varies based on scale inhibitor type and supplier.

22
6.1.6 Nature of Concentrate Products When designing a RO system, design software is often used to model the system design and predict the concentrations of salts in the reject stream, based on feed water quality and the specific membrane being used. Once saturation limits are exceeded and precipitation begins, scale forms, clogging the membrane surface. However, chemical anti-scalants can be used to artificially raise the solubility limits of certain salts, and thus control scaling within limits. The saturation limits shown in Table 6.1 are typically used by the scale inhibitor suppliers in standard performance warranty agreements. 6.1.7 Pre-Treatment Requirements Sulfuric acid, carbonic acid, or hydrochloric acid can be used as pretreatment to RO in order to depress pH and mitigate scaling due to calcium carbonate. Additionally, it is common place to add threshold inhibitor compounds (also referred to as scale inhibitor or anti-scalant) to prevent precipitation of sparingly soluble salts within the RO system. Careful selection of appropriate scale inhibitor may allow the RO plant to operate at higher recoveries and thus control the amount of concentrate requiring ultimate disposal. Brackish water RO applications may need additional pretreatment units to remove colloidal and suspended solids in order to ensure a low silt density index (SDI) in the feed water. The SDI is measurement of the fouling tendency of water based on the timed flow of water through a membrane filter at constant pressure. In general, it is desirable to reduce feed water SDI to less than 5.0 and turbidity to less than 1.0 NTU (nephelometric turbidity units). Automatic backwashing strainers, granular media filtration, microfiltration, and ultrafiltration are all efficient means of particulate removal. However, wellhead treatment systems and large brackish water systems often have only cartridge filters provided as pretreatment. 6.1.8 RO System Configurations The RO membrane is produced in sheet form - up to 60 inches wide and lengths up to 1,500 feet. The membrane is then assembled into a packaging configuration known as a spiral wound element. Figure 6.2 shows the spiral wound packaging configuration. The spiral wound element consists of two sheets of membrane separated by a grooved, polymer-reinforced fabric material. This fabric both supports the membrane against the operating pressure and provides a flow path for egress of the permeate. The membrane envelope is sealed with an adhesive on three sides to prevent contamination of the permeate. The fourth side is attached to a product water tube, which has perforations within the edge seal so the product water can be removed from the porous product water carrier material. The membrane envelope is rolled up around the central product water tube, with a plastic mesh spacer between the facing membrane surfaces, in a spiral. The mesh spacer not only serves to separate membrane surfaces, but it provides a flow path for, and turbulence in, the feed/reject stream of each element. The elements have an outer wrap to contain the feed/reject stream in the mesh passageway and brine seal to insure that the feed/reject stream goes through the element and not around it.

23
Figure 6.2 – Spiral Wound RO Element Construction Spiral wound elements are available in lengths from 12 to 60 inches and diameters from 2 to 12 inches. Standard large-scale elements are available in 8-inch diameter and either 40 or 60 inches long. Packaging densities range from 510 to 575 square feet of active membrane surface area per 8 inch x 60 inch element. Multiple spiral wound elements are installed into a pressure vessel, which is usually fabricated from fiberglass reinforced plastic. Pressure vessels are typically designed and fabricated to accommodate combinations of 40- and 60-inch elements and operating pressures of 450 or 600 pounds per square inch gauge (psig), depending on the pressure vessel model. Figure 6.3 shows a pressure vessel with elements installed. Feedwater enters one end of the pressure vessel and flows through the first element, in which about 10 percent of the feed permeates through the membrane and into the product water tube. The reject from the first element flows to and through the second element and the reject from this element becomes the feed to the next element, and so on. The reject from the last element is routed from the pressure vessel to the high-pressure reject manifold. In a single pressure vessel with six elements, between 40 and 60 percent of the feed water to the pressure vessel is recovered as product water. To achieve higher recoveries, the overall RO system is configured to operate multiple pressure vessels, each feeding off the reject of the previous pressure vessel. The example shown in Figure 6.4 has three membrane banks or stages, operating at 85 percent recovery in a 24:10:5 (vessel) array. Note that the second bank has half as many vessels
PERMEATE
FEED
REVERSE OSMOSIS MEMBRANE
PERMEATE CARRIER
GLUE LINE
FEED/REJECT SPACER
REJECT
PERMEATE
FEEDSEALED AROUND OUTSIDE EDGE
REVERSE OSMOSIS MEMBRANE
PERMEATE CARRIER
GLUE LINE
FEED/REJECT SPACER
REJECT

24
as the first bank because the second bank feed flow is approximately half that which feeds the first bank. In this way, adequate velocities are maintained through all elements in the system.
Figure 6.3 – RO Element Assembly within Pressure Vessel
Figure 6.4 – Typical Membrane 24:10:5 Array
Feed
Concentrate
Permeate
Head End Adapter R.O. Element
Interconnector O-rings Brine Seal
Pressure Vessel
Retaining Ring
Head Seal Thrust Cone
Each vessel shown at left represents a column of vessels as shown below
RO Feed Permeate
Concentrate
1st Bank 24 Vessels
2nd Bank 10 Vessels
3rd Bank5 Vessels

25
6.1.9 Post Treatment Requirements As a consequence of the RO treatment, the dissolved gas content of the product water can be corrosive to pipes and, hence, post-treatment is used to condition and stabilize the permeate before injection into the distribution system. For stabilization, lime addition is used to add calcium hardness back to the water to generate a water that will not degrade the distribution system. For brackish water systems, stabilization can sometimes be accomplished by using bypass blending, where a portion of the feed water is diverted around the RO system and re-blended with permeate. This reduces the amount of RO treatment equipment and additionally imparts hardness to adjust finished water stability. In most instances, sodium hydroxide is added to adjust pH to an acceptable range. 6.1.10 Life Cycle Costs As RO treatment of brackish water has become more acceptable, the size of the facilities that have been constructed, or are currently in the design or construction phase, has increased. This has led to a better understanding of the actual capital, operating, and construction cost of the water treatment facilities. The life cycle costs, consisting of capital, operating and maintenance (O&M), of five RO facilities are presented below in Table 6.2.
Table 6.2 – Life Cycle Cost of Various RO Facilities
System
Capacity (in
MGD)
Capital Cost (in 2005 $)
Annual O&M
Present Worth of
O&M
Total Present Worth
$ per Gallons per Day
of Permeate
South Coast Water District 0.9 $5,500,000 $419,666 $5,364,734 $10,864,734 $12.07Irvine Ranch Water District 2.11 $9,832,883 $741,806 $9,482,769 $19,315,652 $9.15Chino II Desalter 6.5 $14,500,000 $1,699,308 $21,722,866 $36,222,866 $5.57El Paso RO 15 $29,300,000 $3,694,146 $47,223,585 $76,523,585 $5.10Orange County Groundwater Replenishment System (GWRS) 70 $82,000,000 $13,344,408 $170,586,315 $252,586,315 $3.61Notes: 1. Capacity is based on actual RO system permeate production capacity, not the blended product
capacity. 2. Capital costs are based on bid prices and adjusted to May 2005 based on the Engineering News
Record Cost Index. All of the projects have bid within 6 months of May 2005 with the exception of the OCWD GWRS Project.

26
3. O&M costs were established for all of the facilities based on the same water quality. All of the projects are under construction and, therefore, do not have actual O&M data.
4. O&M costs are based on power for RO and product pumping, chemicals (sulfuric acid, threshold inhibitor, chlorine, sodium hydroxide), labor and maintenance costs.
5. Maintenance costs were based on an annual expenditure of 1 percent of the capital cost over the life of the system.
6. The O&M cost includes the membrane costs from the projects. 7. Present Worth was calculated based on 25 year life and 6 percent interest. 8. The $ per gallon per day of permeate production based on the present worth takes the overall
present worth divided by the gallons per day of treatment capacity. Figure 6.5 shows the Capital, O&M, and Present Worth as a function of the RO permeate production capacity. Additionally, the graph shows the $ per gallon per day of treated capacity based on the present worth value.
Figure 6.5 – RO System Life Cycle Cost
Life Cycle Cost
$0
$50
$100
$150
$200
$250
$300
0.9 2.11 6.5 15 70
Mill
ions
RO Permeate Capacity, MGD
Cap
ital,
O&
M a
nd P
W C
osts
$0.00
$2.00
$4.00
$6.00
$8.00
$10.00
$12.00
$14.00
$/gp
d of
PW
Total PW Capital Cost Annual O&M PW $/gpd

27
6.2 Membranes/Nanofiltration
Nanofiltration (NF) is similar to RO in that it is a diffusion-controlled process. However, NF has a slightly larger molecular weight cutoff and can remove particles up to 0.001 microns, which results in lower operating pressures. This makes NF ideal for removal of larger contaminants, such as divalent ions including the hardness elements calcium and magnesium, disinfection by-product precursors, color, and pesticides. However, NF will not effectively remove the smaller monovalent salts, such as sodium chloride, and it is not likely to be an effective solution for desalination.
6.3 Membranes/Forward Osmosis
Forward osmosis (FO) is a developing membrane technology which is being researched at Yale University. Additional development of the process is being conducted by the Bureau of Reclamation and the US Army Corp of Engineers. As with other membrane processes, forward osmosis (FO), works by separating water from dissolved solids via a semi-permeable membrane. However, unlike RO, the FO process utilizes an osmotic pressure gradient by using a “draw solution” which is very high in dissolved solids and has a significantly higher osmotic pressure that the saline feed water. Feed water then flows on one side of the membrane and water is naturally transported from the feed water across the membrane to the ‘draw solution’ side by osmosis. The drawing solute is then removed from the product water and recovered for future use, leaving the high quality permeate water. The potential advantage of FO is reduced energy costs because it uses osmotic pressure to drive the process and not hydraulic pressure. Since energy used to create hydraulic pressures is typically the most significant cost component of desalination, FO has great economic potential for driving down the cost of desalination. Further research on thinner membranes and a more suitable drawing solute is required prior to implementation of this technology on a commercial scale. Some of the criteria for the ideal driving solute are; low-cost, easily recoverable from permeate, non-toxic and rejection by the membrane. An experimental solute has been ammonium bicarbonate. Ammonium bicarbonate is highly soluble and can produce very large osmotic pressures which yield high water fluxes. Upon moderate heating, ammonium bicarbonate decomposes into ammonia and carbon dioxide gases that can be separated and recycled, leaving the fresh product water.

28
Figure 6.6 – Flow diagram of a FO system
6.4 Electrodialysis (ED) /EDR
6.4.1 Process Fundamentals Electrodialysis (ED) and EDR (electrodialysis reversal) is the process that desalinates brackish water using electrical currents and semi-permeable membranes. ED works by using a direct electrical current to divide negatively-charged ions (anions) and the positively-charge ions (cations) from its salt solution. A semi-permeable membrane then allows either cations or anions to pass, while blocking the passage of the other ion. For example, a cation permeable membrane allows cations to pass, while it prohibits anions from passing through. ED does not remove bacteria or particles that are not charged. With ED, the membrane surface often becomes clogged (or scaled) with buildup of salts and organic material. In addition, ED does not address organics, microorganisms, and taste and odor constituents. EDR evolved from ED in the early 1970’s to deal with scaling issues seen with ED. EDR is the same process as ED, except the polarity of the anode and cathode is periodically reversed. This reversal dissipates and prevents buildup of scale on the membrane, which in turn reduces the need for using anti-scalant chemicals and improves the overall life of the membrane. 6.4.2 Recovery Rates Permeate recovery in the newest EDR systems can range from 50 to 94 percent. The rate of recovery will depend on the number of stacks used in the EDR plant. A stack is composed of the source water inlet, semi-permeable membranes, spacers to separate the membranes (thereby providing a “channel” for the water being treated), the electrodes

29
and the end plates. A single stage can remove up to 60 percent of TDS in the source water with additional stacks (stages) required for additional recovery. 6.4.3 Power Consumption The electric power consumption is directly related to the recovery rate and the salinity of the source water. For example, power consumption is approximately 2 kilowatt hours per 1,000 gallons of product water for a 1,000 mg/l reduction in TDS. The temperature of the source water also plays a role in power consumption. Optimal temperature for source water is 70 degrees Fahrenheit (º F). For each degree above or below 70º F, power consumption will decrease or increase by 1 percent, respectively. 6.4.4 Pre-Treatment Requirements The use of membranes is often prohibited by the chemical constituents in the source water. EDR does not have as much sensitivity as other membrane technologies, such as RO. Silica, silt density, and turbidity contribute to clogging of the RO membranes, but are not limiting factors for EDR. Iron, manganese, and hydrogen sulfide may cause some fouling of the EDR membrane if levels exceed 0.3 parts per million (ppm) for iron, 0.1 ppm for manganese, and 1 ppm for hydrogen sulfide. Pretreatment for EDR should involve the removal or reduction of iron and manganese if levels exceed recommended concentrations. Additionally, alkaline scale may build up on the concentrate side of the membrane, but this can be remedied by the addition of acid to the source water. EDR pretreatment should also include filtration to reduce suspended solids in the source water. 6.4.5 Life Cycle Costs Generally, EDR membranes have a life of 10 years. This timeframe is influenced by whether the membrane is a cation or anion membrane and damage incurred from attempting to clean membranes. Cation membranes usually last longer than anion membranes, because the anion membranes suffer oxidation from chlorine and fouling by organics. Electrode life for EDR is typically 3 years. The capital cost for a 2-MGD EDR unit is estimated to be about $4.7 million (Watson, 2003). The O&M costs for this size unit are estimated at $0.57 per 1,000 gallons. Therefore, a 25-year life cycle cost at 6 percent interest is approximately $3.00 per gallon per day.
6.5 Thermal Processes - Distillation
Distillation involves heating a saline solution to boiling in order to evaporate the pure water while leaving the salts (dissolved solids) behind in solution. The vapor then condenses on a cooler surface to form liquid water, free from dissolved solids. There are three distillation processes that have been developed for large-scale desalination processes:

30
• Multiple effect distillation • Multi-stage flash distillation • Vapor compression distillation
Two main problems occur with distillation: scaling and corrosion. Scaling is caused by calcium sulfate, calcium carbonate, and/or magnesium hydroxide. These compounds reduce the overall heat transfer of the distillation unit. Therefore, pre-treatment is required to reduce scaling within the process. In addition to scaling, distillation plants are subject to corrosion, which is primarily due to the product water being very aggressive due to the lack of minerals in the water. Therefore, post-treatment is required to stabilize the product water. This can be done by adding chemicals or blending with source water to meet the required water quality goals. Distillation has the highest capital and O&M costs of all desalination processes. This is mostly due to the significant amount of energy required to boil water. Therefore, distillation plants are often co-located with power-generating facilities. This can reduce the fuel costs by 60 to 70 percent (Watson, 2003).
6.6 Concentrate Management
With each of the desalination technologies discussed above, concentrate is produced. This concentrate is significantly higher in TDS than the source water. In addition, for brackish groundwater sources, other constituents, such as arsenic and nitrates, may also be significantly concentrated. The concentration of these constituents can play a significant role in developing a concentrate management plan. Currently, there are two main concentrate disposal methods used in Arizona: sewer disposal and evaporation ponds. With sewer disposal, the capacities of both the sewer system and the wastewater treatment plant (WWTP) require the ability to handle the additional loading of TDS, other constituents, and flow. Typically, large WWTP can handle concentrate easily; however, the smaller plants may have treatment problems if the flow or TDS is too high. The second disposal method, evaporation ponds, works well, especially in Arizona’s hot, dry climate. The restrictions with evaporation ponds include the land availability and capital costs for double lining the ponds. For small flow streams, evaporation ponds can be very economical, provided land is available. However, if there are any private or municipal groundwater wells located downgradient of the evaporation pond(s), the well owner(s) may object to having the ponds upgradient of their wells in the event there is a leak. Given the current concentrate management choices, water providers are limited by the amount of brackish water that can be desalinated. Without better means to deal with concentrate management issues, the use of brackish water for potable means is limited. Additional research and development of technologies is required to deal with the concentrate issue.

31
7.0 Conclusions
Through the review of existing brackish treatment facilities, regulatory codes, water quantity and quality, and several treatment processes, the use of brackish groundwater in central Arizona to supplement potable water supplies can be determined. Based on the work completed to date, the following conclusions in regard to viability of brackish groundwater desalination can be made. • Benchmarking – Brackish groundwater in the southwestern U.S. is desalted using
either RO membranes or EDR. RO seems to be more prominent due to the need to remove other constituents in addition to TDS. The most common concentrate disposal methods include evaporation ponds, discharge to sanitary sewers, and ocean outfalls.
• Regulatory Issues – Permeate from the desalination of brackish groundwater will need to meet all federal, state, and local water quality regulations. In addition, pumped groundwater must meet ADWR’s Groundwater Management Code to assure long-term water supplies. However, there may be some relief of this requirement in certain waterlogged areas.
• Water Quantity and Quality – Water quantity in the WSRV is still under
investigation to determine the long-term viability of this water source. However based on water quality data available from ADWR and CASS participants, it appears that this brackish groundwater source will need to be treated for nitrates and silica in addition to TDS.
• Treatment Options – RO and EDR are the most viable treatment options at this time
for brackish groundwater desalination. However, EDR is a sole source product, which may limit the ability for utilities to use this technology. In addition, feed water quality may dictate which technology should be used. In many cases, it may be beneficial to use a blending scenario in order to meet water quality goals. These blending scenarios may also mitigate the need to post-treat or stabilize water prior to sending to the distribution system.
• Concentrate Management – Two main concentrate disposal alternatives are
currently being used by desalination facilities: evaporation ponds and sanitary sewer discharge. Both technologies have downfalls that may limit the amount of brackish groundwater than can be utilized. Until new concentrate management options are developed, the use of brackish groundwater is limited.
7.1 Future Research Needs
As the population in the Phoenix metropolitan area continues to grow from 3 million to 12 million, future additional water sources will be needed. Brackish groundwater may provide an additional source; however, there are currently several limitations to implementing the use of this water source. The main limitation is the lack of convenient

32
concentrate management strategies. At present, sewer disposal or evaporation ponds are most commonly used. The drawbacks to evaporations ponds include the large amount of land needed and acceptability by nearby well owners and residential neighbors. Therefore, sewer disposal is generally the most popular option assuming that the surrounding sewer system and WWTP can handle the additional load. Since these concentrate management options are not viable long-term solutions, future research, which focuses on evaluating additional concentrate options/technologies, is necessary. Along with concentrate management technologies, the further advances of RO and EDR technologies to recover more water, and thus produce less brine, is also desirable. This research may include developing better membranes for RO and EDR or development of new desalination technologies, such as FO.

33
8.0 References
Guidelines for Drinking Water Quality, 2nd ed. Vol. 2. Health criteria and other supporting information. World Health Organization, Geneva, 1996. Watson, Ian C.; O.J. Morin; Lisa Henthorne. Desalting Handbook for Planners. Third Edition. U.S. Department of Interior, Desalination Research and Development Program Report No. 72. 2003. Frank, Kurt F.; Edward P. Geishecker. Using Electrodialysis to Meet Drinking Water Requirements. Arizona Water & Pollution Control, 72nd Annual Conference, 1999. Arizona Department of Water Resources. Phoenix Active Management Area, Third Management Plan. http://www.azwater.gov/WaterManagement_2005/Content/AMAs/PhoenixAMA/default.htm. U.S. Environmental Protection Agency, Setting Standards for Safe Drinking Water. http://www.epa.gov/ogwdw/standard/setting.html. U.S. Environmental Protection Agency, Drinking Water Priority Rulemaking: Microbial and Disinfection Byproduct Rules. http://www.epa.gov/ogwdw/mdbp/mdbp.html. Jurenka, Robert A.; Michelle Chapman-Wilbert. Maricopa Ground Water Treatment Study. U.S. Department of Interior, Water Treatment Technology Program Report No. 15. February 1996.

Central Arizona Salinity Study A-1 Brackish Water Subcommittee
Appendix A Benchmarking Project Summaries

Central Arizona Salinity Study A-2 Brackish Water Subcommittee
Bench Marking Table of Contents
Paper/Presentation Page Arizona: 1 City of Goodyear - Centerra Wellhead RO Project A-4 2 Gila Bend RO A-12 3 Tempe Bottling Plant A-14 4 Buckeye EDR A-15 5 Lewis Prison EDR A-16 6 Scottsdale Groundwater Study A-18
California: 8 City of Oceanside - Mission Basin Desalter A-19 9 Sweetwater Authority - Chula Vista Facility A-21 11 Chino Basin Desalter Authority - Chino I Desalter A-22 12 Chino Basin Desalter Authority - Chino II Desalter A-24 13 West Basin MWD - Marv Brewer Desalter A-26 36 Goldworthy Desalter, Torrance A-27
Florida: 14 Tampa Bay A-29 16 Operation of Hydranautics' New ESNA Membrane at St. Lucie
West FL Softening Plant A-31
Nevada: 17 Southern Nevada Water Authority A-32
Texas: 18 El Paso RO - 27 MGD RO Plant A-34 20 Brazos River Water Authority: Lake Granbury RO Plant A-35 35 Cypress Water Treatment Plant, Witchita Falls A-37 21 Fort Stockton A-39
Others: 22 Stanton WTP in New Castle County, Delaware A-40 24 Using Electrodialysis to Meet Drinking Water Requirements A-41 25 Full-Scale Evaluation of Reverse Osmosis Concentrate Water
Quality for Compliance with Surface Water Discharge Regulations
A-46
26 Desalination Concentrate Management and Issues in the United States
A-47
28 Waterlogging Within the Buckeye Water Conservation and Drainage District
A-48
30 Maricopa Groundwater Treatment Study (Avondale) A-48 31 Brine Disposal for Land Based Membrane Desalination Plants:
A Critical Assessment A-51
32 Shallow Aquifer Management Feasibility Study (Chandler) A-51 33 City of Suffolk, Virginia - EDR Groundwater Facility A-52

Central Arizona Salinity Study A-3 Brackish Water Subcommittee

Central Arizona Salinity Study A-4 Brackish Water Subcommittee
REFERENCE PLANT DATA SHEET
Location: Goodyear, Arizona Owner: City of Goodyear, Arizona Contact Person(s): Tom Galeziewski, PE Commissioning Date: 08/05/2004 NA Other Capacity/Size Current Capacity @ 2 mgd Capacity/Size Ultimate Capacity @ 2 mgd Source Water Type/Quality Ground Water TDS 1940 ppm Calcium 163 ppm Magnesium 69 ppm Sulfate 505 ppm Sodium 414 ppm Chloride 620 ppm Silica 8.6 ppm Iron 0.48 ppm Other Constituents Barium @ 0.04 ppm
Nitrate (as N) @ 17.0 ppm Arsenic @ 0.003 ppm
Pretreatment (See Legend below) Acid/AScl/CO Acid & CO to be added in future
Desal Process LPRO Recovery Rate 75 % Post Treatment Chem Stabl/De-carbonation/CO To be added in
future Blending NA Ratio 4:1 Other Concentrate Disposal To Sanitary Sewer/CO Permitting/Regulation Issues Comment: Permitted by Maricopa County Environmental Issues N/A Capital Cost, Total Plant NA $ 1.98M Other Capital Cost, Desal Equipment NA $ 0.90M Other Operating Cost, Excluding Debt Service
$ /AF $ /MG $ /CCF Other $0.93/1000 gal
Supplemental Information/Description: NA

Central Arizona Salinity Study A-5 Brackish Water Subcommittee
Goodyear, Arizona Groundwater Treatment Reverse Osmosis Project Project Summary HDR Design-Build, Inc. (HDR) of Phoenix, AZ is currently assisting the City of Goodyear, Arizona (COG) to design and construct facilities to provide approximately 1,800 gallons per minute (gpm) of potable water. The project includes equipping COG’s existing Centerra Well, construction of a 2.1-mile raw water transmission pipeline, and a 2.5 million gallon per day (mgd) reverse osmosis (RO) Emergency Water Treatment Facility. Treated water will enter the COG water system through an existing above-ground steel storage tank and booster pump station. Raw Water Source and Quality The Centerra Well was drilled in 1949 to supply irrigation water to local farmers. Its total depth is 1,000 feet, with a 20-inch diameter outer well casing extending the entire depth. In 2004, the well was rehabilitated with a 16-inch diameter inner well casing extending to 500 feet. The well has been filled in below a depth of 502 feet, and a concrete plug installed between 490 feet and 502 feet. The inner casing is perforated between 234 and 490 feet. The Centerra Well has historically been utilized as an irrigation well. It was converted to a municipal well as part of this project. The well’s existing equipment was replaced with a new 350 horsepower vertical turbine pump, motor, and variable frequency drive (VFD). The anticipated firm yield of the well is approximately 2,200 gpm. The anticipated well drawdown will be approximately 118 feet. Specific design criteria for the well are listed in Table 1. Water quality at the Centerra Well has been measured with the results summarized in Table 2.
Table 1 – Centerra Well Design Criteria
Well Characteristics
Borehole Depth, ft 1,000 Borehole Diameter, in 20 Outer Casing
Diameter, in 20 Depth, ft 1,000 Material Steel
Inner Casing Diameter, in 16 Depth, ft 500 Material Steel Screen/Perforation Depths, ft 234 to 490 Slot Size, in 0.085

Central Arizona Salinity Study A-6 Brackish Water Subcommittee
Gravel Pack Depth, ft 240 to 500 Material Silica Sand Cement Seal Depth, ft 0 to 240 Static Water Level, ft 116
Pump Characteristics
Type Vertical Turbine Service Raw Water Maximum Pump Speed, rpm 1,800 Speed Control Variable Frequency Drive Impeller Diameter, in 9.6875
Impeller Type Enclosed Number of Stages 6
Primary Design Point Flow, gpm 2,400 Head, ft 484
Efficiency, percent 85 Pump Intake Depth, ft 300 Pump Discharge Diameter, in 10
Motor Characteristics
Motor Power Requirements 480 volt, 3 phase, 60 Hz Minimum Motor Horsepower 350 Maximum Driver Speed, rpm 1,800 Minimum Motor Efficiency @ 100% Load, percent 94
Power Factor @ 100% Load 90 Service Factor 1.15 Enclosure Type Explosion Proof NEMA Design Type B
Table 2 – Design Raw Water Quality – Centerra Well
Parameter Value Parameter Value
Calcium, mg/L 163 Temperature, °F 51.8 Magnesium, mg/L 69 Total Dissolved Solids, mg/L 1,940
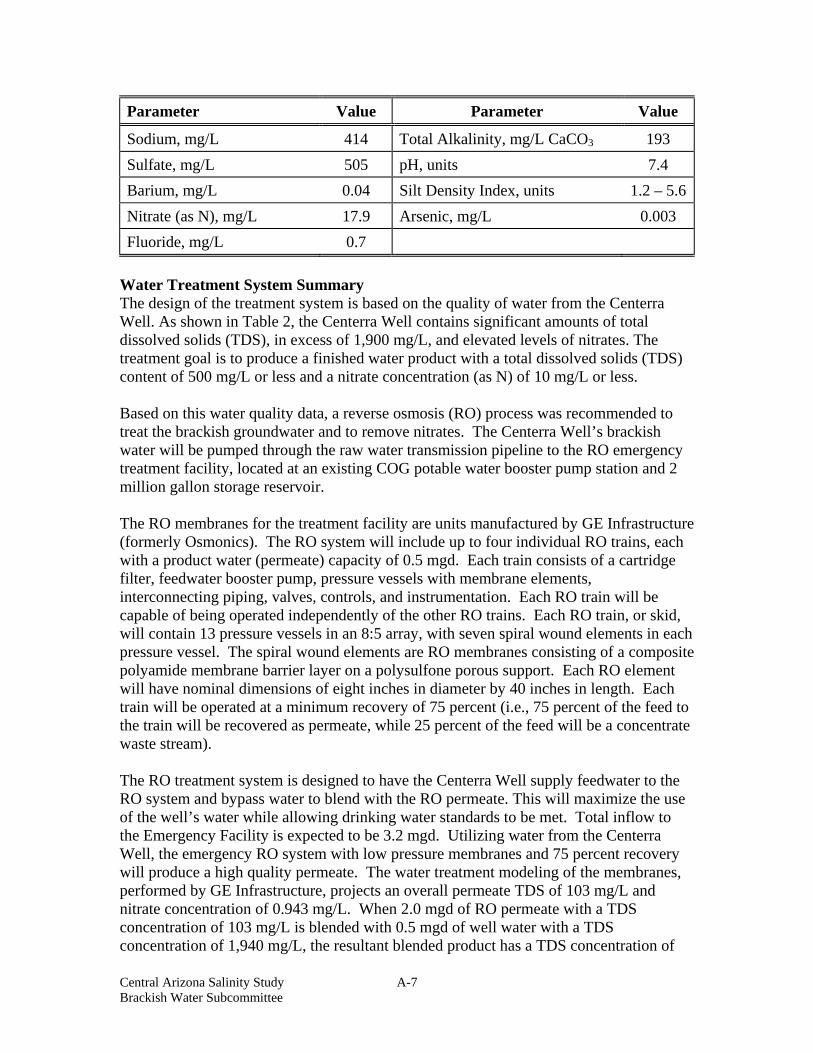
Central Arizona Salinity Study A-7 Brackish Water Subcommittee
Parameter Value Parameter Value
Sodium, mg/L 414 Total Alkalinity, mg/L CaCO3 193 Sulfate, mg/L 505 pH, units 7.4 Barium, mg/L 0.04 Silt Density Index, units 1.2 – 5.6Nitrate (as N), mg/L 17.9 Arsenic, mg/L 0.003 Fluoride, mg/L 0.7
Water Treatment System Summary The design of the treatment system is based on the quality of water from the Centerra Well. As shown in Table 2, the Centerra Well contains significant amounts of total dissolved solids (TDS), in excess of 1,900 mg/L, and elevated levels of nitrates. The treatment goal is to produce a finished water product with a total dissolved solids (TDS) content of 500 mg/L or less and a nitrate concentration (as N) of 10 mg/L or less. Based on this water quality data, a reverse osmosis (RO) process was recommended to treat the brackish groundwater and to remove nitrates. The Centerra Well’s brackish water will be pumped through the raw water transmission pipeline to the RO emergency treatment facility, located at an existing COG potable water booster pump station and 2 million gallon storage reservoir. The RO membranes for the treatment facility are units manufactured by GE Infrastructure (formerly Osmonics). The RO system will include up to four individual RO trains, each with a product water (permeate) capacity of 0.5 mgd. Each train consists of a cartridge filter, feedwater booster pump, pressure vessels with membrane elements, interconnecting piping, valves, controls, and instrumentation. Each RO train will be capable of being operated independently of the other RO trains. Each RO train, or skid, will contain 13 pressure vessels in an 8:5 array, with seven spiral wound elements in each pressure vessel. The spiral wound elements are RO membranes consisting of a composite polyamide membrane barrier layer on a polysulfone porous support. Each RO element will have nominal dimensions of eight inches in diameter by 40 inches in length. Each train will be operated at a minimum recovery of 75 percent (i.e., 75 percent of the feed to the train will be recovered as permeate, while 25 percent of the feed will be a concentrate waste stream). The RO treatment system is designed to have the Centerra Well supply feedwater to the RO system and bypass water to blend with the RO permeate. This will maximize the use of the well’s water while allowing drinking water standards to be met. Total inflow to the Emergency Facility is expected to be 3.2 mgd. Utilizing water from the Centerra Well, the emergency RO system with low pressure membranes and 75 percent recovery will produce a high quality permeate. The water treatment modeling of the membranes, performed by GE Infrastructure, projects an overall permeate TDS of 103 mg/L and nitrate concentration of 0.943 mg/L. When 2.0 mgd of RO permeate with a TDS concentration of 103 mg/L is blended with 0.5 mgd of well water with a TDS concentration of 1,940 mg/L, the resultant blended product has a TDS concentration of

Central Arizona Salinity Study A-8 Brackish Water Subcommittee
479 mg/L. With the design feedwater and 75 percent recovery, the blended product nitrate concentration is projected to be 5.29 mg/L. The 0.7 mgd concentrate TDS is projected to be 7,447 mg/L. For base conditions, the emergency RO treatment facility will require 3.2 mgd of feedwater from the Centerra Well. This will allow 2.7 mgd of feedwater to be fed to the RO membranes treatment system. At an RO system recovery of 75 percent, the RO membranes will produce 2.0 mgd of permeate, or treated water, and, 0.7 mgd of concentrate or reject water. The 2.0 mgd of permeate water from the membranes will then be blended with 0.5 mgd of bypassed well water, giving a 2.5 mgd of blended potable water. In the flow conditions described above, the feedwater will need to be delivered to the RO treatment facility at a minimum pressure of 40 psig. The feedwater will be split into an RO feedwater stream and a bypass blend stream. The bypass blend stream will be mixed with permeate from the RO trains and then discharged into COG’s potable water distribution system via the existing storage tank and pump station. The RO feedwater will be split to each train and a threshold inhibitor will be added to prevent precipitation of sparingly soluble compounds (i.e., calcium sulfate, barium sulfate, and silica salts) in the feed/concentrate stream of the RO process. Additionally, the threshold inhibitor will provide a concentrate stream Langelier Saturation Index (LSI) of +2.3 without precipitation of calcium carbonate. After chemical addition, the RO feedwater will be filtered by 1.0 micron cartridge filters. The cartridge filters provide the dual function of protecting the membrane feed pumps and membrane elements from suspended solids in the unlikely event of a well failure and of thoroughly mixing the previously added chemicals. Effluent from the cartridge filters will then be pressurized by the feed pumps and routed to the membranes. The RO feed pump flow will be controlled by the variable frequency drive associated with the pump motor. The concentrate control valve will be automatically controlled to regulate flow of concentrate and thereby control process recovery. Each train will produce 0.5 mgd of permeate and 0.17 mgd of concentrate. Residual pressure in the concentrate is dissipated across the pressure control valves in each RO train and the concentrate will then flow by gravity to a nearby sewer pipeline for disposal. The permeate and blend water will be treated with sodium hypochlorite for disinfection purposes and then be routed to the onsite storage tank. Connecting flanges and a drop spool will be provided to the permeate line for the future addition of decarbonators, when acid feed is also expected to be added to the treatment process. The acid feed is expected to provide higher recovery from the membranes. Additionally, a cleaning system for the RO trains is expected to be added in the future. Similar RO systems operating on well water supplies typically require cleaning after a year or more of operation. RO Treatment System
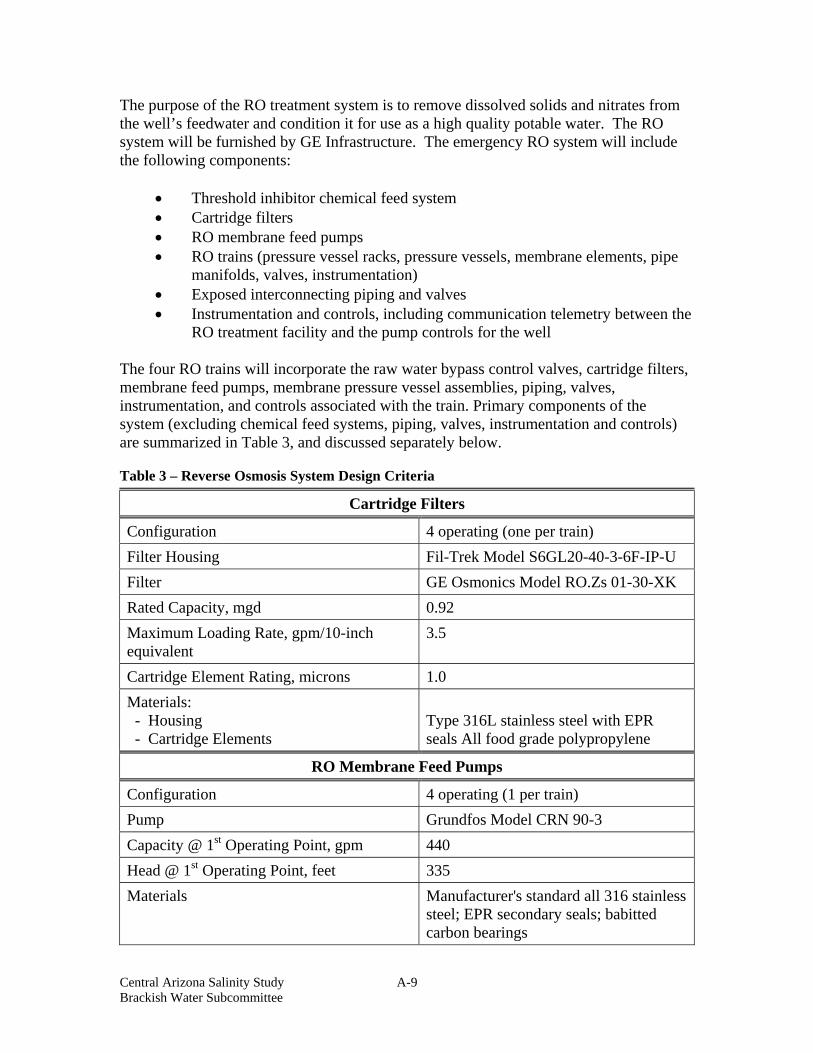
Central Arizona Salinity Study A-9 Brackish Water Subcommittee
The purpose of the RO treatment system is to remove dissolved solids and nitrates from the well’s feedwater and condition it for use as a high quality potable water. The RO system will be furnished by GE Infrastructure. The emergency RO system will include the following components:
• Threshold inhibitor chemical feed system • Cartridge filters • RO membrane feed pumps • RO trains (pressure vessel racks, pressure vessels, membrane elements, pipe
manifolds, valves, instrumentation) • Exposed interconnecting piping and valves • Instrumentation and controls, including communication telemetry between the
RO treatment facility and the pump controls for the well
The four RO trains will incorporate the raw water bypass control valves, cartridge filters, membrane feed pumps, membrane pressure vessel assemblies, piping, valves, instrumentation, and controls associated with the train. Primary components of the system (excluding chemical feed systems, piping, valves, instrumentation and controls) are summarized in Table 3, and discussed separately below.
Table 3 – Reverse Osmosis System Design Criteria
Cartridge Filters
Configuration 4 operating (one per train) Filter Housing Fil-Trek Model S6GL20-40-3-6F-IP-U Filter GE Osmonics Model RO.Zs 01-30-XK Rated Capacity, mgd 0.92 Maximum Loading Rate, gpm/10-inch equivalent
3.5
Cartridge Element Rating, microns 1.0 Materials: - Housing - Cartridge Elements
Type 316L stainless steel with EPR seals All food grade polypropylene
RO Membrane Feed Pumps
Configuration 4 operating (1 per train) Pump Grundfos Model CRN 90-3 Capacity @ 1st Operating Point, gpm 440 Head @ 1st Operating Point, feet 335 Materials Manufacturer's standard all 316 stainless
steel; EPR secondary seals; babitted carbon bearings

Central Arizona Salinity Study A-10 Brackish Water Subcommittee
Drive Adjustable speed Maximum Motor Speed, rpm/Enclosure 50 HP, 3600 rpm, 460V, 60 Hz, 3
phase/TEFC
RO Trains
Number 4 (operating) Permeate Capacity, mgd 0.5 Recovery, percent 75-85 Pressure Vessel Array Pressure Vessels: - Manufacturer - Design Operating Pressure, psig - Size
- Vertical Spacing In Racks, inches - Horizontal Spacing w/in Train, inches
8: 5 Codeline Model 80A45 450 To contain seven 40-inch long x 8-inch diameter membrane elements 12 (on center) 18 (on center)
Membrane Elements: - Number (per train), 40-inch equivalents - Element Manufacturer and Model - Membrane Type - Element Length, inches - Element Diameter, inches - Min. Surface Area, square feet - Avg. Rejection, percent - Avg. Flux at Rated Capacity, gal/ft2/day
91 Osmonics OSMO-MUNI-LE/RO-400 Low pressure, polyamide/polysulfone composite 40 8 400 99.0 13.73-17.33
Pressure Vessel Racks: - Number (per train) - Type - Materials - Size
One T-style frames Welded steel To support 13 vessels (102”x 320”)
Concentrate Control Valves: - Type - Size, inches
V-port ball valve with modulating electric motor actuator 1.5
General information regarding the RO treatment system components is provided below. Cartridge Filters - Each skid filter will consist of a stainless steel pressure vessel housing a bank of cylindrical wound depth polypropylene cartridge filter elements. The filters will protect the RO system from unexpected upsets in the feed delivery system. The filters are located on the RO skid, prior to the membrane feed pumps and elements.

Central Arizona Salinity Study A-11 Brackish Water Subcommittee
Membrane Feed Pumps - Each train will be equipped with a non-redundant feed pump. The pump is sized to deliver the required feed flow over the operating range listed in the table above at a recovery range of 75 – 85 percent. The predicted operating pressure for the system will range from a low of 115 psig with new membrane elements up to a maximum of 140 psig. Each pump is equipped with a variable frequency drive to maintain constant train permeate flow as the operating pressures increase with long term operation. RO Trains - Each RO system, or train, will have a nominal permeate capacity of 0.5 mgd. Pressure vessels for each train will be arranged in a 8:5 array. Each vessel will contain seven 8-inch diameter, 40-inch long spiral wound polyamide/polysulfone membrane elements, resulting in a nominal operating flux of roughly 14 – 17 gallons per square foot per day (gfd) depending on system recovery. Pressure vessels for each train shall be arranged on a rack to support the 13 vessels and allow access to any vessel in the train from the operating floor. System Piping - The exposed piping and fittings for the facility will be constructed of Schedule 80 PVC pipe and fittings. Isolation valves located on each skid will be Class 150 EPDM lined butterfly valves with Type 316 stainless steel discs for low pressure applications with manual or power actuators as required. Isolation valves on each skid in high pressure lines or interconnected to high pressure lines will be Class 150 high performance stainless steel butterfly valves. Concentrate control valves will be Class 150 v-port ball valves. Clean-in-Place (CIP) System - No clean-in-place system will be provided for the Emergency Facility. A CIP will be provided in the future with the permanent treatment facility. Decarbonators - No decarbonators will be utilized in the Emergency Facility. Water quality goals will be achieved by blending with feed water as well as other sources that feed the storage tank located on site. Decarbonators will be added with the acid feed system in the future permanent treatment facility. RO Product Distribution System - Upon exiting the RO process trains, the product water will be discharged to an existing storage tank where it will be blended with potable water from COG’s distribution system. Once in the storage tank, the water will be distributed to COG’s customers via the existing booster pump station. Chemical Feed Systems - Chemicals used at the Emergency Facility will include the following:
• Threshold Inhibitor • Sodium Hypochlorite
Each RO train will have dedicated chemical feed equipment controlled by the local programmable logic controller (PLC) on each train. Thus, each train can be operated independent of the others. Individual systems are discussed separately below.

Central Arizona Salinity Study A-12 Brackish Water Subcommittee
Threshold inhibitor feed system - A threshold inhibitor compound will be added to the RO feedwater to prevent the precipitation of sparingly soluble salts in the concentrate stream. The inhibitor compound will be fed full strength from chemical drums to the feedwater via chemical metering pumps. Each RO train will have a separate dedicated chemical metering pump and drum of undiluted threshold inhibitor. Each pump will have a flow range of 0.2 to 2.0 gpd at 60 psi backpressure, and will be controlled by the local PLC provided with each skid. The threshold inhibitor chemical drums will be located adjacent to the emergency RO facility slab on a chemical containment pallet for spill containment. Sodium hypochlorite feed system - Sodium hypochlorite will be used for disinfection of finished water produced by the RO treatment facility. The dosage point will be located on the finished water header immediately downstream of the emergency RO facility slab, and upstream of the storage tank. One chemical drum equipped with a chemical metering pump will be dedicated to each RO train. Each pump will have a flow range of 0.2 to 2.0 gpd at 60 psi back pressure, and will be controlled by the local PLC provided with each skid. The sodium hypochlorite chemical drums will be located on a chemical containment pallet for spill containment. RO process waste disposal - The RO concentrate, and the RO permeate dump created during each shutdown of an RO train, will be discharged to air gap devices and routed to a sanitary sewer manhole. Initial concentrate flow when operating all four RO trains is estimated to be 463 gpm. Total concentrate flow could be lower depending on final quality of the well water. In addition to concentrate flows during on-line operation, the concentrate disposal header will also be designed to accommodate well flush flows generated during RO train startup and shutdown. Under plant operations, flushing flows will be as high as 100 gpm for an individual train. This will be considered in excess of concentrate flows associated with other on-line trains.
REFERENCE PLANT DATA SHEET Location: Gila Bend, AZ Owner: Town of Gila Bend Contact Person(s): Wayne Miller (928) 683-2255 Commissioning Date: 6/1/01 N/A
Other Capacity/Size Current Capacity @ 1 mgd Capacity/Size Ultimate Capacity @ mgd Source Water Type/Quality TDS 2000 ppm Calcium ppm Magnesium ppm

Central Arizona Salinity Study A-13 Brackish Water Subcommittee
Sulfate ppm Sodium ppm Chloride ppm Silica ppm Iron ppm Other Constituents @ ppm
@ ppm @ ppm
Pretreatment Other/Comment: Desal Process RO Recovery Rate % Post Treatment N/A Blending N/A % w/
Other Concentrate Disposal Evap Lagoon Permitting/Regulation Issues N/A Environmental Issues N/A Capital Cost, Total Plant N/A $ . M
Other Capital Cost, Desal Equipment N/A $ . M
Other Operating Cost, Excluding Debt Service
$ /AF $ /MG $ /CCF Other
Supplemental Information/Description: N/A
Gila Bend RO Facility
Reviewed by: Thomas K. Poulson Summary: Gila Bend built a 1 mgd RO facility 5 miles south of the town in their well fields to supply drinking water to their citizens. This plant went on line in the spring of 2002. The feed water comes from several wells in the general vicinity, with a TDS between 1000 to 2000 mg/L. Pre treatment is unknown at this time. It was designed as a 1 mgd plant using RO membranes.

Central Arizona Salinity Study A-14 Brackish Water Subcommittee
Recover rate is unknown. Concentrate is evaporated using to ponds located on the site. Unknown if any unique permitting or regulatory issues were encountered. Public outreach was accomplished through “give aways” of bottled water produced at the plant. I talked to a Wayne Miller, superintendent for water and waste water at the Town of Gila Bend. He stated that the RO plant was having all sorts of problems. It was only producing about 300 gpm for 16 to 17 hours a day (approximately 300,000 gpd much less then the 1 million gpd design) The problems were pretreatment was not adequate. Only two “units were working” currently and a third one was off line. This guy was very evasive with my questions. I talked to Woody Scoutten (Town Engineer) the problem was with the membrane housing made out of stainless steel. High Chlorides with in months caused pinholes to develop in the housings. They are in the process of being replaced by fiber glass housings. The first skid has had the stainless steel housings replaced by fiber glass and have been operating for 6 months now. Seems to be the fix
REFERENCE PLANT DATA SHEET Location: Tempe, AZ Owner: To be completed soon Contact Person(s): Commissioning Date: / / NA Other Capacity/Size Current Capacity @ mgd Capacity/Size Ultimate Capacity @ mgd Source Water Type/Quality Surface Water TDS ppm Calcium ppm Magnesium ppm Sulfate ppm Sodium ppm Chloride ppm Silica ppm Iron ppm
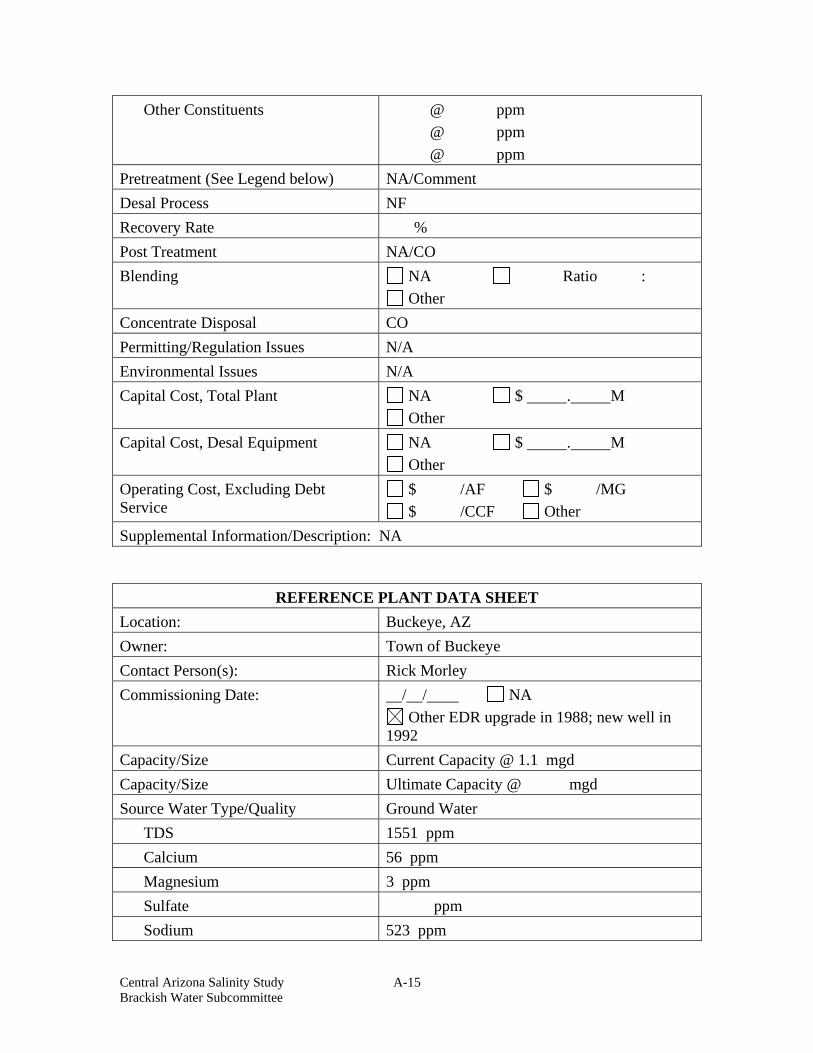
Central Arizona Salinity Study A-15 Brackish Water Subcommittee
Other Constituents @ ppm @ ppm @ ppm
Pretreatment (See Legend below) NA/Comment Desal Process NF Recovery Rate % Post Treatment NA/CO Blending NA Ratio :
Other Concentrate Disposal CO Permitting/Regulation Issues N/A Environmental Issues N/A Capital Cost, Total Plant NA $ . M
Other Capital Cost, Desal Equipment NA $ . M
Other Operating Cost, Excluding Debt Service
$ /AF $ /MG $ /CCF Other
Supplemental Information/Description: NA
REFERENCE PLANT DATA SHEET Location: Buckeye, AZ Owner: Town of Buckeye Contact Person(s): Rick Morley Commissioning Date: / / NA
Other EDR upgrade in 1988; new well in 1992
Capacity/Size Current Capacity @ 1.1 mgd Capacity/Size Ultimate Capacity @ mgd Source Water Type/Quality Ground Water TDS 1551 ppm Calcium 56 ppm Magnesium 3 ppm Sulfate ppm Sodium 523 ppm

Central Arizona Salinity Study A-16 Brackish Water Subcommittee
Chloride 746 ppm Silica ppm Iron ppm Other Constituents HCO3 @ 95 ppm
SO4 @ 120 ppm NO3 @ 5 ppm pH @ 8.3
Pretreatment (See Legend below) NA/Comment Desal Process EDR Recovery Rate 80 % Post Treatment NA/CO HCl added to brine stream Blending NA Ratio :
Other Concentrate Disposal CO Permitting/Regulation Issues N/A Environmental Issues N/A Capital Cost, Total Plant NA $ . M
Other Capital Cost, Desal Equipment NA $ . M
Other Operating Cost, Excluding Debt Service
$ /AF $ /MG $ /CCF Other
Supplemental Information/Description: NA The above parameters are based on information provided by Ionics to Buckeye in 1992. However, Rick Morley provided a brief overview of the system at the August 2004 CASS Brackish Committee Meeting. The incoming TDS is about 1600 mg/L (3500 conductivity). The EDR plant is operating about a 40% reduction to give an effluent TDS around 720-880 mg/L. The effluent is blended with other water source to keep the overall TDS below 500 mg/L. The EDR plant is operated about 4 hours per day. Currently only operating one train since other train was used for parts. Legend:
Acid - Acid Addition/pH Reduction AScl - Anti-scalant Addition CO - Comment/Other Coag - Chemical Coagulation CtFl - Cartridge Filter
GrFl - Gravity Filters Mem - Low Pressure Membranes NA - Not Applicable PrFl - Pressure Filters Sed - Sedimentation
LEWIS PRISON EDR PLANT DATA SHEET Location: Lewis Prison, Buckeye, Arizona

Central Arizona Salinity Study A-17 Brackish Water Subcommittee
Owner: State of Arizona; Dept. of Corrections Contact Person(s): Commissioning Date: Capacity/Size Current Capacity 1.35 mgd in 3 trains/units Capacity/Size Ultimate Capacity 1.80 mgd in 4 trains/units Source Water Type/Quality Well water - 2 wells TDS 2,000 ppm ± Calcium Hardness NA Total Hardness NA Sulfate NA Sodium NA Chloride NA Silica NA Iron NA Other Constituents NA Pretreatment (See Legend below) Acid, CtFl Desal Process EDR (Ionics, Inc.) Recovery Rate Post Treatment pH adjustment (caustic); chlorination Blending No blending Concentrate Disposal To Evaporation Ponds - onsite Permitting/Regulation Issues None - normal permits obtained Environmental Issues None Capital Cost, Total Plant N/A Capital Cost, Desal Equipment N/A Operating Cost, Excluding Debt Service
N/A
Supplemental Information/Description: - Well capacity is 1,200 gpm (each) - Well borehole is 1,200 ft deep; 28 inch diameter - Well casing is 16-inch diameter, steel - The EDR units are Ionics Model Aquamite 50; capacity 0.45 mgd each - Cartridge filters are 10 micron Legend:
Acid - Acid Addition/pH Reduction AScl - Anti-scalant Addition CO - Comment/Other Coag - Chemical Coagulation CtFl - Cartridge Filter
GrFl - Gravity Filters Mem - Low Pressure Membranes NA - Not Applicable N/A - Not Available PrFl - Pressure Filters Sed - Sedimentation

Central Arizona Salinity Study A-18 Brackish Water Subcommittee
REFERENCE PLANT DATA SHEET
Location: Central Groundwater Treatment Facility - Scottsdale, Arizona
Owner: City of Scottsdale Contact Person(s): William Vernon Commissioning Date: / /1994 NA
Other Capacity/Size Current Capacity @ 9 mgd Capacity/Size Ultimate Capacity @ 12 mgd Source Water Type/Quality Ground Water TDS 850 ppm Calcium 65 ppm Magnesium 55 ppm Sulfate 110 ppm Sodium 155 ppm Chloride 295 ppm Silica 29 ppm Iron nd ppm Other Constituents TCE @ 0.1 ppm Pretreatment (See Legend below) NA/Comment Desal Process RO Recovery Rate 80 % Post Treatment NA/CO Blending NA Ratio 1 permeate:2
source Other
Concentrate Disposal CO sewer Permitting/Regulation Issues N/A Environmental Issues N/A Capital Cost, Total Plant NA $ 7.1M
Other Capital Cost, Desal Equipment NA $ . M
Other Operating Cost, Excluding Debt Service
$ /AF $ /MG $ /CCF Other $.84 M/yr.

Central Arizona Salinity Study A-19 Brackish Water Subcommittee
Supplemental Information/Description: NA All costs are conceptual. Facility has not been constructed
REFERENCE PLANT DATA SHEET Location: Oceanside, CA Owner: City of Oceanside Contact Person(s): Bruce McCarter- 760-435-5920 Commissioning Date: / / NA
Other Original 1994, Expansion 2003 Capacity/Size Current Capacity @ 6 mgd Capacity/Size Ultimate Capacity @ mgd Source Water Type/Quality Ground Water TDS 1300 ppm Calcium ppm Magnesium ppm Sulfate 255 ppm Sodium ppm Chloride 475 ppm Silica ppm Iron ppm Other Constituents @ ppm
@ ppm @ ppm
Pretreatment (See Legend below) Acid/AScl/CtFl/CO Desal Process RO Recovery Rate 80 % Post Treatment Chem Stabl/De-carbonation/CO Blending NA Ratio :
Other Concentrate Disposal CO Oceanside Ocean Outfall Permitting/Regulation Issues N/A Environmental Issues N/A Capital Cost, Total Plant NA $ . M
Other
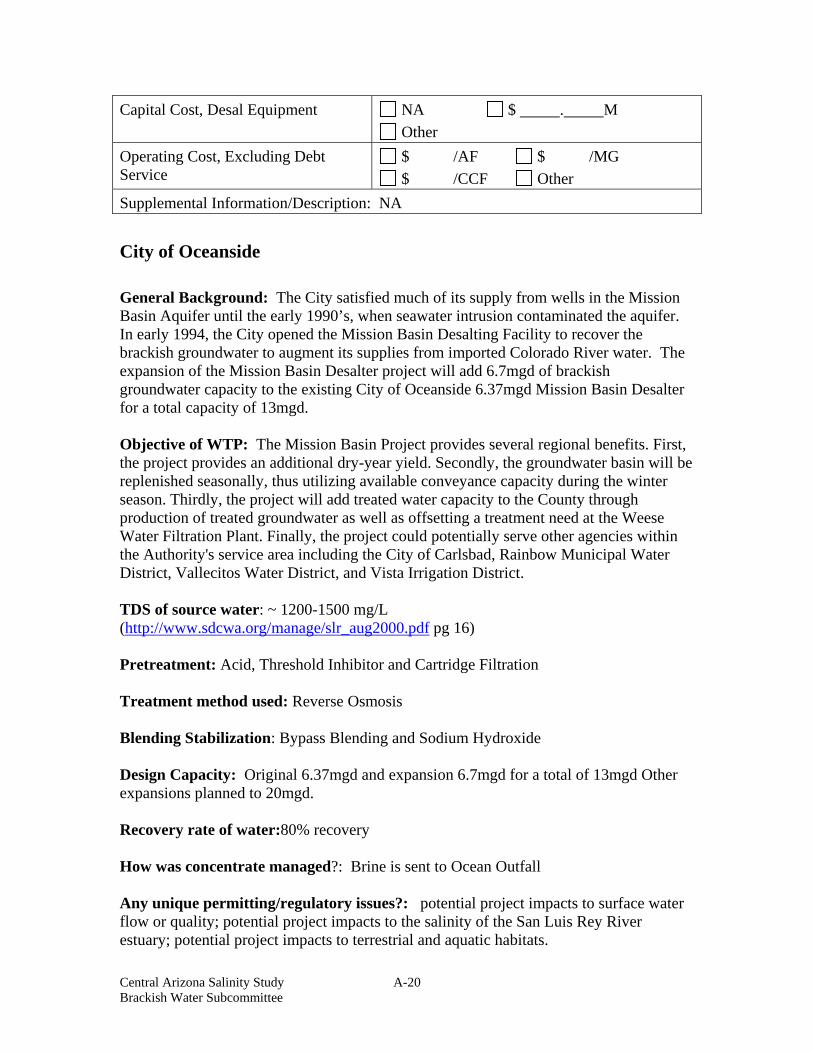
Central Arizona Salinity Study A-20 Brackish Water Subcommittee
Capital Cost, Desal Equipment NA $ . M Other
Operating Cost, Excluding Debt Service
$ /AF $ /MG $ /CCF Other
Supplemental Information/Description: NA
City of Oceanside General Background: The City satisfied much of its supply from wells in the Mission Basin Aquifer until the early 1990’s, when seawater intrusion contaminated the aquifer. In early 1994, the City opened the Mission Basin Desalting Facility to recover the brackish groundwater to augment its supplies from imported Colorado River water. The expansion of the Mission Basin Desalter project will add 6.7mgd of brackish groundwater capacity to the existing City of Oceanside 6.37mgd Mission Basin Desalter for a total capacity of 13mgd. Objective of WTP: The Mission Basin Project provides several regional benefits. First, the project provides an additional dry-year yield. Secondly, the groundwater basin will be replenished seasonally, thus utilizing available conveyance capacity during the winter season. Thirdly, the project will add treated water capacity to the County through production of treated groundwater as well as offsetting a treatment need at the Weese Water Filtration Plant. Finally, the project could potentially serve other agencies within the Authority's service area including the City of Carlsbad, Rainbow Municipal Water District, Vallecitos Water District, and Vista Irrigation District. TDS of source water: ~ 1200-1500 mg/L (http://www.sdcwa.org/manage/slr_aug2000.pdf pg 16) Pretreatment: Acid, Threshold Inhibitor and Cartridge Filtration Treatment method used: Reverse Osmosis Blending Stabilization: Bypass Blending and Sodium Hydroxide Design Capacity: Original 6.37mgd and expansion 6.7mgd for a total of 13mgd Other expansions planned to 20mgd. Recovery rate of water:80% recovery How was concentrate managed?: Brine is sent to Ocean Outfall Any unique permitting/regulatory issues?: potential project impacts to surface water flow or quality; potential project impacts to the salinity of the San Luis Rey River estuary; potential project impacts to terrestrial and aquatic habitats.

Central Arizona Salinity Study A-21 Brackish Water Subcommittee
Any unique environmental issues?: Public outreach program?: address public concerns and questions related to the proposed field investigations and to lay the groundwork for possible project implementation. Economics: expansion project approximately $9million
REFERENCE PLANT DATA SHEET Location: Richard A. Reynolds Groundwater Desal.
Facility Owner: Sweetwater Authority Contact Person(s): Don Thompson Commissioning Date: / /1999 NA
Other Capacity/Size Current Capacity @ 4 mgd Capacity/Size Ultimate Capacity @ mgd Source Water Type/Quality Ground Water TDS ppm Calcium ppm Magnesium ppm Sulfate ppm Sodium ppm Chloride ppm Silica ppm Iron ppm Other Constituents @ ppm
@ ppm @ ppm
Pretreatment (See Legend below) Acid/AScl/CO Desal Process RO Recovery Rate 75 % Post Treatment Chem Stabl/De-carbonation/CO Blending NA GW Source Ratio 50:50
Other Concentrate Disposal To Sanitary Sewer/CO Storm Drain

Central Arizona Salinity Study A-22 Brackish Water Subcommittee
Permitting/Regulation Issues Comment: Environmental Issues Other: Capital Cost, Total Plant NA $ . M
Other Capital Cost, Desal Equipment NA $ . M
Other Operating Cost, Excluding Debt Service
$ /AF $ /MG $ /CCF Other
Supplemental Information/Description: Other: Fed by 4 Alluvial Wells and RO Permeate is blended with water from 6 San Diego Formation wells.
REFERENCE PLANT DATA SHEET Location: Chino I Desalter- Chino, CA Owner: Chino Basin Desalter Authority Contact Person(s): Craig Parker-Inland Empire Utilities Agency,
Tom O'Neill - Jurupa Community Services District
Commissioning Date: 3/3/2000 NA Other Expansion To be Complete in 2005
Capacity/Size Current Capacity @ 8 mgd Capacity/Size Ultimate Capacity @ 13 mgd Source Water Type/Quality Ground Water High Nitrate and TDS TDS 871 ppm Calcium 174 ppm Magnesium 40 ppm Sulfate 55 ppm Sodium 48 ppm Chloride 102 ppm Silica 37 ppm Iron 0 ppm Other Constituents Nitrate @ 170 ppm
Bicarbonate @ 490 ppm Pretreatment (See Legend below) Acid/AScl/CtFl/CO Desal Process RO Recovery Rate 80 %
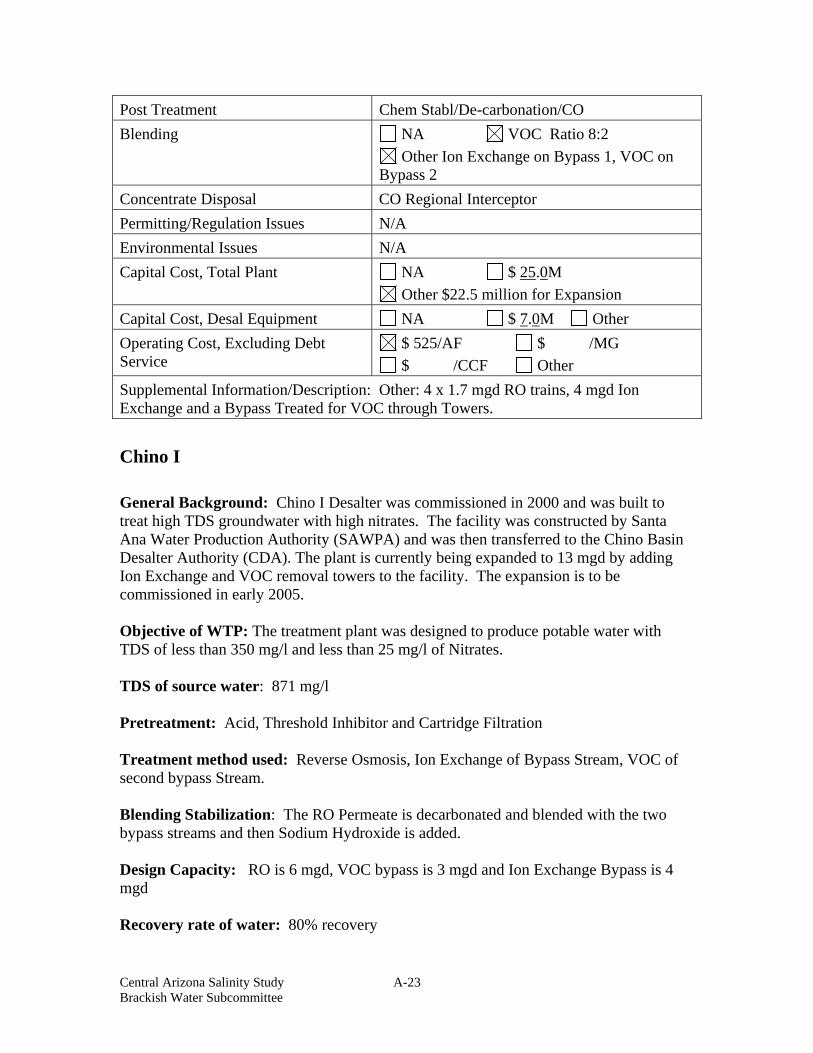
Central Arizona Salinity Study A-23 Brackish Water Subcommittee
Post Treatment Chem Stabl/De-carbonation/CO Blending NA VOC Ratio 8:2
Other Ion Exchange on Bypass 1, VOC on Bypass 2
Concentrate Disposal CO Regional Interceptor Permitting/Regulation Issues N/A Environmental Issues N/A Capital Cost, Total Plant NA $ 25.0M
Other $22.5 million for Expansion Capital Cost, Desal Equipment NA $ 7.0M Other Operating Cost, Excluding Debt Service
$ 525/AF $ /MG $ /CCF Other
Supplemental Information/Description: Other: 4 x 1.7 mgd RO trains, 4 mgd Ion Exchange and a Bypass Treated for VOC through Towers.
Chino I General Background: Chino I Desalter was commissioned in 2000 and was built to treat high TDS groundwater with high nitrates. The facility was constructed by Santa Ana Water Production Authority (SAWPA) and was then transferred to the Chino Basin Desalter Authority (CDA). The plant is currently being expanded to 13 mgd by adding Ion Exchange and VOC removal towers to the facility. The expansion is to be commissioned in early 2005. Objective of WTP: The treatment plant was designed to produce potable water with TDS of less than 350 mg/l and less than 25 mg/l of Nitrates. TDS of source water: 871 mg/l Pretreatment: Acid, Threshold Inhibitor and Cartridge Filtration Treatment method used: Reverse Osmosis, Ion Exchange of Bypass Stream, VOC of second bypass Stream. Blending Stabilization: The RO Permeate is decarbonated and blended with the two bypass streams and then Sodium Hydroxide is added. Design Capacity: RO is 6 mgd, VOC bypass is 3 mgd and Ion Exchange Bypass is 4 mgd Recovery rate of water: 80% recovery

Central Arizona Salinity Study A-24 Brackish Water Subcommittee
How was concentrate managed?: Concentrate is sent to Ocean Outfall through Santa Ana Regional Interceptor (SARI) Were there water quality constituents of concern other than TDS: Nitrates Economics: Expansion is a $22 million project
REFERENCE PLANT DATA SHEET Location: Chino II Desalter- Mira Loma, CA Owner: Chino Basin Desalter Authority Contact Person(s): Tom O'Neill - Jurupa Community Services
District Commissioning Date: / / NA
Other Commissioning Early 2005 Capacity/Size Current Capacity @ 10 mgd Capacity/Size Ultimate Capacity @ 18 mgd Source Water Type/Quality Ground Water High Nitrates TDS 960 ppm Calcium 186 ppm Magnesium 27 ppm Sulfate 73 ppm Sodium 74 ppm Chloride 184 ppm Silica 30 ppm Iron 0 ppm Other Constituents Nitrate @ 150 ppm
Bicarbonate @ 345 ppm @ ppm
Pretreatment (See Legend below) Acid/AScl/CtFl/CO Desal Process RO Recovery Rate 83 % Post Treatment Chem Stabl/De-carbonation/CO Blending NA Ratio 60% RO:40%
IX Other Blend Stream Has IX for NO3
Removal Concentrate Disposal CO Regional Interceptor

Central Arizona Salinity Study A-25 Brackish Water Subcommittee
Permitting/Regulation Issues N/A Environmental Issues N/A Capital Cost, Total Plant NA $ 22.0M
Other $79 million for Entire Project Capital Cost, Desal Equipment NA $ 5.6M
Other Operating Cost, Excluding Debt Service
$ 450/AF $ /MG $ /CCF Other
Supplemental Information/Description: Other:
Chino II Desalter General Background: Chino II Desalter is to be commissioned in March 2005. The project is being built to treat high TDS groundwater with high nitrates. The facility is being constructed by the Chino Basin Desalter Authority (CDA). The plant is currently being constructed to produce 10 mgd with RO and Ion Exchange. Objective of WTP: The treatment plant was designed to produce potable water with TDS of less than 350 mg/l and less than 25 mg/l of Nitrates. TDS of source water: 900 mg/l Pretreatment: Acid, Threshold Inhibitor and Cartridge Filtration Treatment method used: Reverse Osmosis, Ion Exchange of Bypass Stream. Blending Stabilization: The RO Permeate is decarbonated and blended with the ion exchange bypass stream and then Sodium Hydroxide is added. Design Capacity: RO is 6 mgd and Ion Exchange Bypass is 4 mgd Recovery rate of water: 83% recovery How was concentrate managed?: Concentrate is sent to Ocean Outfall through Santa Ana Regional Interceptor (SARI) Were there water quality constituents of concern other than TDS: Nitrates Economics: The Cost of the RO Facility and IX Facilities is approximately $30 million project

Central Arizona Salinity Study A-26 Brackish Water Subcommittee
REFERENCE PLANT DATA SHEET Location: Torrance, CA Owner: West Basin Municipal Water District Contact Person(s): Wyatt Won Commissioning Date: 7/1/1993 NA
Other Capacity/Size Current Capacity @ 1 mgd Capacity/Size Ultimate Capacity @ 1 mgd Source Water Type/Quality Ground Water TDS 4000 ppm Calcium 700 ppm Magnesium 160 ppm Sulfate 283 ppm Sodium 425 ppm Chloride 2100 ppm Silica 30 ppm Iron 0 ppm Other Constituents Bicarbonate @ 200 ppm
@ ppm @ ppm
Pretreatment (See Legend below) Acid/AScl/CtFl/CO Desal Process RO Recovery Rate 80 % Post Treatment Chem Stabl/De-carbonation/CO Blending NA Ratio 90:10
Other Based on Treated Water Goals Concentrate Disposal CO County Sanitation Districts of LA County Permitting/Regulation Issues N/A Environmental Issues N/A Capital Cost, Total Plant NA $ 2.5M
Other Capital Cost, Desal Equipment NA $ . M
Other Operating Cost, Excluding Debt Service
$ /AF $ /MG $ /CCF Other

Central Arizona Salinity Study A-27 Brackish Water Subcommittee
Supplemental Information/Description: NA
Marv Brewer General Background: Began operation in July 1993 by West Basin. 95% of water produced is sold to MWD Objective of WTP: To provide potable water to Metropolitan Water District TDS of source water: 4000 mg/L Pretreatment: Sulfuric Acid, Threshold Inhibitor and Cartridge Filtration Treatment method used: Reverse Osmosis Blending Stabilization: Decarbonation and NaOH Design Capacity: 1.3 mgd RO permeate and 0.2 mgd blend Recovery rate of water: 80% RO permeate How was concentrate managed?: Concentrate Disposed of to local sewer and sent to Los Angeles County Sanitation District WWTP.
REFERENCE PLANT DATA SHEET Location: Torrance, CA Owner: Water Replenishment District of Southern
California Contact Person(s): Melinda Sperry Commissioning Date: 11/1/2001 NA
Other Capacity/Size Current Capacity @ 2.5 mgd Capacity/Size Ultimate Capacity @ 5 mgd Source Water Type/Quality Ground Water TDS 3881 ppm Calcium 669 ppm Magnesium 155 ppm Sulfate 283 ppm Sodium 425 ppm

Central Arizona Salinity Study A-28 Brackish Water Subcommittee
Chloride 2095 ppm Silica 29.2 ppm Iron 0 ppm Other Constituents Bicarbonate @ 204 ppm
@ ppm @ ppm
Pretreatment (See Legend below) Acid/AScl/CtFl/CO Desal Process RO Recovery Rate 80 % Post Treatment De-carbonation/CO Blending NA Ratio :
Other Based on Treated Water Goals Concentrate Disposal CO County Sanitation Districts of LA County Permitting/Regulation Issues N/A Environmental Issues N/A Capital Cost, Total Plant NA $ 6.5M
Other Capital Cost, Desal Equipment NA $ . M
Other Operating Cost, Excluding Debt Service
$ /AF $ /MG $ /CCF Other
Supplemental Information/Description: NA Goldsworthy Desalter General Background: Desalter for potable supply augmentation and basin salinity control Objective of WTP: Provide new local potable supply and treat a localized high salinity plume TDS of source water: ~3,800 mg/L Pretreatment: Cartridge Filtration, sulfuric acid and threshold inhibitor injection Treatment method used: Reverse osmosis Blending Stabilization: Decarbonation, sodium hydroxide addition, blend to with as much bypass as possible to optimize production up to 500 mg/l TDS

Central Arizona Salinity Study A-29 Brackish Water Subcommittee
Design Capacity: 2.5 mgd RO treatment capacity, expandable to 5.0 mgd Recovery rate of water: Reverse Osmosis 80% Overall 81.3% How was concentrate managed?: Discharge to sewer Were there water quality constituents of concern other than TDS: Chloride Any unique permitting/regulatory issues?: No Any unique environmental issues?: No Public outreach program?: During construction of pipelines in public road Economics: The cost of construction of the complete facility was approximately $6-7 million including engineering fees
REFERENCE PLANT DATA SHEET Location: Tampa Bay, FL Owner: Tampa Bay Water Contact Person(s): Commissioning Date: / / NA
Other Under Construction Capacity/Size Current Capacity @ 25 mgd Capacity/Size Ultimate Capacity @ 35 mgd Source Water Type/Quality Other: Seawater TDS 15,000 – 25,000 ppm Calcium ppm Magnesium ppm Sulfate ppm Sodium ppm Chloride ppm Silica ppm Iron ppm Other Constituents @ ppm
@ ppm @ ppm
Pretreatment (See Legend below) NA/Comment 2-stage sand filter Desal Process RO

Central Arizona Salinity Study A-30 Brackish Water Subcommittee
Recovery Rate 50-60 % Post Treatment NA/CO Lime Stabilization Blending NA Ratio :
Other Concentrate Disposal CO Blended with cooling water/ocean
discharge Permitting/Regulation Issues Comment: yearly inspections by State; 5-year
permit Environmental Issues Other: Affects to area wildlife minimal Capital Cost, Total Plant NA $ . M
Other Capital Cost, Desal Equipment NA $ . M
Other Operating Cost, Excluding Debt Service
$ /AF $ /MG $ /CCF Other $2.69/1000
gallons Supplemental Information/Description: Other: See Attached
Tampa Bay Desalination Facility General Background: Tampa Bay Water is a regional agency responsible for supplying the needs of a population of approx. 1.8 million. With the demand on the area's aquifers steadily increasing they decided to investigate alternative water sources. The raw water intake is beside the neighbouring power plant's four discharge tunnels, two of which were tapped to divert around 166,000m³/day of the cooling outflow into the intake structure. Since the power plant already screens its 5.3 million m³/day cooling stream inflow to exclude marine life, this arrangement avoided any duplication and overcame potential environmental objections to the SWRO plant's seawater feed. From the intake, the water is pumped to the pre-treatment facility. Objective of WTP: The Tampa Bay seawater reverse osmosis (SWRO) plant was designed to produce an initial 95,000m³ (25 million US gallons) of water per day TDS of source water: 15000-25000, Source Water Influenced by Run off and fresh water sources Pretreatment: Chemical filtration agents and ferric sulfate are added to the inflow, which passes through a two stage sand filter. The media is continuously backwashed, which further helps to lower the silt density index of the exiting water

Central Arizona Salinity Study A-31 Brackish Water Subcommittee
Treatment method used: The Reverse Osmosis (RO) system has seven independent trains, each comprising a transfer pump, cartridge filters, reverse osmosis membranes, associated high pressure pump and an energy recovery turbine (ERT). An 800hp vertical turbine transfer pump in each train draws raw water from the pre-treatment wet well to the 5 micron cartridge filter assembly. The water then enters the RO process itself. Blending Stabilization: Water is Stabilized after treatment with lime for discharge to the potable water systems Design Capacity: 25MGD Recovery rate of water: 50%-60% How was concentrate managed?: The high pressure concentrate returns to the ERT for energy recovery and is then mixed with the power station cooling water in a ratio of 70:1 to dilute its high salinity before finally being discharged The highly salty byproduct will flow into the Big Bend power plant's cooling water canal, where it will be diluted in the 1.4 billion gallons the canal carries each day. Were there water quality constituents of concern other than TDS: Boron in the Seawater can be an impact Any unique permitting/regulatory issues?: The state permit requires that the plant conduct several types of monitoring on a daily, weekly and quarterly basis. Also, state officials will do inspections at least once a year. The plant's permit is good for five years, but can be revoked earlier. Any unique environmental issues?: Concerns on the increased salinity of the area waters and wildlife effects were taken into consideration. Independent studies showed that the plant alone would have little affect on the salinity of the water "because it's just such a drop in the bucket when you compare it to the total quantity of water in the bay. Economics: $2.69/1000 gallons after fixing of pretreatment issues
REFERENCE PLANT DATA SHEET Location: St. Lucie West, Florida Owner: St. Lucie West Water District Contact Person(s): Ilan Wilf, Hydranautics Commissioning Date: 04/00/1996 NA
Other Capacity/Size Current Capacity @ 1 mgd Capacity/Size Ultimate Capacity @ 1 mgd Source Water Type/Quality Ground Water Good

Central Arizona Salinity Study A-32 Brackish Water Subcommittee
TDS 588 ppm Calcium 107 ppm Magnesium 6 ppm Sulfate 30 ppm Sodium 49.3 ppm Chloride 80 ppm Silica 23.4 ppm Iron 2.6 ppm Other Constituents Alkalinity @ 290 ppm
THM Potential @ .08 - .120 ppm @ ppm
Pretreatment (See Legend below) NA/Comment AScl, CtFl Desal Process RO Recovery Rate 85 % Post Treatment NA/CO pH Adjustment With Caustic Soda Blending NA Ratio :
Other Concentrate Disposal CO Not Discussed Permitting/Regulation Issues N/A Not Discussed Environmental Issues N/A Not Discussed Capital Cost, Total Plant NA $ . M
Other Capital Cost, Desal Equipment NA $ . M
Other Operating Cost, Excluding Debt Service
$ /AF $ 163.05/MG $ /CCF Other
Supplemental Information/Description: NA
REFERENCE PLANT DATA SHEET Location: Las Vegas, NV Owner: Southern Nevada Water Authority Contact Person(s): Mike Goff Commissioning Date: / / NA
Other Pilot Operation Summer 2002 Capacity/Size Current Capacity @ 5 mgd

Central Arizona Salinity Study A-33 Brackish Water Subcommittee
Capacity/Size Ultimate Capacity @ mgd Source Water Type/Quality Ground Water Wide Range of TDS TDS 2300-4500 ppm Calcium 504 ppm Magnesium 369 ppm Sulfate 2620 ppm Sodium 250 ppm Chloride 480 ppm Silica 77-99 ppm Iron 0 ppm Other Constituents F @ 1.1 ppm
NO3 @ 133 ppm @ ppm
Pretreatment (See Legend below) Acid/AScl/CO Desal Process RO Recovery Rate 55 % Post Treatment Chem Stabl/De-carbonation/CO Blending NA Ratio :
Other Concentrate Disposal CO Brine Concetrators Permitting/Regulation Issues Comment: Must Meet IESWTR Environmental Issues Other: Concentrate Disposal Capital Cost, Total Plant NA $ . M
Other Capital Cost, Desal Equipment NA $ . M
Other Operating Cost, Excluding Debt Service
$ /AF $ /MG $ /CCF Other
Supplemental Information/Description: Other: Evaluated RO, Lime +RO, EDR, RO +Thermal Concentrators, EDR + Brine Concentrators
SNWA Report General Background: Southern Nevada Water Authority is looking at brackish water desalination as option for supplying water to Southeastern Las Vegas Valley Area as part of their overall Water Resources Plan. There is a significant amount of brackish water in the local aquifer, with high TDS that could potentially be used for potable water source.

Central Arizona Salinity Study A-34 Brackish Water Subcommittee
The SNWA performed a technology evaluation study and recovery optimization pilot study on the water in 2002 to determine the available treatment options for desalination of the brackish groundwater. Objective of WTP Pilot Study: Determine optimum recovery and treatment train configuration for a backish water desalination facility. TDS of source water: 2300 to 4500 mg/l, High Silica Concentrations between 77 and 99 mg/l Pretreatment: Acid/TI /Cartridge Filter and potentially Lime Softening. Treatment method used: Pilot used high rejection RO membranes Blending Stabilization: Blending was possible, however, may require treatment due to IESWTR requirements Design Capacity: Eventual capacity of proposed facility was 5 mgd Recovery rate of water: RO = 55%, Lime+RO = 80% and HERO=95% How was concentrate managed?: Evaluated Brine Concentrators and Evaporation and Thermal Processes. Were there water quality constituents of concern other than TDS: Silica and Nitrates Any unique permitting/regulatory issues?: Would potentially require compliance with IESWTR due to influence of surface water on the groundwater source.
REFERENCE PLANT DATA SHEET Location: El Paso, TX Owner: El Paso Water Utilities Contact Person(s): Bill Hutchinson Commissioning Date: / / NA
Other Under Construction Capacity/Size Current Capacity @ 27.5 mgd Capacity/Size Ultimate Capacity @ mgd Source Water Type/Quality Ground Water TDS 2250 ppm Calcium ppm Magnesium ppm

Central Arizona Salinity Study A-35 Brackish Water Subcommittee
Sulfate ppm Sodium ppm Chloride ppm Silica ppm Iron ppm Other Constituents @ ppm
@ ppm @ ppm
Pretreatment (See Legend below) NA/Comment Desal Process RO Recovery Rate 81-85 % Post Treatment NA/CO Blending NA Ratio :
Other 15.5 mgd from RO & 12 mgd from wells
Concentrate Disposal CO Deep Well Injection Permitting/Regulation Issues N/A Environmental Issues N/A Capital Cost, Total Plant NA $ 67M
Other Capital Cost, Desal Equipment NA $ . M
Other Operating Cost, Excluding Debt Service
$ 700/AF $ /MG $ /CCF Other
Supplemental Information/Description: Other: Target TDS 600-700 mg/L
LAKE GRANBURY, TEXAS RO PLANT DATA SHEET Location: Lake Granbury, Texas Owner: Brazos River Water Authority, Waco, Texas Contact Person(s): Commissioning Date: Capacity/Size Current Capacity 6.0 mgd permeable Capacity/Size Ultimate Capacity - no expansion anticipated at
this time Source Water Type/Quality Surface water from Lake Granbury - a reservoir
on the Brazos River

Central Arizona Salinity Study A-36 Brackish Water Subcommittee
TDS 3.30 to 1,750 ppm; avg. = 1,140 ppm Calcium Hardness 154 to 163 ppm; avg. = 159 ppm Total Hardness 190 to 205 ppm; avg. = 199 ppm Sulfate 47 to 550 ppm; avg. = 230 ppm Sodium 390 ppm avg. Chloride 93 to 669 ppm; avg. = 444 ppm Silica 7.2 ppm avg. Iron <0.5 ppm Other Constituents Barium = less than 0.05 ppm after lime softening,
raw water barium is approx. 0.15 ppm Strontium approx. 1.7 ppm
Pretreatment (See Legend below) GrFl, lime softening, re-carbonation, ultra filtration, acid, AScl, CtFl
Desal Process Reverse Osmosis (RO); Supplier: Osmonics, Inc. Recovery Rate 85 % Post Treatment pH adjustment; chlorination Blending Yes Ratio varies depending on
demand Concentrate Disposal Return to Lake Granbury/Brazos River Permitting/Regulation Issues None - normal permits obtained Environmental Issues None Capital Cost, Total Plant Capital Cost, Desal Equipment Operating Cost, Excluding Debt Service
Supplemental Information/Description: The RO Plant is operated in parallel with a conventional WTP and in conjunction with an older EDR Plant. All processed water streams are combined (blended) for distribution to several retail water supply entities.
REFERENCE PLANT DATA SHEET Location: Fort Stockton, Texas Owner: City of Fort Stockton Contact Person(s): Commissioning Date: 7/1/97 N/A
Other Capacity/Size Current Capacity @ 3 mgd

Central Arizona Salinity Study A-37 Brackish Water Subcommittee
Capacity/Size Ultimate Capacity @ mgd Source Water Type/Quality TDS 1433 ppm Calcium ppm Magnesium ppm Sulfate ppm Sodium 253 ppm Chloride 360 ppm Silica ppm Iron ppm Other Constituents hardness @ 560 ppm
@ ppm @ ppm
Pretreatment Cartridge Filters ultraviolet disinfection Desal Process RO Recovery Rate 80 % Post Treatment Aeration? pH adjustment Blending N/A % w/
Other does not mention how much Concentrate Disposal Other: blend-effluent-crops Permitting/Regulation Issues N/A Environmental Issues N/A Capital Cost, Total Plant N/A $ . M
Other Capital Cost, Desal Equipment N/A $ 3.75M
Other Operating Cost, Excluding Debt Service
$ /AF $ 123k/MG $ /CCF Other
Supplemental Information/Description: N/A
REFERENCE PLANT DATA SHEET Location: Cypress Water Treatment Plant Owner: City of Witchita Falls, Texas Contact Person(s): Unknown

Central Arizona Salinity Study A-38 Brackish Water Subcommittee
Commissioning Date: / / NA Other
Capacity/Size Current Capacity @ 14 mgd Capacity/Size Ultimate Capacity @ mgd Source Water Type/Quality Surface Water :Lake Kemp TDS 1200 ppm Calcium ppm Magnesium ppm Sulfate 400 ppm Sodium ppm Chloride 400 ppm Silica ppm Iron ppm Other Constituents Turbidity @ ppm
DOC @ ppm @ ppm
Pretreatment (See Legend below) AScl/Coag/Sed/Mem/CtFl/CO Desal Process RO Recovery Rate % Post Treatment NA/CO Blending NA Ratio :
Other Concentrate Disposal To Sanitary Sewer/CO Permitting/Regulation Issues N/A Environmental Issues N/A Capital Cost, Total Plant NA $ . M
Other Capital Cost, Desal Equipment NA $ . M
Other Operating Cost, Excluding Debt Service
$ /AF $ /MG $ /CCF Other
Supplemental Information/Description: NA
Wichita Falls, Texas

Central Arizona Salinity Study A-39 Brackish Water Subcommittee
General Background: Cypress Water Treatment Plant was constructed to treat a high TDS surface water from Lake Kemp. The water in Lake Kemp has high chloride levels and high sulfates. The water from the lake has typically been used for irrigation. The City of Wichita Falls performed a pilot program on the lake water to determine pretreatment requirements and then constructed a 14 mgd facility. The facility recently began operation. Objective of WTP: The treatment plant was designed to produce potable water with low sulfates and chloride. TDS of source water: 900-1200 mg/l Pretreatment: Cagulation and Sedimentation followed by Microfiltration Treatment method used: Reverse Osmosis Blending Stabilization: RO Permeate is stabilized with sodium hydroxide. Design Capacity: MF Capacity is 14 mgd, RO capacity is approximately 12 mgd Recovery rate of water: 80% recovery How was concentrate managed?: Unknown Were there water quality constituents of concern other than TDS: DOC, TOC, Turbidity, Taste & Odor Implementation of a 3 MGD Reverse Osmosis Plant (Fort Stockton, Texas) Keith A. Rutherford
Reviewed by: Thomas K. Poulson Summary: City of Fort Stockton, Texas operates a 3 mgd RO desal plant since 1997 for 8,524 residents and 1000 inmates. Well water is treated with a TDS of 1500 to 1400 mg/L. Besides TDS, chlorides (370 mg/L), sodium (260 mg/L) and Hardness (590 mg/L Caco3) are over the State’s drinking water standards. Four reverse osmosis units produce a total of 3.04 mgd permeate using two stage trains at a recovery rate of 80%. Pretreatment consists of ultraviolet disinfection to prevent bacteria from growing on the membranes. Sulfuric acid is added to the disinfected water to lower pH to prevent

Central Arizona Salinity Study A-40 Brackish Water Subcommittee
calcium carbonate from precipitating out. Then antiscalant is added. Two 5 micron filters are the final step before the RO units. Operating PSI between 175 and 200. Salt rejection rate of approximately 95%. The permeate is blended with well water then goes through post treatment consisting of degasification done with blowers to strip CO2 form the water and raise the pH to 7.3. Caustic solution is used when the air stripper does is not sufficient. Then the water moves through a chlorinator to two large storage tanks. The brine is pumped 7 miles mixed with WWTP effluent and used to irrigate crops. Three other options were considered evaporation ponds (too expensive), surface discharge to the Pecos River (40 miles away and NPDES permit), and injection wells (concerned of long term environmental impacts and permitting) No mention of government regulations or environmental issues except for discharge options which were not selected because of them. This paper had a very good cost analysis of R.O. and EDR. O&M costs were higher for the RO $369,077 versus $361,301 for EDR. But the capital costs for RO were lower $3,752,520 versus $4,261,692 for EDR. The RO option was selected and actual O&M costs for 1998 was $306,567.
REFERENCE PLANT DATA SHEET Location: New Castle County, Delaware Owner: United Water Contact Person(s): HDR Engineering, Inc. Commissioning Date: / / NA
Other FEASIBILITY STUDY Capacity/Size Current Capacity @ 24 mgd Capacity/Size Ultimate Capacity @ mgd Source Water Type/Quality Surface Water TDS NA ppm Calcium NA ppm Magnesium NA ppm Sulfate NA ppm Sodium NA ppm Chloride 35 ppm Silica NA ppm Iron .005 ppm
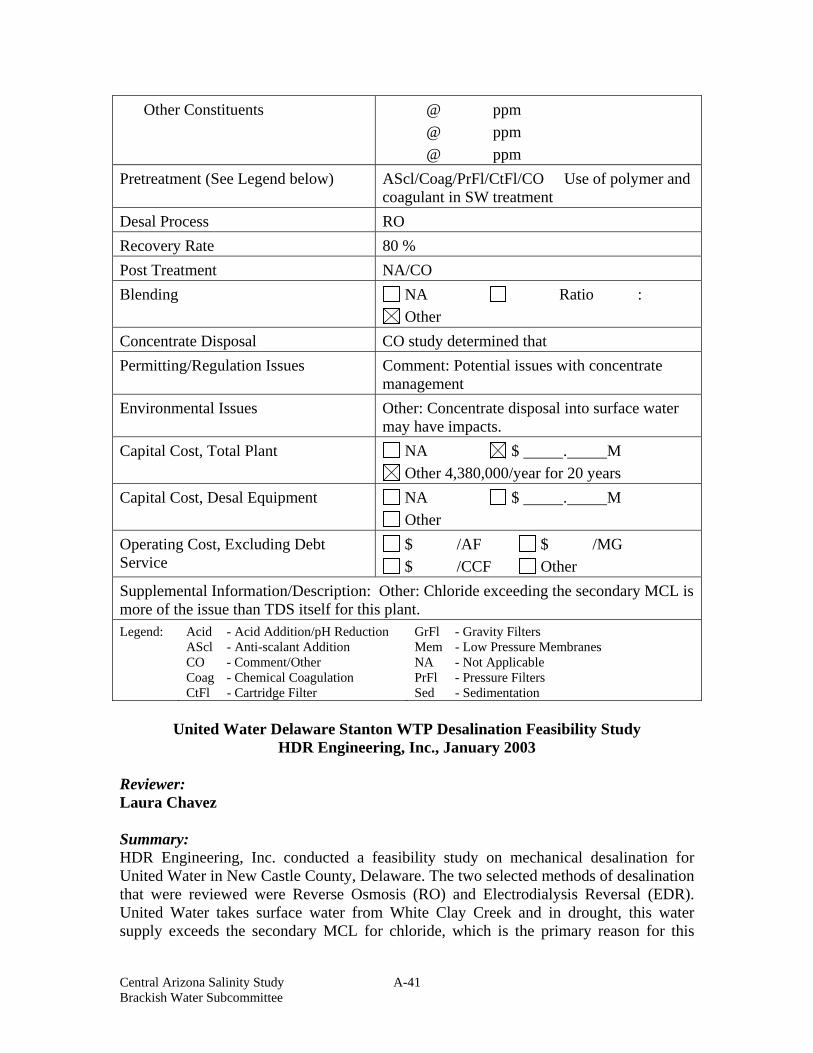
Central Arizona Salinity Study A-41 Brackish Water Subcommittee
Other Constituents @ ppm @ ppm @ ppm
Pretreatment (See Legend below) AScl/Coag/PrFl/CtFl/CO Use of polymer and coagulant in SW treatment
Desal Process RO Recovery Rate 80 % Post Treatment NA/CO Blending NA Ratio :
Other Concentrate Disposal CO study determined that Permitting/Regulation Issues Comment: Potential issues with concentrate
management Environmental Issues Other: Concentrate disposal into surface water
may have impacts. Capital Cost, Total Plant NA $ . M
Other 4,380,000/year for 20 years Capital Cost, Desal Equipment NA $ . M
Other Operating Cost, Excluding Debt Service
$ /AF $ /MG $ /CCF Other
Supplemental Information/Description: Other: Chloride exceeding the secondary MCL is more of the issue than TDS itself for this plant. Legend:
Acid - Acid Addition/pH Reduction AScl - Anti-scalant Addition CO - Comment/Other Coag - Chemical Coagulation CtFl - Cartridge Filter
GrFl - Gravity Filters Mem - Low Pressure Membranes NA - Not Applicable PrFl - Pressure Filters Sed - Sedimentation
United Water Delaware Stanton WTP Desalination Feasibility Study
HDR Engineering, Inc., January 2003 Reviewer: Laura Chavez Summary: HDR Engineering, Inc. conducted a feasibility study on mechanical desalination for United Water in New Castle County, Delaware. The two selected methods of desalination that were reviewed were Reverse Osmosis (RO) and Electrodialysis Reversal (EDR). United Water takes surface water from White Clay Creek and in drought, this water supply exceeds the secondary MCL for chloride, which is the primary reason for this

Central Arizona Salinity Study A-42 Brackish Water Subcommittee
study. Although White Clay Creek is tidally influenced, information on TDS levels was not mentioned. This water has a highly variable turbidity level, which may affect potential membrane treatment. The paper recommended that turbidity of feedwater entering the RO unit be less than 0.2 NTU and have a level of less than 5 SDI. Fouling of the membranes is not as apt to occur with EDR, but pretreatment should occur for iron (>0.3 mg/L), manganese (>0.1 mg/L), free chlorine (>.05 mg/L) and turbidity (>0.2 NTU). During the severe drought of 2002, the SDI in White Clay Creek was about 15. Another issue of concern with desalination is the “re-equilibrium process”. The re-equilibrium process occurs when corroded, but stable plumbing come to a new equilibrium with water that has a different chemistry than when the corrosion developed. When this occurs, the build-up of corrosion is loosened and released into the distribution system, potentially causing aesthetic (red water) problems and regulatory problems (non-compliance with lead and copper rule). This loosening can also cause leaks in infrastructures and cause customers to use more water to flush the corrosion. Recovery of RO is 80% and 85% for EDR. This becomes an issue for the water treatment plant because current capacity of the conventional water treatment plant is 24 mgd. EDR and RO would require a capacity of 28 to 31 mgd respectively because of losses in the concentrating step. Therefore capacity becomes an issue for both types of treatment. The high-estimate annual cost for a 24 mgd plant for RO was $4,380,000 and for EDR was $6,720,000. Although EDR was more expensive than RO, EDR was the recommended desalination process for United Water because of capacity and pretreatment issues. HDR recommended that some other alternative such as, Aquifer Storage and Recovery, be considered other than mechanical desalination because of the high costs, arduous regulatory hoops and limited times when use of desalination would be required. The options for concentrate management that were reviewed and issues with this option are summarized in the following bullets:
• Surface Water Discharge – most viable option, but will require • Discharge to Sewer System – the quantity of discharge makes this option
infeasible. • Ocean Discharge – the distance to the ocean and regulatory considerations makes
this option infeasible. • Land Applications – this option is limited by the availability of land and
regulatory considerations. • Evaporation Ponds – this option is limited by the availability of land and
regulatory considerations. • Deep Well Injection – assumed that regulatory acceptance in Delaware would be
difficult.

Central Arizona Salinity Study A-43 Brackish Water Subcommittee
Using Electrodialysis to Meet Drinking Water Requirements Review by B. Kelso Overall the Paper gave a summary of background information on the development of ED and EDR. • First ED plant in 1954 in Arabia. • Buckeye, AZ first ED plant in US in 1962. • EDR patented in mid-sixties. Significant improvement over ED. • Almost all ED plants have been upgraded to EDR. Report included a table of thirteen EDR plants in Arizona and neighborhood states. Flows ranged from 20 – 4200 gpm. TDS concentrations ranged from 1000-4000 ppm. Source waters included surface and groundwater. The report also included summaries for 3 existing EDR plants (see below).
REFERENCE PLANT DATA SHEET Location: Buckeye, AZ Owner: Town of Buckeye Contact Person(s): Commissioning Date: / / NA
Other 1988 for EDR Capacity/Size Current Capacity @ 0.9 mgd Capacity/Size Ultimate Capacity @ mgd Source Water Type/Quality Ground Water TDS 1587 ppm Calcium 95 ppm Magnesium 24 ppm Sulfate 219 ppm Sodium 446 ppm Chloride 700 ppm Silica 19 ppm Iron ppm Other Constituents @ ppm
@ ppm @ ppm
Pretreatment (See Legend below) NA/Comment Desal Process EDR Recovery Rate %

Central Arizona Salinity Study A-44 Brackish Water Subcommittee
Post Treatment NA/CO Blending NA Ratio :
Other Concentrate Disposal CO Permitting/Regulation Issues N/A Environmental Issues N/A Capital Cost, Total Plant NA $ 1.1M (1997 dollars)
Other Capital Cost, Desal Equipment NA $ . M
Other Operating Cost, Excluding Debt Service
$ /AF $ /MG $ /CCF Other $2/1000 gallons
Supplemental Information/Description: NA REFERENCE PLANT DATA SHEET
Location: Dell City, TX Owner: Dell City Contact Person(s): Commissioning Date: / / NA
Other 1996 Capacity/Size Current Capacity @ mgd Capacity/Size Ultimate Capacity @ mgd Source Water Type/Quality Ground Water TDS 1200-3000 ppm Calcium 206 ppm Magnesium 63.2 ppm Sulfate 564 ppm Sodium 19.6 ppm Chloride 17.8 ppm Silica ppm Iron ppm Other Constituents Hardness @ 774 ppm
@ ppm @ ppm
Pretreatment (See Legend below) NA/Comment Desal Process EDR

Central Arizona Salinity Study A-45 Brackish Water Subcommittee
Recovery Rate % Post Treatment NA/CO Blending NA Ratio :
Other Concentrate Disposal CO Used for irrigation Permitting/Regulation Issues N/A Environmental Issues N/A Capital Cost, Total Plant NA $ 1.1M (1997 dollars)
Other Capital Cost, Desal Equipment NA $ . M
Other Operating Cost, Excluding Debt Service
$ /AF $ /MG $ /CCF Other $2/1000 gallons
Supplemental Information/Description: NA
REFERENCE PLANT DATA SHEET Location: Buckeye, AZ Owner: Lewis Prison Contact Person(s): Commissioning Date: / / NA
Other 1988 Capacity/Size Current Capacity @ 1.35 mgd Capacity/Size Ultimate Capacity @ mgd Source Water Type/Quality Ground Water TDS 2000-2500 ppm Calcium ppm Magnesium ppm Sulfate ppm Sodium ppm Chloride ppm Silica ppm Iron ppm Other Constituents @ ppm
@ ppm @ ppm
Pretreatment (See Legend below) NA/Comment

Central Arizona Salinity Study A-46 Brackish Water Subcommittee
Desal Process EDR Recovery Rate 80-85 % Post Treatment NA/CO Blending NA Ratio :
Other Concentrate Disposal Evaporation Lagoon/CO Permitting/Regulation Issues N/A Environmental Issues N/A Capital Cost, Total Plant NA $ 1.1M (1997 dollars)
Other Capital Cost, Desal Equipment NA $ . M
Other Operating Cost, Excluding Debt Service
$ /AF $ /MG $ /CCF Other $2/1000 gallons
Supplemental Information/Description: NA Full-scale Evaluation of Reverse Osmosis Concentrate Water Quality for Compliance with Surface Water Discharge Regulations Authors: David Laliberte, Catherine Keenan, John Ten Eyck, and Roy P. Kain Reviewer: Laura Chavez Summary: The City of Vero Beach, Florida has run a Reverse Osmosis (RO) facility for eleven years, at the time this paper was written, using the original membranes. Scaling became an issue on the membranes and it was decided that they should be replaced after the City attempted to clean the membranes. Three different manufacturers’ membranes were selected for side-by-side testing on using the same source water. The quality of the concentrate stream was the issue for the plant because concentrate is disposed of into a canal past the tidal salinity barrier under a National Pollutant Discharge Elimination System (NPDES) permit. To keep this permit, Vero Beach must utilize a mixing zone prior to sampling the blended stream and maintain annual averages for hydrogen sulfide, dissolved oxygen, total phosphorus, total nitrogen, iron, toxicity, gross alpha activity and radium. Concentrate from the membranes was tested for acute and chronic toxicity testing on Mysidopsis bahia shrimp in 5 concentration levels for each membrane. It was found that calcium and fluoride were key indicators in the toxicity tests.

Central Arizona Salinity Study A-47 Brackish Water Subcommittee
Paper Title: Desalination Concentrate Management and Issues in the United States
Location: 216 treatment plants in 50 StatesOwner/Author: Michael C. Mickley, P.E., Ph.D.Contact Person(s): Michael C. Mickley, P.E., Ph.D.Commissioning Date: Varies, From earlier than1993 thru 2001Capacity Size: Smallest Plant = 0.025 mgdCapacity Size: Largest Plant > 10 mgdSource Water Type/Quality Varies - Surface and Groundwater TDS Varies Calcium Varies Magnesium Varies Sulfate Varies Sodium Varies Chloride Varies Silica Varies Iron Varies Other Constituents VariesPretreatment (See Legend Below) Varies including MFs before NF and RODesal Process All Membranes (MF, UF, NF, RO & ED)Recovery Rate VariesPost Treatment VariesBlending VariesConcentrate Disposal Varies, surface discharge, disposal to
sewer, deep well, evaporation pond, spray irrigation, & reuse
Permitting/Regulation Issues NPDES permits need to be obtained/modified; deep well injection permitting
Environmental Issues VariesCapital Cost, Total Plant VariesCapital Cost, Desal Equipment VariesOperating Cost, Excluding Debt Service VariesSupplemental Information/Description: This paper provides a good summary of the
number and types of membrane plants that are over 0.025 mgd built before 2002, including their concentrate disposal
REFERENCED PLANT/PAPER DATA SHEET

Central Arizona Salinity Study A-48 Brackish Water Subcommittee
Water logging within the Buckeye Water Conservation and Drainage District Leonard C. Halpenny
Reviewed by: Thomas K. Poulson Summary: This report is not complete. Sections and entire chapters were not released by ADWR. But what is in the report is interesting. The first point that is made is that the water logging of the southwest Salt River Valley is due to farming practices and not as many believe the 91st Avenue WWTP effluent. Although, obviously the WWTP is now contributing to the water logged area. The first chapter, which is chapter 3, is a brief history of irrigation in this area. The first land (902 acres) irrigated in the Buckeye Irrigation District was done so in 1887. By 1915 there was a total of 19,865 acres of farmland under irrigation. Water logging was sever in the early 1920’s. All of the water was being attained from the Gila River. The U.S. Department of agriculture recognized the water logging problem in 1927 (Harper, W.B., and Youngs, F.O., 1927, Soil Survey of the Buckeye-Beardsley Area, Arizona: U.S. Dept. Agric., Bur. Of Chem. And Soils, Series 1927, Bull. 3. 43 p.), “Several thousand acres of comparatively low lying lands of the Buckeye irrigation district are affected with a high water table and such quantities of alkali salts that crop production is precluded.” Roosevelt Dam was completed 1911, which made possible additional irrigation for crops. Over the years different sources of water were used as litigation by various groups argued over water rights. Salt River water, Gila River water and in recent years effluent have all been the sources of water. Gillespie Dam was completed in 1921. Table 6-1 shows 47 BIC wells which the water table rose up to 68 feet between the years of 1960 and 1983. Table 6-3 shows TSS (total soluble solids) in 34 BIC wells with in a range of 1578 mg/L to 4871 mg/L. (Definition: Soluble salts is the measurement of all the elements (ions) dissolved in the soil water. This is very similar to TDS except what is meant by soil water?) The arithmetic average TSS for BIC wells (un-weighted as to volume) for all samples in 1982 was 3,258 mg/L TSS.
REFERENCE PLANT DATA SHEET Location: Avondale, AZ Owner: Reclamtion study

Central Arizona Salinity Study A-49 Brackish Water Subcommittee
Contact Person(s): Commissioning Date: 2/22/96 N/A
Other Capacity/Size Current Capacity @ 2 mgd Capacity/Size Ultimate Capacity @ mgd Source Water Type/Quality TDS 2100 ppm Calcium ppm Magnesium ppm Sulfate ppm Sodium ppm Chloride 670 ppm Silica ppm Iron ppm Other Constituents @ ppm
@ ppm @ ppm
Pretreatment Gravity Filters antiscalent Desal Process NF Recovery Rate % Post Treatment Chemical Stabilization Blending N/A % w/
Other Concentrate Disposal Evap Lagoon Permitting/Regulation Issues N/A Environmental Issues Other: biofouling decreased membrane
performance Capital Cost, Total Plant N/A $ . M
Other Capital Cost, Desal Equipment N/A $ 6.78M
Other Operating Cost, Excluding Debt Service
$ /AF $ /MG $ /CCF Other
Supplemental Information/Description: N/A

Central Arizona Salinity Study A-50 Brackish Water Subcommittee
Maricopa Groundwater Treatment Study Bureau of Reclamation
Reviewed by: Thomas K. Poulson Summary: The cities of Avondale, Chandler and the Gila River Indian Community partnered with Reclamation to test two methods of desalination of water drawn from well s5 located in the City of Avondale. Reverse Osmosis and Electrodialysis (ED) were the methods of desalination chosen for the pilot testing. The contaminants of concern were nitrates and turbidity. Secondary contaminants were chlorides and total dissolved solids (TDS). Nitrate levels were about 21 mg/L (way above the primary standard of 10 mg/L). Turbidity was approximately 10 (way above the primary standard of .5). The TDS of the well water was approximately 2,100 mg/L (way above the secondary standard of 500 mg/L). The concentration of chlorides was approximately 670 mg/L (way above the secondary standard of 250). Pre treatment for the RO unit consisted of conventional water treatment (rapid mix, flocculation basin, stilling well, pressure clarifier, multi-media pressure filter) then to the RO feed tank. From the feed tank anti-scalent and acid were added and a cartridge filter before the RO membranes. The membranes were FilmTec BW30-2540 (the report was written in 1996). No post treatment was used as the permeate and the concentrate were disposed. But blending would be used in actual production to produce the required water quality. Pre treatment for the ED was the same conventional water treatment as with RO. No anti scalent or acid was used but a cartridge filter right before the ED membranes. No post treatment was used. But blending would be used in actual production to produce the required water quality. The RO had a feed rate of approximately 20 L/min which works out to be about 7,600 gal/day. Although I could not find data on the ED unit flow rate it must have been similar to the RO piloting. Since this was pilot testing no unique regulatory or environmental issues were brought up. The results of the 6 week pilot testing indicated that although the RO produced much better quality water there was a 11 percent drop off of permeate flow. The membranes were autopsied after the test and there was scaling and biofouling. “The decision not to disinfect prior to the RO unit resulted in the deposition of biological matter onto the cartridge filter. Biofouling may have contributed to decreased membrane performance.” The RO recovery rate was not found but typically that runs about 75% in a two stage system.

Central Arizona Salinity Study A-51 Brackish Water Subcommittee
The ED unit had a 80% recovery rate but the water was of much lower quality. The conclusions drawn from the pilot testing was that when the TDS of groundwater is about 1100 mg/L less and the nitrate concentration is about 23 mg/L or less ED is recommended. A 2 mgd ED plant (no brine disposal) would cost about $6,730,000 and annualized costs (20 years, 6.5%) would be $610,000. If the TDS is greater then 1100 mg/L then nanofiltration (Huh!!??) is recommended. (although nanofiltration was not piloted, it was thought that it would work and be cheaper to operate then RO because the water quality goals were not that sever). A 2 mgd nanofiltration plant (no brine disposal) would cost $6,780,000 and annualized costs would be $615,000. A conclusion I came to is that pretreatment better resolve all issues before building a production RO facility. Brine Disposal from Land Based Membrane Desalination Plants: A Critical Assessment Reviewed by B. Kelso This paper summarizes/compares three concentrate management technologies: Deep Well Injection, Evaporation Ponds, and Solar Ponds. Generally mentions 300 mgd plant being considered by MWD as purpose for looking at these three technologies, but does not necessarily relate the technologies to a specific type of desal projects (i.e. groundwater, surface water, or salt water). Technologies are very basic. Final conclusion recommends MWD use an ocean outfall for disposal of concentrate.
REFERENCE PLANT DATA SHEET Location: Chandler, Arizona Owner: City of Chandler Contact Person(s): Doug Toy, City of Chandler Commissioning Date: / / NA
Other Capacity/Size Current Capacity @ mgd Capacity/Size Ultimate Capacity @ mgd Source Water Type/Quality Ground Water TDS 1300 - 1800 ppm Calcium ppm Magnesium ppm Sulfate ppm

Central Arizona Salinity Study A-52 Brackish Water Subcommittee
Sodium ppm Chloride ppm Silica ppm Iron ppm Other Constituents Nitrate @ <5 - >30 ppm Pretreatment (See Legend below) NA/Comment Desal Process RO Recovery Rate % Post Treatment NA/CO Blending NA Ratio :
Other Concentrate Disposal CO Permitting/Regulation Issues N/A Environmental Issues N/A Capital Cost, Total Plant NA $ . M
Other Capital Cost, Desal Equipment NA $ . M
Other Operating Cost, Excluding Debt Service
$ /AF $ /MG $ /CCF Other
Supplemental Information/Description: Other: The purpose of this study was to identify possible uses for high TDS groundwater from the shallow aquifer. The study concludes that this water may be used for irrigating "low appearance turf" or salt tolerant landscaping.
REFERENCE PLANT DATA SHEET Location: Suffolk Groundwater Treatment Plant Owner: City of Suffolk, VA Contact Person(s): Unknown Commissioning Date: 7/1/1990 NA
Other Capacity/Size Current Capacity @ 4 mgd Capacity/Size Ultimate Capacity @ 15 mgd Source Water Type/Quality Ground Water TDS 560 ppm

Central Arizona Salinity Study A-53 Brackish Water Subcommittee
Calcium ppm Magnesium ppm Sulfate ppm Sodium 185 ppm Chloride ppm Silica ppm Iron ppm Other Constituents Flouride @ 4.8 ppm
@ ppm @ ppm
Pretreatment (See Legend below) AScl/CtFl/CO Desal Process EDR Recovery Rate 94 % Post Treatment Chem Stabl/CO Blending NA Ratio :
Other Concentrate Disposal CO Unknown Permitting/Regulation Issues N/A Environmental Issues N/A Capital Cost, Total Plant NA $ . M
Other Capital Cost, Desal Equipment NA $ . M
Other Operating Cost, Excluding Debt Service
$ /AF $ /MG $ /CCF Other
Supplemental Information/Description: Other: Product Quality = 140 mg/l TDS, 1.2 mg/l F, 50 mg/l Sodium, Currently Expanding to 15 mgd
Newport News, VA EDR General Background: Project was implemented by the City of Suffolk, Virginia to meet water demand. The local groundwater proved to be the best alternative source of water, however it had high fluoride and sodium in the water. The evaluation included RO and Electrodialysis Reversal (EDR) and activated alumina. Activated Alumina was eliminated from consideration since it would not remove sodium. EDR ended up providing the best alternative due to the high recovery rates and the lower operating costs at the high recovery.

Central Arizona Salinity Study A-54 Brackish Water Subcommittee
Objective of WTP: Fluoride and Sodium Removal TDS of source water: 560 mg/l, 4.8 mg/l Flouride, 185 mg/l sodium Pretreatment: Cartridge Treatment method used: Electrodialysis Reversal (EDR) Blending Stabilization: Not with EDR, complete treatment of feed stream. Design Capacity: 3.8 mgd Recovery rate of water: 94.5% How was concentrate managed?: Discharge to a local creek for dilution Were there water quality constituents of concern other than TDS: Fluoride Any unique permitting/regulatory issues?: Unknown

Central Arizona Salinity Study B-1 Final Draft Report Brackish Water Subcommittee May 25, 2006
Appendix B List of Primary and Secondary MCLs

Central Arizona Salinity Study B-2 Brackish Water Subcommittee

Central Arizona Salinity Study B-3 Brackish Water Subcommittee

Central Arizona Salinity Study B-4 Brackish Water Subcommittee

Central Arizona Salinity Study B-5 Brackish Water Subcommittee

Central Arizona Salinity Study B-6 Brackish Water Subcommittee

Central Arizona Salinity Study B-7 Brackish Water Subcommittee

Central Arizona Salinity Study C-1 Brackish Water Subcommittee
Appendix C West Valley Brackish Groundwater Appraisal Study

APPRAISAL LEVEL STUDY OF A BRACKISH WATER TREATMENT PLANT
CITY OF GOODYEAR
ARIZONA
DECEMBER 19, 2005
Prepared for: City of Goodyear
119 North Litchfield Road Goodyear, Arizona 85338
Prepared by: Brown and Caldwell 201 East Washington, Suite 500 Phoenix, Arizona 85004 Brown and Caldwell Project Number: 126555.001

Appraisal Level Study of a Brackish Water Treatment Plant City of Goodyear, Arizona
TABLE OF CONTENTS
PAGE
TABLE OF CONTENTS................................................................................................................. i LIST OF FIGURES ........................................................................................................................ ii LIST OF TABLES...........................................................................................................................v 1.0 INTRODUCTION ........................................................................................................... 1-1 2.0 WATER SUPPLY, ADEQUACY, RELIABILITY AND QUALITY............................ 2-1
2.1 PHASE 1 - BACKGROUND ....................................................................................... 2-1 2.2 BASECASE MODEL................................................................................................... 2-2
2.2.1 Basecase Model Assumptions.............................................................................. 2-2 2.2.2 Basecase Model Results....................................................................................... 2-3
2.3 DETERMINATION OF CAUSES OF MODEL DIFFERENCES .............................. 2-4 2.4 PHASE 1 RECOMMENDATIONS ............................................................................. 2-5 2.5 PHASE 2 – WATER BALANCE STUDY .................................................................. 2-5
2.5.1 Approach.............................................................................................................. 2-6 2.6 GROUNDWATER INFLOW COMPONENTS........................................................... 2-6
2.6.1 Groundwater Underflow ...................................................................................... 2-6 2.6.2 Agriculture Related Recharge.............................................................................. 2-7 2.6.3 Stream Recharge .................................................................................................. 2-9
2.7 GROUNDWATER OUTFLOW COMPONENTS..................................................... 2-10 2.7.1 Groundwater underflow..................................................................................... 2-10 2.7.2 Groundwater Pumpage....................................................................................... 2-10 2.7.3 Groundwater Discharged to Gila River ............................................................. 2-10 2.7.4 Evapotranspiration ............................................................................................. 2-11
2.8 SRV MODEL SIMULATED BUDGET VERSUS. BC WATER BUDGET ............ 2-11 2.8.1 SRV Model Simulated Water Budget................................................................ 2-11 2.8.2 BC Estimated Water Budget.............................................................................. 2-11 2.8.3 Differences between the Two Water Budgets ................................................... 2-12
2.9 EXPLANATION OF PHASE 2 RESULTS ............................................................... 2-12 2.10 ESTIMATED AND OBSERVED SURFACE FLOW AT THE GILLESPIE
DAM. .......................................................................................................................... 2-13 2.11 PHASE 2 SUMMARY AND CONCLUSIONS ........................................................ 2-13 2.12 PHASE 2 RECOMMENDATIONS ........................................................................... 2-15
3.0 BENCHMARKING OF DESALINATION PROJECTS ................................................ 3-1 3.1 CENTERRA WELL REVERSE OSMOSIS FACILITY, GOODYEAR, ARIZONA.3-2 3.2 GILA BEND REVERSE OSMOSIS FACILITY, GILA BEND, ARIZONA ............. 3-3 3.3 LEWIS PRISON ELECTRODIALYSIS REVERSAL FACILITY, BUCKEYE,
ARIZONA..................................................................................................................... 3-3 3.4 CHINO I DESALTER, CHINO, CALIFORNIA ......................................................... 3-3
p:\goodyear, city of\26555_brackish_water_study\working\westcaps brackish report final.doc\5/26/06\lc i

Appraisal Level Study of a Brackish Water Treatment Plant City of Goodyear, Arizona
TABLE OF CONTENTS - CONTINUED
3.5 GOLDSWORTHY DESALTER, TORRANCE, CALIFORNIA ................................ 3-4
4.0 CONCENTRATE DISPOSAL ........................................................................................ 4-1 4.1 EVAPORATION .......................................................................................................... 4-1 4.2 LAND APPLICATION ................................................................................................ 4-2 4.3 TRANSPORTATION................................................................................................... 4-2
4.3.1 Surface Water Discharge ..................................................................................... 4-2 4.3.2 Sewer Disposal..................................................................................................... 4-2
4.4 INJECTION .................................................................................................................. 4-3 4.4.1 Deep Well Injection ............................................................................................. 4-3 4.4.2 Recharge into Poor Quality Aquifers................................................................... 4-3
4.5 ZERO LIQUID DISCHARGE ..................................................................................... 4-3 4.5.1 Brine Concentrators ............................................................................................. 4-4 4.5.2 Crystallizers ......................................................................................................... 4-4
4.6 PROPRIETARY VOLUME REDUCING TECHNOLOGIES.................................... 4-4 4.6.1 High Efficiency Reverse Osmosis ....................................................................... 4-4 4.6.2 Sal-Proc................................................................................................................ 4-5
5.0 LEGAL ISSUES .............................................................................................................. 5-1 6.0 CONCLUSIONS.............................................................................................................. 6-1 7.0 REFERENCES ................................................................................................................ 7-1
LIST OF FIGURES
FIGURE
1 PUMPING OUT, WEST SRV
2 TOTAL PUMPAGE FOR THE AREA OF INTEREST
3 TOTAL RECHARGE FOR AREA OF INTEREST
4 LAYER 2, 2004 SIMULATED GROUNDWATER ELEVATION CONTOURS
p:\goodyear, city of\26555_brackish_water_study\working\westcaps brackish report final.doc\5/26/06\lc ii

Appraisal Level Study of a Brackish Water Treatment Plant City of Goodyear, Arizona
LIST OF FIGURES (CONTINUED)
FIGURE
5 LAYER 2, 2025 SIMULATED GROUNDWATER ELEVATION CONTOURS
6 LAYER 2, 2110 SIMULATED GROUNDWATER ELEVATION CONTOURS
7 WESTCAPS BASECASE (REV 2/23/00) – COMPARISON OF HYDROGRAPHS, MIDDLE ALLUVIAL UNIT – SIMULATED DEPTHS TO WATER
8 LAYER 2, 2025 SIMULATED GROUNDWATER ELEVATION CONTOURS
WITH INCREASED RECHARGE AND DECREASED PUMPING
9 LAYER 2, 2110 SIMULATED GROUNDWATER ELEVATION CONTOURS WITH INCREASED RECHARGE AND DECREASED PUMPING
10 OBS-1
11 OBS-2
12 OBS-3
13 OBS-4
14 OBS-5
15 OBS-6
16 OBS-7
17 OBS-8
18 OBS-9
19 OBS-10
20 OBS-11
21 OBS-12
22 OBS-13
p:\goodyear, city of\26555_brackish_water_study\working\westcaps brackish report final.doc\5/26/06\lc iii

Appraisal Level Study of a Brackish Water Treatment Plant City of Goodyear, Arizona
LIST OF FIGURES (CONTINUED) FIGURE
23 TOTAL RECHARGE IN ACRE-FEET PER YEAR, WEST SRV
24 TOTAL CUMULATIVE RECHARGE IN ACRE-FEET, WEST SRV
25 TOTAL PUMPAGE IN ACRE-FEET PER YEAR, WEST SRV
26 TOTAL CUMULATIVE PUMPING IN ACRE-FEET, WEST SRV
27 TOTAL RECHARGE IN ACRE-FEET PER YEAR, AREA OF INTEREST
28 TOTAL CUMULATIVE RECHARGE IN ACRE-FEET, AREA OF INTEREST
29 TOTAL PUMPING IN ACRE-FEET PER YEAR, AREA OF INTEREST
30 TOTAL CUMULATIVE PUMPING IN ACRE-FEET, AREA OF INTEREST
31 TOTAL ANNUAL STREAMFLOW
32 TOTAL ANNUAL STREAMFLOW
33 LOCATION MAP OF THE AREA OF INTEREST (AOI)
34 PUMPAGE BY DIFFERENT PARTIES
35 SRV MODEL SIMULATED WATER BUDGET
36 BC ESTIMATED WATER BUDGET
37 1991 WATER LEVEL ELEVATIONS
38 2002 WATER LEVEL ELEVATIONS
39 1991 TO 2002 WATER LEVEL ELEVATION CHANGE
40 GILA RIVER FLOW COMPONENTS
41 COMPARISON OF GILA RIVER FLOW IN WATERLOGGED AREA VS. GILA RIVER FLOW AT GILLESPIE DAM
42 COMPARISON OF GILA RIVER FLOW IN WATERLOGGED AREA VS.
GILA RIVER FLOW AT GILLESPIE DAM
p:\goodyear, city of\26555_brackish_water_study\working\westcaps brackish report final.doc\5/26/06\lc iv
Appraisal Level Study of a Brackish Water Treatment Plant City of Goodyear, Arizona
LIST OF TABLES
TABLE
1 ESTIMATED AGRICULTURAL RECHARGE FOR BIC
2 ESTIMATED AGRICULTURAL RECHARGE FOR RID
3 ESTIMATED AGRICULTURAL RECHARGE FOR ACC
4 SRV MODEL SIMULATED WATER BUDGET IN THE WATERLOGGED AREA
5 BC ESTIMATED WATER BUDGET IN THE WATERLOGGED AREA
6 DIFFERENCES BETWEEN THE SRV MODEL SIMULATED AND BC
ESTIMATED WATER BUDGET
7 SUMMARY OF PERTINENT DESALTING PROJECTS IN THE SOUTHWEST
8 CENTERRA WELL RAW WATER QUALITY
p:\goodyear, city of\26555_brackish_water_study\working\westcaps brackish report final.doc\5/26/06\lc v

Appraisal Level Study of a Brackish Water Treatment Plant City of Goodyear, Arizona
1.0 INTRODUCTION As Arizona’s water resources become fully utilized, water providers will begin to look at sources of water that were previously considered unusable to meet future demands. These sources are brackish water for potable uses and effluent for non-potable uses. Brackish water is defined as having a total dissolved solids (TDS) content of 1,000 milligrams per liter (mg/L) to about 25,000 mg/L. Although there is no drinking water standard for TDS, a drinking water secondary maximum contaminant level (SMCL) of 500 mg/L exists for water. Water in the southwest Salt River Valley (SRV) has historically seen TDS levels ranging from 800 to 2,500 mg/L due to many factors including the natural drainage pattern of the SRV, long-term agricultural irrigation, and effluent discharge into the river. In addition to high TDS, this area often experiences high levels of nitrate, fluoride, and arsenic and will require advanced treatment to achieve potable standards. A portion of the southwest SRV is also classified as “water logged” by the Arizona Department of Water Resources (ADWR). Water levels in this area are often as high 10 feet below land surface (bls) and would reach the surface if it were not for drainage wells in the area. Farmers may use this water for agricultural irrigation and are exempt from the groundwater rules imposed by the 1980 Arizona Groundwater Code. The purpose of this study is to quantify the physical availability of brackish water for potable use after desalination in the southwest SRV and whether this supply can be used long-term. This study was conducted by Brown and Caldwell on behalf of WESTCAPS. In cooperation with the Central Arizona Salinity Study (CASS) this study also incorporated information on similar desalination projects throughout the southwest, legal issues facing the use of brackish water.
p:\goodyear, city of\26555_brackish_water_study\working\westcaps brackish report final.doc\5/26/06\lc 1-1

Appraisal Level Study of a Brackish Water Treatment Plant City of Goodyear, Arizona
2.0 WATER SUPPLY, ADEQUACY, RELIABILITY AND QUALITY Brown and Caldwell (BC) has been tasked with conducting predictive simulations using the ADWR 2002 SRV model to estimate the quantity of groundwater that may be available for extraction from the water logged area present in the southwest corner of the West Salt River Valley (WSRV) groundwater basin. More specifically, this area is located north to south between the Buckeye Irrigation District Canal and the Buckeye Hills, and east to west from approximately the 91st Avenue Wastewater Treatment Plant (WWTP) to Gillespie Dam. Difficulties in completing this task were encountered due to the applicability of the SRV model for the increased spatial level of scrutiny required for this work and uncertainties regarding long-term estimates needed for WSRV recharge and pumping. This letter report presents a summary of our findings. 2.1 PHASE 1 - BACKGROUND Concerns over the applicability of the SRV model for developing long-term estimates of available water from the water logged zone were raised by the BC modeling staff initially based on the close proximity of the water logged area to the southwestern boundaries of the model. This was a concern because the ADWR 2002 SRV and WESTCAPS models had simulated the interface between the WSRV basin and the southeastern portion of the Lower Hassayampa basin as a constant hydraulic head or water level. What this would result in is a constant source of subflow into the SRV model with the volumetric flux depending on the magnitude of groundwater levels within the southwestern corner of the SRV model. Another way of stating this is that the more drawdown that occurs in the water logged area, the greater the flux of groundwater from the Lower Hassayampa basin into the southwestern corner of the SRV model. Because the true long-term groundwater elevation conditions along the boundary between the WSRV and the Lower Hassayampa basins are unknown but are expected to decline, utilization of the SRV model boundary conditions could potentially result in an unrealistically optimistic estimate of the available groundwater in the area. ADWR’s assumptions and boundary condition were suitable for their needs because the focus of their interest was not the water logged zone and they were willing to sacrifice some accuracy in that portion of the model to assist the remainder of the model domain to the east. The U.S. Bureau of Reclamation (BOR) elected not to modify this model boundary when conducting the WESTCAPS modeling. A second concern was driven by ADWR’s recognition that the region of the SRV model from approximately Gillespie Dam east to approximately the western boundary of the Town of Goodyear water service area is an “Area of Insufficient Data & Low Model Confidence” (Figure 18, ADWR Modeling Report No. 8). BC addressed the problem of the inappropriate boundary condition through the reassigning of the model cells along the boundary as specified flux. This approach would hold steady the influx of water into the WSRV basin from the Lower Hassayampa basin regardless what occurred with water levels within the WSRV. If extensive water level declines occur in the Lower Hassayampa
p:\goodyear, city of\26555_brackish_water_study\working\westcaps brackish report final.doc\5/26/06\lc 2-1

Appraisal Level Study of a Brackish Water Treatment Plant City of Goodyear, Arizona
basin, which is expected to occur, then this boundary condition will still over-assign the flux of water into the WSRV. A more accurate representation of this boundary condition for long-term simulations either requires some consensus on what to assume will happen in the future within the Lower Hassayampa Basin or the combing of the WSRV model with the model of the Hassayampa Basin currently under development by Brown and Caldwell. Based on discussions with ADWR modeling personnel, this latter option is being pursued by ADWR but will likely not be completed until the 2007 or later time frame. 2.2 BASECASE MODEL To evaluate the impacts that different proposed groundwater extraction scenarios may have on water levels within the water logged area, a baseline groundwater elevation condition needed to be established. This basecase condition is defined as the groundwater elevation that would be expected into the future using accurate estimates of aquifer stresses. These stresses include:
• Groundwater pumping, • Recharge (stream channel, agricultural, canal leakage, and managed recharge
projects), and • Subflow in from and out to adjacent groundwater basins
Because the possible volume of groundwater available for extraction was to be looked at as far into the future as the year 2110, estimates of the above-listed aquifer stresses is also needed out to the year 2110 to accurately predict the basecase groundwater conditions. Although not rigorously evaluated as part of this work, the assumptions made by ADWR in their Current Trends Analysis (CTA) model simulations run out to 2025 are known to be different than those made by the BOR with the WESTCAPS model. Because the WESTCAPS model was completed after the CTA model it is assumed that it included more updated estimates of population growth, the rate and location of urbanization, and the estimated recharge from managed facilities. Based on this, the previously completed WESTCAPS model was viewed as the “best” basecase model. However, to facilitate the possible review of this work by the ADWR, the 2002 Updated SRV model was selected to be used. It should be noted that both models simulated continued shallow groundwater conditions within the water logged area out to 2025. The WESTCAPS basecase model also simulated continued shallow groundwater levels out to 2100. 2.2.1 Basecase Model Assumptions In the absence of working with the various governmental entities in developing estimates of updated groundwater pumping and recharge into the future, an approach that used a representative or reasonable set of estimates was developed. Based on a review of the annual groundwater pumping as used in the SRV model for the WSRV portion of the model from 1982 through 2002 (Figure 1) and the total pumpage as used in the SRV model for just an Area of Interest (AOI) (Figure 2), described by a rectangular area that includes the water logged area but also the Roosevelt Irrigation District (RID) north of the water logged area and the Goodyear service area, the 1996 pumping volumes were determined to represent a reasonable long-term
p:\goodyear, city of\26555_brackish_water_study\working\westcaps brackish report final.doc\5/26/06\lc 2-2

Appraisal Level Study of a Brackish Water Treatment Plant City of Goodyear, Arizona
average value. This analysis, based on these two areas, was felt to adequately represent historic groundwater pumping trends in the portion of the SRV model (southwestern corner) of primary interest for this work. Although a similar approach was initially completed for recharge, the 2002 recharge estimate developed by ADWR for the SRV model was selected. The primary reason for its use was that although it represented the lowest total recharge over the 1983 to 2002 period (Figure 3), the trend over that period was strongly decreasing and the use of anything other than the 2002 estimate could not be defended. Using these assumptions, the following set of conditions was used to conduct the basecase model simulation:
• 1983 – 2002: Exact same values as used in the 2002 ADWR Update Model • 2002 – 2004: 2002 SRV model values were held constant over this time period • 2005 – 2110: ADWR SRV model pumping file for 1996 and recharge file for 2002
2.2.2 Basecase Model Results Groundwater elevation contour maps for the year 2004, 2025, and 2110 are presented on Figures 4 through 6, respectively. A review of the contours for 2004 reveal that groundwater flow lines along the Gila River generally continue to flow into the water logged area. However, as indicated by the groundwater flow direction arrows, a groundwater divide exists in the northern portion of the City of Goodyear service area. This groundwater divide is the result of groundwater being drawn north towards the cone of depression associated with the Luke Sink. Although 2004 field water level measurements are not available to compare the contours with, overall, the water levels presented are felt to reasonably simulate what has occurred in the WSRV. A review of the contours for 2025 reveals an approximately 25-foot decline in water levels within the water logged zone along with a westerly migration of the groundwater divide. Based on the groundwater elevation contours all of the groundwater entering from the Gila River Indian Community (GRIC) and which is recharging from the 91st Avenue WWTP flows towards the Luke Sink. A review of the contours for 2110 reveals an additional 125 feet of groundwater decline and the movement of most of the groundwater underlying the former water logged area, including much of the subflow entering from the Lower Hassayampa Basin, towards the large groundwater declines in the central portion of the WSRV. Although previous simulations completed by WESTCAPS also show large declines in portions of the WSRV due to continued pumping, they do not show the extreme and spatially extensive effect indicated by the BC basecase model.
p:\goodyear, city of\26555_brackish_water_study\working\westcaps brackish report final.doc\5/26/06\lc 2-3

Appraisal Level Study of a Brackish Water Treatment Plant City of Goodyear, Arizona
The significant difference between the BC basecase model and the WESTCAPS model is exemplified by looking at a series of water level hydrographs from the WESTCAPS basecase simulation and presented here as Figure 7. As can be seen on Figure 7, large drawdowns were observed in the north and central portions of the WSRV in the WESTCAPS basecase simulation but virtually no drawdown was observed in the water logged zone. This discrepancy precluded the developing of simulations to determine how much water may be available within the water logged zone. 2.3 DETERMINATION OF CAUSES OF MODEL DIFFERENCES A number of issues were investigated in an effort to explain why the BC Basecase model simulated such large drawdowns in the water logged area. It was finally determined that the discrepancy had to be related to differences in the future assumptions regarding recharge and groundwater pumping between the two models. A review of the WESTCAPS report identified that a number of managed recharge projects were assumed in the WESTCAPS basecase simulation that were not present in the ADWR SRV model for 2002. To evaluate this as the possible cause, the BC Basecase model was then re-run with 107,500 acre-feet per year of recharge being added to the WSRV groundwater basin. Although the actual name and justification for each of the recharge projects was not clear in the WESTCAPS report, the major projects that were identified included 11,500 acre-feet per year from the CAP Agua Fria Recharge Project, 10,000 acre-feet per year near Avondale, and 13,000 acre-feet per year near the Beardsley Canal. An additional 60,000 acre-feet per year was included along the Agua Fria River to simulate the Agua Fria Linear Recharge Project. Although this recharge lessened the magnitude of water level drawdown within the water logged area it still did not recreate the absence of drawdown observed in the WESTCAPS Basecase simulation. A recommendation was then made by the committee to also reduce groundwater pumping within the area encompassing the Buckeye Irrigation District (BIC) and RID for the future portion of the simulations. BC then developed a new series of MODFLOW simulations that included the 107,500 acre-feet of additional recharge and reduced the pumping by the BIC and the RID within the AOI (defined previously) by one-half starting in the year 2010. This one-half reduction was based on the 2002 pumping rates and resulted in 43,000 acre-feet per year less pumping. The results of these simulations are presented on Figures 8 for the year 2025 and on Figure 9 for the year 2110. A series of hydrographs comparing water level drawdowns at specific locations within the water logged area for the BC Basecase simulation versus the revised simulation with increased recharge and decreased pumping are presented as Figures 10 through 22. An analysis of Figures 8 through 22 indicate that although much higher water levels are sustained within the water logged area through the combination of increased recharge in the central portion of the WSRV and decreased pumping by the BIC and RID, relatively significant groundwater declines are still observed. This is most easily observed with the hydrographs (Figures 10 through 22). These figures also indicate that even prior to 2002, when the model inputs are solely those used by the ADWR model, water level drawdowns that exceed what is observed in the field.
p:\goodyear, city of\26555_brackish_water_study\working\westcaps brackish report final.doc\5/26/06\lc 2-4

Appraisal Level Study of a Brackish Water Treatment Plant City of Goodyear, Arizona
Further research obtained electronic copies of the WESTCAPS MODFLOW recharge and pumping well files from the BOR. These were then evaluated graphically and in tabular format. This format provided the ability to better compare the two models. At the scale of the WSRV a more quantitative view of the difference between the BC Basecase simulation compared to the WESTCAPS basecase simulation are presented in Figures 23 through 26. These figures reveal that differences exist in the total amount of recharge and pumping applied to the predictive simulations and to the timing when which the changes are applied. The differences are even more graphic when looking at just the AOI (Figures 27 through 30). 2.4 PHASE 1 RECOMMENDATIONS The poor match to field conditions, even prior to 2002 by the ADWR model is believed to be due to a combination of the area being an area of insufficient data and low model confidence, as previously cited by ADWR, and the coarse scale at which this portion of the WSRV is modeled. The dynamic nature of the surface water/groundwater interaction in the water logged area requires this area to be modeled at a finer level of spatial discretization than the one-square mile cells used by the ADWR. A recommended model cell size is approximately 1,000 feet on a side, which is similar to the width of the river channel. Until a more accurate and defensible simulation tool is developed, estimating the true volume of brackish water that may be available can only be done in a crude manner using some simple water budget approaches. However, the large volume of surface flows that exit at Gillespie Dam, as recorded by USGS gage data, combined with the limited subflow entering the area from the Hassayampa Basin clearly identify that a significant volume of water (groundwater or surface water) does leave the WSRV basin and should be available for capture within the water-logged area. This is graphically shown on Figures 31 and 32. The large volume of surface flow leaving the basin generally ranges between 20,000 to approximately 120,000 acre-feet per year with numerous years greatly exceeding these numbers due to flood flows. Accurately capturing these flows both spatially and throughout time is key to accurately estimating the long-term water available in the water logged area. 2.5 PHASE 2 – WATER BALANCE STUDY As a follow-up to the numerical modeling analysis completed in Phase 1, and in response to the recommendations described in Section 2.4, BC conducted a focused water balance study on the water logged area using the SRV model and available raw data. It was expected that the detailed water budget analysis would provide fundamental information for guiding the possible development of a refined numerical model in the water logged area as that is the only appropriate tool for evaluating long-term water availability. The study area is identified in Figure 33.
p:\goodyear, city of\26555_brackish_water_study\working\westcaps brackish report final.doc\5/26/06\lc 2-5

Appraisal Level Study of a Brackish Water Treatment Plant City of Goodyear, Arizona
In this study, a detailed water budget has been prepared for current conditions of a revised AOI (relative to that used in Phase 1) encompassing the water logged area using the best available data. The revised AOI is identical to the Phase 1 AOI (Figure 1) in the north-south direction but now extends east to west from the Buckeye Heading to the Gillespie Dam. Additionally, an accounting of the Gila Rive flow in the Water logged area is conducted and this flow is compared with that measured at the Gillespie Dam. 2.5.1 Approach Publicly available data from state agencies and previous studies were collected and analyzed to provide background information for this study. Groundwater inflow and outflow components in the AOI were then identified. The groundwater budget in the AOI was developed in two approaches. In Approach 1, the groundwater budget in the AOI was estimated through simulations of the SRV model by conducting a zonal water budget analysis for the specific study area, and the budget was designated as SRV model simulated budget. In Approach 2, the flow components were either derived directly with raw data if they were available, or estimated by the SRV model when direct estimation of them became difficult (i.e., groundwater underflow). The groundwater budget developed in Approach 2 is denoted as BC estimated water budget. Finally, these two water budgets were compared and the differences between them were identified and explained. 2.6 GROUNDWATER INFLOW COMPONENTS Groundwater inflow components primarily consist of groundwater underflow and agriculture related recharge including agricultural irrigation return flow, and canal seepage. The BIC canal was simulated as a stream in the SRV model and the BIC canal seepage was presented by stream recharge accordingly. 2.6.1 Groundwater Underflow Groundwater underflow changes with groundwater flow field conditions, but it can be estimated through flow-net analysis and groundwater flow model simulations. Since groundwater flow models are often calibrated with field data, the groundwater underflow estimates derived from model simulations are deemed to be more representative of underflow conditions and contain less uncertainty. The groundwater underflow component in the AOI for both approaches was estimated using the SRV model. Groundwater underflow enters the AOI from two major directions: the east boundary of the AOI, and the northwest corner of the AOI where groundwater enters the study area from the Hassayampa groundwater basin. Using the SRV model, groundwater underflow estimated from the east direction gradually decreased from over 22,000 acre-feet per year (AFY) in 1980s to about 12,000 AFY in 2002. This groundwater underflow component declined about 10,000 AFY during the 20-year (1983-2002) model simulation period.
p:\goodyear, city of\26555_brackish_water_study\working\westcaps brackish report final.doc\5/26/06\lc 2-6

Appraisal Level Study of a Brackish Water Treatment Plant City of Goodyear, Arizona
Unlike the groundwater underflow component from the east, groundwater underflow from the Hassayampa basin remained more or less steady, and it was estimated by the SRV model to slightly fluctuate around the rate of 12,000 AFY during the 20-year model simulation period. The SRV model also simulated a small groundwater underflow component coming across the north boundary since 2000. This component increased from 13 acre-feet (AF) in 2000 to 138 AF 2002. This component is not included in the BC water budget. 2.6.2 Agriculture Related Recharge The AOI is dominated by agricultural activities, and three irrigation districts including BIC, RID, and Arlington Canal Company (ACC) exist in the study area. Consequently, agricultural irrigation return flow and canal seepage are significant flow components and they have the greatest influence on the water budget when compared to other inflow components. 2.6.2.1 SRV Model Due to the absence of active artificial recharge project in the AOI, the recharge component simulated in the SRV model is interpreted as agriculture irrigation return flow. In the SRV model this recharge component was simulated to show a declining trend from 117, 000 AF in 1983 to 58,000 AF in 2002. 2.6.2.2 BC Estimation Agricultural recharge represents water returned to the aquifer as percolation from agricultural irrigation return flows. Empirically, excess applied irrigation is estimated as the product of the total amount of water applied to the agricultural land minus that lost to evaporation and transpiration by the plant. This is approximated as the irrigation inefficiency. The irrigation inefficiencies vary with different irrigation districts. For instance, the BIC has an irrigation inefficiency of 29 percent, while the RID has an irrigation inefficiency of 41 percent (Corkhill, et al., 1993). The primary sources of water used for irrigation in the study area include groundwater and diverted Gila River water of which the treated effluent released from 91st Avenue WWTP is the primary source. In general, depths to water between the BIC canal and south of the Gila River in the AOI are very shallow, therefore, the agricultural recharge is considered to reach the aquifer rapidly and no recharge lag time is considered.
p:\goodyear, city of\26555_brackish_water_study\working\westcaps brackish report final.doc\5/26/06\lc 2-7

Appraisal Level Study of a Brackish Water Treatment Plant City of Goodyear, Arizona
Buckeye Irrigation District The BIC uses both pumped groundwater and diverted surface water for irrigation. The BIC pumpage since 1984 were retrieved from ADWR 55 database (ADWR, 2004). To alleviate the water logging condition, BIC began to pump selected wells for drainage in 1984. The drainage pumpage is excluded from the calculation of total amount of water applied for irrigation. The sources of diverted surface water include river water diverted at the Buckeye Heading which primarily consists of effluent released from the 91st Avenue WWTP and water discharged to the Gila River channel through the Salt River Project (SRP) feeder Canal and diverted at the Buckeye Heading. According to previous studies (Montgomery and Associates, 1988), records of the Gila River water diversion are currently only available prior to 1989, and the five year (1984-1988) average diverted volume of 143,229 AFY is assumed for that diverted during the period of 1989 to 2003. Similarly, records of the diverted water which is furnished by SRP are available until 1986, and the 12-year average (1975 to 1986) annual diverted volume of 21,688 AF was assumed for the period from 1987 to 2003. For both diverted surface water sources, the annual volume since late 1980s were approximated using average values and were therefore associated with a certain degree of uncertainty. The summation of groundwater and diverted surface water results in the total amount of water potentially available for irrigation. Since BIC main and south extension canals are unlined canals, significant amount of water can be lost through canal seepage during the water conveyance to the field. A seepage study was conducted in 1987 (Desert Agricultural and Technology Systems) to estimate the seepage losses from Arlington Canal Company (ACC) main canal, BIC main canal and south extension canal. This study estimated that the total seepage loss from the BIC main canal and south extension canal was about 32,530 AFY. The total amount of water used for irrigation for each year during the period of 1984 to 2003 was then calculated by adding the total BIC pumpage and the total diverted surface water, and deducting the BIC drainage pumpage and the BIC canal seepage. Multiplying this total amount of water applied for irrigation with the ADWR estimated irrigation inefficiency of 29 percent results in the estimated amount of potential agricultural irrigation return flow. This return flow recharge component was estimated to vary within a narrow range around 50,000 AFY. Combing the return flow recharge with the canal seepage, the total BIC agricultural recharge fluctuates around 80,000 AFY and is presented on Table 1. Roosevelt Irrigation District Pumped groundwater is the sole source of water used for irrigation in RID. RID currently operates 102 wells. Forty-eight (48) wells are located on RID lands within the AOI (west of the Agua Fria River) and designated as the “District wells”. The remaining wells are located on SRP lands lying east of the Agua Fria River and designated as “Tolleson” wells.
p:\goodyear, city of\26555_brackish_water_study\working\westcaps brackish report final.doc\5/26/06\lc 2-8

Appraisal Level Study of a Brackish Water Treatment Plant City of Goodyear, Arizona
Because these RID-Tolleson wells are outside of the AOI domain, and pumpage from these wells were excluded from the calculation of total groundwater withdrawn within the AOI. However, a an important component of the AOI water balance is that water withdrawn from these Tolleson wells is imported into the study area for irrigation uses on the RID properties. Therefore, the Tolleson pumpage was accounted for in the calculation of the RID irrigation return flow. Unlike the BIC canals, the RID canals became lined in 1986, and the estimate of potential canal seepage reduced significantly from 37,000 AFY when unlined to only 2,500 AFY after lined (Corkhill, et al., 1993). The total amount of water used for irrigation for each year during the period of 1984 to 2003 in RID was calculated by adding the total RID Tolleson well pumpage and RID district well pumpage and deducting the RID canal seepage. Multiplying this total amount of water applied for irrigation with the ADWR estimated irrigation inefficiency of 41 percent results in the estimated amount of potential agricultural irrigation return flow. Table 2 presents the estimated agricultural related recharge for the RID. As exhibited on Table 2, the RID total agricultural related recharge is estimated to range from 38,000 AFY to 76,000 AFY. Arlington Canal Company Approximately 40 percent of ACC properties are within the southwestern portion of the AOI. Based on this, the agricultural recharge inside the study area is prorated at 40 percent of the total ACC agricultural recharge. Most of the ACC irrigation water supply is presently obtained from surface water diversions from the Gila River. At this point in the Gila River this water is a combination of groundwater being forced toward the land surface, treated effluent released from the 91st Avenue WWTP, drainage and tail water from BIC (Montgomery and Associates, 1988). Though the ACC irrigation water use is not directly available, review of ADWR files provides the historical ACC irrigation acres. The total volume of water that ACC applied for each year is then approximated using the ACC irrigation acres and an estimated water consumption rate of 4.76 acre-feet/acre. The ACC irrigation inefficiency is estimated to be 29 percent. The total ACC irrigation return flow within the AOI was estimated to decrease slightly from 7,300 AF in 1984 to 5,400 AF in 2003. The ACC canals are not lined, and the ACC canal seepage was estimated to be about 12,000 AFY (DATS, 1987). Detailed estimation of the ACC agricultural recharge is presented on Table 3. 2.6.3 Stream Recharge In the ADWR SRV model, the BIC canal as well as the Gila River was simulated as a stream. Therefore, the stream recharge estimated by the SRV model showed a combination of recharge from both if the Gila River recharges groundwater, and the contribution from the BIC canal was not separated from the potential Gila River recharge if there was any.
p:\goodyear, city of\26555_brackish_water_study\working\westcaps brackish report final.doc\5/26/06\lc 2-9

Appraisal Level Study of a Brackish Water Treatment Plant City of Goodyear, Arizona
Due to the shallow depths to water observed in the study area, the stream recharge contributed from Gila River is considered minimal by BC. As a result, BC interprets that the SRV simulated stream recharge is chiefly contributed from the BIC canal. This SRV model simulated stream recharge was added to the SRV model simulated return flow to represent the SRV model simulated total agricultural recharge when compared to the agricultural recharge estimated by BC. 2.7 GROUNDWATER OUTFLOW COMPONENTS Groundwater outflow components consist of groundwater underflow, groundwater pumpage, groundwater discharged to Gila River, and evapotranspiration. 2.7.1 Groundwater underflow Groundwater underflow leaves the AOI mainly in two areas. Specifically, groundwater underflow exits the study area through the northeast boundary toward the Luke Sink cone of depression, and through the southwest along the Gila River near Arlington. The SRV model simulated groundwater underflow near Arlington fluctuated within a narrow range around 9,000 AFY, while the groundwater underflow leaving for the Luke cone of depression exhibited a large range from 18,887 AFY in 1984 to 4,607 AFY in 2002. The SRV model also simulated a groundwater underflow component leaving the study area through the south boundary. This component is very small and stays below 100 AFY through the entire model simulation period. This underflow component was not considered in the BC water budget 2.7.2 Groundwater Pumpage For the BC water budget, groundwater pumpage in the study area was retrieved from ADWR 55 well database which include all the pumpage reported through the Registry of Groundwater Rights (ROGR). The Tolleson pumpage, though was imported into the study domain, was excluded from the pumpage total as it was withdrawn from the area outside of the AOI. All the BIC pumpage are within the study area, and only partial pumpage of the RID and ACC are within the study area. Figure 34 displays the historical groundwater pumpage by different parties. For the SRV model simulated water budget, the pumpage was obtained through the model output in the well package. 2.7.3 Groundwater Discharged to Gila River Groundwater discharged to Gila River was estimated by the SRV model and it ranged from over 4,000 AFY to over 13,000 AFY during 1984 to 2002.
p:\goodyear, city of\26555_brackish_water_study\working\westcaps brackish report final.doc\5/26/06\lc 2-10

Appraisal Level Study of a Brackish Water Treatment Plant City of Goodyear, Arizona
2.7.4 Evapotranspiration Evapotranspiration represents the estimated amount of groundwater lost through transpiration from plants that utilize groundwater. Saltcedar is one of the common phreatophytes in the study area. In areas where 100 percent volume density growth occurs, the saltcedar may consume as much as 7.2 acre-feet per acre of groundwater per year (Montgomery and Associates, 1988). Due to the presence of the Gila River and the shallow depths to groundwater observed in the water logged area, the evapotranspiration is considered a significant outflow component. However, this component can not be easily estimated without field investigations on the types of phreatophytes present, the water consumption rate, spreading, and growth density of each phreatophyte. This component is currently estimated through the SRV model simulation. This component was estimated to decrease over time with an nearly 6,000 AFY in early 1980s to slightly over 1,500 AFY in 2000s. 2.8 SRV MODEL SIMULATED BUDGET VERSUS. BC WATER BUDGET A groundwater budget contains groundwater inflow components, groundwater outflow components, and the groundwater change-in-storage which is the balance of the two components. The accumulated change-in-storage over time is frequently reflected on groundwater hydrographs. Therefore, the accumulated groundwater change-in storage over time is expected to show a similar trend of that of groundwater hydrographs. 2.8.1 SRV Model Simulated Water Budget Table 4 demonstrates the water budget with all the flow components being estimated from the SRV model simulations. As shown in this table, groundwater change-in-storage is negative which is indicative of groundwater being released from aquifer storage for most of the years except for 1986, 1987, 1992, 1993, and 1998. 1992, 1993, and 1998 are wet years. The accumulated change-in-storage over time is presented on Figure 34 and it displays a general declining trend. 2.8.2 BC Estimated Water Budget Some of the flow components such as groundwater underflow and stream discharge which can not be easily estimated were inherited from the SRV model simulation and directly used in the BC budget. BC’s effort was primarily spent on the estimation of agricultural related recharge. Table 5 summarizes the BC estimated water budget. Compared to the SRV model simulated water budget, the BC water budget shows a completely different trend. The annual change-in-storage is positive which is indicative of water stored in the aquifer storage for most of the years except for 1988, 2002, and 2003. The accumulated change-in-storage over time is illustrated on Figure 35, on which the accumulated change-in-storage over time shows a general increasing trend.
p:\goodyear, city of\26555_brackish_water_study\working\westcaps brackish report final.doc\5/26/06\lc 2-11

Appraisal Level Study of a Brackish Water Treatment Plant City of Goodyear, Arizona
2.8.3 Differences between the Two Water Budgets The differences between the SRV model simulated budget and the BC estimated stem from two aspects: the different number of flow components, and variations in estimates for the same flow component. Table 6 summarizes the differences between the two water budgets. As to the flow components, the BC budget contains all the components that the SRV budget has except for the underflow exiting the model domain through the south boundary of the study domain and the underflow entering the study area from the north boundary since 2000. BC budget excludes these components as no data is available to support the recognition of these components. On the other hand, these two components were simulated to be very small (ranging from 13 AFY to 138 AFY) by the SRV model. Therefore, this difference is considered to be minor. The significant difference between the SRV budget and the BC budget relies on the estimated agricultural recharge. During the water budget analysis period (1984-2002), the SRV model simulated a much smaller agricultural related recharge than the BC estimation, and the maximum annual recharge difference could be as high as 55, 822 AFY. When the water budget balance is accumulated, these differences were multiplied through the budget period and resulted in a significant difference on the water budget trend over a long term. Another noticeable difference between the two water budgets is observed to be on the groundwater pumpage. This discrepancy was resulted from the difference on the size of study areas covered by each budget analysis. A small portion of the west BC water budget area was simulated as inactive cells in the SRV model, and the pumpage in this area was not simulated by the well package of the SRV model. 2.9 EXPLANATION OF PHASE 2 RESULTS As discussed earlier, when groundwater inflow is less than groundwater outflow, water is released from aquifer storage and water levels decline accordingly. On the contrary, when groundwater inflow is greater than groundwater outflow, water is taken into aquifer storage and water levels increase. As a result, the accumulated change-in-storage over time is expected to follow the same trend of groundwater level change over time. To investigate which water budget is more representative of aquifer conditions in the water logged area, historical groundwater level measurements in the study area are retrieved from the ADWR GWSI databases (2004). Figures 36 and 37 are groundwater contour maps for the study area in 1991 and 2002, respectively. The selection of 1991 and 2002 is because more water level measurements were taken in these two years, and the period is long enough to show a general trend. Figure 38 presents water level changes over the 10-year period. As seen on Figure 38, water level rise has been observed in most of the study area. This observed water level increasing trend is similar to that exhibited by the BC water budget. The SRV model simulated budget, however, shows a general declining trend suggesting that water levels would decline in the waterlogged area.
p:\goodyear, city of\26555_brackish_water_study\working\westcaps brackish report final.doc\5/26/06\lc 2-12

Appraisal Level Study of a Brackish Water Treatment Plant City of Goodyear, Arizona
It should be recognized that it is the difference in the estimated agricultural recharge that distinguishes the BC water budget from the SRV budget. Since the BC estimated agricultural recharge represents the potential maximum agricultural recharge, and some of the inputs inevitably involve certain degree of uncertainties, the estimated recharge is associated with some level of uncertainties as well. But the water budget trend is deemed to be more representative than the SRV model simulated budget when compared to water level trend in this area. 2.10 ESTIMATED AND OBSERVED SURFACE FLOW AT THE GILLESPIE DAM. An accounting of the Gila River flow in the waterlogged area was conducted by adding the treated effluent released from the 91st Avenue WWTP, BIC drainage pumpage and groundwater discharged to Gila River to the natural Gila River flow component, and deducting the BIC diversion at the Buckeye Heading. Due to the lack of gage data, the natural Gila River flow component in the water logged area is difficult to estimate. Therefore, the balance of Gila River is only estimated with the available components. Figure 39 presents each of the estimated surface flow components. The Gila River flow is measured at the Gillespie Dam, the measured flow at this gage and the estimated Gila River flow in the water logged area are compared on Figures 40 and 41 at different scales for better demonstration. Due to the absence of the natural flow component, especially in wet years, the two curves did not compare well, the peak flow observed in the Gillespie Dam in 1993 was missing in the estimated Gila River flow. 2.11 PHASE 2 SUMMARY AND CONCLUSIONS Publicly available data from state agencies and previous studies were collected and analyzed to provide background information for this water budget study for a period from 1984 to 2002. Groundwater inflow components are identified to be primarily composed of groundwater underflow and agricultural recharge. Groundwater underflow enters the study area from the east boundary and from the Hassayampa groundwater basin. Agricultural recharge includes irrigation return flow and canal seepage which are resulted from the long-term agricultural activities of the BIC, RID and ACC. Groundwater outflow mainly consists of groundwater underflow, groundwater pumpage, groundwater discharged to Gila River, and evapotranspiration. Groundwater underflow leaves the study area primarily through the northeast boundary to the Luke cone of depression and in the southwest part of the study area near Arlington. Upon the identification of flow components, the water budget in this area is derived using two approaches. In Approach 1, the SRV model is simulated first and all the flow components within the study area are derived through a zonal water budget analysis using model outputs.
p:\goodyear, city of\26555_brackish_water_study\working\westcaps brackish report final.doc\5/26/06\lc 2-13

Appraisal Level Study of a Brackish Water Treatment Plant City of Goodyear, Arizona
In Approach 2, some of the flow components which can not be easily estimated (i.e., underflow and stream discharge) were inherited from those simulated by the SRV model. The groundwater pumpage were retrieved from ADWR 55-well database. Primary effort was spent on estimating the agricultural recharge including irrigation return flow and canal seepage for each irrigation district. The irrigation return flow was estimated as a product of the total amount of water applied for irrigation for each irrigation district and the ADWR estimated irrigation inefficiency. ADWR files and previous studies were reviewed carefully to identify the water sources utilized by BIC, RID, and ACC, and the amount of each water source applied. In the absence of water use records (i.e. ACC), total water use for irrigation was approximated using irrigation acres and an estimated water consumption rate. For the BIC, when the surface water diversion records for the period beginning 1990s were not available, they were estimated using the 5-year or 10-year average values. The SRV water budget estimated negative annual change-in-storage which is indicative of water level declining for most of the years except for wet years, and the accumulated change-in-storage over time showed a general declining trend suggesting that water levels in the study area generally declines with time except for wet years. The BC estimated water budget demonstrated positive annual change-in-storage for most of the years, and the accumulated change-in-storage over time exhibited a general increasing trend with time. This trend shows a similar pattern as that revealed on the groundwater level changes. Consequently, the BC estimated water budget is considered to be more representative of the groundwater conditions in the water logged area. The significant difference between the SRV model simulated budget and the BC budget is variations on the estimate of the agricultural recharge. The SRV model simulated agricultural recharge is smaller than that estimated by BC, and the maximum difference could be as high as over 55,000 AFY. Additionally, an accounting of the Gila River flow was conducted in the water logged area by adding the treated effluent released from the 91st Avenue WWTP, the BIC drainage pumpage and groundwater discharged to Gila River to the its natural flow component and deducting the BIC diversion at the Buckeye Heading. Since the natural Gila River component is not currently available, the surface flow in the water logged area was estimated using the available flow components. This estimated surface flow in the water logged area was then compared to the surface flow measured at the Gillespie Dam. These two curves did not match well due to the missing Gila River natural component, and the discrepancy was significant during wet years.
p:\goodyear, city of\26555_brackish_water_study\working\westcaps brackish report final.doc\5/26/06\lc 2-14

Appraisal Level Study of a Brackish Water Treatment Plant City of Goodyear, Arizona
2.12 PHASE 2 RECOMMENDATIONS The development of an accurate accounting of potential excess water within the water-logged area requires the development of an accurate groundwater-surface water numerical model. Work completed as part of this study has identified that the existing ADWR SRV model does not adequately represent this portion of the SRV basin. Further work evaluating the components of the water budget for the southwestern portion of the WSRV using both the ADWR model and available data suggests that the difficulties in accurately representing the groundwater system in the area caused are caused by, at a minimum the following: 1. Inappropriate mathematical representation of the groundwater-surface water system by using
a saturated flow numerical model developed with relatively coarse discretization, both spatially and vertically.
2. More accurate information on the actual volume of water (both surface and groundwater)
used by the irrigation districts, in particular the BIC and the percent of this volume returned to the groundwater/surface water system.
3. Inadequate data regarding Gila River flows, primarily from the Buckeye Header to Gillespie
Dam.
The first two issues can be resolved, or at least their inherent uncertainty semi-quantified, with the development of a more finely discretized (both laterally and vertically) flow model and the use of automated parameter estimation tools. Recommended model discretization includes 1/4 to 1/2-mile lateral grid spacing and the refinement of the existing model layer 1 to an estimated 3 layers. The third issue can be evaluated using a more finely discretized flow model but will require either better field measurements or much better accounting on all of the hydrologic components that can affect Gila River flows. Even with these issues resolved, the development of long-term estimates of the water resources in the water-logged area will be affected by hydrologic stresses upstream (east, north and northwest) of the water-logged area throughout the entire WSRV, and how those stresses, in particular pumping and artificial recharge, will change over time. Because these stresses will never be known with certainty, any analysis of long-term (e.g., greater than 5 to 10 years) brackish water availability will require to use of model automated parameter estimation techniques and appropriate uncertainty analysis. These tools exist presently but would require the refining of the model grid as described above.
p:\goodyear, city of\26555_brackish_water_study\working\westcaps brackish report final.doc\5/26/06\lc 2-15

Appraisal Level Study of a Brackish Water Treatment Plant City of Goodyear, Arizona
3.0 BENCHMARKING OF DESALINATION PROJECTS Desalination is used in many regions of the United States as a way to access additional water resources. There are currently two primary methods of desalination used in the United States: Reverse Osmosis (RO) and Electrodialysis Reversal (EDR). Both of these methods utilize thin semi-permeable membranes to separate product water (permeate) from brine (concentrate). RO is the most commonly used membrane treatment in the US, composing 74 percent of municipal plants in the US (Mickley, 2001). The primary advantage of RO over ED/EDR is the capability of removing organics, microorganisms, and taste and odor compounds. Additionally, EDR power consumption increases with as TDS increases, making RO preferable for treating highly saline waters. CASS reviewed over 30 reports on brackish water treatment facilities to determine what issues would arise in desalination of brackish water in the southwest SRV. Of the 30 facilities, five are highlighted in Table 7 and include both RO and EDR projects. Three of the projects are located in Central Arizona and have water quality information specific to the region. Additional projects are located in California and utilize brackish water with similar TDS levels.
TABLE 7 - SUMMARY OF PERTINENT DESALTING PROJECTS IN THE SOUTHWEST
PROJECT
CENTERRA WELL
FACILITY, GOODYEAR,
AZ
GILA BEND FACILITY, GILA BEND,
AZ
LEWIS PRISON
FACILITY, BUCKEYE, AZ
CHINO I DESALTER, CHINO, CA
GOLDSWORTHY DESALTER,
TORRANCE, CA
Source Water TDS, mg/L
>1,900 1,000-2,000 2,000-2,500 871 ~3,800
Treatment Method
RO RO EDR RO RO
Capacity 2.5 mgd 1.0 mgd 1.35 mgd 8.0 mgd 2.5 mgd System Recovery 79% Unknown Unknown 90% 81.3% Year Online 2002 2002 1988 2000 2001 Capital Cost $1.98M Unknown $1.1M $25M $6.5M Operating Cost $0.93/kgal Unknown Unknown $525/AF Unknown Concentrate Disposal
Sanitary Sewer Evaporation Ponds
Evaporation Ponds
Ocean Outfall Sanitary Sewer
Notable Items Source water has high in
nitrates.
Source water high in
chlorides.
Source water high nitrates.
Also treated by Ion Exchange and for VOC.
p:\goodyear, city of\26555_brackish_water_study\working\westcaps brackish report final.doc\5/26/06\lc 3-1
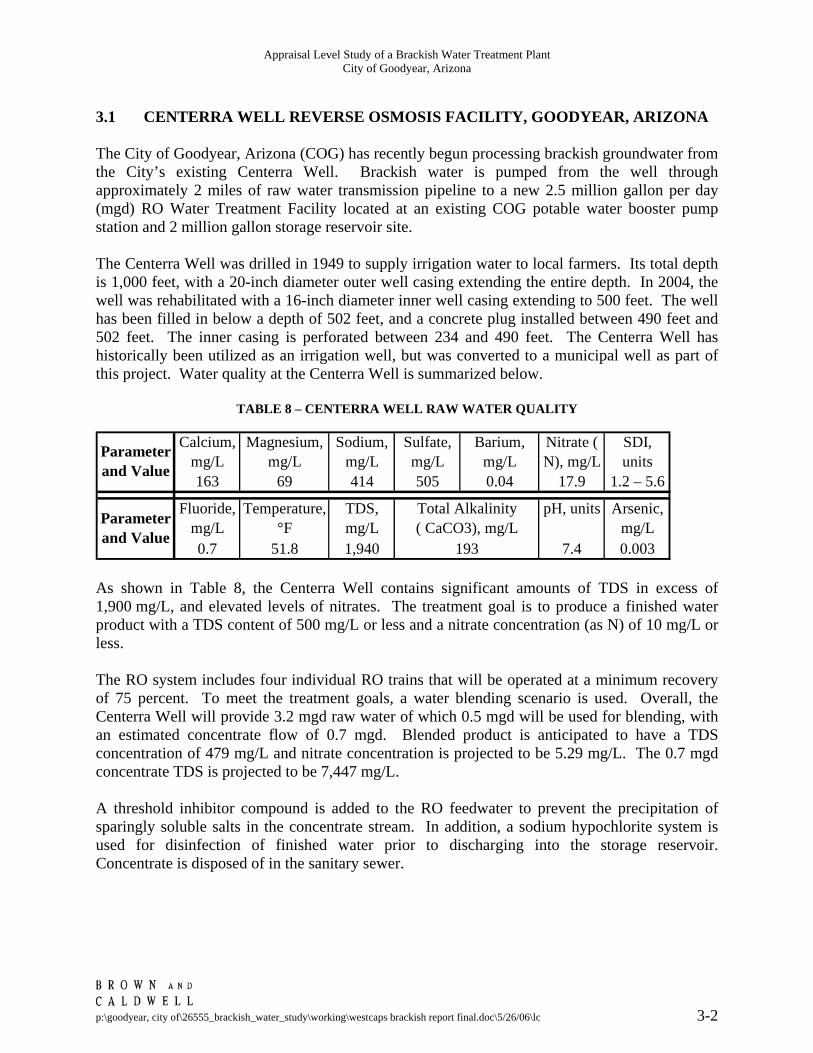
Appraisal Level Study of a Brackish Water Treatment Plant City of Goodyear, Arizona
3.1 CENTERRA WELL REVERSE OSMOSIS FACILITY, GOODYEAR, ARIZONA The City of Goodyear, Arizona (COG) has recently begun processing brackish groundwater from the City’s existing Centerra Well. Brackish water is pumped from the well through approximately 2 miles of raw water transmission pipeline to a new 2.5 million gallon per day (mgd) RO Water Treatment Facility located at an existing COG potable water booster pump station and 2 million gallon storage reservoir site. The Centerra Well was drilled in 1949 to supply irrigation water to local farmers. Its total depth is 1,000 feet, with a 20-inch diameter outer well casing extending the entire depth. In 2004, the well was rehabilitated with a 16-inch diameter inner well casing extending to 500 feet. The well has been filled in below a depth of 502 feet, and a concrete plug installed between 490 feet and 502 feet. The inner casing is perforated between 234 and 490 feet. The Centerra Well has historically been utilized as an irrigation well, but was converted to a municipal well as part of this project. Water quality at the Centerra Well is summarized below.
TABLE 8 – CENTERRA WELL RAW WATER QUALITY
Calcium, mg/L
Magnesium, mg/L
Sodium, mg/L
Sulfate, mg/L
Barium, mg/L
Nitrate ( N), mg/L
SDI, units
163 69 414 505 0.04 17.9 1.2 – 5.6
Fluoride, mg/L
Temperature, °F
TDS, mg/L
pH, units Arsenic, mg/L
0.7 51.8 1,940 193 7.4 0.003
Total Alkalinity ( CaCO3), mg/L
Parameter and Value
Parameter and Value
As shown in Table 8, the Centerra Well contains significant amounts of TDS in excess of 1,900 mg/L, and elevated levels of nitrates. The treatment goal is to produce a finished water product with a TDS content of 500 mg/L or less and a nitrate concentration (as N) of 10 mg/L or less. The RO system includes four individual RO trains that will be operated at a minimum recovery of 75 percent. To meet the treatment goals, a water blending scenario is used. Overall, the Centerra Well will provide 3.2 mgd raw water of which 0.5 mgd will be used for blending, with an estimated concentrate flow of 0.7 mgd. Blended product is anticipated to have a TDS concentration of 479 mg/L and nitrate concentration is projected to be 5.29 mg/L. The 0.7 mgd concentrate TDS is projected to be 7,447 mg/L. A threshold inhibitor compound is added to the RO feedwater to prevent the precipitation of sparingly soluble salts in the concentrate stream. In addition, a sodium hypochlorite system is used for disinfection of finished water prior to discharging into the storage reservoir. Concentrate is disposed of in the sanitary sewer.
p:\goodyear, city of\26555_brackish_water_study\working\westcaps brackish report final.doc\5/26/06\lc 3-2

Appraisal Level Study of a Brackish Water Treatment Plant City of Goodyear, Arizona
3.2 GILA BEND REVERSE OSMOSIS FACILITY, GILA BEND, ARIZONA In 2002, the Town of Gila Bend completed the construction of a 1-mgd groundwater RO facility. The facility includes three independent treatment trains. Groundwater for the facility is supplied from a series of wells 5 miles south of the town. The feed water TDS averages between 1,000 to 2,000 mg/L. Pre-treatment and post-treatment requirements are unknown. However, concentrate from the RO system is disposed of in evaporation ponds located at the RO site. In recent years, the Town has experienced problems with the system. The RO system has been producing about 300 gpm for 16 to 17 hours per day using two treatment trains. This is significantly less than the designed 1 mgd. The problems have been contributed to inadequate pretreatment and the membrane housings due to high chlorides in the feed water. The Town recently began replacing the existing stainless steel housings with fiberglass housings. The first skid with replaced housings has been operating for six months and it appears this will fix most of the problems with the system. 3.3 LEWIS PRISON ELECTRODIALYSIS REVERSAL FACILITY, BUCKEYE,
ARIZONA The Lewis Prison EDR facility is fed by two groundwater water wells with a TDS concentration of 2,000 mg/L. The capacity of the facility is 1.35 mgd treated with three EDR units. The facility is expandable up to 1.8 mgd with 4 trains. Pretreatment includes acid addition and cartridge filtration. The EDR permeate is post-treated with caustic to provide pH adjustment and chlorination for disinfection. The concentrate is disposed of in onsite evaporation ponds. 3.4 CHINO I DESALTER, CHINO, CALIFORNIA The Chino I Desalter was commissioned in 2000 and was built to treat high TDS groundwater with high nitrates. The facility was constructed by the Santa Ana Water Production Authority (SAWPA) and was then transferred to the Chino Basin Desalter Authority (CDA). The plant is currently being expanded to 13 mgd by adding Ion Exchange and volatile organic compound (VOC) removal towers to the facility. The expansion is to be commissioned in early 2005. The treatment plant was designed to produce potable water with TDS of less than 350 mg/L and less than 25 mg/L of Nitrates. The source water TDS is 871 mg/L. Pretreatment methods include Acid, Threshold Inhibitor, and Cartridge Filtration. The treatment process includes Reverse Osmosis, Ion Exchange of the bypass stream, and VOC of second bypass stream. The RO permeate is decarbonated and blended with the two bypass streams and then Sodium Hydroxide is added. The design capacities for the main treatment include 6 mgd RO, 3 mgd VOC bypass, and 4 mgd Ion Exchange bypass. Eighty percent of the RO stream is recovered. Concentrate from the RO system is sent to Ocean Outfall through the Santa Ana Regional Interceptor (SARI).
p:\goodyear, city of\26555_brackish_water_study\working\westcaps brackish report final.doc\5/26/06\lc 3-3

Appraisal Level Study of a Brackish Water Treatment Plant City of Goodyear, Arizona
3.5 GOLDSWORTHY DESALTER, TORRANCE, CALIFORNIA The objective of the Goldsworthy Desalter is to provide a new local potable supply utilizing a localized high salinity groundwater source. The owner of the facility is the Water Replenishment District of Southern California. The average TDS is approximately 3,800 mg/L. Pretreatment technologies include cartridge filtration, sulfuric acid addition, and threshold inhibitor injection. Reverse Osmosis is used as the primary treatment method. The RO permeate is further processed by decarbonation and sodium hydroxide addition prior to blending. Blend goals include using as much bypass volume as possible to optimize production up to a 500 mg/L TDS limit. The RO treatment capacity is 2.5 mgd with the option to expand to 5 mgd. Overall the recovery rate of the system is 81.3 percent. Concentrate from the RO system is discharged to the sewer.
p:\goodyear, city of\26555_brackish_water_study\working\westcaps brackish report final.doc\5/26/06\lc 3-4
Appraisal Level Study of a Brackish Water Treatment Plant City of Goodyear, Arizona
4.0 CONCENTRATE DISPOSAL As the need for additional water resources results in advanced treatment of saline waters, large volumes of concentrate will be produced and will have to be addressed as part of the treatment process. Managing concentrate streams is typically the most difficult and costly portion of desalination. There are several broad ranges of concentrate management alternatives available including: Evaporation Options, Land Application Options, Transportation Options, Well - Injection Disposal Options, Zero Discharge Options, and Proprietary Volume Reducing Options. Research on these alternatives indicates that finding the concentrate management solution is a very site specific process requiring consideration of several factors including: concentrate flow rate; environmental regulations governing water quality’ geophysical features of a given area, cost requirements for implementation and need of desalination treatments. Currently, there is no single solution that can address all of Arizona’s concentrate management needs and further research is required. 4.1 EVAPORATION Evaporation is the process where water changes from liquid to a gas or vapor. Heat breaks the bonds that hold water molecules together allowing water molecules to become a vapor. Evaporation stops working when humidity in the air reaches 100 percent. Evaporation is an effective concentrate volume reduction option in hot, sunny, dry climates. Evaporation technologies include: evaporation ponds; enhanced evaporation ponds (using Wind-Aided Intensified eVaporation (WAIV) or Turbo Misters); Solar Ponds; and DewVaporation. Evaporation ponds for concentrate management require building an evaporation pond of a depth and surface area large enough to accommodate maximum volume of brine, plus capacity for storm water and capacity for precipitated salts. Ponds may require impervious liners of clay and/or membranes to prevent saline water from filtering into the groundwater. They are extremely land intensive. This technology is used being used in Arizona.
WAIV is a relatively new technology that is used in conjunction with evaporation ponds to reduce the surface area of the ponds and uses wind to promote evaporation that is being developed and tested in Israel. The WAIV unit is a vertical support structure that suspends a series of cloth sheets. Water is pumped from a pond to the top of the WAIV unit where the water trickles down the cloth sheets. As air passes over the cloth surfaces, evaporation occurs and salts are deposited on the sheets. Excess liquid is drained back to the pond, while the salts deposited in a trough below the fabric for disposal in a landfill.
The Turbo Misting technology works by spraying concentrate into the air to increase the water surface area, which accelerates the evaporation rate. This technology allows water droplets to be dispersed throughout a wind stream, to be exposed to air to allow time for evaporation. The salts, sediment, and water remaining will drop into a lined catch pond. This technology has been tested by the US Bureau of Reclamation at the Salton Sea, California.
p:\goodyear, city of\26555_brackish_water_study\working\westcaps brackish report final.doc\5/26/06\lc 4-1

Appraisal Level Study of a Brackish Water Treatment Plant City of Goodyear, Arizona
Solar ponds work like evaporation ponds, but use the salinity gradient ponds for integrated concentrate disposal and energy generation. The Salt Gradient ponds attempt to recover heat from ponds to generate electricity or as a pre-heat to a boiler or temperature raising process. However, solar ponds by themselves are not a method of concentrate disposal. This technology was tested in El Paso, Texas.
DewVaporationTM (DewVap) is based on a combination of evaporation and dew formation and is composed of a series of towers that use air and heat to further concentrate the concentrate. DewVap is in the research stage in Arizona. 4.2 LAND APPLICATION Land application involves using concentrate from desalination treatment for irrigation of salt tolerant vegetation. It is anticipated that plants will uptake the water they require and the remaining portion of the water will percolate into the groundwater system. Contamination of the aquifer may then become an issue if liners are not used. Typically land application is possible only with low salinity concentrate or diluted concentrate. 4.3 TRANSPORTATION Transportation options involve removing concentrate from the source via pipelines to the ocean outfalls or discharge to other surface waters or sewer. 4.3.1 Surface Water Discharge Surface water discharge is the most commonly used municipal concentrate disposal method in the US. Disposal can occur in the ocean, estuaries, rivers, or lakes. The cost for surface water disposal is very site specific. Costs are dependent on the length of pipeline to the disposal site, the diameter of pipeline required, dissipation structure requirements, and physiography of the disposal site. The Bureau of Reclamation conducted the done on such a pipeline to the ocean, called the Central Arizona Salinity Interceptor (CASI). Because of cost of the pipeline (related to Arizona’s distance from the ocean) and the loss of water resource from the state, water resources professionals have postponed further work on this alternative indefinitely. 4.3.2 Sewer Disposal Sewer disposal of concentrate is the second most common concentrate management technology in the US, after surface water discharge. This option works by simply allowing dischargers to put concentrate into the sanitary sewer system. It is important to note that high volume of concentrate can impact the WWTP capacity issues and upgrades may be required to accommodate additional flow. Sewer disposal may not be feasible if TDS levels inhibit the wastewater treatment process. Data presented at the 2003 Salinity Summit in Las Vegas, Nevada identified that WWTP process inhibition occurs when TDS reaches ~3,000 mg/L. Disposal of
p:\goodyear, city of\26555_brackish_water_study\working\westcaps brackish report final.doc\5/26/06\lc 4-2

Appraisal Level Study of a Brackish Water Treatment Plant City of Goodyear, Arizona
concentrate in sewage may also be an issue if TDS levels exceed federal discharge standards (i.e. National Pollutant Disposal Elimination System). For those areas that use effluent as source water for non-potable uses, sewer disposal has the potential to degrade the value of effluent for reuse due to higher TDS. This option is currently being used in Arizona. 4.4 INJECTION Inland injection options involve putting concentrate into an underground aquifer that is structurally isolated from potable groundwater sources. 4.4.1 Deep Well Injection Deep well injection has been used for disposal of industrial and hazardous wastes since the 1950s. This method of concentrate disposal is most commonly used in Florida and Texas, but has not proven feasible in Arizona. Concentrate disposal wells fall under the jurisdiction of Class I wells which require that the well must be sited in an aquifer formation having at least 10,000 mg/L TDS and must be separated from overlying potable aquifers by hydrologically impermeable formation that prevents upward migration of the injected concentrate. The geology required for deep well injection must be porous (such as sandstone or limestone), deep and isolated. Geology consisting of shale or clay is not typically suitable for deep well injection because it is impermeable. Deep well injection works by pumping concentrate under pressure into the ground. The depth of the well is very site specific, but typically injection wells range from 2,500 to 15,000 feet below land surface. Concentrate is highly corrosive, therefore operational materials require careful evaluation to avoid reduced equipment life cycle. Fouling and scaling of injection well can be a problem that may require the concentrate to be pretreated for pH to prevent plugging of the receiving formation. 4.4.2 Recharge into Poor Quality Aquifers Recharge into poor quality aquifers may be accomplished by the use of spreading basins, vadose zone injection wells, or injection wells discharging directly into an aquifer. Recharge into poor quality aquifers is not feasible in Arizona because environmental regulations do not allow the further degradation of aquifers. 4.5 ZERO LIQUID DISCHARGE Zero liquid discharge works by reducing the volume of water to nothing leaving salt in concentrate in crystallized form. Several alternatives exist including brine concentrators and crystallizers. New technologies are continually developing.
p:\goodyear, city of\26555_brackish_water_study\working\westcaps brackish report final.doc\5/26/06\lc 4-3

Appraisal Level Study of a Brackish Water Treatment Plant City of Goodyear, Arizona
4.5.1 Brine Concentrators Brine concentrators use evaporation to recover water from concentrate. A brine concentrator works by compressing the vapor released from boiling solution, which raises the pressure and saturation temperature of the vapor so that it may be returned to the evaporator body as heating steam. The latent heat of the vapor is used to evaporate more water instead of being rejected to cooling water. Scaling of the heat transfer tubes may be prevented by the seeded slurry process. Calcium sulfate and silica precipitates build up on calcium sulfate seed crystals in the recirculation brine instead of scaling on the heat transfer surfaces. Brine reject from the concentrator ranges between 2 to 10 percent of the feed water with TDS concentrations as high as 250,000 mg/L. Brine concentrators are large towers and require high quality construction materials because of brine’s corrosive effects. Brine concentrators are not dependent on weather or geographical conditions and approximately 150 brine concentrators are currently operating in the US, many at power plants. Brine concentrators are reliable but they are exceedingly expensive to operate. The limiting factor for this process is the cost of power to operate them and not the capacity. Electrical costs can range from 60 to 100 kW*HR/ 1000 gal of feed water. Brine concentrators are used on power plants cooling towers throughout Arizona, but are currently cost prohibitive for large concentrate flows. 4.5.2 Crystallizers Crystallizers have been used successfully for many years for industrial, single-component applications, where only one compound is isolated as a solid from a concentrated brine liquid stream. Capacity for crystallizers ranges from 2 to 50 gpm. Crystallizers are typically used in conjunction with other volume reducing technologies, such as brine concentrators. This application has not been used on large concentrate flows and is expensive to operate.
4.6 PROPRIETARY VOLUME REDUCING TECHNOLOGIES New concentrate management alternatives are developing on a continual basis. Many of these alternatives reduce the volume of concentrate by precipitating solids from the concentrate and recovering fresh water. These developing technologies are patented and will require that users pay license fees as part of the capital expenditures. Most of these technologies are in the developmental stages and have not been used on a large scale concentrate flow in the United States. Additional research on these technologies is required before they can be implemented as a concentrate management solution. 4.6.1 High Efficiency Reverse Osmosis HERO (High Efficiency Reverse Osmosis) is a proprietary process system developed by Aqua-Tech to increase water recovery from industrial processes by overcoming two significant impediments to high-recovery RO, hardness (calcium and magnesium), and silica. This system is comprised of a collection of well-defined treatment processes; lime softening, filtration, weak acid cation (WAC) exchange and reverse osmosis. Therefore, reliability should be high if
p:\goodyear, city of\26555_brackish_water_study\working\westcaps brackish report final.doc\5/26/06\lc 4-4

Appraisal Level Study of a Brackish Water Treatment Plant City of Goodyear, Arizona
designed with an adequate understanding of the feed water to be treated. The process begins with lime softening of the concentrate to remove the majority of hardness typically found in challenged waters. The product is then filtered through a sand filter to remove particulate matter, and treated by WAC exchange to remove residual hardness not removed by conventional lime softening. Unlike conventional softening, which replaces hardness with sodium, WAC exchange sites are regenerated with hydrogen ions. The product maintains the high pH produced during the lime softening process, which prevents silica precipitation during subsequent RO treatment of the concentrate. A key process to consider is filtration, since particulate matter can foul both the WAC and RO systems. System wide, corrosivity must be accounted for. This technology will however require higher than average operation and maintenance skills, but is within the ability of the industry to acquire and develop. HERO is a developing technology that has only been used for small-scale flows in industry throughout the US. Further research is required. 4.6.2 Sal-Proc Sal-Proc (SP) is a unique and proprietary treatment option that extracts dissolved elements from concentrate and produces valuable chemical products that are used in other industries. This technology is owned by Geo-Processors and has been successfully piloted, demonstrated and operated commercially in Australia. Pilot plants have been done for small scale operations (57 to 350 gallons per minute). SP works by using common chemistry practices to selectively remove the salts in concentrate. Saline waters vary in their chemical composition and would, therefore, produce different product streams in the SP process. Some of these salt products include gypsum, magnesium hydroxide, precipitated calcium carbonate, sodium chloride, and sodium and potassium sulfate in crystalline, slurry, and liquid forms. These compounds are useable or saleable products and may be used to offset or even eliminate treatment costs, which sets the Geo-Processors technologies apart. The process equipment for typical operations can be found in the chemical process industry and water/wastewater treatment plants. Reliability of such equipment would be the same as that found in existing municipal water and wastewater treatment facilities. Operating staff may require some specialization. This process could be sized, designed and operated in timely manner after thorough evaluation of water quality and flow quantities. Sal-Proc is a unique design with respect to cost-benefit analysis because the capital costs and operating costs can potentially be recovered (or substantially off-set) by the sale of the marketable by-products produced by the treatment process. Potential revenue obtained from this process differentiates this technology from other technologies from a cost comparison standpoint. The costs for this technology vary depending on the desired objectives. These objectives may include sustainable management of saline impaired waters, operational improvement, reduction of the footprint of an operation, recovery of products or a combination thereof. There are many different process routes that may be used depending on the water quality of the source water and the desired products to be recovered, and/or objectives to be achieved. Further research is required
p:\goodyear, city of\26555_brackish_water_study\working\westcaps brackish report final.doc\5/26/06\lc 4-5

Appraisal Level Study of a Brackish Water Treatment Plant City of Goodyear, Arizona
5.0 LEGAL ISSUES Currently, there are no direct regulations regarding desalination or concentrate management. Desalination is regulated by way of the need to achieve potable drinking water standards. The Safe Water Drinking Act, enforced by the USEPA and established in 1974, is the main federal law that regulates drinking water in the United States. A Maximum Contaminant Limit (MCL) is established as the maximum permissible level of a contaminant in water which is delivered to any user of a public water system. These levels are determined by the USEPA based on scientific research to protect against health risks and do take into consideration technology and costs of treatment. The National Secondary Drinking Water Regulations are non-enforceable water quality guidelines. Secondary MCLs are established for contaminants that may have cosmetic or aesthetic effects, but are not considered to present a risk to human health. TDS has a secondary MCL of 500 mg/L. TDS over this level may impair the taste of water, scale water-dependent appliances and prohibit the growth of plants. Groundwater quantity in Central Arizona is regulated by the Arizona Department of Water Resources. ADWR regulates the volume of groundwater pumped through the Groundwater Management Code of 1980 (Code). The Code was established to eliminate groundwater overdraft in areas where groundwater pumping has led to severe declines in water levels and to provide means for allocating groundwater resources for Arizona’s water demand needs. The Code established “Active Management Areas (AMA) within the state where groundwater level decline was most severe and most of the regulatory power of the Code in located in the AMAs. These AMAs are: Phoenix, Tucson, Prescott, Pinal, and Santa Cruz. The Code also created a system of groundwater rights that limits groundwater withdrawals, prohibit development of new irrigated farmland, require new developments to prove a long-term water supply is available and dependable, and require the measuring and reporting of groundwater uses for these rights. Management goals were developed for each AMA and these goals were to be met with the implementation of a series of five management plans, each one more stringent than the prior. The management plans consist of conservation requirements for industrial, municipal, and agricultural groundwater users. Currently the Code is operating in its Third Management Plan (TMP), which expires on December 31, 2009. Brackish groundwater is subject to the Code’s regulation. Therefore, pumping and desalination of this water would require that brackish groundwater be counted against groundwater allotments and would also require the groundwater pumper to pay fees for utilizing this water. An area located in the southwest Phoenix AMA is exempt from the conservation requirements because of its designation as a “waterlogged area” under Arizona Revised Statute (A.R.S.) § 45-411.01. Water levels in this area of the Phoenix AMA are as high as 10 feet bls and without drainage; water would rise to the surface. In addition to being water logged, water in this area is also brackish. The waterlogged area is designated as the being within service areas of the Buckeye, Arlington, and St. John Irrigation Districts. These irrigation districts and Irrigation
p:\goodyear, city of\26555_brackish_water_study\working\westcaps brackish report final.doc\5/26/06\lc 5-1

Appraisal Level Study of a Brackish Water Treatment Plant City of Goodyear, Arizona
Grandfathered Right holders near these districts are allowed to pump as much water as they require and are exempt from conservation requirements and withdrawal fees until the end of the Fourth Management Plan Period (December 31, 2019). A hydrologic review of this area and this statute must be done before December 15, 2015 by ADWR, to extend this exemption. Under Assured Water Supply (AWS) Rules (A.A.C. R12-15-705 (T)), holders of an AWS certificate or designation water providers within the designated waterlogged area are allowed to exclude the uses of the following types of groundwater:
• Surface water • Contaminated Groundwater
o Groundwater Pumping for Remedial Action (under approval of ADEQ) o Groundwater is treated, blended or exchanged to achieve water quality standards o Groundwater would have otherwise not been pumped o Groundwater is withdrawn before 2025
• Water excluded from conservation requirements under Title 45. This exemption is to be reviewed on a periodic basis, not to exceed 15 years.
Currently, no water provider has utilized the AWS exemption for pumping in the waterlogged area.
p:\goodyear, city of\26555_brackish_water_study\working\westcaps brackish report final.doc\5/26/06\lc 5-2

Appraisal Level Study of a Brackish Water Treatment Plant City of Goodyear, Arizona
6.0 CONCLUSIONS Desalination of brackish water is already occurring in the southwest SRV, because there is need for additional water resources. It is anticipated that this need will grow in the future. Conclusions to be drawn from this study are:
Insufficient/Inadequate Information Exists to Reliably Estimate Long-term Availability of Brackish Groundwater. An inadequate understanding of the basin-wide water budget, in particular in the area around the Water-logged Area, results in an inability to produce reliable estimates of brackish water available for long-term (> 5 years out) use. Estimates of the current water budget are hindered by poor information on groundwater-surface water interactions in the water-logged area. Long-term estimates of available brackish water are hindered by the same problem and inadequate information regarding future changes in pumping, the retirement of agricultural lands, and the location and magnitude of recharge projects.
Importance of Identifying Site Specific Water Quality The three projects located in Central Arizona are relatively close in proximity (>100 mile radius) and have a similar range of TDS concentrations, but water quality varies for other constituents. Because variation in water quality can affect pre-treatment and post-treatment requirements, it is important that water quality information be site specific before desalination is implemented.
Further Research is required to Increase Recovery Rates in Desalination Technologies Current desalination recovery rates range from 75 to 85 percent. Low recovery rates increase the cost of desalination projects because it increases the amount of concentrate that has to be managed. Increasing the desalination recovery rate is also important to preserving water resources and meeting regulatory requirements of the Groundwater Code.
There is No Single Solution for Concentrate Management Disposal using evaporation ponds is feasible in the arid southwest climate, but is extremely land intensive. Disposal in the sewer is easily implemented, but may have significant issues with regards wastewater treatment plant processes and capacity.
p:\goodyear, city of\26555_brackish_water_study\working\westcaps brackish report final.doc\5/26/06\lc 6-1

Appraisal Level Study of a Brackish Water Treatment Plant City of Goodyear, Arizona
7.0 REFERENCES Arizona Department of Water Resources (ADWR), 2004, 55-well Registration Databases. ADWR, July 2004, Groundwater Site Inventory (GWSI) Databases. Desert Agricultural and Technology Systems, Inc. 1987C, Study of Water Logging Problems in
the West Salt river and Hassayampa sub-basins of the Phoenix Active Management Area, Seepage Study Report.
Errol L. Montgomery & Associates, Inc., January 14, 1988, Study of Waterlogging Problems in
the West Salt River and Hassayampa Sub-Basins of the Phoenix Active Management Area. A report prepared for the Phoenix Active Management Area of the Arizona Depart of Water Resources.
Mickley, M. 2001. Membrane Concentrate Disposal: Practices and Regulation. Desalination
and Water Purification Research and Development Program Report No. 69
p:\goodyear, city of\26555_brackish_water_study\working\westcaps brackish report final.doc\5/26/06\lc 7-1


Brackish Water StudyCity of Goodyear, Arizona
P:\Goodyear, City of\26555_Brackish_Water_Study\Deliverables\Reports\CASS\Figures & Tables\Fig 27 to 30 AOI_WESCAPSvsADWR Pumping&Recharge.xls 5/26/2006
Figure 29. Total Pumping in Acre-Feet per Year Area of Interest
-240,000
-220,000
-200,000
-180,000
-160,000
-140,000
-120,000
-100,0001982 1995 2009 2023 2036 2050 2064 2077 2091
Year
Acr
e-Fe
et
Baseline Scenario WESTCAPS Basecase Scenario 23
Variance may be due to drying and rewetting of cells in layer 1


