central and eastern europe economic scorecard a sustainable future … economic score… · ·...
TRANSCRIPT
www.EconomicScorecard.eu
Conditionsfor
growth
Central and Eastern Europe Economic Scorecard A sustainable future in a great region


1Economic Scorecard
It was possible only thanks to the determination of economic reformers, thecourage of domestic and foreign investorsand the entrepreneurial spirit of so manypeople right across the region.
Until recently, the region was seen as a clear winner in the globalisationprocess. Today, as global economic powershifts from West to East and from North to South, new challenges are emerging.The region not only needs to continue to close the development gap with WesternEurope, but also to compete globally.
A key element of the growth strategy for Central and Eastern Europe will continue to be the creation of a favourableenvironment that attracts investors, encourages innovation and supports successful businesses. The scorecard presented in this report is a tool for comparing various aspects of the businessenvironment in the countries of the region.It may be useful not only in attracting newinvestment, but also in indicating areaswhere further structural reforms or otherinitiatives may be beneficial.
We hope you will find the report valuable.
The region of Central and Eastern Europe experienced huge change over the last two decades. Its successful transition from a state-run, inefficient and closed economic system to a developing and competitivemarket economy was a genuinely historical achievement.
Olga Grygier-SiddonsChairman, PwC Poland
Robin Barnett British Ambassador to Poland

The constant promise of Central and Eastern Europe offers a balance betweengrowth and risk, which is increasinglypalatable in today’s business environment.The region offers attractive outsourcingopportunities as well as a market of over100 million consumers.
Whether you are looking for sales, outsourcing or investment opportunities,a careful and detailed analysis of the region is required.
We have created an economic scorecardfor the region, which enables you to benchmark opportunities against yourown specific development requirements.
The CEE Scorecard is aimed at enablingyou to make an initial assessment of the opportunity and the showcases of companies, which have been successfullyexploring the region for years, illustratethe potential of your company’s growth in CEE.
We would be pleased to take you throughthe process in more detail.
2 Economic Scorecard
Introductory Remarks
The markets of Central and Eastern Europe offer attractive potential for internationally minded businesses. Each of the markets has something to offer, yet is characterised by different levels of development.

Introduction 5
Access to Markets 9
Resources for Growth 11
Cost Competitiveness 14
Growth Sustainability Index 16
Business Environment Index 19
Overall Assessment 22
Overall Index of Growth Conditions 24
Growth Conditions and the Size of the Economy 28
Methodological Annex 30
3Economic Scorecard
Contents
Abbreviations:
CEE – Central and Eastern Europe
CEE North – Baltic states, the Czech Republic, Hungary, Poland, Slovakia
CEE South – Bulgaria, Croatia, Romania, Slovenia
EU – European Union
Northern Europe – selected countries for comparison (Germany, Sweden, United Kingdom)
Southern Europe – selected countries for comparison (Greece, Portugal, Spain)
Emerging Markets – selected countries for comparison (Brazil, Mexico, South Africa, Russian Federation, Thailand, Turkey, Ukraine)
GDP – Gross Domestic Product
PPP – Purchasing Power Parity
IMF – International Monetary Fund
WEF – World Economic Forum
4 Economic Scorecard

Over the last two decades, marked by a difficult transition from a Soviet-type centrally planned economy to a free market model, the countries of Central and Eastern Europe (CEE) have experienced very different phases of development. At the beginning they resembled a ‘promised land’ for investors,offering very low labour costs coupledwith relatively high skills. There were excellent opportunities linked to privatisation and a virgin emergingmarket of over 100 million consumers.
Moods deteriorated as the economic transition proved more difficult than expected and some of the investors’ hopes did not materialise. After a painfulrestructure followed by the enlargementof the European Union (EU) in 2004-2007,once again a rapid growth started to overtake investors’ worries and
persistent everyday problems connectedwith running a business.
Then came the 2008 global financial crisisand once again the pendulum swung, blackclouds loomed on the horizon and theCEE countries started to be suspected as the ‘subprime borrowers’ of Europe.What is a reasonable and honest assessment of the development potentialof Central and Eastern Europe today?
First of all, it should be noted that despitemany of the current challenges, the majority of the countries in the regionhave been achieving considerably highergrowth rates over the long run than theirWest European neighbours – see Graph 1below. In some ways, they can be seen as near shore Emerging Markets – lowerpotential but less risk.
5Economic Scorecard
Introduction
0% 2% 4% 6% 8%
Euro area
HungaryCroatia
Advanced economies
SloveniaCzech Republic
LatviaRomania
Ukraine
EstoniaBulgaria
World
LithuaniaPoland
Slovak RepublicRussia
Turkey
Developing economies
Graph 1. Average GDP growth rates, 2003-2012 (CEE countries and their neighbours)
Source: IMF

It is important to point out that the CEEcountries today face a double challenge inthe context of future growth opportunities:
• On the one hand, the countries in theregion are considerably poorer than the countries of Western Europe. The average GDP per capita in the CEEregion, adjusted for purchasing powerparity (PPP) to eliminate the impact of price differences across countries, wasequal to 57% of the Euro area averageGDP per capita in 2012. Therefore,a clear long-term objective of the CEEcountries needs to reduce this gap by achieving continuously higher ratesof growth than in the Euro area.
• On the other hand, during the lastingglobal financial crisis the countries of the CEE region have had to pursue a very cautious economic policy in orderto avoid a possible destabilisation oftheir finances, an excessive debt built-up,a loss of financial credibility and marketcompetitiveness.
• The slowest GDP growth, only marginallyfaster than in the Euro zone, has beenobserved over the last decade in debt-ridden Hungary and Croatia,while the biggest fluctuations in annualgrowth rates ranging from +11% to – 18% have been reported in Latviaand Lithuania.
We have created an economic scorecard to illustrate the key economic indicators in the CEE countries and compared themwith their most important neighbours(Ukraine, Turkey, Russia, Eurozone) – see Table 1 below. The CEE countries are divided into two subgroups: CEENorth and CEE South.
What can be done to address the doublegrowth challenge which lies ahead of CEE?
6 Economic Scorecard
Table 1. Main economic indicators: CEE countries and their key competitors, 2012
Czech Republic 10.6 27 191 196 3.3
Estonia 1.3 21 713 22 4.2
Hungary 10.0 19 638 127 5.7
Latvia 2.0 18 255 28 2.3
Lithuania 3.0 21 615 42 3.2
Poland 38.9 20 592 488 3.7
Slovakia 5.4 24 249 92 3.7
Slovenia 2.1 28 195 46 2.6
Total CEE North 73.3 21 894 1 041 3.8
Bulgaria 7.3 14 312 51 2.4
Croatia 4.4 17 810 57 3.4
Romania 21.3 12 808 169 3.3
Total CEE South 33.0 13 806 278 3.1
Total CEE region 106.3 19 387 1 318.1 3.6
Neighbours
Ukraine 45.5 7 374 176 0.6
Turkey 74.9 15 001 794 8.9
Russia 141.9 17 709 2 022 5.1
Euro area 331.4 34 116 12 197 2.2
Population (millions) GDP per capita (US$, PPP) Total GDP (billions of US$) Inflation rate

7Economic Scorecard
One of the best solutions is to create a business-friendly environment whichsupports growth. This would be attractivefor domestic and international investorsalike. The CEE countries should base theirdevelopment on their current and emergingsources of competitive advantage.
Every effort should be made to supportand strengthen the growth potentialthrough institutional reforms, better conditions for running a business, efficientresource development as well as bettermacroeconomic and social fundamentalsfor growth.
In a nutshell, the countries of CEE shouldtry to maximise the return from their assets and reduce the shortcomings that may hamper their development. In our Economic Scorecard report we haveselected and analysed five key determinantsfor growth in the region – see Graph 2.
They are illustrated by the five indicesbelow:
Access to Markets Index – access to global markets and domesticmarket dynamics;
Resources for Growth Index – assessment of the three main assets that can be transformed into value added:people, capital, and knowledge;
Cost Competitiveness Index – ratio between the cost and the quality of labour;
Growth Sustainability Index – financial, political and environmentalsustainability of rapid GDP growth;
Business Environment Index – assessment of institutions, tax system,infrastructure and overall transparency of the economy.
The value of the five indices observed in the CEE countries (CEE North and CEESouth) is then compared with the sameindices estimated for a group of selectedEmerging Market Comparators (Brazil,Mexico, South Africa, Russian Federation,Thailand, Turkey, Ukraine), Southern Europe Comparators (Greece, Portugal,Spain) and Northern Europe Comparators(Germany, Sweden, United Kingdom). All indices have the vaules from 0 to 10.Details about the construction of the indices are presented in the AnalyticalMethodology section.
Accessto Markets
Resourcesfor Growth
CostCompetitiveness
GrowthSustainability
BusinessEnvironment
Conditionsfor
growth
Graph 2. Conditions for growth in CEE countries

8 Economic Scorecard
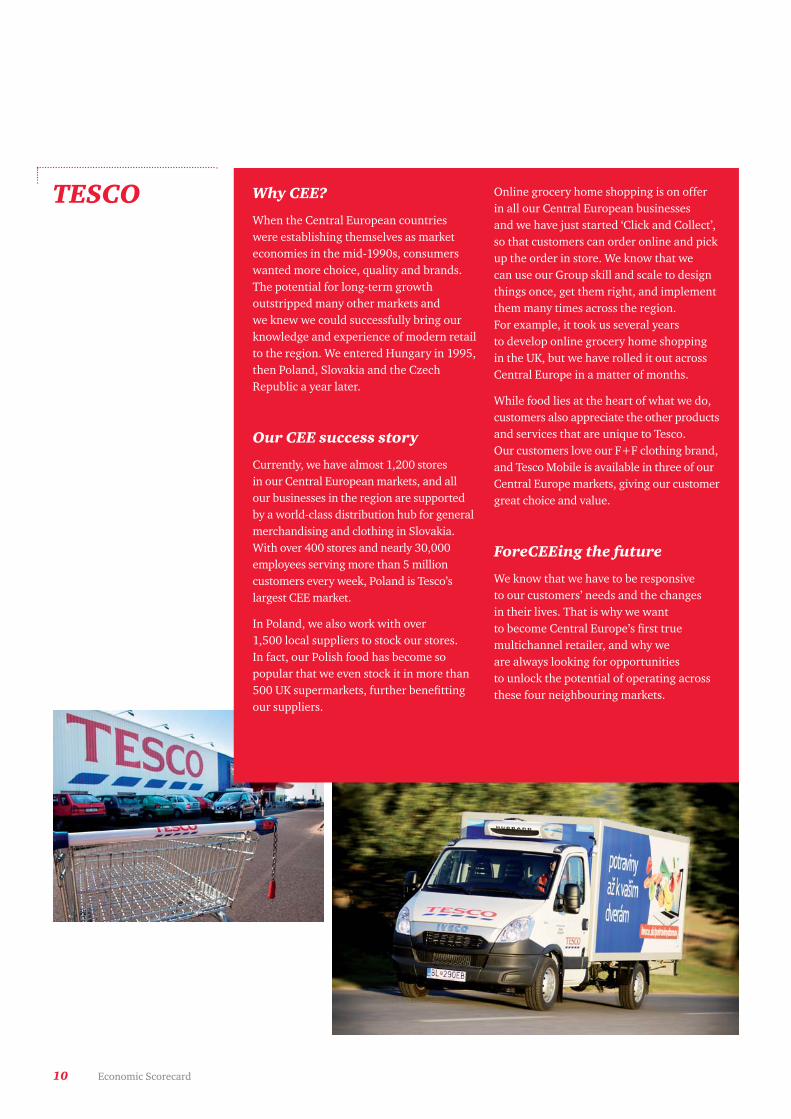
Why CEE?
When Ewald Raben, the successor of the Dutch Raben family business moved to Poland in 1991 in order to develop international transport links between the Netherlands and Poland, he quickly understood that the need for logistics and transport in the country and in the entire region was enormous. Back then,hardly anyone in Poland understood whatlogistics meant. For Raben it was a challengebut also a great opportunity.
Our CEE success story
Set up in 1991, the Polish branch employedonly 12 people. Today, Raben Group, one of Europe’s largest logistics companies with 8,000 employees across the continent,is managed from its HQ in Poland, whichhas 4,500 employees alone. Since 2003, the company has opened branches in the Ukraine, Lithuania, Latvia, Estonia, Germany, the Czech Republic, Slovakia and Hungary.
Raben Group’s revenue skyrocketed from €5 million in 1991 to nearly €1 billion in 2012. The company now constitutes a European network of over 130 terminalsand distribution centres with approximately1 million sqm of warehouse space.
Raben Group offers a wide range of services– everything you need to sell your productin Emerging Europe, not just internationaldistribution, as it was at the beginning, but also a national service delivering right to the customer’s door. The company provides contract logistics and global multimodal distribution as well.
ForeCEEing the future
Raben Group has built the foundations of modern logistics in the CEE region. In the last two years, the company has concentrated on an integration process. In 2011, Raben Group acquired GermanRoad Network and all Wincanton’s operations in the Czech Republic, Hungary,Poland and Slovakia. Raben Group will now develop organically and further investments will aim at improving processesand reducing costs. We will concentrate on expanding and optimising our servicesto accomplish our vision “To Become a Leader Everywhere We Are”.
RABEN

CEE access to global markets in the case of CEE North and CEE South subregions is well established. This is mainly accounted for by EU membership that secures a full and unrestricted connectionwith the world’s single largest trading bloc.
The high level of CEE integration into the global value added chain as illustrated by the high level of FDI held, primarily by the multinational corporations, is worthy of note and a precursor of future development potential. Access to GlobalMarkets is only slightly worse than in Northern Europe and better than in Southern Europe. The above profileprovides the CEE countries with a majoradvantage over countries from the current Emerging Markets.
The top performing markets are Slovakiaand Poland, while the weakest performersare Hungary, Croatia and Slovenia. On average, the CEE region offers an investment attractiveness, which is much higher than in Northern Europe, significantly better than recession-riddenSouth Europe and is only just surpassedby the Emerging Markets.
Altogether, the Access to Markets Index in the CEE region has a higher value thanin all other discussed areas. In the CEENorth subregion, it is particularly elevatedin Slovakia and Poland, while in the CEESouth subregion, Bulgaria is the performer.The weakest score is given to Hungary,Croatia and Slovenia.
9Economic Scorecard
8.5
7.3
8.8
6.0
9.3
2.0
8.3
8.0
9.0
9.0
8.3
4.0
10
7.0
8.8
3.0
8.3
7.0
8.7
6.1
9.0
5.7
4.1
7.6
7.8
1.0
10
3.3
Bal
tic s
tate
s
Global markets Domestic market
CEE North CEE South RegionalComparisons
Cze
ch R
epub
lic
Hun
gary
Pola
nd
Slo
vaki
a
Slo
veni
a
Bul
garia
Cro
atia
Rom
ania
CE
E N
orth
CE
E S
outh
Em
ergi
ng M
arke
ts C
ompa
rato
rs
Sou
ther
n E
urop
e C
ompa
rato
rs
Nor
ther
n E
urop
e C
ompa
rato
rs
Value of subindices:
Access toMarkets
Graph 3. Access to Markets Index
Access to Markets
The Access to Markets Index is composedof two subindices, which are aggregatedwith equal weighting:
1. Access to Global Markets(participation in regional trade blocs, policies impacting free trade, diversification of export mix, level of integration into the global valueadded chain).
2. Domestic Market Dynamics, mappedalongside the average rate of marketgrowth over the last decade.
The Access to Markets Index is illustratedin Graph 3.
10 Economic Scorecard
Why CEE?
When the Central European countries were establishing themselves as marketeconomies in the mid-1990s, consumerswanted more choice, quality and brands.The potential for long-term growth outstripped many other markets and we knew we could successfully bring ourknowledge and experience of modern retailto the region. We entered Hungary in 1995,then Poland, Slovakia and the Czech Republic a year later.
Our CEE success story
Currently, we have almost 1,200 stores in our Central European markets, and all our businesses in the region are supportedby a world-class distribution hub for generalmerchandising and clothing in Slovakia.With over 400 stores and nearly 30,000 employees serving more than 5 million customers every week, Poland is Tesco’slargest CEE market.
In Poland, we also work with over 1,500 local suppliers to stock our stores.In fact, our Polish food has become so popular that we even stock it in more than500 UK supermarkets, further benefittingour suppliers.
Online grocery home shopping is on offer in all our Central European businesses and we have just started ‘Click and Collect’, so that customers can order online and pickup the order in store. We know that we can use our Group skill and scale to designthings once, get them right, and implementthem many times across the region. For example, it took us several years to develop online grocery home shopping in the UK, but we have rolled it out acrossCentral Europe in a matter of months.
While food lies at the heart of what we do,customers also appreciate the other productsand services that are unique to Tesco. Our customers love our F+F clothing brand,and Tesco Mobile is available in three of ourCentral Europe markets, giving our customergreat choice and value.
ForeCEEing the future
We know that we have to be responsive to our customers’ needs and the changes in their lives. That is why we want to become Central Europe’s first true multichannel retailer, and why we are always looking for opportunities to unlock the potential of operating acrossthese four neighbouring markets.
TESCO

11Economic Scorecard
The Resources for Growth Index is composed of three subindices, whichare aggregated with equal weighting. The key assets are identified and analysedin the context of their potential to contributeto economic value-added.
1. People, or human capital(demographic potential and prospects,level of education, scope and standardof health services);
2. Capital (saving and investment rates,development of the financial servicesmarket, access to credit);
3.Knowledge (role of innovation in theeconomy; size and scope of R&D activities; levels of digital inclusion and availability of technical and sciencestudents).
The results are presented in Graph 4.
The development of human capital (People) is well advanced in the CEENorth countries and is similar to the levelsobtained in Northern and Southern Europe. Unfortunately, the human capitalcomponent is underdeveloped in the CEESouth subregion, with the index valuebelow the level observed in the comparedEmerging Markets. The weakest point of the whole CEE region is characterisedby unfavourable demographic trends, particularly the prospects of a rapidly ageing society and the ongoing hazard of a falling birth rate.
Education levels are quite satisfactory in CEE North countries but much weakerin the South. A similar remark can be madeabout the health status.
Resources for Growth
Bal
tic s
tate
s
People Capital
CEE North CEE South RegionalComparisons
Cze
ch R
epub
lic
Hun
gary
Pola
nd
Slo
vaki
a
Slo
veni
a
Bul
garia
Cro
atia
Rom
ania
CE
E N
orth
CE
E S
outh
Em
ergi
ng M
arke
ts C
ompa
rato
rs
Sou
ther
n E
urop
e C
ompa
rato
rs
Nor
ther
n E
urop
e C
ompa
rato
rs
Knowledge
Value of subindices:
Resourcesfor Growth
6.3
6.0
4.4
6.2
7.2
4.8
5.7
5.4
3.3
6.5
6.0
4.5
5.7
6.0
4.0
6.7
5.8
6.0
3.8
6.2
2.3
4.7
7.0
2.5
4.8
6.2
2.3
6.2
6.1
4.5
4.4
6.5
2.3
5.0
6.3
2.9
6.2
4.3
3.8
6.4
6.5
8.0
Graph 4. Resources for Growth Index

12 Economic Scorecard
The highest values of the People subindexin the region are observed in Slovenia, followed by Poland, the Baltic states and the Czech Republic; the lowest ones are found in Bulgaria (with a forecasted fall in the population by 15% by 2030).
The availability of development capital in the CEE region is satisfactory, despiteonly modest saving rates, especially if compared with the developing economiesof East Asia. This factor is, at least partly,compensated by high inflows of FDI, satisfactory development of the financialservices sector (particularly the bankingsector) and a relatively low cost of credit.The value of the Capital subindex in bothCEE North and CEE South is similar to the values observed in Northern Europeand the Emerging Markets and much
higher than in Southern Europe, with a particularly high score recorded in the Czech Republic.
The Knowledge subindex flags up thebiggest gap with established EU markets.While the average score recorded in theCEE North countries is only half of that in Northern Europe, it is better than in Southern Europe. The score of the CEESouth subregion falls behind all comparedregions. The best performer in the CEE region is Slovenia, followed by the CzechRepublic; the worst ones are Bulgaria, Romania and Croatia.
The overall Resources for Growth Index in the CEE North subregion falls well behind Northern Europe and in the caseof CEE South is also behind Southern Europe and the Emerging Markets.
The best scores in the CEE region are recorded in Slovenia, Czech Republic,Poland and the Baltic states.
The strengths and weaknesses of the CEEcountries in the area of the Resources for Growth, relative to the other comparedregions, are clearly presented in Graph 5.CEE North and CEE South outperformSouthern Europe and match the other regions in the area of the Capital availability. In the area of People, CEENorth matches its rivals, while CEE Southdoes not keep up the pace together with the Emerging Markets. In the area of Knowledge, both CEE North and CEESouth are significantly outperformed by Northern Europe.
People
CapitalKnowledge
Resourcesfor GrowthCEE North
CEE South
Emerging Markets Comparators
Southern Europe Comparators
Northern Europe Comparators
Graph 5. Relative strengths and weaknesses of CEE countries determinants of the Resources for Growth Index

13Economic Scorecard
Why CEE?
While investigating the opportunities givenby the Polish Government’s privatisation of the state owned PKS companies (localpublic transport providers), Sir Brian Souter,a Scottish businessman, the co-founder and major shareholder of Stagecoach PLC,identified a gap on the intercity expresspublic transport market. The Polish Government had invested heavily in the national road network and had a detailedprogramme for the future but there was no coherent national network of publictransport operations, the quality of servicesprovision was low and the sector – fragmented and underinvested.
Our CEE success story
With a bright red livery and distinctivebranding, Polskibus.com was born in June2011. The €400,000 Van Hool AstroMegaand Altano vehicles with leather recliningseats, air-conditioning, wheel chair access,catering and toilet facilities, unlimited Wi-Fi access free of charge, experienced and well-trained drivers as well as the online booking system quickly convinced prospective passengers. With the motto:“Fast, Cheap and Comfortable”, the company
has grown to serve 19 major Polish citiesand 4 European capitals and within the firsttwo years of operation over 3.5 million tick-ets were sold.
A recent survey of 14,000 of our customersproduced a satisfaction rating of over 99%.With our coaches as our travelling billboards and our drivers as our ambassadors, we are now recognised not only as a good and reliable operator but also as a good employer, having createdover 400 new jobs.
ForeCEEing the future
Two years after its formation and with over€30 million already invested, Polskibus.comnow operates 68 vehicles with a further 25new vehicles ordered for delivery before the end of 2013. Sir Brian Souter and SouterHoldings Poland have recently announcedanother €30 million investment in the development of the business in the verynear future. We also plan to develop newproducts and services both within Polandand the surrounding countries.
POLSKIBUS.COM

The Cost Competitiveness Index measuresthe ratio between the cost and the qualityof labour or, in other words, the cost of acquiring a unit of human capital. It is a much more meaningful indicator of competitiveness than just the cost of labour, as the quality of labour mayvary significantly among the countries.
According to economic theory, this ratioplays a crucial role in shaping out growthpotential. The lower the cost per unit of the human capital, the higher the costcompetitiveness of a country in the globalised world; the higher the country’sattractiveness for investors seeking lowproduction costs and eventually, the higherthe growth potential.
The results are presented in Graph 6.
The value of the Cost CompetitivenessIndex in the CEE region is favourable, particularly if compared with Northernand Southern Europe. The index has a particularly high value in the CEE Southsubregion, almost matching the score for the Emerging Markets. In CEE North,the value is lower but also quite high, as the moderate cost of labour is paired with a decent quality of human capital.The best performer in the CEE region is Romania, followed by Bulgaria, Poland,Hungary and the Baltic states.
14 Economic Scorecard
Cost Competitiveness
Bal
tic s
tate
s
CEE North CEE South RegionalComparisons
Cze
ch R
epub
lic
Hun
gary
Pola
nd
Slo
vaki
a
Slo
veni
a
Bul
garia
Cro
atia
Rom
ania
CE
E N
orth
CE
E S
outh
Em
ergi
ng M
arke
ts C
ompa
rato
rs
Sou
ther
n E
urop
e C
ompa
rato
rs
Nor
ther
n E
urop
e C
ompa
rato
rs
CostCompetitiveness
8.07.0
8.0 8.07.0
6.08.0
7.09.0
7.3 8.0 8.6
5.3
1.3
Graph 6. Cost Competitiveness Index

15Economic Scorecard
Why CEE?
Poland was extremely successful in its economic transformation at the beginningof the 1990s and has also been since the EU enlargement in 2004. The country is an undisputed leader in the region and has ambitions to become one of the most important countries on the continent. The large number of technical universities,with their tradition in graduating a significantnumber of well-educated and talented engineers each year, clearly differentiatesPoland from other countries in this part of the continent. All that also puts the Polish economy in a solid position and a place-to-be for Rolls-Royce. As a result,over the years Poland has become a hub for Rolls-Royce’s activity in Central andEastern Europe.
Our CEE success story
Innovative solutions and the technologicalsophistication of products are common features that describe Rolls-Royce’s involvement in the Polish market but just as Poland benefits from Rolls-Royce, the company makes direct use of the highlyskilled Polish engineers. The companyopened a service centre in the Port of Gdynia, which employs around 50 people.
That facility gives a boost for the overhauland shipbuilding industry on the Polishcoast. It also provides repair and maintenance services for Rolls-Royce energy equipment in the country. Recently,Rolls-Royce has opened the EngineeringServices Centre in Kraków, which employsover 70 specialists in engineering designand supply chain management, mainly for the marine, energy and aviation industries. It is worth noting that both centres are managed by Polish engineersand technical staff.
ForeCEEing the future
We see that in Poland there is a commonunderstanding that the country’s futureprosperity will depend on the developmentof the advanced technology sector and that a huge emphasis on innovative manufacturing can bring competitive advantages to the Polish economy. It is a further investment in this area thatcan create highly sustainable economicvalue and Rolls-Royce firmly shares this approach. The company’s commitment to Poland is an important element of itsgrowth strategy in Central & Eastern Europe, with clients present in all areas of its operations.
ROLLS-ROYCE
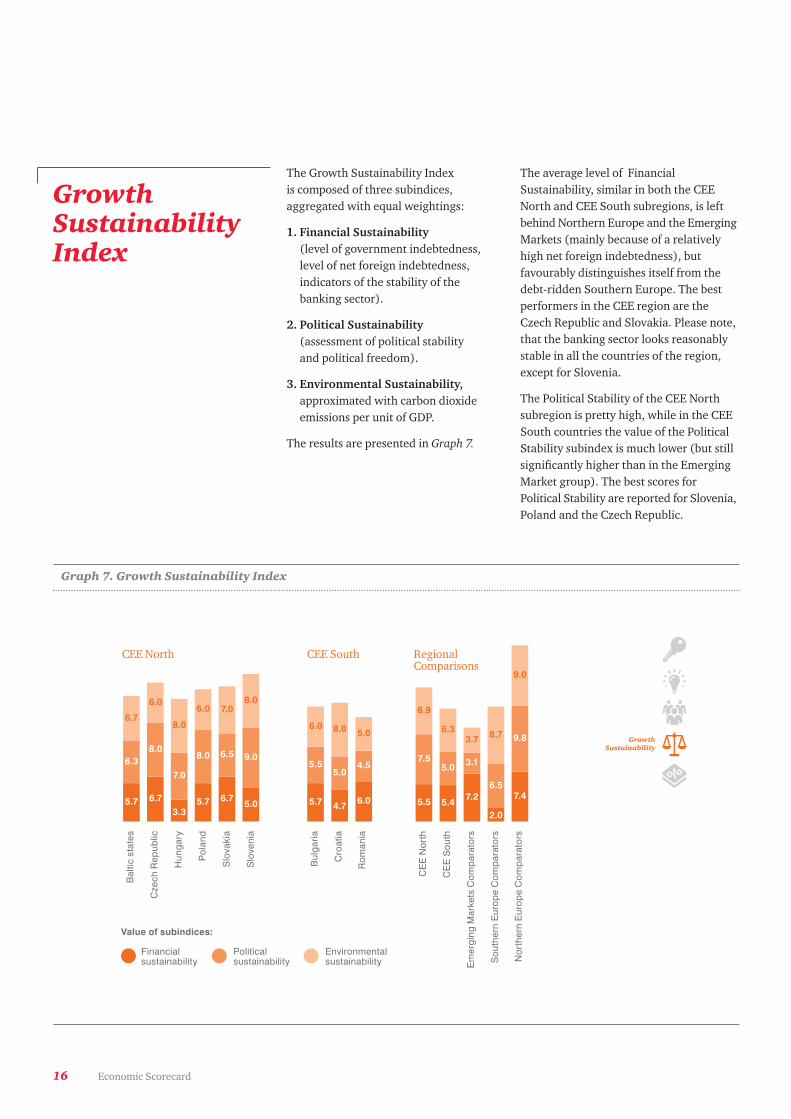
The Growth Sustainability Index is composed of three subindices, aggregated with equal weightings:
1. Financial Sustainability(level of government indebtedness, level of net foreign indebtedness, indicators of the stability of the banking sector).
2. Political Sustainability(assessment of political stability and political freedom).
3. Environmental Sustainability,approximated with carbon dioxideemissions per unit of GDP.
The results are presented in Graph 7.
The average level of Financial Sustainability, similar in both the CEENorth and CEE South subregions, is leftbehind Northern Europe and the EmergingMarkets (mainly because of a relativelyhigh net foreign indebtedness), butfavourably distinguishes itself from the debt-ridden Southern Europe. The best performers in the CEE region are theCzech Republic and Slovakia. Please note,that the banking sector looks reasonablystable in all the countries of the region,except for Slovenia.
The Political Stability of the CEE Northsubregion is pretty high, while in the CEESouth countries the value of the PoliticalStability subindex is much lower (but stillsignificantly higher than in the EmergingMarket group). The best scores for Political Stability are reported for Slovenia,Poland and the Czech Republic.
16 Economic Scorecard
Growth Sustainability Index
Bal
tic s
tate
s
Financialsustainability
Politicalsustainability
CEE North CEE South RegionalComparisons
Cze
ch R
epub
lic
Hun
gary
Pola
nd
Slo
vaki
a
Slo
veni
a
Bul
garia
Cro
atia
Rom
ania
CE
E N
orth
CE
E S
outh
Em
ergi
ng M
arke
ts C
ompa
rato
rs
Sou
ther
n E
urop
e C
ompa
rato
rs
Nor
ther
n E
urop
e C
ompa
rato
rs
Environmentalsustainability
Value of subindices:
GrowthSustainability
5.7
6.3
6.7
6.7
8.0
6.0
3.3
7.0
8.0
5.7
8.0
6.0
6.7
6.5
7.0
5.0
9.0
8.0
5.7
5.5
6.0
4.7
5.0
8.0
6.0
4.5
5.0
5.5
7.5
6.9
5.4
5.0
6.3
7.2
3.1
3.7
2.0
6.5
8.7
7.4
9.8
9.0
Graph 7. Growth Sustainability Index

The Environmental Sustainability of growthin the CEE countries raises some concerns,particularly in the context of accepting the proposed radical climate policy of the EU. The value of the index in both the CEE North and CEE South subregions lags behind Northern Europe and SouthernEurope, exceeding only the value for theEmerging Markets. The best performersare Slovenia, Hungary and Croatia.
Altogether, the Growth Sustainability Indexin the CEE region shows a significantlylower value than in Northern Europe but higher than in Southern Europe and in the Emerging Markets. The score for the CEE North subregion is higher thanfor CEE South and the best performers are Slovenia and the Czech Republic.
The strengths and weaknesses of the CEEcountries in the area of the Growth Sustainability, relative to other compared regions, are presented in Graph 8. In thearea of the Financial Sustainability bothCEE North and CEE South show decent results, lagging behind Northern Europeand the Emerging Markets but greatly outperforming Southern Europe.
In the areas of Political Sustainability and Environmental Sustainability, the indices for CEE North show moderatelyworse results than in the case of NorthernEurope, match the score of Southern Europe and greatly outperform theEmerging Markets. The results for CEESouth are considerably worse in the areaof Political Sustainability but better thanin the Emerging Markets.
17Economic Scorecard
GrowthSustainabilityFinancial
sustainability
Politicalsustainability
Environmentalsustainability
CEE North
CEE South
Emerging Markets Comparators
Southern Europe Comparators
Northern Europe Comparators
Graph 8. Relative strengths and weaknesses of CEE countries: determinants of the Growth Sustainability Index

18 Economic Scorecard
Why CEE?
Poland is an important market for AstraZeneca and a crucial place to conduct its R&D activities. Currently, the value of the Polish clinical researchmarket exceeds €200 million and the country remains the biggest market in the region (including the Commonwealthof Independent States countries), hosting12% of the research conducted in the region.
Key motivators for clinical research in Poland are the population, effective patient recruitment, the high quality of research conducted and a good infrastructure. The researchers’ and medicalstaffs experience and the reliability of the data gathered and processed is also an important element.
Our CEE success story
Poland is home to one of the biggest AstraZeneca clinical departments, which allows doctors and patients to participate in numerous international research programmes and gives access to the latestmedical discoveries. The Polish Clinical Research Division is highly active within the Clinical Research Region Central-EasternEurope, Middle-East and Africa framework.
It collaborates with around 200 differentcentres (clinics, hospital departments, community health facilities and generalpractitioners) across the country, conductingresearch studies involving over 2,000 patients every year.
In 2011, AstraZeneca set up a new team in Poland, which is involved in the planningand coordination process of the global clinical research. The Warsaw Clinical Research Operations Centre is one of fivesuch AstraZeneca units in the world. It coordinates and oversees proceedings of clinical research conducted around the world.
ForeCEEing the future
AstraZeneca intends to continue to developits R&D activities in Poland focusing on cooperation with government institutionsand academic centres. We believe that an effective collaboration between scienceand the industry as well as transferringknowledge from R&D to industry is an important element of further industrial and economic growth in developed economies.
ASTRA-ZENECA
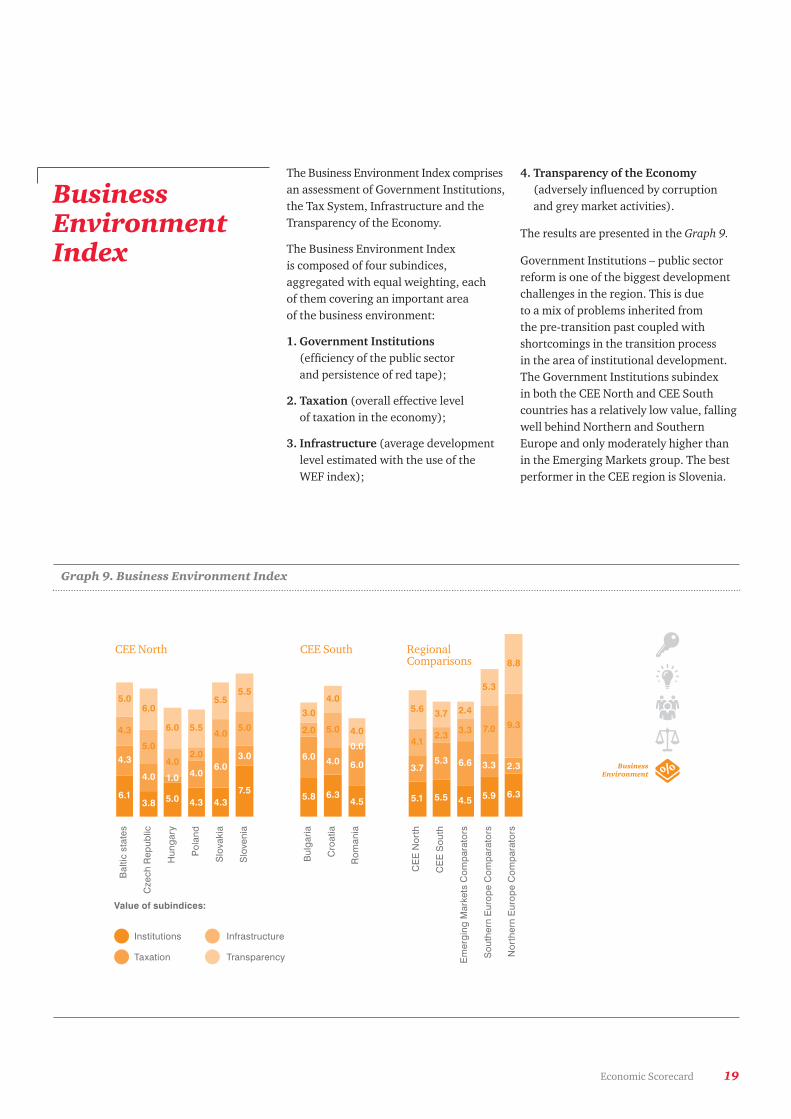
The Business Environment Index comprisesan assessment of Government Institutions,the Tax System, Infrastructure and theTransparency of the Economy.
The Business Environment Index is composed of four subindices, aggregated with equal weighting, each of them covering an important area of the business environment:
1. Government Institutions(efficiency of the public sector and persistence of red tape);
2. Taxation (overall effective level of taxation in the economy);
3. Infrastructure (average developmentlevel estimated with the use of the WEF index);
4. Transparency of the Economy(adversely influenced by corruption and grey market activities).
The results are presented in the Graph 9.
Government Institutions – public sectorreform is one of the biggest developmentchallenges in the region. This is due to a mix of problems inherited from the pre-transition past coupled with shortcomings in the transition process in the area of institutional development.The Government Institutions subindex in both the CEE North and CEE Southcountries has a relatively low value, fallingwell behind Northern and Southern Europe and only moderately higher thanin the Emerging Markets group. The bestperformer in the CEE region is Slovenia.
19Economic Scorecard
Business EnvironmentIndex
Bal
tic s
tate
s
Institutions Infrastructure
CEE North CEE South RegionalComparisons
Cze
ch R
epub
lic
Hun
gary
Pola
nd
Slo
vaki
a
Slo
veni
a
Bul
garia
Cro
atia
Rom
ania
CE
E N
orth
CE
E S
outh
Em
ergi
ng M
arke
ts C
ompa
rato
rs
Sou
ther
n E
urop
e C
ompa
rato
rs
Nor
ther
n E
urop
e C
ompa
rato
rs
Taxation Transparency
Value of subindices:
BusinessEnvironment
6.1
4.3
4.3
5.0
3.8
4.0
5.0
6.0
5.0
1.0
4.0
6.0
4.3
4.0
5.5
2.0
4.3
6.0
4.0
5.5
7.5
3.0
5.0
5.5
5.8
6.0
2.0
3.0
6.3
4.0
5.0
4.0
4.5
6.0
4.00.0
5.1
3.7
4.1
5.6
5.5
5.3
3.7
2.3
4.5
6.6
2.4
3.3
5.9
3.3
5.3
7.0
6.3
9.3
8.8
2.3
Graph 9. Business Environment Index

The situation in the area of Taxation is different in the two CEE subregions. The CEE South score looks quite favourableand approaches the one of Emerging Markets, while outperforming all the othergroups of countries. Overall, Taxation in CEE North is quite high, mainly due to the developed institutions of the welfare state, albeit still lower than in Northern and Southern Europe. Thebest performers in this area are Bulgaria,Romania and Slovakia.
Infrastructure is much better developed in CEE North than in the CEE South subregion. Unfortunately, in both cases it is left far behind Northern and SouthernEurope and, in the case of CEE South, also behind the Emerging Markets group. The best score in this area is recorded bythe Czech Republic, Slovenia, and Croatia.
The lack of sufficient Transparency of theEconomy is a big challenge in the CEESouth subregion, particularly due to thehigh level of corruption and a widespreadshadow economy. The index value for theCCE North subregion, albeit significantlylower than in the case of Northern Europe,looks much better than in all the other discussed regions, including Southern Europe. The best performers in this areaare the Czech Republic and Hungary,closely followed by Slovakia, Slovenia and Poland.
The overall Business Environment Indexvalue in the whole CEE region is far behind the levels of Northern and SouthernEurope and exceeds the Emerging Marketsonly in the case of CEE North. The bestscores in the CEE region are reported in Slovenia, Slovakia and Baltic states.
The strengths and weaknesses of the CEE countries in the area of Business Environment, relative to other discussedregions, are presented in Graph 10.
In the area of Institutions, the CEE regionfalls behind Northern and Southern Europe. It outperforms both regions in the area of Taxation (particularly the CEE South countries), although it doesnot match the Emerging Markets in this respect. Infrastructure is a weak point of the CEE region, far behind Northernand Southern Europe, and in the case of CEE South behind the Emerging Markets. Finally, the CEE region is also outperformed by Northern Europe in the area of the Transparency.
20 Economic Scorecard
CEE North
CEE South
Emerging Markets Comparators
Southern Europe Comparators
Northern Europe Comparators
Institutions
TaxationTransparency
BusinessEnvironment
Infrastructure
Graph 10. Relative strengths and weaknesses of CEE countries: determinants of the Business Environment Index

21Economic Scorecard
BUPA Why CEE?
For Bupa, Poland is one of the most attractivemarkets in Central and Eastern Europe. The country’s private healthcare market is developing rapidly – the medical subscriptions sector grew over 20% per annum between 2007 and 2011. Within that same period, private medicalinsurance was the fastest growing source of healthcare funding at an annual growth of 30%. On top of that, the private healthcare market is forecast to rise at 10% a year until 2016 with revenues set to maintain a double-digit increase for the next five years.
Our CEE success story
In 2013, we acquired LUX MED, Poland’sleader on the medical subscription market,which also has an extensive footprint in provision. We think that it is a great business, with a strong position on the market, which will provide us with an excellent platform for future growth. We know from our operations in Europethat there are significant advantages withthis model, such as bringing better oversightof the patient journey and helping to makehealthcare accessible and affordable.
ForeCEEing the future
Bupa is constantly seeking opportunities to enter new markets, where we can offer a real value to our customers, generate a good financial return and benefit the entire Bupa Group. We are currently focusedon working with LUX MED’s managementto ensure a smooth integration of the business. As an international healthcaregroup, with a constant revenue growth for over a decade, we also have the financialresources to invest in LUX MED to ensure a long-term development. We want to useour international expertise in healthcare to benefit existing and new customers and the entire Polish healthcare system.

The overall assessment of growth potentialin the CEE region should be based on the relative strengths and weaknesses in the five areas influencing the countries’ investment attractiveness. The most general picture is shown in Graph 11,which presents the value of the five indices(Access to Markets Index, Resources for Growth Index, Cost CompetitivenessIndex, Growth Sustainability Index, Business Environment Index) for the discussed regions.
According to the information included in the indices:
• Access to Markets is a valuable asset of the CEE countries which positivelydistinguishes them them from theEmerging Markets and Southern Europe.
• Resources for Growth are somehow limited, particularly in the CEE Southsubregion. In the CEE North subregionthe availability of resources for growthexceeds the other regions except for Northern Europe.
• Cost Competitiveness in the CEE regiongreatly outperforms Northern andSouthern Europe and, after taking into consideration the quality of labour,matches the attractiveness of theEmerging Markets.
• Growth Sustainability in the CEE regionlooks more solid than in the EmergingMarkets and Southern Europe but the index level falls short of the levelrecorded in Northern Europe.
• In the area of Business Environment,the CEE region is outperformed by Northern and Southern Europe.
A suggested area for policy development is that the CEE countries should concentrate their efforts on improving thebusiness environment and securing theirgrowth stability. Improvements in theseareas do not require heavy costs and canbe easily translated into a large increase in investment attractiveness.
22 Economic Scorecard
Overall Assessment
CEE North
CEE South
Emerging Markets Comparators
Southern Europe Comparators
Northern Europe Comparators
Accessto Markets
Resourcesfor Growth
CostCompetitiveness
GrowthSustainability
BusinessEnvironment
Graph 11. Relative strengths and weaknesses of CEE countries: determinants of the Growth Conditions

23Economic Scorecard
ATKINS Why CEE?
Atkins has been operating in Poland since1991. Our attraction to the country was the obvious need for infrastructure improvements for which pre-accessionfunding was made available from the European Union prior to Poland’s entry to the EU. We believed that Atkin’s capabilityand experience was a perfect match for the infrastructure works required.
Our CEE success story
At the start of the company’s presence in Poland we focused on the highways network improvements where we quicklyestablished a strong position in both thepublic and private sectors. Over the years,Atkins Polska has been involved in everymajor highway built under the Private Public Partnership (PPP). We have conductedmajor feasibility studies into upgrades of railway lines in the country, providedconsultancy support to Tesco, managed and designed upgrades and new petrol stations and retail outlets for Shell, designedand project managed factory facilities for Technicolor as well as implemented a range of other design and consultancy assignments for government agencies and public bodies.
A new Liquefied Natural Gas RegasificationTerminal in Świnoujście, in the north-westof the country, the first such a facility in Central and Eastern Europe, the strategically important A1 and A2 motorways and the Environmental Impact Assessment element of a feasibility studyinto the first High Speed Rail systemplanned for Poland are our current ‘flagship’ projects.
ForeCEEing the future
The need for significant infrastructure improvement remains as the Polish population expectations regarding the quality of life and quality of infrastructureare growing. The next EU funding framework will fuel more future projects.That coupled with our talented and highlymotivated workforce and massive marketopportunities infrastructure, water management, nuclear, thermal power generation and shale gas is a perfect recipefor success. And these opportunities are not confined to Poland but the countryis an excellent platform to broaden our activities in the region.
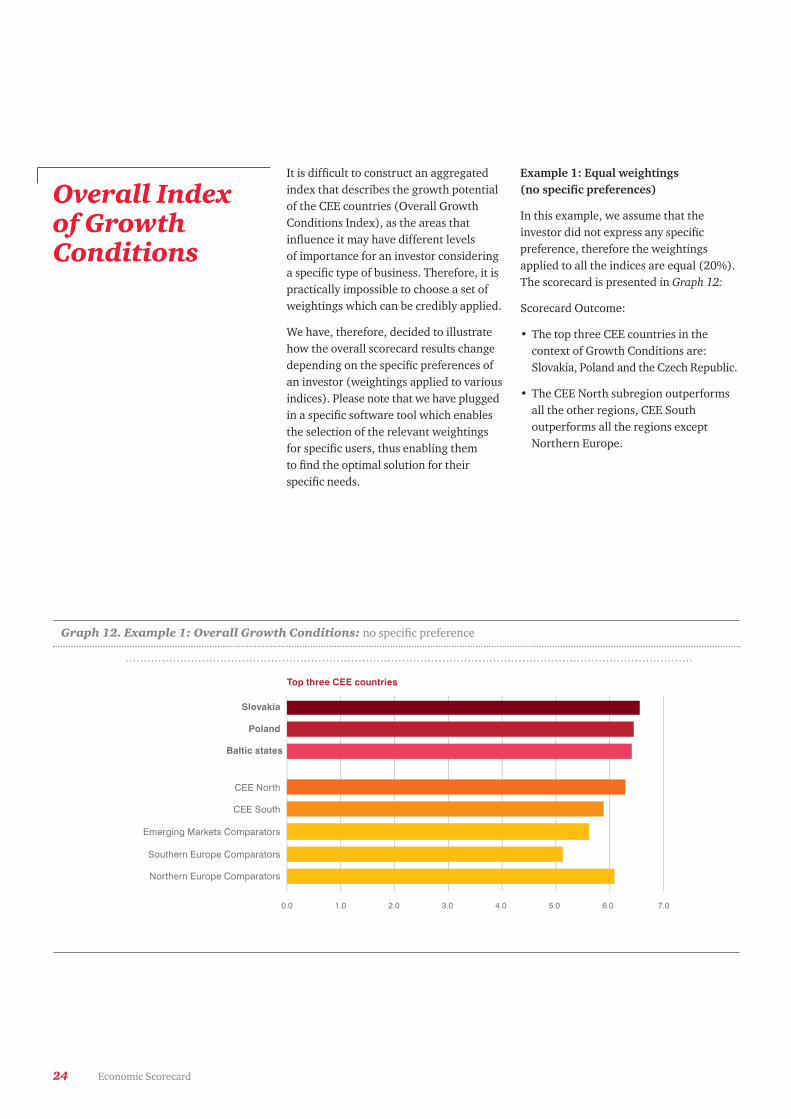
It is difficult to construct an aggregatedindex that describes the growth potentialof the CEE countries (Overall GrowthConditions Index), as the areas that influence it may have different levels of importance for an investor consideringa specific type of business. Therefore, it ispractically impossible to choose a set ofweightings which can be credibly applied.
We have, therefore, decided to illustratehow the overall scorecard results changedepending on the specific preferences ofan investor (weightings applied to variousindices). Please note that we have pluggedin a specific software tool which enablesthe selection of the relevant weightingsfor specific users, thus enabling them to find the optimal solution for their specific needs.
Example 1: Equal weightings (no specific preferences)
In this example, we assume that the investor did not express any specific preference, therefore the weightings applied to all the indices are equal (20%).The scorecard is presented in Graph 12:
Scorecard Outcome:
• The top three CEE countries in the context of Growth Conditions are: Slovakia, Poland and the Czech Republic.
• The CEE North subregion outperformsall the other regions, CEE South outperforms all the regions exceptNorthern Europe.
24 Economic Scorecard
Overall Index of Growth Conditions
0.0 1.0 2.0 3.0 4.0 5.0 6.0 7.0
Northern Europe Comparators
Southern Europe Comparators
Emerging Markets Comparators
CEE South
CEE North
Baltic states
Poland
Slovakia
Top three CEE countries
Graph 12. Example 1: Overall Growth Conditions: no specific preference

Example 2: Low cost preference
In this example, we assume that the investor places 50% preference to low production costs, the weightings applied to all the other indices are equal (12.5%).
The scorecard is presented in Graph 13:
Scorecard Outcome:
• The top three CEE countries with respect to Growth Conditions are: Romania, Poland and Bulgaria.
• The CEE North and South regionsgreatly outperform Northern and Southern Europe and fall behindthe Emerging Markets.
Example 3: Access to global markets
In this example, we assume that the investor prioritises Access to Global Markets as the most relevant index (no credit given to the domestic marketdynamics); the weightings applied to allfive indices are equal (20%).
The resulting scorecard is presented in Graph 14:
Scorecard outcome:
• The top three CEE countries with respect to Growth Conditions are: theCzech Republic, Slovakia, and Poland.
• The CEE North and South regions outperform all the other regions except Northern Europe.
Example 4: Dynamics of local marketpreference
In this example, we assume that the investor takes into account only the local market dynamics component in the Access to Markets Index (no creditgiven to the access to global markets); the weightings applied to all the other indices are equal (20%).
The resulting scorecard is presented in the Graph 15:
Scorecard Outcome:
• The top three CEE countries with respect to Growth Conditions are: Slovakia, Poland and the Baltic states.
• The CEE North subregion outperformsall the other regions (Emerging Markets only slightly) and CEE South outperforms all the regions but theEmerging Markets.
25Economic Scorecard
0.0 2.0 4.0 6.0 8.0 10.0
Northern Europe Comparators
Southern Europe Comparators
Emerging Markets Comparators
CEE South
CEE North
Bulgaria
Poland
Romania
Top three CEE countries
Graph 13. Example 2: Overall Growth Conditions: low cost preference

26 Economic Scorecard
0.0 1.0 2.0 3.0 4.0 5.0 6.0 7.0 8.0
Northern Europe Comparators
Southern Europe Comparators
Emerging Markets Comparators
CEE South
CEE North
Poland
Slovakia
Czech Republic
Top three CEE countries
Graph 14. Example 3: Overall Growth Conditions: access to global markets preference
0.0 1.0 2.0 3.0 4.0 5.0 6.0 7.0
Northern Europe Comparators
Southern Europe Comparators
Emerging Markets Comparators
CEE South
CEE North
Baltic states
Poland
Slovakia
Top three CEE countries
Graph 15. Example 4: Overall Growth Conditions: dynamics of local market preference
27Economic Scorecard
Why CEE?
HSBC has been operating in Poland since1990. Initially, as HSBC Investment Services,and since 2004 as HSBC Bank Polska, wehave acted as an adviser and lead managerin over 40 transactions with a total value of €5 billion. In 1997 we began our businessin the Czech Republic. Today, in both markets, HSBC is an established provider of financial services, offering a range of wholesale banking services for corporateand institutional customers.
Our CEE success story
Central and Eastern Europe is a developingmarket with a growing international connectivity and a lot of opportunities for business development. With a constantchange in the shape of the global economy,we believe that Poland and the Czech Republic have significant strengths necessary to take advantage of these trends.This view is backed up by our regular experience with non-CEE companies fromdifferent parts of the world being interestedin local opportunities and with the successof CEE businesses in realising growth in exports also to faster growing regionsoutside of the EU.
ForeCEEing the future
In a short-term perspective, Poland and theCzech Republic may face some short-termheadwinds due to the ongoing uncertaintyin the euro zone, which is CEE’s key tradingpartner, as well as the growing concernsabout the development of emerging markets.
However, the future is set to be bright for both these economies. HSBC’s economists recognise them as two of thekey ‘Economies of Tomorrow’, with Polandranked 25th and the Czech Republic ranked49th in the 2050 Economic League Table.
HSBC

Apart from the conditions for growth(measured by the five indices: Access to Markets, Resources for Growth, CostCompetitiveness, Growth Sustainability,Business Environment Index) investors,depending on their preferences, may takeinto account the size and scale of theeconomy in the CEE countries.
This aspect is particularly important if a relatively large investment aimed at exploiting the domestic market is considered, or if the availability of a relatively large supply of appropriately
skilled labour is important for the success of the investment project.
On the other hand, these factors may proveto be irrelevant if a project is of a reducedscale and the market size/availability of the labour is not seen as a problem.We have paired the Growth Conditionscomponent of the scorecard with the overall size of the economy to obtain a fullpicture of the investment attractiveness of CEE countries.
The comparison is presented in Graph 16.The size of the population is mappedagainst the Overall Growth Conditions(calculated with no specific investor’spreference, see Example 1). The size of the bubble corresponds to the size of the market (GDP).
As the graph clearly shows, when theOverall Growth Conditions are calculatedwith no specific investor preference and mapped against specific countryeconomies, Slovakia, Poland, the Baltic
States and the Czech Republic offer the bestdevelopment prospects. However, if the size matters, Poland clearly outperforms Slovakia and the Baltic states and, to somedegree, also the Czech Republic.
Obviously, the results change to some degree if other weightings are used for the calculation of the Overall GrowthConditions.
Scorecard Comparison Outcome:
• The top four markets with regard to Growth Conditions and Size of the Economy are the Czech Republic, Slovakia, Poland and the Baltic States.
• If size matters, Poland clearly outperforms the Czech Republic, Slovakia and the Baltic States.
The results change to some degree if otherweightings are used for the calculation of Overall Growth Conditions.
28 Economic Scorecard
Growth Conditions and the Size of the Economy
Poland
Czech Republic
Baltic states
Slovakia
Slovenia
Bulgaria
Romania
Hungary
Croatia
If si
ze m
atte
rs
If Growth Conditions matter
0
10
20
30
40
5.4 5.6 5.8 6.0 6.2 6.4 6.6 6.8
Size of population(millions)
Overall Growth Conditions(no specific investor's preference)
Size of bubbleproportionalto GDP (2012)
Graph 16. Growth Conditions versus market size in CEE countries
Source: PwC, IMF

29Economic Scorecard
Why CEE?
In 1997, when Provident arrived in Poland,quick cash loans which the company offered were not available. The market research we had done prior to our entryshowed there was a high demand for suchproducts in the country. We saw prospectsfor a long-term growth of our business dueto Poland’s well-established and stable economic environment and rapidly-developing economy.
Our CEE success story
After 16 years of Provident’s presence in Poland, we operate some 80 branchesand 160 offices across the country. We have provided 10 million loans to over820,000 customers and 9 out of 10 claim to be satisfied with our services. Our success is based on a close and long-termrelationship with our customers. We respond to their needs instantly andadapt our products to serve them better.This year we have expanded our offer. Currently, we also provide loans to microfirms, our loyal customers can now take a loan up to €2,400 and all loans can be paidoff within a longer period – up to 90 weeks.
Provident Polska is a part of InternationalPersonal Finance (IPF), listed on the London Stock Exchange as one of the 250largest companies (FTSE-250). In March2013, the company started a secondary listing on the Warsaw Stock Exchange. We believe that not only will it help attractnew shareholders to invest in the Groupwhich is delivering growth in all our markets in Europe and Mexico but also reflects our confidence in our Polish homecredit business.
ForeCEEing the future
With our head office in the UK, we operatein seven countries: Poland, the Czech Republic, Slovakia, Hungary, Romania and Mexico. In July 2013, we started ourquick cash loan business in Lithuania and are also planning to enter Bulgaria by the end of the year. We are constantly looking at other neighbouring markets and systematically developing the range of our products. We focus on emerging markets where demand for credit is risingand customers are relatively underserved.
PROVIDENT

30 Economic Scorecard
Methodological Annex
Index Share of Description Valuation of original Source Commentssubindices measure of original data
ACCESS TO MARKETS INDEX
Global Markets 50%
Access to Global The index is based on the countries’ The higher PwC Markets membership in international organisations: the better analysis
EU, NAFTA, ASEAN, WTO. The membership in given organisations provides the following values to the original measure: EU=10, NAFTA=8, US/EU Free Trade Agreement=6, Regional Free Trade Agreement=4, WTO membership=2
Trade Freedom The index is based on the Trade Freedom The higher Heritagemeasure of Heritage Foundation. (2013 data) the better Foundation
FDI Stock The index is based on the stock of Foreign The higher UNCTAD dataDirect Investment in the country as the the better for FDI and IMFpercent of GDP in 2012. data for GDP
Export Diversity The HHI (Herfindahl-Hirschman Index) The lower OECD data on Standard trade data of export concentration based on the OECD value the better Trade in Value were used for: data on Trade in Value Added. The OECD in Value Added Croatia and Ukrainedata on Trade in Value Added measure theestimated actual value of exported goods in value added of destination countries. The measure we use is a proxy for dependence on the countries’ exports on the total demand in a limited number of the largest trade partners.
Local market 50%
Local market potential The index is based on the average GDP The higher the IMFgrowth rate for the period between 2003 the betterand 2012. It illustrates the long-term growth potential of the local market.
RESOURCES FOR GROWTH INDEX
People 33%
Population The index based on the total percentage The higher UN demographicgrowth of the population between 2010 growth rate forecastand 2030, according to the UN forecast. the better
Old Age The index based on the forecasted The lower UN demographicDependency share of 65+ persons in the total share the better forecast
population in 2030.
Table 1. Construction of indices

PISA The index based on the PISA 2009 results The higher OECD The value have beenmathematics for mathematics. PISA is an international result the better assumed based on
study run by the OECD every 3 years. other results for:It evaluates education systems worldwide South Africa and Ukraineby assessing 15-year-olds’ competenciesin the key subjects: reading, mathematics and science.
Total Students The index based on the share of students The higher UNESCO institute The shares have beenparticipating in tertiary education in the share the better for statistics estimated based on othercountry’s total population. results/sources for: South
Africa, Russia, ThailandItaly and Germany
Secondary The index based on the share of students The higher UNESCO institute The shares have beenEnrollmen participating in secondary education share the better for statistics estimated based on
in the country’s total population. other results/sourcesfor Brazil and Greece.
Infant Mortality The index based on the infant mortality The lower UN Statisticsrate data as published by United Nations the better DivisionStatistics Division. (2011 data)
Capital 33%
Saving rate The index is based on the share of savings The higher IMFin the countries’ GDP. (2012 data) share the better
Investments The index is based on the share of The higher IMFinvestment in countries’ GDP. (2012 data) share the better
Stock Exchange The index is based on the relation of value The higher CIA World The maximum value of of traded shares to the countries’ GDP. share the better Factbook for the the index has been given(2010 data) value of traded to the countries, where
shares and IMF the value of shares radedfor GDP has been at least equal
to the average of the Northern European countries.
Lending Rate The index is based on the Commercial The lower CIA Worldbanks average lending rate. (2012 data) the better Factbook
Credit to GDP The index is based on the relation The lower CIA Worldof the stock of domestic credit to the the better Factbook or the countries’ GDP. It is assumed that value of domestic the average relation (around 100% credit and theof GDP) is the optimal one. Too low IMF for GDPa value of domestic credit means an underdevelopment of financial markets. Too high a value is equivalent of an overleveraged economy. Hence, the final measure is the distance to the 100% value. (2010 data)
31Economic Scorecard
Index Share of Description Valuation of original Source Commentssubindices measure of original data
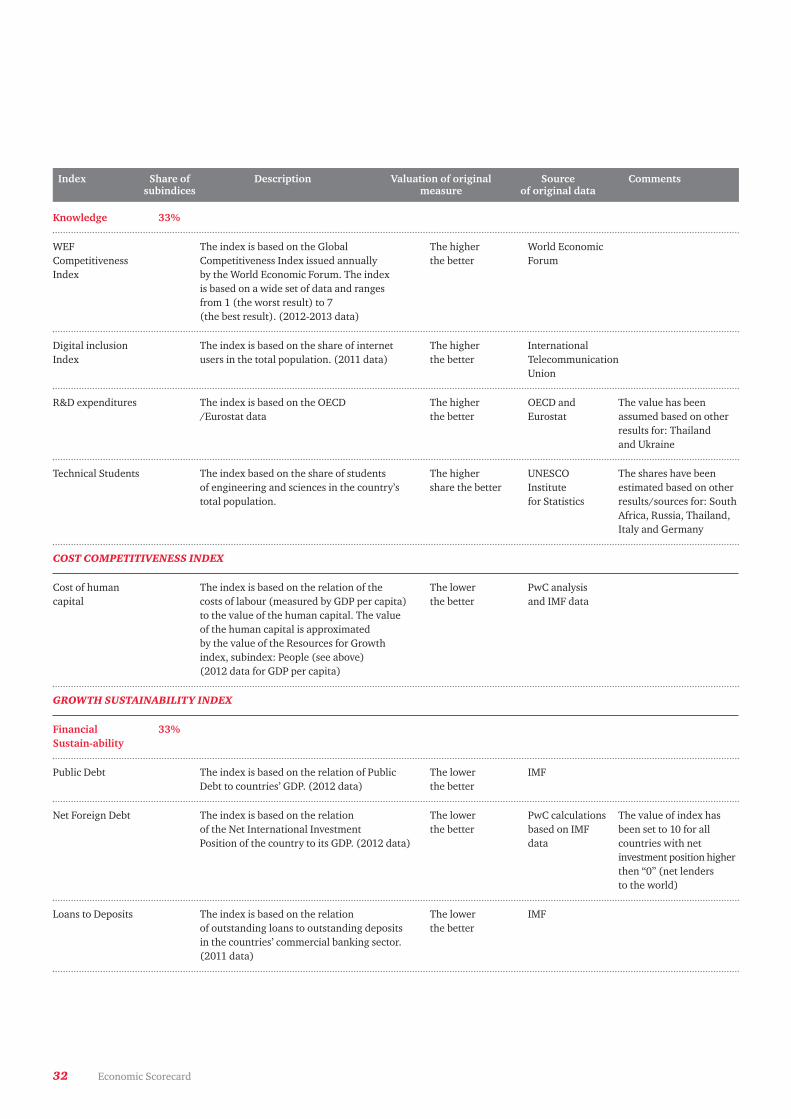
Knowledge 33%
WEF The index is based on the Global The higher World EconomicCompetitiveness Competitiveness Index issued annually the better ForumIndex by the World Economic Forum. The index
is based on a wide set of data and ranges from 1 (the worst result) to 7 (the best result). (2012-2013 data)
Digital inclusion The index is based on the share of internet The higher InternationalIndex users in the total population. (2011 data) the better Telecommunication
Union
R&D expenditures The index is based on the OECD The higher OECD and The value has been/Eurostat data the better Eurostat assumed based on other
results for: Thailand and Ukraine
Technical Students The index based on the share of students The higher UNESCO The shares have beenof engineering and sciences in the country’s share the better Institute estimated based on othertotal population. for Statistics results/sources for: South
Africa, Russia, Thailand, Italy and Germany
COST COMPETITIVENESS INDEX
Cost of human The index is based on the relation of the The lower PwC analysiscapital costs of labour (measured by GDP per capita) the better and IMF data
to the value of the human capital. The value of the human capital is approximatedby the value of the Resources for Growthindex, subindex: People (see above) (2012 data for GDP per capita)
GROWTH SUSTAINABILITY INDEX
Financial 33%Sustain-ability
Public Debt The index is based on the relation of Public The lower IMFDebt to countries’ GDP. (2012 data) the better
Net Foreign Debt The index is based on the relation The lower PwC calculations The value of index has of the Net International Investment the better based on IMF been set to 10 for allPosition of the country to its GDP. (2012 data) data countries with net
investment position higherthen “0” (net lendersto the world)
Loans to Deposits The index is based on the relation The lower IMFof outstanding loans to outstanding deposits the betterin the countries’ commercial banking sector. (2011 data)
32 Economic Scorecard
Index Share of Description Valuation of original Source Commentssubindices measure of original data
33Economic Scorecard
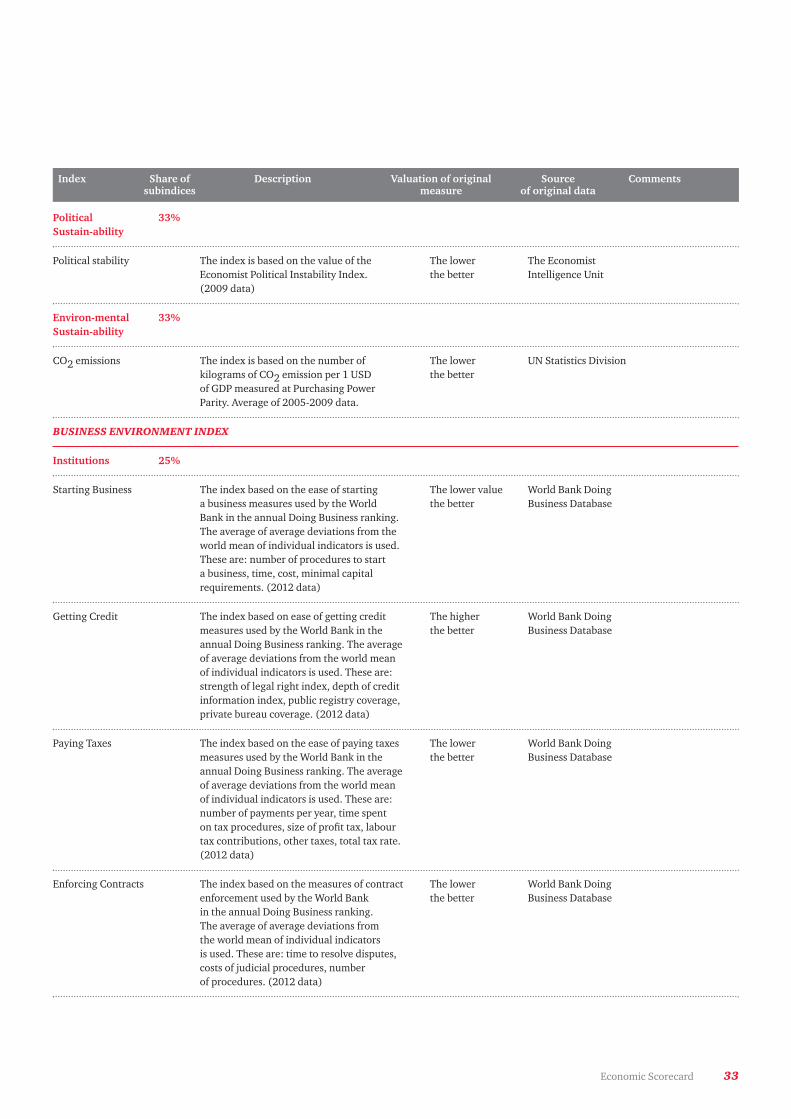
Political 33%Sustain-ability
Political stability The index is based on the value of the The lower The EconomistEconomist Political Instability Index. the better Intelligence Unit(2009 data)
Environ-mental 33%Sustain-ability
CO2 emissions The index is based on the number of The lower UN Statistics Divisionkilograms of CO2 emission per 1 USD the betterof GDP measured at Purchasing Power Parity. Average of 2005-2009 data.
BUSINESS ENVIRONMENT INDEX
Institutions 25%
Starting Business The index based on the ease of starting The lower value World Bank Doinga business measures used by the World the better Business DatabaseBank in the annual Doing Business ranking. The average of average deviations from theworld mean of individual indicators is used. These are: number of procedures to start a business, time, cost, minimal capital requirements. (2012 data)
Getting Credit The index based on ease of getting credit The higher World Bank Doingmeasures used by the World Bank in the the better Business Databaseannual Doing Business ranking. The average of average deviations from the world mean of individual indicators is used. These are: strength of legal right index, depth of credit information index, public registry coverage, private bureau coverage. (2012 data)
Paying Taxes The index based on the ease of paying taxes The lower World Bank Doingmeasures used by the World Bank in the the better Business Databaseannual Doing Business ranking. The average of average deviations from the world mean of individual indicators is used. These are: number of payments per year, time spent on tax procedures, size of profit tax, labour tax contributions, other taxes, total tax rate. (2012 data)
Enforcing Contracts The index based on the measures of contract The lower World Bank Doingenforcement used by the World Bank the better Business Databasein the annual Doing Business ranking. The average of average deviations from the world mean of individual indicators is used. These are: time to resolve disputes, costs of judicial procedures, number of procedures. (2012 data)
Index Share of Description Valuation of original Source Commentssubindices measure of original data
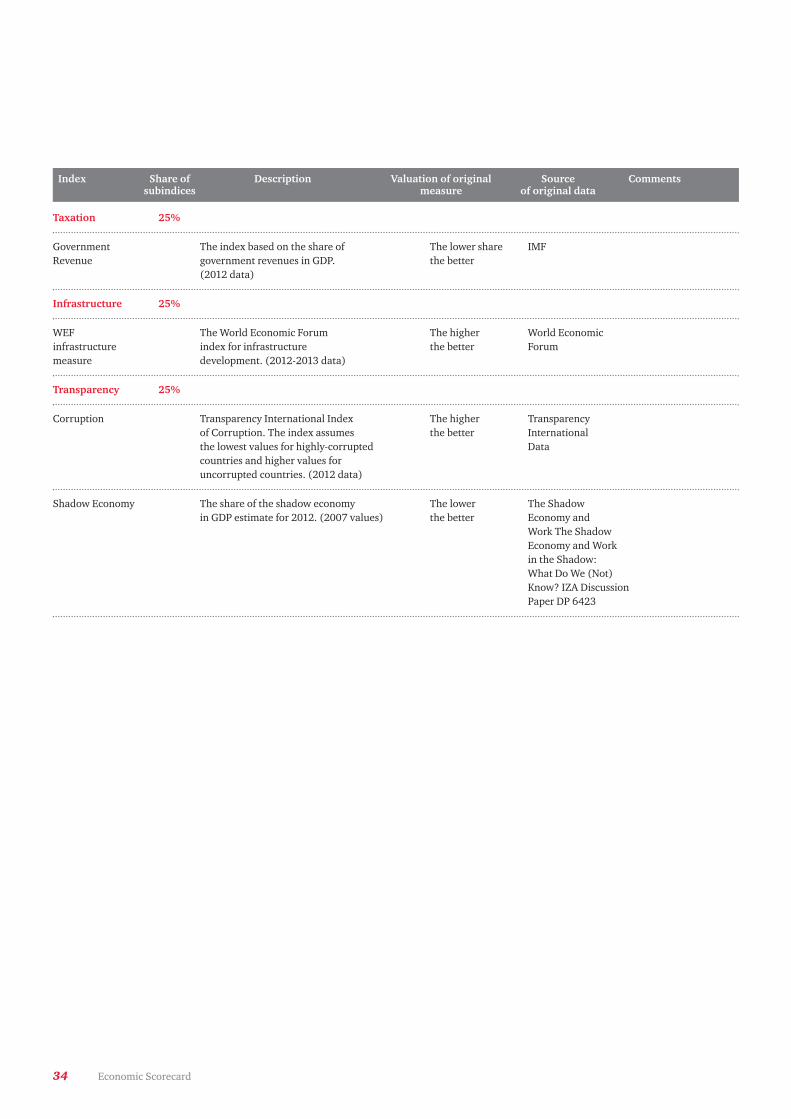
Taxation 25%
Government The index based on the share of The lower share IMFRevenue government revenues in GDP. the better
(2012 data)
Infrastructure 25%
WEF The World Economic Forum The higher World Economicinfrastructure index for infrastructure the better Forummeasure development. (2012-2013 data)
Transparency 25%
Corruption Transparency International Index The higher Transparencyof Corruption. The index assumes the better Internationalthe lowest values for highly-corrupted Datacountries and higher values for uncorrupted countries. (2012 data)
Shadow Economy The share of the shadow economy The lower The Shadowin GDP estimate for 2012. (2007 values) the better Economy and
Work The Shadow Economy and Work in the Shadow: What Do We (Not) Know? IZA DiscussionPaper DP 6423
34 Economic Scorecard
Index Share of Description Valuation of original Source Commentssubindices measure of original data


36 Economic Scorecard
Contact
Witold Orłowski
Chief Economic Advisor PwC tel. +48 (22) 746 4394 e-mail: [email protected]
Mateusz Walewski
Senior Economist PwC tel. +48 (22) 746 6959 e-mail: [email protected]
Martin Oxley
DirectorUK Trade & Investment Polandtel. +48 (22) 311 0203 e-mail: [email protected]


www.EconomicScorecard.eu
© 2013 PwC. All rights reserved. PwC refers to the companies associated in the PricewaterhouseCoopers International Limited (PwCIL), each member of which is a separate legal entity and does not act on behalf of PwCIL or other member firms.