center on urban and metropolitan policy sprawl … on urban and metropolitan policy despite slow...
TRANSCRIPT

October 2003 • The Brookings Institution • Survey Series 1Cen
“Despite two
decades of ane-
mic population
growth, Upstate
has urbanized
hundreds of
thousands of
acres of farm
and forest land
since 1980.”
Center on Urban and Metropolitan Policy
■ Despite slow population growth,425,000 acres of Upstate New Yorkwere urbanized between 1982 and1997, resulting in urban sprawl in theform of declining density. The totalamount of urbanized land in Upstategrew by 30 percent between 1982 and1997, while its population grew by only2.6 percent, reducing the density of thebuilt environment by 21 percent.
■ Compared with other Upstateregions, Western New York sprawledless between 1982 and 1997, andCentral New York sprawled more. AllUpstate regions have falling populationdensity, but Western New York’s densitydropped only 16 percent between 1982and 1997. Meanwhile, Central NewYork—which includes Syracuse,
Utica/Rome, and surrounding coun-ties—urbanized over 100,000 acreseven though it lost 6,500 residents,resulting in a 32 percent decline inits density.
■ People, jobs, and businesses are leav-ing cities and villages and moving totowns. Upstate cities lost over 40,000households in the 1990s alone, whileunincorporated town areas gained over160,000 households; businesses havealso disappeared from cities while grow-ing in towns.
■ Sprawl hits Upstate cities hard. Citytax bases fell in the 1990s, vacant hous-ing increased, and home ownershipslipped. Towns remained comparativelyprosperous.
Findings An analysis of growth and development trends and population in Upstate New Yorkfinds that:
Sprawl Without Growth: The Upstate ParadoxRolf Pendall1
Introduction: Why Sprawl Mattersfor Upstate New York
People throughout the world place astrong value on the landscape, natu-ral environment, and compactsettlement pattern of Upstate New
York. The Adirondack and Catskill mountains,
the Finger Lakes, the Lake Ontario shoreline,Lake Champlain, and the Thousand Islandsattract hundreds of thousands of visitorsannually. At the scale of the entire landscape,farms and forests define the edges ofUpstate’s cities, villages, and hamlets andform a distinctive matrix of land uses. Thesecities, villages, and hamlets have a distinctive
Continued decentralization of people and jobs away from Upstate New York's cities and vil-lages is undermining the economic health and quality of life of the region. State and localleaders need to understand that these trends are not inevitable. Explicit state reforms infiscal policy, annexation laws, and planning can go a long way toward fostering a betterfuture for Upstate New York.

character that includes a mix of landuses, pedestrian-friendly streets andneighborhoods, and a rich endowmentof historic buildings.
New Yorkers have long recognizedthe value of their natural environment,creating an outstanding system ofparks and preserves with the Adiron-dacks as the “crown jewel.” New Yorkalso protects agricultural land in 341agricultural districts encompassing 8.6million acres of land, 30 percent of thestate’s land area, and between 1996and 2001, the state devoted nearly $56million to purchasing developmentrights on 22,000 acres as a mechanismto protect farming operations.
But land protection has neveroccurred without conflict and con-tention in Upstate. The creation of theAdirondack Park Agency, in particular,led to a backlash by local residents and elected officials who resisted thereduction of local control. In theCatskills, New York City has facedstrong suspicions and opposition bylocal governments as it has worked tocorrect and prevent nonpoint waterpollution in the watersheds that con-tribute to its reservoirs.
Perhaps because of contention over land protection, New York’s stategovernment provides a weak andinconsistent framework for local plan-ning and zoning. State law enablestowns, villages, and cities in New Yorkto enact comprehensive plans and landdevelopment regulations and to pursuea wide variety of measures to protectopen space. None of these activities ismandatory, however. Moreover, whenUpstate municipalities do plan or regu-late land use, they enjoy little guidanceor support from state agencies; stateagencies themselves often conducttheir operations without much regardfor their effect upon local land use.
Considering that Upstate’s popula-tion is scarcely growing, and thatmuch scenic, economically productive,and ecologically important land isalready protected, it may seem unim-portant to measure the extent and
gauge the impact of urban sprawl.Sprawl has, however, become a con-cern in Upstate. In 2000, GovernorPataki created the Quality Communi-ties Interagency Task Force, whichrecommended in 2001 that the state“adopt a set of uniform Quality Com-munities Principles” and that theGovernor direct state agencies to use them as they carry out theirresponsibilities. Some of these recom-mendations were incorporated into a bill in the 2001–2002 legislative session. Although the bill failed topass, other bills continue to be intro-duced and debated.
Sprawl has many harmful effects.By many definitions, sprawl has beenshown fairly consistently to degradewildlife habitat, threaten agriculturalproductivity, and raise the cost of pub-lic services at all levels of government.Measuring sprawl, identifying where itis worsening, and moving ahead withmeasures that will reduce it are thusall important public policy issues forUpstate. This report—the second in aseries of five reports on the State ofUpstate—discusses these issues, andin doing so hopes to encourage thegradual development of better stateand local policies to reduce unneces-sary land consumption and sustainUpstate’s cities, villages, hamlets, andsuburban towns.
Methodology
This report uses data from avariety of sources to capturethe extent and nature of sprawlin Upstate New York, and ulti-
mately shows that Upstate sprawlssignificantly by at least two dimensions:its population is becoming more thinlyspread across the landscape, and itsincorporated population centers—vil-lages and cities—are losing residentsand businesses while unincorporatedportions of towns are growing.
The paper uses two primary sourcesto measure trends in Upstate’s urban-
ized land area and population density.In 1982, 1987, 1992, and 1997 theU.S. Department of Agriculture conducted its National ResourcesInventory (NRI), a survey of land cover,agricultural practices, and many otheraspects of non-federally owned land inthe lower 48 states, Hawaii, and PuertoRico; data are available at the countylevel on broad land-cover characteris-tics, including the amount of land inagricultural, forest, and “urban” uses,among other categories. I used theNRI’s urban land data to identify theextent of urbanization in Upstate andother parts of the United Statesbetween 1982 and 1997. I combinedthe NRI data with U.S. Census inter-censal population estimates from 1982,1987, 1992, and 1997 to yield county-level estimates of population density.NRI data have not yet been released for2002, and the U.S.D.A. has no esti-mates on when they will be available.
The paper also uses several sourcesto measure the tendency for incorpo-rated units—cities and villages—to lose people, households, jobs, and businesses as towns outside villageboundaries grow. These three units(cities, villages, and towns) constitutethe local-government building blocks ofNew York’s metropolitan regions, withcities and villages representing historicpopulation centers and towns repre-senting (for the most part) rural andsuburban areas. For the population andhousing data, I combined data fromtwo or three summary levels of STF1 /SF1 (100% count data) and STF3 / SF3(survey data) to construct a compositesummary level that includes cities, vil-lages, and towns outside villages foreach county. When I gauged this aspectof sprawl at the metropolitan orregional level, I assigned cities or vil-lages straddling county lines to thecounty in which the majority of theirpopulation lived in 2000.
Place-based business data are moredifficult to find from governmentsources; I used data from the 1994 and1999 ZIP Code Business Patterns CD-
October 2003 • The Brookings Institution • Survey Series2 CENTER ON URBAN AND METROPOLITAN POLICY

ROMs, matching the data first to five-digit ZIP Code tabulation areas(ZCTAs) provided by the U.S. CensusBureau. I then used GIS to classify allZCTAs into three categories accordingto their relationship with city bound-aries: Non-city ZCTAs fell entirelyoutside city limits; fringe ZCTAs inter-sected city limits but were not centeredwithin city limits; city ZCTAs were cen-tered in or completely contained by citylimits. Only 79 ZCTAs were classifiedas city ZCTAs; there were 131 fringeZCTAs and 977 non-city ZCTAs.ZCTAs were also assigned to countiesand Primary Metropolitan StatisticalAreas based on the location of theZCTA centroid. I assigned just under400 upstate ZIP codes without CensusBureau ZCTAs to latitude-longitudecoordinates based on place names fromthe U.S. Geological Survey’s StateGazeteer files and identified these ZIPsas city or non-city ZIPs. I then esti-mated employment for all undisclosedemployment totals at the mid-point ofspecified ranges, except where thetotals exceeded 50,000 employees. Forthese, I reviewed other years and tai-lored our estimates to be close to thoseother years. Estimated populationaccounts for 6.0 percent of the 1994total and for 3.1 percent of the 1999total. Estimated populations werehigher inside cities than elsewherebecause of a small number of city ZIPcodes that were dominated by one firm(e.g., in Kodak-dominated Rochester).
Findings
A. Despite slow population growth,425,000 acres of Upstate New Yorkwere urbanized between 1982 and1997, resulting in urban sprawl inthe form of declining density. Between 1982 and 1997, Upstate NewYork converted over 425,000 acres ofland from rural uses (mostly agricul-tural and forest land) to urbandevelopment, a 30 percent increase inurban acreage. Over this same 15-year
period, the Upstate population grew byonly 2.6 percent. As population growthhas slowed, moreover, land consump-tion has accelerated (Figure 1).Between 1982 and 1987, urbanacreage grew 5.1 percent and popula-tion 1.2 percent; between 1987 and1992, urban land grew 8.1 percentwhile population grew by 0.9 percent;and between 1992 and 1997, urbanland grew by a remarkable 14.1 per-cent while population growth declinedto only 0.5 percent. As a consequenceof Upstate’s increasingly rapid landconversion, over 20 percent of thetotal 1.9 million acres of the urbanizedland in Upstate as of 1997 had beenurbanized in the previous 15 years.
As urbanization in Upstateincreased and farm economies suf-fered, the number of acres incultivated cropland declined by 20percent—about 675,000 acres—between 1982 and 1997. Over half ofthe net decline in cultivated croplandoccurred in metropolitan areas. On amore positive note, Upstate lost only 3 percent of its prime agricultural landto urban uses. During this period, infact, the number of forested acres inUpstate New York grew by over onemillion acres, over twice as much land
as was urbanized (Figure 2). Forestland grew less rapidly than urban land,however: forest acreage gained 6.4percent, while urban land grew 30 per-cent, bringing their total respectiveshares of Upstate’s non-Federal landarea to 60 percent and 10 percent.
Because urbanization has outpacedpopulation growth, the density ofdeveloped land dropped 21 percentbetween 1982 and 1997, meaning thatby at least one measure, Upstate’s landuse pattern became more sprawling inthe 1980s and 1990s. Overall, Upstatehad about 3.7 persons per acre ofurbanized land in 1997 compared toabout 4.7 in 1982. Long Island, bycontrast, had about 6 persons perurbanized acre in 1997, and the threecounties between New York City andUpstate (Westchester, Putnam, andRockland) had 4.8 persons per urban-ized acre. New York City’s populationdensity by this measure is 43.8 per-sons per urbanized acre. Urbanizedland in Upstate New York remainsdenser than 35 other U.S. statesdespite this rapid sprawl, however; onaverage, the U.S. had between 3.5 and3.6 residents for every acre of urban-ized land in 1997.
October 2003 • The Brookings Institution • Survey SeriesCENTER ON URBAN AND METROPOLITAN POLICY 3
Upstate urbanized land growth rate accelerates while populationgrowth rate declines, 1982–1997
1.2 0.9 0.5
5.1
8.1
14.1
0.0
3.0
6.0
9.0
12.0
15.0
1982 to 87 1987 to 92 1992 to 97
Percen
t ch
an
ge
■ Population■ Urbanized land

B. Compared with other Upstateregions, Western New York sprawledless between 1982 and 1997, andCentral New York sprawled more.Sprawl varies across Upstate’s regions,shown in Map 1. Generally speaking,the regions that began the 1980s withhigh density lost less density than thealready low-density regions between1982 and 1997. In 1997, WesternNew York—anchored by Buffalo—ledthe six major Upstate regions in den-sity, with 5.3 persons per urbanizedacre. Western New York also lost lessdensity (16 percent) than most otherUpstate regions between 1982 and1997 (Figure 3); although its popula-tion declined by about 64,500 peoplebetween 1982 and 1997, it urbanizedonly about 33,000 acres, the smallestgain in urbanized acres of any Upstateregion. The Rochester/Finger Lakesregion lagged Western New York’s den-sity slightly in 1997, with 4.2 personsper acre; its population grew by about56,750 between 1982 and 1997, andit urbanized just over 50,000 acres,resulting in a decline in density com-parable to that of Western New York(14.2 percent for Rochester/FingerLakes, 15.9 percent for Western New York).
Central New York—which includesSyracuse, Utica/Rome, and surround-ing counties—lost about 6,500residents between 1982 and 1997, a0.6 percent decline. But it urbanizedjust over 100,000 acres, a 45 percentincrease, and its density fell from 5.17to 3.54 persons per urbanized acre.This 32 percent decrease in densitywas the highest of any Upstateregion’s. The Southern Tier region,with a population of about 735,000 in1997, posted density declines thatrivaled Central New York’s; its popula-tion grew by a scant 500 peoplebetween 1982 and 1997, but urbaniza-tion claimed 60,000 new acres of land,driving density from 4.58 to 3.33 per-sons per urbanized acre.
Population grew faster in the Hud-son Valley and North Country
regions—between 8 and 9 percent—than elsewhere in Upstate between1982 and 1997, but urbanization inthe North Country outpaced that inthe Hudson Valley by 11 percentagepoints (40 percent increase in urbanland, compared to 29 percent in theHudson Valley). Consequently, theNorth Country’s density—already thelowest in the state, consistent with itsrural character—declined by 22 per-cent, while that in the Hudson Valleydropped about 15 percent. Consider-
ing that many of the North Country’snew residents were incarcerated invery high density prisons, this declinein average density probably under-states the perceived impact of newdevelopment at both ends of the den-sity spectrum.
Other studies of sprawl also suggestthat Western New York has less sprawlthan other Upstate regions—and evenless than the national average. In 2002,Smart Growth America (SGA) releaseda multi-dimensional analysis of sprawl
October 2003 • The Brookings Institution • Survey Series4 CENTER ON URBAN AND METROPOLITAN POLICY
Figure 2. Agriculture declines, urban and forest land increasein Upstate, 1982–97
Figure 3. Density slips across Upstate, 1982–1997
0%
10%
20%
30%
40%
50%
60%
70%
80%
90%
100%
1982 1997
Percen
t o
f U
pstate lan
d area
■ Rural transportation■ Minor uses■ Urbanized■ Uncultivated cropland■ Cultivated cropland■ Pasture■ Forest
0.00
1.00
2.00
3.00
4.00
5.00
6.00
7.00
Upstateaverage
Western Central Rochester/FingerLakes
SouthernTier
Hudson NorthCountry
Po
pu
latio
n per u
rban
acre ■ 1982
■ 1997

in 83 metro areas nationwide, includingBuffalo, Rochester, Syracuse, andAlbany. Buffalo stands out in the SGA study for having not only higherdensity than most other metro areasnationwide but also high levels of “cen-teredness” and neighborhood mixeduses. Rochester and Syracuse alsoexceed national levels of centeredness,but both have low amounts of mixeduse. In all three metro areas, the cen-tral business districts still account for a substantial share of metropolitanemployment; furthermore, all threemetropolitan areas have a historic settlement pattern in which many resi-dents live in cities and villages that aresubstantially denser than surroundingtowns. Albany is about as centered asthe national average; it ranks lowerthan the other Upstate metros becauseof the importance of Schenectady andTroy as subsidiary second cities in theCapital District and because of rapiddevelopment of jobs in suburban areas(e.g., Saratoga County and the town of Colonie).
How has Western New York—and inparticular, Buffalo—kept its densityeven while losing over 50,000 residents?At least two explanations come to mind.First, Buffalo’s economic decline beganbefore those of the other metro areas;consequently, the economic and demo-graphic forces that began the seriousmomentum of sprawl in the 1980s inother healthier regions were muchweaker in Buffalo. Second, Erie Countyhas 44 jurisdictions, but nearly 60 per-cent of the housing built in the 1990swas built in only five of these jurisdic-tions. Further research is needed tohelp clarify other reasons for the relativecompactness of new development inBuffalo compared to other Upstateregions, especially local land-use regula-tion, infrastructure investment, andeconomic development policy.
C. People, jobs, and businesses areleaving cities and villages and mov-ing to towns.A critical aspect of Upstate sprawl isthe depopulation and transformation
of incorporated cities and villages and the simultaneous low-densitydevelopment of the portions of ruraland suburban towns that lie outsidethe boundary of any village. Upstate’s53 cities lost 7.3 percent of their population in the 1990s, while its 414 villages lost 1.7 percent. On net,upstate cities lost over 140,000 resi-dents and 40,000 households in the1990s; villages lost over 16,000 residents, but they gained 6,800households. Meanwhile, householdsand population surged in the townsoutside village boundaries, with popu-lation growth of over 230,000 (5.8percent) and household growth ofnearly 160,000 (11.3 percent). In2000, about 1.8 million Upstate resi-dents lived in cities, just over 900,000in villages, and nearly 4.2 million intowns outside villages.
The loss of residents was mostsevere in Upstate’s largest cities (Fig-ure 4). The four cities that had morethan 100,000 residents in 1990—Buffalo, Rochester, Syracuse, andAlbany—lost 8.4 percent of theircumulative population and 7.5 percentof their households in the 1990s. Thefive cities with between 50,000 and100,000 residents in 1990 (Utica,Schenectady, Niagara Falls, Troy, andBinghamton) lost an even greatershare of their population—9.5 per-cent—and 7.1 percent of theirhouseholds. Even the 34 cities withfewer than 25,000 residents lost 5.1percent of their residents and 1.8 per-cent of their households. Upstate’s400-plus villages lost residents as well,regardless of their size category, butthe 46 villages with over 5,000 resi-dents lost only 0.3 percent of theirpopulation, and their household basegrew by 2.4 percent. On average,smaller villages appear to have moredifficulty retaining their population.There were few regional differences in the pattern of city and village population loss, except that the NorthCountry villages lost not only popula-tion but also households in the 1990s.
October 2003 • The Brookings Institution • Survey Series 5CENTER ON URBAN AND METROPOLITAN POLICY
Map 1. Urban acreage, Upstate counties, 1982 and 1997
Western
Rochester/Finger Lakes
Southern Tier
Central
North Country
Hudson
0 25 50 75 100Miles
Upstate regions
Urban land
1982
1997100,000acres

Towns’ growth, like cities’ decline,was widespread across size categories.The 78 towns with more than 10,000residents accounted for over 2 millionresidents in 2000, more than the com-bined population of Upstate’s 53 citiesand nearly half the total population ofUpstate’s towns. These towns grew byover 103,000 residents in the 1990s,up 5.4 percent from 1990. The 521towns with fewer than 2,500 residentsin 1990 grew faster: in total, a gain of52,000 residents (about 7.5 percent)in the 1990s. Despite the widespreadgrowth, however, there were 202towns that lost population, especiallythose hit hard by military base realign-ments and deindustrialization. A fewtowns lost residents on paper becauseof annexations to villages, but annexa-tion is relatively rare and modest inUpstate New York.
Jobs and business establishmentsalso decentralized substantially inUpstate (Figure 5). Overall, accordingto ZIP business patterns, upstategained 698 business establishmentsand about 78,000 jobs between 1994and 1999, increases of 0.5 percentand 3.3 percent, respectively. But thecity ZIP codes lost 1,911 establish-ments between 1994 and 1999, a 5.0percent decline. Employment losseswere also severe in these city ZIPs;businesses in these locations shed over50,000 workers, over 6.0 percent oftheir workforce. Fringe ZIP codes alsolost businesses—a net decline of 190,or 0.4 percent—but they gained over58,000 employees between 1994 and1999. Non-city ZIPs, meanwhile,gained nearly 2,800 new businessesand over 71,000 employees.
Every Upstate region experiencedthis decentralization to some extent.City ZIP codes lost establishments inall six major Upstate regions and inevery Upstate metropolitan area. CityZIPs in Western New York lost 5.4 per-cent of their business establishments;Central New York and the SouthernTier both lost between 3 and 4 percentof their city-based establishments. The
number of non-city establishmentsgrew in four of the six Upstate regions.Business growth was strongest in theHudson Valley and Rochester/FingerLakes regions, where establishmentsgrew by more than 7 percent. CentralNew York and the Southern Tier lostbusinesses based entirely outside citycenters, but in neither region did theloss exceed 1.0 percent of businesses.
D. Sprawl hits Upstate cities hard.The decline in population, households,and businesses has hit Upstate cities
hard in many ways. Uppermost in theminds of most mayors and city adminis-trators has been the decline in cities’tax bases. According to data from theNew York State Comptroller’s Office,the assessed value of Upstate’s citiesdeclined 7.1 percent in the 1990s, from$45.1 trillion in 1990 to $41.9 trillionin 2000 (constant 2000 dollars). Citiesin the Binghamton, Rochester, andSyracuse Metropolitan Statistical Areashad even more dramatic declines intheir assessed values: 33 percent, 20percent, and 18 percent, respectively
October 2003 • The Brookings Institution • Survey Series6 CENTER ON URBAN AND METROPOLITAN POLICY
Figure 4. Cities lost population, households regardless of size,1990–2000
-10.0
-9.0
-8.0
-7.0
-6.0
-5.0
-4.0
-3.0
-2.0
-1.0
0.0
<25K 25 to 50K 50 to 100K >100,000
1990 Population Size
Percen
t ch
an
ge
■ Population■ Households
Figure 5. Cities lost businesses, suburbs gained, 1994 to 1999
-1,500
-1,000
-500
0
500
1,000
Ch
an
ge in
bu
sin
ess establish
men
ts
■ Non-city■ City■ Fringe
Non
-met
ro
Alb
any
Bing
ham
ton
Buffa
lo
Dut
ches
s
Elm
ira
Gle
ns F
alls
Jam
esto
wn
New
burg
h
Roc
hest
er
Syra
cuse
Utic
a-R
ome

(constant dollars). The total debt out-standing in cities increased by 23percent, from $2.3 trillion to $2.9 tril-lion, between 1997 and 2001 alone(constant 2000 dollars). Indebtednessincreased in only 23 of the 53 Upstatecities between 1997 and 2001, but Buf-falo, Binghamton, Jamestown, andAlbany each added at least $10 millionto their indebtedness between 1997and 2001, tipping the balance. (Buffaloadded over $40 million.) It may makesense for cities to borrow when interestrates are low, but this borrowing obvi-ously carries risks. If activities fundedby the bonds fail to increase cities’ taxbase, future taxpayers will face rateincreases unless New York Stateincreases its aid subventions to cities.
A second sign of Upstate cities’ dis-tress is the growth in vacant housing.In 1980, 7.9 percent of city housingunits were vacant. In 1990, that ratestill stood at 8.0 percent, but by 2000,the drain of people and householdshad caused the vacancy rate to rise to11.5 percent. The problem is espe-cially acute in the nine Upstate citieswhose population exceeded 50,000 in1990, where the cumulative vacancyrate is now approximately 13 percent(Figure 6). Vacancy rates rose in 45 ofUpstate’s 53 cities, and only in the
Hudson Valley region did more thanone city not experience rising vacancyrates. Vacancy rates also rose in 292 of412 villages that existed in both 1990and 2000, but except in villages withfewer than 1,000 residents, vacancyrates are generally lower than those in cities; villages with populationsexceeding 5,000 have comparativelyhealthy cumulative vacancy rates of6.0 percent.
Cities also have much lower homeownership rates than do towns or vil-lages, and these rates have been fallingdespite national trends toward higherhome ownership. For all of UpstateNew York, the home ownership rategrew from 67.0 to 67.7 percent in the1990s. In Upstate cities, however,home ownership fell from 46.8 percentto 45.9 percent. And as a consequenceof weak housing demand, cities’ hous-ing stock is also old. Over half of thehousing units in Upstate cities in 2000had been built before 1940, comparedto only 20 percent of that in towns out-side villages. Village housing is alsoaging, with 46 percent built before1940. Many older housing units havedeteriorated and no longer suit moderntastes, nor are they large enough toaccommodate the household posses-sions of today’s wealthier households.
Behind the Trends: UpstateSprawl is Not Inevitable
Acertain amount of Upstate’ssprawl is the largely unavoid-able result of economic anddemographic forces. First, and
somewhat ironically, slow growth mayactually cause density to drop andsprawl to increase. Slow growthdepresses competition among biddersfor rural land, reducing prices. As aconsequence, businesses and familieswho move to towns can buy largeamounts of land at low prices. Upstatefarmers also face stagnant or collapsingcommodity markets, meaning that theirland often has less value for productiveuse than it did a generation ago.
Additionally, the size of Upstatehouseholds is shrinking as the popula-tion ages, the divorce rate rises, andthe number of people who do notmarry increases. Consequently, whileUpstate’s population stagnated, itstotal number households grew bynearly 5 percent in the 1990s afterincreasing 8.5 percent in the 1980s.
Finally, the Upstate economy hasrestructured dramatically, away from goods-producing and towardsinformation-intensive industries. Theworkplaces of the past are probablyeven more ill-suited than the housingstock of the past to accommodate 21st century uses, especially in regionsdominated by heavy industry; it isoften economically unfeasible to retro-fit old workplaces for new activities,and reconstruction on abandoned sites is hindered by the presence ofhazardous materials.
The explanation of sprawl extendsbeyond demography and economicrestructuring, however—policy has also played a significant role. Six policy areas, particularly, have contributed to increased sprawl,including: fiscal disparities betweencities and towns; fragmented local governance; infrastructure subsidiesthat favor outlying locations andencourage the construction of surplus
October 2003 • The Brookings Institution • Survey Series 7CENTER ON URBAN AND METROPOLITAN POLICY
Figure 6. Upstate village, city vacancy rates up across the board,1990 to 2000
0.0
2.0
4.0
6.0
8.0
10.0
12.0
14.0
<1 1 to 2 2 to 5 >5 <25 25 to 50 50 to100 >100Population in 1990 (thousands)
Percen
t o
f year-ro
un
d d
wellin
gs vacan
t
■ 1990■ 2000
CitiesVillages
housing and business space; disincen-tives against reinvestment in cities;exclusionary zoning in many towns;and limitations on the ability of incor-porated jurisdictions to annex.
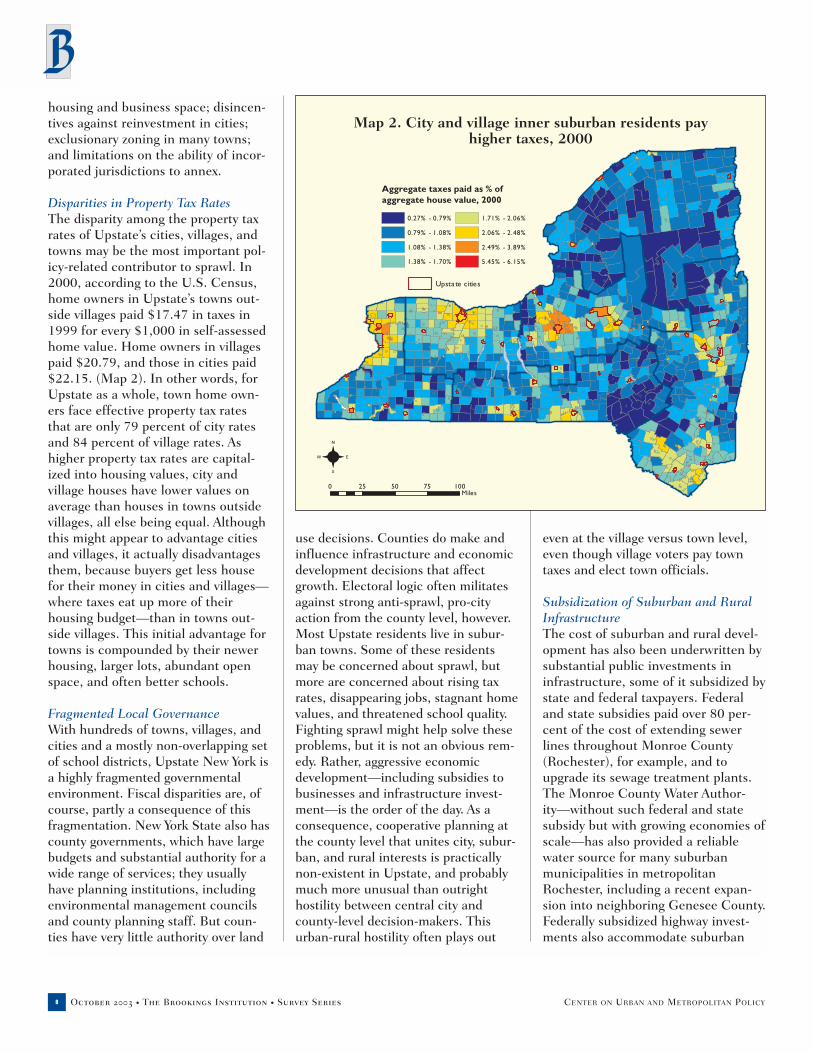
Disparities in Property Tax RatesThe disparity among the property taxrates of Upstate’s cities, villages, andtowns may be the most important pol-icy-related contributor to sprawl. In2000, according to the U.S. Census,home owners in Upstate’s towns out-side villages paid $17.47 in taxes in1999 for every $1,000 in self-assessedhome value. Home owners in villagespaid $20.79, and those in cities paid$22.15. (Map 2). In other words, forUpstate as a whole, town home own-ers face effective property tax ratesthat are only 79 percent of city ratesand 84 percent of village rates. Ashigher property tax rates are capital-ized into housing values, city andvillage houses have lower values onaverage than houses in towns outsidevillages, all else being equal. Althoughthis might appear to advantage citiesand villages, it actually disadvantagesthem, because buyers get less housefor their money in cities and villages—where taxes eat up more of theirhousing budget—than in towns out-side villages. This initial advantage fortowns is compounded by their newerhousing, larger lots, abundant openspace, and often better schools.
Fragmented Local GovernanceWith hundreds of towns, villages, andcities and a mostly non-overlapping setof school districts, Upstate New York isa highly fragmented governmentalenvironment. Fiscal disparities are, ofcourse, partly a consequence of thisfragmentation. New York State also hascounty governments, which have largebudgets and substantial authority for awide range of services; they usuallyhave planning institutions, includingenvironmental management councilsand county planning staff. But coun-ties have very little authority over land
use decisions. Counties do make andinfluence infrastructure and economicdevelopment decisions that affectgrowth. Electoral logic often militatesagainst strong anti-sprawl, pro-cityaction from the county level, however.Most Upstate residents live in subur-ban towns. Some of these residentsmay be concerned about sprawl, butmore are concerned about rising taxrates, disappearing jobs, stagnant homevalues, and threatened school quality.Fighting sprawl might help solve theseproblems, but it is not an obvious rem-edy. Rather, aggressive economicdevelopment—including subsidies tobusinesses and infrastructure invest-ment—is the order of the day. As aconsequence, cooperative planning atthe county level that unites city, subur-ban, and rural interests is practicallynon-existent in Upstate, and probablymuch more unusual than outright hostility between central city andcounty-level decision-makers. Thisurban-rural hostility often plays out
even at the village versus town level,even though village voters pay towntaxes and elect town officials.
Subsidization of Suburban and RuralInfrastructureThe cost of suburban and rural devel-opment has also been underwritten bysubstantial public investments ininfrastructure, some of it subsidized bystate and federal taxpayers. Federaland state subsidies paid over 80 per-cent of the cost of extending sewerlines throughout Monroe County(Rochester), for example, and toupgrade its sewage treatment plants.The Monroe County Water Author-ity—without such federal and statesubsidy but with growing economies ofscale—has also provided a reliablewater source for many suburbanmunicipalities in metropolitanRochester, including a recent expan-sion into neighboring Genesee County.Federally subsidized highway invest-ments also accommodate suburban
October 2003 • The Brookings Institution • Survey Series8 CENTER ON URBAN AND METROPOLITAN POLICY
Map 2. City and village inner suburban residents payhigher taxes, 2000
0 25 50 75 100Miles
Aggregate taxes paid as % ofaggregate house value, 2000
0.27% - 0.79%
0.79% - 1.08%
1.08% - 1.38%
1.38% - 1.70%
1.71% - 2.06%
2.06% - 2.48%
2.49% - 3.89%
5.45% - 6.15%
Upsta te cities

expansion. And the New York StateEmpire Zone program provides taxsubsidies for many developments inrural and suburban locations, oftenencouraging jobs simply to move fromone Upstate location to another.
Partly as a consequence of theseinvestments in infrastructure, housinggrowth outpaced household growth inevery major Upstate region in the1990s. As a whole, Upstate added over168,000 housing units in the 1990s,but only added about 125,000 house-holds. In the Western region, buildersadded 2.6 times more housing unitsthan the net new households in the1990s; in the Central region, nethousing additions were almost doublethe net new households. At the sametime, “dead” malls and vacant housingand office space proliferated in citiesand inner suburbs in every Upstateregion in the 1990s.
Disincentives against Reinvestment in CitiesCities have disadvantages beyond fis-cal disparities with towns. Until thisyear, for example, New York State’sbuilding code often made adaptivereuse and higher-density developmentin cities prohibitively expensive; thenew International Building Code,adopted in the past year, may reducecosts and make reinvestment moreviable. Many city schools and housingunits, furthermore, are contaminatedwith lead paint, which is expensive toremediate as required by federal law.Upstate cities also have higher rates ofcrime and less desirable schools thando suburbs.
Exclusionary ZoningIn some suburban areas, the low-densityland use pattern is exacerbated by large-lot zoning, minimum house sizerequirements (which elevate prospectivehouseholds’ incomes and with it thedemand of the average new family forland), prohibitions on sewer and waterextensions, and other exclusionary poli-cies. Faced with these restrictions,
builders often simply move on to thenext town where they can meet marketdemand, further increasing citizens’demands for road improvements thatfacilitate decentralization.
Obstacles to AnnexationA final contributor to sprawl is thatUpstate’s incorporated jurisdictionsface serious obstacles when they wishto annex land. Cities are practicallyprohibited from annexing, but even vil-lages—which are constituent units oftowns—often face hostile reactionsfrom towns when they wish to expandtheir boundaries. This hostility is espe-cially puzzling, considering thateconomic development in villages ben-efits both the village budget and thetown budget. Compact developmentnear or within villages is arguably lessexpensive than sprawling developmentin towns outside village boundaries.Moreover, the pattern of clearlydefined villages is a feature of theUpstate landscape that many residentsand visitors find special and worthy ofpreservation.
Conclusions and Policy Implications
Despite two decades of ane-mic population growth,Upstate New York hasurbanized hundreds of
thousands of acres of farm and forestland since 1980. This sprawl withoutgrowth has “thinned” every Upstateregion. As noted above, many forceshave caused Upstate’s sprawl, includ-ing government policies that influenceland use and public finance. And ifpolicies helped fuel sprawl, they canalso help tame it. Upstate’s leadersshould examine at least three areas ofpolicy reform: fiscal reform, annexa-tion reform, and planning reform.
A. Leveling the playing field forcities and villages: fiscal reformProperty tax differences between cities,
villages, and towns clearly influencethe location choices of businesses andhome buyers. If the state eases prop-erty tax burdens for city residents andbusinesses, it will reduce sprawl. In thepast, however, the state has offeredproperty tax assistance regardless oflocation; neither the New York StateSchool Tax Relief Program (STAR)(which reduces home owners’ schooltaxes) nor the Empire Zone program(which designates specific areas wherebusinesses receive tax abatements) hasa clear geographic focus. The statecould also increase local governments’fiscal options; Ohio and Pennsylvania,for example, both allow municipalitiesto levy income taxes. New York State’scities and villages would benefit fromsuch an option, especially those thataccommodate large numbers of institu-tions that are exempt from localproperty taxes.
B. Allowing villages and cities toexpand: annexation reformUpstate residents and businesses canonly take advantage of property tax differences, of course, becauseUpstate has so many governmentunits. With 1,366 local governments(cities, villages, towns, and reserva-tions), 511 school districts, 862 otherspecial districts, and 52 counties,Upstate New York has fewer than2,500 persons per unit of local govern-ment. Massachusetts, New Jersey, and Connecticut—all of which adhereat least as fiercely to “home rule” asdoes New York—have more than twiceas many people per government unitas Upstate has. Even Ohio, whose system of townships, municipalities,and counties resembles New York’s,has over 3,000 persons per local government unit.
In this fragmented landscape, busi-nesses and residents can and often doopt to live in towns immediately out-side incorporated boundaries and takeadvantage of many of the services pro-vided by cities and villages. Butincorporated jurisdictions, especially
October 2003 • The Brookings Institution • Survey Series 9CENTER ON URBAN AND METROPOLITAN POLICY

cities, face immense difficulties whenthey wish to annex beyond theirboundaries. Although some villageshave strong enough relationships withtheir towns (of which they constitute aportion), most villages and towns havetense relationships. If annexation werefacilitated for cities and villages, theycould capture more tax base andthereby avoid raising their tax rates asquickly or as much; stable tax rateswould in turn reduce the incentive forother established residents and busi-nesses within cities and villages torelocate to other jurisdictions.
C. Stemming sprawl through localland-use planningPlanning reform would also help stemsprawl. New York has not kept pacewith its neighboring states in updatingits framework for local planning. Ver-mont, Massachusetts, New Jersey, andPennsylvania have all transformedtheir planning laws so that state gov-ernment provides more technicalassistance and “best-practice” guid-ance—and sometimes formal planninggoals—that local governments areencouraged or even required to followwhen they plan. They also commonlyprovide stronger incentives for localplanning, although none of thesestates formally requires municipalitiesto plan or zone. And New Jersey, inparticular, has attempted to link itsstate agencies’ actions to the goals andobjectives that local governmentsincorporate into their plans and regu-lations.
Upstate may not need more plan-ning, and it probably does not need anelaborate “veto” system to preventdevelopment in inefficient, environ-mentally sensitive, and agriculturallyproductive areas. Rather, it needs bet-ter planning, guided by better staterules and wiser state investments ininfrastructure, to encourage growth inthe right places. The thousand-plusUpstate municipalities with zoningordinances often employ their
regulations in ways that reduce home-builders’ ability to provide housing thatlow-income people can afford. Multi-family housing is excluded from ormade economically unfeasible in manyUpstate jurisdictions; manufacturedhousing faces extreme hurdles; andeven small single family homes aresometimes barred by minimum housesize requirements. Even jurisdictionsthat do not intend to exclude develop-ment can hinder it because their plansare out of date, their planning boardslack experience in reviewing andapproving development, they lackinfrastructure capacity to accommo-date new growth, and their residentsresist raising taxes to pay for newroads, sewers, water systems, andschools. Consequently, all new devel-opment is more scattered, and built at lower density, than it would be if growth were accommodated inappropriate places.
Even a combination of fiscal, annex-ation, and planning reforms would noteliminate Upstate sprawl. But it wouldreduce sprawl by improving the com-petitiveness of cities and villages withrespect to rural towns, and by fosteringdevelopment in the right places. Theoutcome would be positive for cities,villages, and towns, with less concen-trated poverty in cities, lower costs forlocal public services, less pressure onrural lands, and less degradation of thehistoric settlement pattern that givesUpstate its attractive character.
Endnotes
1. Rolf Pendall is an associate professor ofcity and regional planning at Cornell University
2. New York State Department of Agricultureand Markets, Farmland Protection Pro-grams; available at www.agmkt.state.ny.us/AP/agservices/farmprotect.html#purchase (May 2003).
3. The principles are: Revitalize our Downtowns and City Centers, PromoteAgriculture and Farmland Protection, Conserve Open Space and Other CriticalEnvironmental Resources, Enhance Trans-portation Choices and Encourage MoreLiveable Neighborhoods, Encourage
Sustainable Development, StrengthenIntergovernmental Partnerships, and HelpCreate, Implement and Sustain the Visionof a Quality Community. See Quality Com-munities Interagency Task Force, “Stateand Local Governments: Partnering for aBetter New York,” (Albany: 2001).
4. The latest, as of mid-2003, is Assembly Bill 802, sponsored by perennial planningadvocate Sam Hoyt, a Buffalo assembly-man. It has no corresponding bill in theSenate, however.
5. Marina Alberti, “Urban Patterns and Envi-ronmental Performance: What Do WeKnow?,” Journal of Planning Education and Research 19, no. 2 (1999); ReidEwing, “Is Los Angeles-Style Sprawl Desir-able?” Journal of the American PlanningAssociation 63, no. 1 (1997).
6. Definition: “a land cover/use category consisting of residential, industrial, commercial, and institutional land; con-struction sites; public administrative sites;railroad yards; cemeteries; airports; golfcourses; sanitary landfills; sewage treat-ment plants; water control structures andspillways; other land used for such pur-poses; small parks (less than ten acres)within urban and built-up areas; and high-ways, railroads, and other transportationfacilities if they are surrounded by urbanareas. Also included are tracts of less thanten acres that do not meet the above defi-nition but are completely surrounded byurban and built-up land” U.S. Departmentof Agriculture, Summary Report, 1997National Resources Inventory available atwww.nhq.nrcs.usda.gov/NRI/1997/summary_report/original/glossary.html(June 2001).
7. U.S. Census Bureau, 1980 to 1989 Popula-tion Estimates of the U.S., States, andCounties ([cited May 19 2003]); availablefrom http://eire.census.gov/popest/archives/county/e8089co.zip, U.S. Census Bureau, Intercensal Estimates ofCounty Population, 1990–2000, availablefrom http://eire.census.gov/popest/data/counties/tables/CO-EST2001-12/CO-EST2001-12-36.php (May 2003).
8. Villages are constituent units of towns;their residents pay town taxes and vote intown elections. The reported populationsof towns therefore include village resi-dents. For this report, we have subtractedvillage totals from town totals to derive a “town outside village” remainder that represents only the population of unincor-porated portions of Upstate towns.
9. ZCTA boundaries do not match withmunicipal boundaries.
10. Some fringe ZCTAs contained smallercities without being centered in thosecities, resulting in low numbers for cityestablishments and employment (e.g.,Newburgh and Middletown). The varyingsize of ZCTAs and their varying relation-ship to cities suggests that the analysis of
October 2003 • The Brookings Institution • Survey Series10 CENTER ON URBAN AND METROPOLITAN POLICY

change between 1994 and 1999 is proba-bly more useful than results on the shareof employment and establishments incities, at the fringe, and outside cities.
11. To the extent that city-based ZIP codes arebeing used by businesses in areas beyondcity limits (especially those that have postoffice boxes), this process may result inoverestimates of city employment andestablishments. If non-city based ZIP codesare being used by businesses within citylimits, of course, this process may result inoverestimates of non-city employment andestablishments.
12. Data for this report are from the U.S.Department of Agriculture’s 1997 NationalResources Inventory (NRI), revised releaseof March 2001; U.S. Census Bureau’sdecennial censuses with interpolated popu-lation estimates by the author; and U.S.Department of Commerce’s County Busi-ness Patterns report on the number ofbusiness establishments.
13. Reid Ewing, Rolf Pendall, and Don Chen,“Measuring Sprawl and Its Impact: TheCharacter and Consequences of Metropoli-tan Expansion, Technical Report,”(Washington: Smart Growth America,2002). The report is available on-line atwww.smartgrowthamerica.org/.
14. Upstate had 419 villages in 1990 and 414in 2000. Seven villages were disincorpo-rated in the 1990s while two were created,both as mergers of formerly separate neigh-boring villages.
15. City ZIP codes are mostly or entirelywithin city limits.
16. Fringe ZIP codes are partly inside, butmostly outside, city limits.
17. Census data on the year of housing con-struction are inexact, especially for renters,who often do not know when the struc-tures in which their housing units arelocated were first constructed.
18. Information on taxes paid is subject tosampling and respondent error, like every-thing else from the long form of the U.S.Census. Census reporting of housing valueis unreliable, but we use it here for indica-tive purposes because it is consistent inarea, respondents, and timing with theCensus’s property tax data.
19. See Rolf Pendall, William W. Goldsmith,and Ann-Margaret Esnard, “ThinningRochester: Yesterday’s Solutions, Today’sUrban Sprawl,” (Cambridge, MA: LincolnInstitute of Land Policy, 2002).
ReferencesAlberti, Marina. “Urban Patterns and Environ-mental Performance: What Do We Know?”Journal of Planning Education and Research 19,no. 2 (1999): 151-63.
Ewing, Reid. “Is Los Angeles-Style Sprawl Desirable?” Journal of the American PlanningAssociation 63, no. 1 (1997): 107-26.
Ewing, Reid, Rolf Pendall, and Don Chen.“Measuring Sprawl and Its Impact: The Character and Consequences of MetropolitanExpansion, Technical Report.” Washington:Smart Growth America, 2002.
New York State Department of Agriculture andMarkets. Farmland Protection Programs [cited5/14 2003]. Available from www.agmkt.state.ny.us/AP/agservices/farmprotect.html#pur-chase.
Pendall, Rolf, William W. Goldsmith, and Ann-Margaret Esnard. “Thinning Rochester:Yesterday’s Solutions, Today’s Urban Sprawl.”Cambridge, MA: Lincoln Institute of Land Policy, 2002.
Quality Communities Interagency Task Force.“State and Local Governments: Partnering for aBetter New York.” Albany, 2001.
U.S. Census Bureau. 1980 to 1989 PopulationEstimates of the U.S., States, and Counties [citedMay 19 2003]. Available from http://eire.census.gov/popest/archives/county/e8089co.zip.
———. Intercensal Estimates of County Popula-tion, 1990–2000 The Bureau, April 11 2003[cited May 19 2003]. Available from http://eire.census.gov/popest/data/counties/tables/CO-EST2001-12/CO-EST2001-12-36.php.
U.S. Department of Agriculture. SummaryReport, 1997 National Resources Inventory[Web page]. December 2000 [cited June 2001].Available from www.nhq.nrcs.usda.gov/NRI/1997/summary_report/original/glossary.html.
October 2003 • The Brookings Institution • Survey Series 1 1CENTER ON URBAN AND METROPOLITAN POLICY
AcknowledgmentsResearch assistance for this series has been provided by Brian Varricchioneand Eun-Nan Kim. The views expressed here are those of the author, not ofCornell University or of the Brookings Institution’s Center on Urban andMetropolitan Policy.
The Brookings Institution Center on Urban and Metropolitan Policy wouldlike to thank the Fannie Mae Foundation for their founding support of thecenter and their continued commitment to our work.
We would also like to thank the John D. and Catherine T. MacArthur Foun-dation and the Heinz Endowments for their general support of our work.Special acknowledgment also goes to the Joyce Foundation for their supportof our analysis on metropolitan trends and policies.
For More Information:Rolf Pendall
Associate Professor of City and Regional PlanningCornell University(607) 255-5561
For General Information:Brookings Institution Center on Urban and Metropolitan Policy
(202) 797-6139www.brookings.edu/urban

About the SeriesUsing data from the U.S. Census of Population and Housing, the RegionalEconomic Information System, County Business Patterns, and the U.S.Department of Agriculture’s National Resources Inventory, this series of fivepublications examines the economic and social health of Upstate New Yorkover the past two decades. The series will focus on trends in Upstate as awhole, in the 11 major metropolitan areas that make up Upstate, and the sixbroad regions (such as Hudson Valley and Rochester/Finger Lakes) that arehome to these metro areas and their surrounding rural counties. The firstreport in the series focused on patterns of population change across Upstate.This survey, the second, looks at urban sprawl in the region, examining landuse trends in Upstate’s metropolitan areas. A third report provides an analysisof the Upstate economy, focusing on the impacts of 30 years of industrialrestructuring on the region. The fourth survey in the series reports onpoverty and inequality in Upstate, which is increasingly concentrated incities. The final report examines the accomplishments of the state’s K-12educational system, and its efforts to prepare Upstate’s future workforce.
The Brookings Institution
1775 Massachusetts Avenue, NW • Washington D.C. 20036-2188Tel: 202-797-6000 • Fax: 202-797-6004
www.brookings.edu
Direct: 202-797-6139 • Fax/direct: 202-797-2965
Center on Urban and Metropolitan Policy